Article

Prolyl Hydroxylase Domain-Containing Protein 3 Gene Expression in Chondrocytes Is Not Essential for Bone Development in Mice

1
Musculoskeletal Disease Center, Jerry L. Pettis VA Medical Center, Loma Linda, CA 92357, USA
2
Departments of Medicine, Loma Linda University, Loma Linda, CA 92354, USA
3
Departments of Biochemistry, Loma Linda University, Loma Linda, CA 92354, USA
4
Departments of Physiology, Loma Linda University, Loma Linda, CA 92354, USA
*
Author to whom correspondence should be addressed.
Cells 2021, 10(9), 2200; https://doi.org/10.3390/cells10092200
Submission received: 2 July 2021 / Revised: 16 August 2021 / Accepted: 20 August 2021 / Published: 26 August 2021
(This article belongs to the Special Issue Cellular and Molecular Regulation of Bone Remodeling)

Abstract

:
We previously showed that conditional disruption of the Phd2 gene in chondrocytes led to a massive increase in long bone trabecular bone mass. Loss of Phd2 gene expression or inhibition of PHD2 activity by a specific inhibitor resulted in a several-fold compensatory increase in Phd3 expression in chondrocytes. To determine if expression of PHD3 plays a role in endochondral bone formation, we conditionally disrupted the Phd3 gene in chondrocytes by crossing Phd3 floxed (Phd3flox/flox) mice with Col2α1-Cre mice. Loss of Phd3 expression in the chondrocytes of Cre+; Phd3flox/flox conditional knockout (cKO) mice was confirmed by real time PCR. At 16 weeks of age, neither body weight nor body length was significantly different in the Phd3 cKO mice compared to Cre; Phd3flox/flox wild-type (WT) mice. Areal BMD measurements of total body as well as femur, tibia, and lumbar skeletal sites were not significantly different between the cKO and WT mice at 16 weeks of age. Micro-CT measurements revealed significant gender differences in the trabecular bone volume adjusted for tissue volume at the secondary spongiosa of the femur and the tibia for both genotypes, but no genotype difference was found for any of the trabecular bone measurements of either the femur or the tibia. Trabecular bone volume of distal femur epiphysis was not different between cKO and WT mice. Histology analyses revealed Phd3 cKO mice exhibited a comparable chondrocyte differentiation and proliferation, as evidenced by no changes in cartilage thickness and area in the cKO mice as compared to WT littermates. Consistent with the in vivo data, lentiviral shRNA-mediated knockdown of Phd3 expression in chondrocytes did not affect the expression of markers of chondrocyte differentiation (Col2, Col10, Acan, Sox9). Our study found that Phd2 but not Phd3 expressed in chondrocytes regulates endochondral bone formation, and the compensatory increase in Phd3 expression in the chondrocytes of Phd2 cKO mice is not the cause for increased trabecular bone mass in Phd2 cKO mice.

1. Introduction

In mammals, all three prolyl hydroxylase domain (PHD) enzymes including PHD1, PHD2 and PHD3 share a highly conserved hydroxylase domain in the catalytic C-terminal regions, whereas the N-terminal regions are more divergent and with no known functions [1]. Both PHD1 and PHD2 contain more than 400 amino acid residues, while PHD3 has less than 250 with a short N-terminal sequence. Recent studies have found that PHDs are negative regulators of the hypoxia-inducible transcription factor (HIF)1α and HIF2α [2,3]. The hydroxylation of specific proline residues (Pro-402 and Pro-564) in the oxygen-dependent degradation domains (ODDs) of the HIF1α by PHDs leads to the targeting of HIF1α for ubiquitination through an E3 ligase complex initiated by the binding of the Von Hipple Lindau protein (pVHL) and subsequent proteasomal degradation [2,3]. It has been known that PHD1 and PHD2 are able to hydroxylates the C-terminal ODD (CODD) but are more active for the N-terminal ODD (NODD) whereas PHD3 almost exclusively hydroxylates the CODD [4,5]. Hydroxylation of HIF1α requires molecular oxygen and iron. Under the hypoxia condition, PHDs are inhibited, and the HIF1α accumulates in the cytoplasm, translocates to the nucleus, interacts with the p300/CBP co-activator. The complex protein then binds to DNA to regulate hypoxia-responsive genes including Vegf, Runx2 and Osterix (Osx) [6,7]. Besides HIF1α involvement in the regulation of angiogenesis and osteogenesis during skeletal development, other reports demonstrated that PHD can hydroxylate other substrates including IKK-β, β2-adrenergic receptor, HIF1α binding protein-suppressor of cytokine signaling (SOCS), and Argonaute (Ago) and can influence their functions in a number of ways [8,9,10,11]. Mice with disruption of Phd1 and Phd3 genes survive normally, but Phd2 knockout (KO) embryos die at mid-gestation stages due to the defects of underdeveloped placenta [12].
PHDs play important roles in bone development and homeostasis. Of the three Phd family members, Phd2 is highly expressed in bone and targeted KO of the Phd2 gene in osteoblasts using Col1α2-Cre results in reduced bone mass in the trabeculae of long bones by downregulating Osx expression [13]. By contrast, PHD2 serves as a negative regulator for endochondral bone formation, as the chondrocyte-specific KO mice displayed a dramatic increase of bone mass in the trabeculae of long bones and spines caused by increased HIF signaling in chondrocytes [14]. The trabecular number and thickness were significantly increased, but trabecular separation was reduced in the Col2α1-Cre directed conditional KO (cKO) mice. Cortical thickness and tissue mineral density at the femoral mid-diaphysis of the cKO mice were also significantly increased. In our studies on the mechanism by which PHD2 regulates chondrocyte differentiation and increased bone formation, we found that loss of PHD2 function in chondrocytes resulted in marked upregulation of Phd3 expression, both in vitro and in vivo. While the expression of Phd1 was not changed, the expression of Phd3 was significantly increased by two-fold in the growth plates of cKO mice. Knockdown of Phd2 expression in primary chondrocytes caused a seven-fold induction of Phd3 expression [14]. To determine if PHD2 effects on trabecular bone formation is in part caused by elevated Phd3 expression, we evaluated the consequence of disruption of the Phd3 gene in chondrocytes on peak bone mass in mice.

2. Materials and Methods

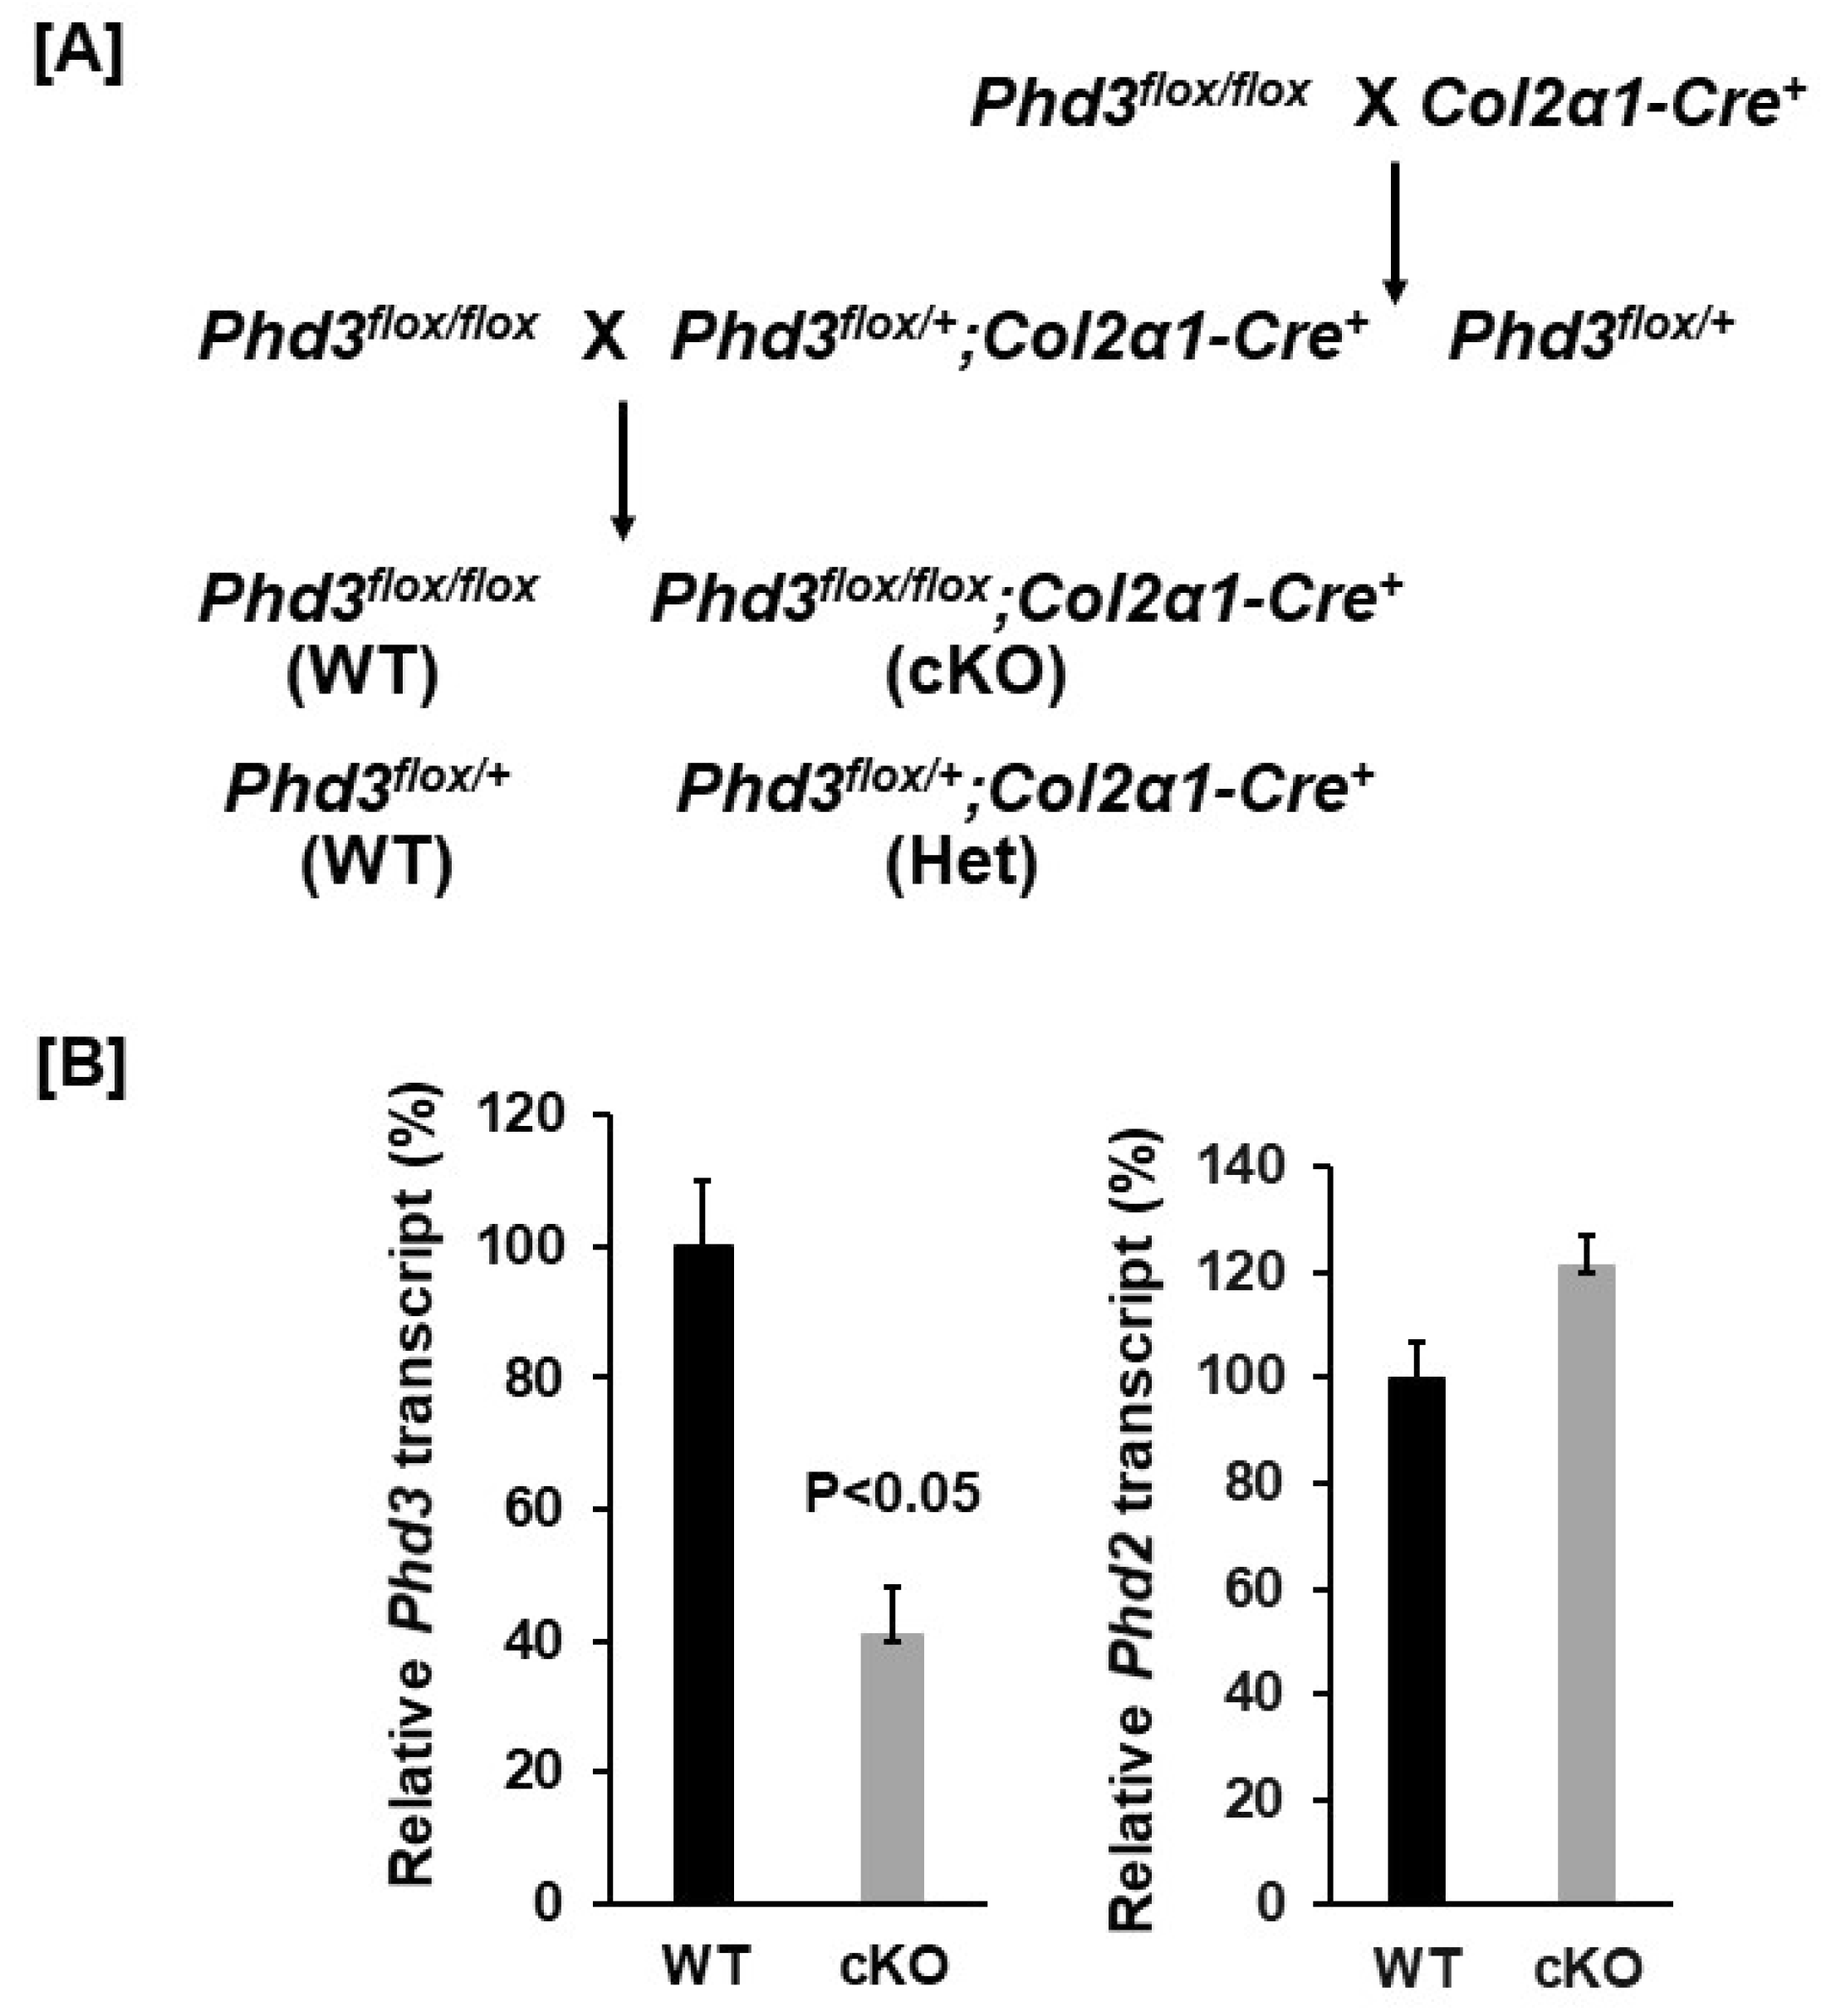
2.1. Generation of Conditional Knockout Mice

Phd3 floxed mice kindly provided by Dr. Guo-Hua Fong (University of Connecticut School of Medicine, Fermington, CT 06032, ME, USA) were first crossed with the Col2α1-Cre transgenic line to generate Cre+; Phd3 loxP heterozygous mice (Phd3flox/+; Col2α1-Cre+) [15,16,17]. The Phd3flox/+; Col2α1-Cre+ mice were then backcrossed with Phd3flox/flox mice to generate Phd3flox/flox; Col2α1-Cre+ cKO mice and Cre; Phd3flox/flox or Phd3flox/+ wild-type (WT) littermates (Figure 1A). The genetic background of these mice is C57BL/6. Both genders were used in the studies. Animals were housed at the Jerry L. Pettis Memorial VA Medical Center (Loma Linda, CA, USA) according to approved standards with controlled temperature (22 °C) and illumination (14 h light, 10 h dark), as well as unlimited food and water. Animal procedures were approved by the Institutional Animal Care and Use Committee of the Jerry L. Pettis Memorial Veterans Affairs Medical Center. Mice were anesthetized with isoflurane prior to the procedures. The animals were euthanized by exposure to carbon dioxide followed by cervical dislocation.

2.2. Antibodies and Biological Reagents

Polyclonal anti-collagen 10 antibody (Cat No: ab58632) was purchased from Abcam (Abcam, MI). MISSION® shRNA Lentiviral Transduction Particles against Phd3 and control non-target were purchased from Sigma. The hairpin sequences of targeting shRNA were below
  • Mouse Phd3-TRCN0000009753:
  • CCGGCGGCTTCTGCTACCTGGACAActcgagTTGTCCAGGTAGCAGAAGCCGTTTTT
  • Non-target:
  • CCGGCAACAAGATGAAGAGCACCAActcgagTTGGTGCTCTTCATCTTGTTGTTTTT

2.3. Evaluation of Bone Phenotypes

Areal bone mineral density (aBMD) and bone area of the total body as well as femur, tibia, and lumbar vertebra (L4–6) of 16-week old mice were measured by the FAXITRON UltraFocusDXA 1000 In Vivo Imaging and DXA Analysis System (FAXITRON Bioptics, LLC, Tucson AZ 85706, USA) under anesthetization according to the manufacturer’s instruction. Trabecular and cortical bones of the femur, and L5 vertebra were analyzed by microcomputed tomography (µCT; VIVA CT40, SCANO Medical) in 16-week old mice as reported previously [18]. The µCT scanning was performed with 55–70 kVp volts (55 kVp for trabecular bone, 70 kVp for cortical bone) and a voxel size of 10.5 micron, and microarchitecture reconstructions were performed using the SCANCO software (SCANO Medical). Multiple sections of 1.05 mm cortical bone in the femoral mid diaphysis were used to analyze long-bone cortical parameters, and the average measurements of the multiple sections were used for data presentation. A 1.89 mm length (180 sections) of the secondary spongiosa of the femurs starting at 0.3675 mm (35 sections) proximal to the growth plate were analyzed for trabecular bone parameters. For the cortical bone, 20 slices were analyzed at the femoral and tibia midshafts. The exact numbers and location of slices used for analyses were adjusted for length so that the analyzed regions were anatomically comparable between samples. To analyze epiphysis formation, the distal femoral epiphyses were used to evaluate the total tissue volume (TV mm3), bone volume (BV, mm3), bone volume fraction (BV/TV, %) as described previously [19,20,21].

2.4. Histology and Immunohistochemistry

Long bones from 16-week old mice were fixed in 10% formalin overnight, washed, dehydrated and embedded in paraffin for sectioning. Cartilage of the distal femur was stained with safranin O and counter-stained with hematoxylin. Articular cartilage width and area of the distal femurs were measured in a blinded fashion with computer software OsteoMeasure (OsteoMetrics, Decatur, GA, USA) [22,23]. Immunohistochemistry was performed using a rabbit immunohistochemistry kit (Vector Laboratories, Burlingame, CA, USA). Briefly, femoral epiphyseal sections were de-paraffinized in HistoChoice clearing agent, rehydrated in a graded series of ethanol and tap water, and treated with 3% H2O2 for 30 min to inactivate endogenous peroxidase activity. The sections were then rinsed with PBS (pH 7.4) and heated for 20 min at 90 °C in sodium citrate citric acid buffer (pH 2.5) for epitope recovery. The sections were pretreated with a blocking solution containing normal goat serum for 20 min, and then incubated with anti-collagen 10 antibody at a dilution of 1:100. Positive and negative control sections were incubated with anti-β-actin (Sigma) and normal rabbit IgG, respectively. After an overnight incubation at 4 °C, the sections were rinsed with PBS, and incubated with biotinylated secondary antibodies for 30 min at room temperature. The slides were then washed in PBS, incubated with the VECTASTAIN ABC-AP kit (Vector Laboratories) for 30 min, rinsed again with PBS, and incubated with the Vector Red substrate until the desired color stain developed.

2.5. Cell Culture

Primary chondrocytes were isolated from the rib cartilage of 2-week old C57BL/6 mice (two pairs of female and male mice) and cultured as previously described [24]. Cells were grown in α-MEM medium containing 10% fetal bovine serum (FBS), penicillin (100 U/mL), and streptomycin (100 μg/mL) to approximately 30% confluence and transduced with shRNA- lentivirus particles at a multiplicity of infection of 10 in the presence of 8 µg/mL of polybrene. The medium was changed 12 h after infection, and the cells were grown for an additional 48 h for RNA extraction.

2.6. RNA Extraction and Real-Time Quantitative Polymerase Chain Reaction

Total RNA was extracted from chondrocytes or distal femur epiphysis with the Trizol reagent as described previously [25,26]. An aliquot of RNA (2 µg) was reverse-transcribed into cDNA in 20 µL volume of reaction by oligo(dT)12–18 primer. A real time PCR contained 0.5 µL template cDNA, 1x SYBR GREEN master mix (Qiagen), and 100 nM of specific forward and reverse primers in a 25 μL volume of reaction. Primers used for real-time PCR are listed in Table 1. Relative gene expression was determined by ΔΔCT method [27].

2.7. Statistical Analysis

Data were analyzed by Student’s t-test or ANOVA as appropriate. Two-sided tests were performed using STATISTICA software (Statsoft, Tulsa, OK, USA). Data are presented as Mean ± SEM (n = 6 per genotype for each gender).

3. Results

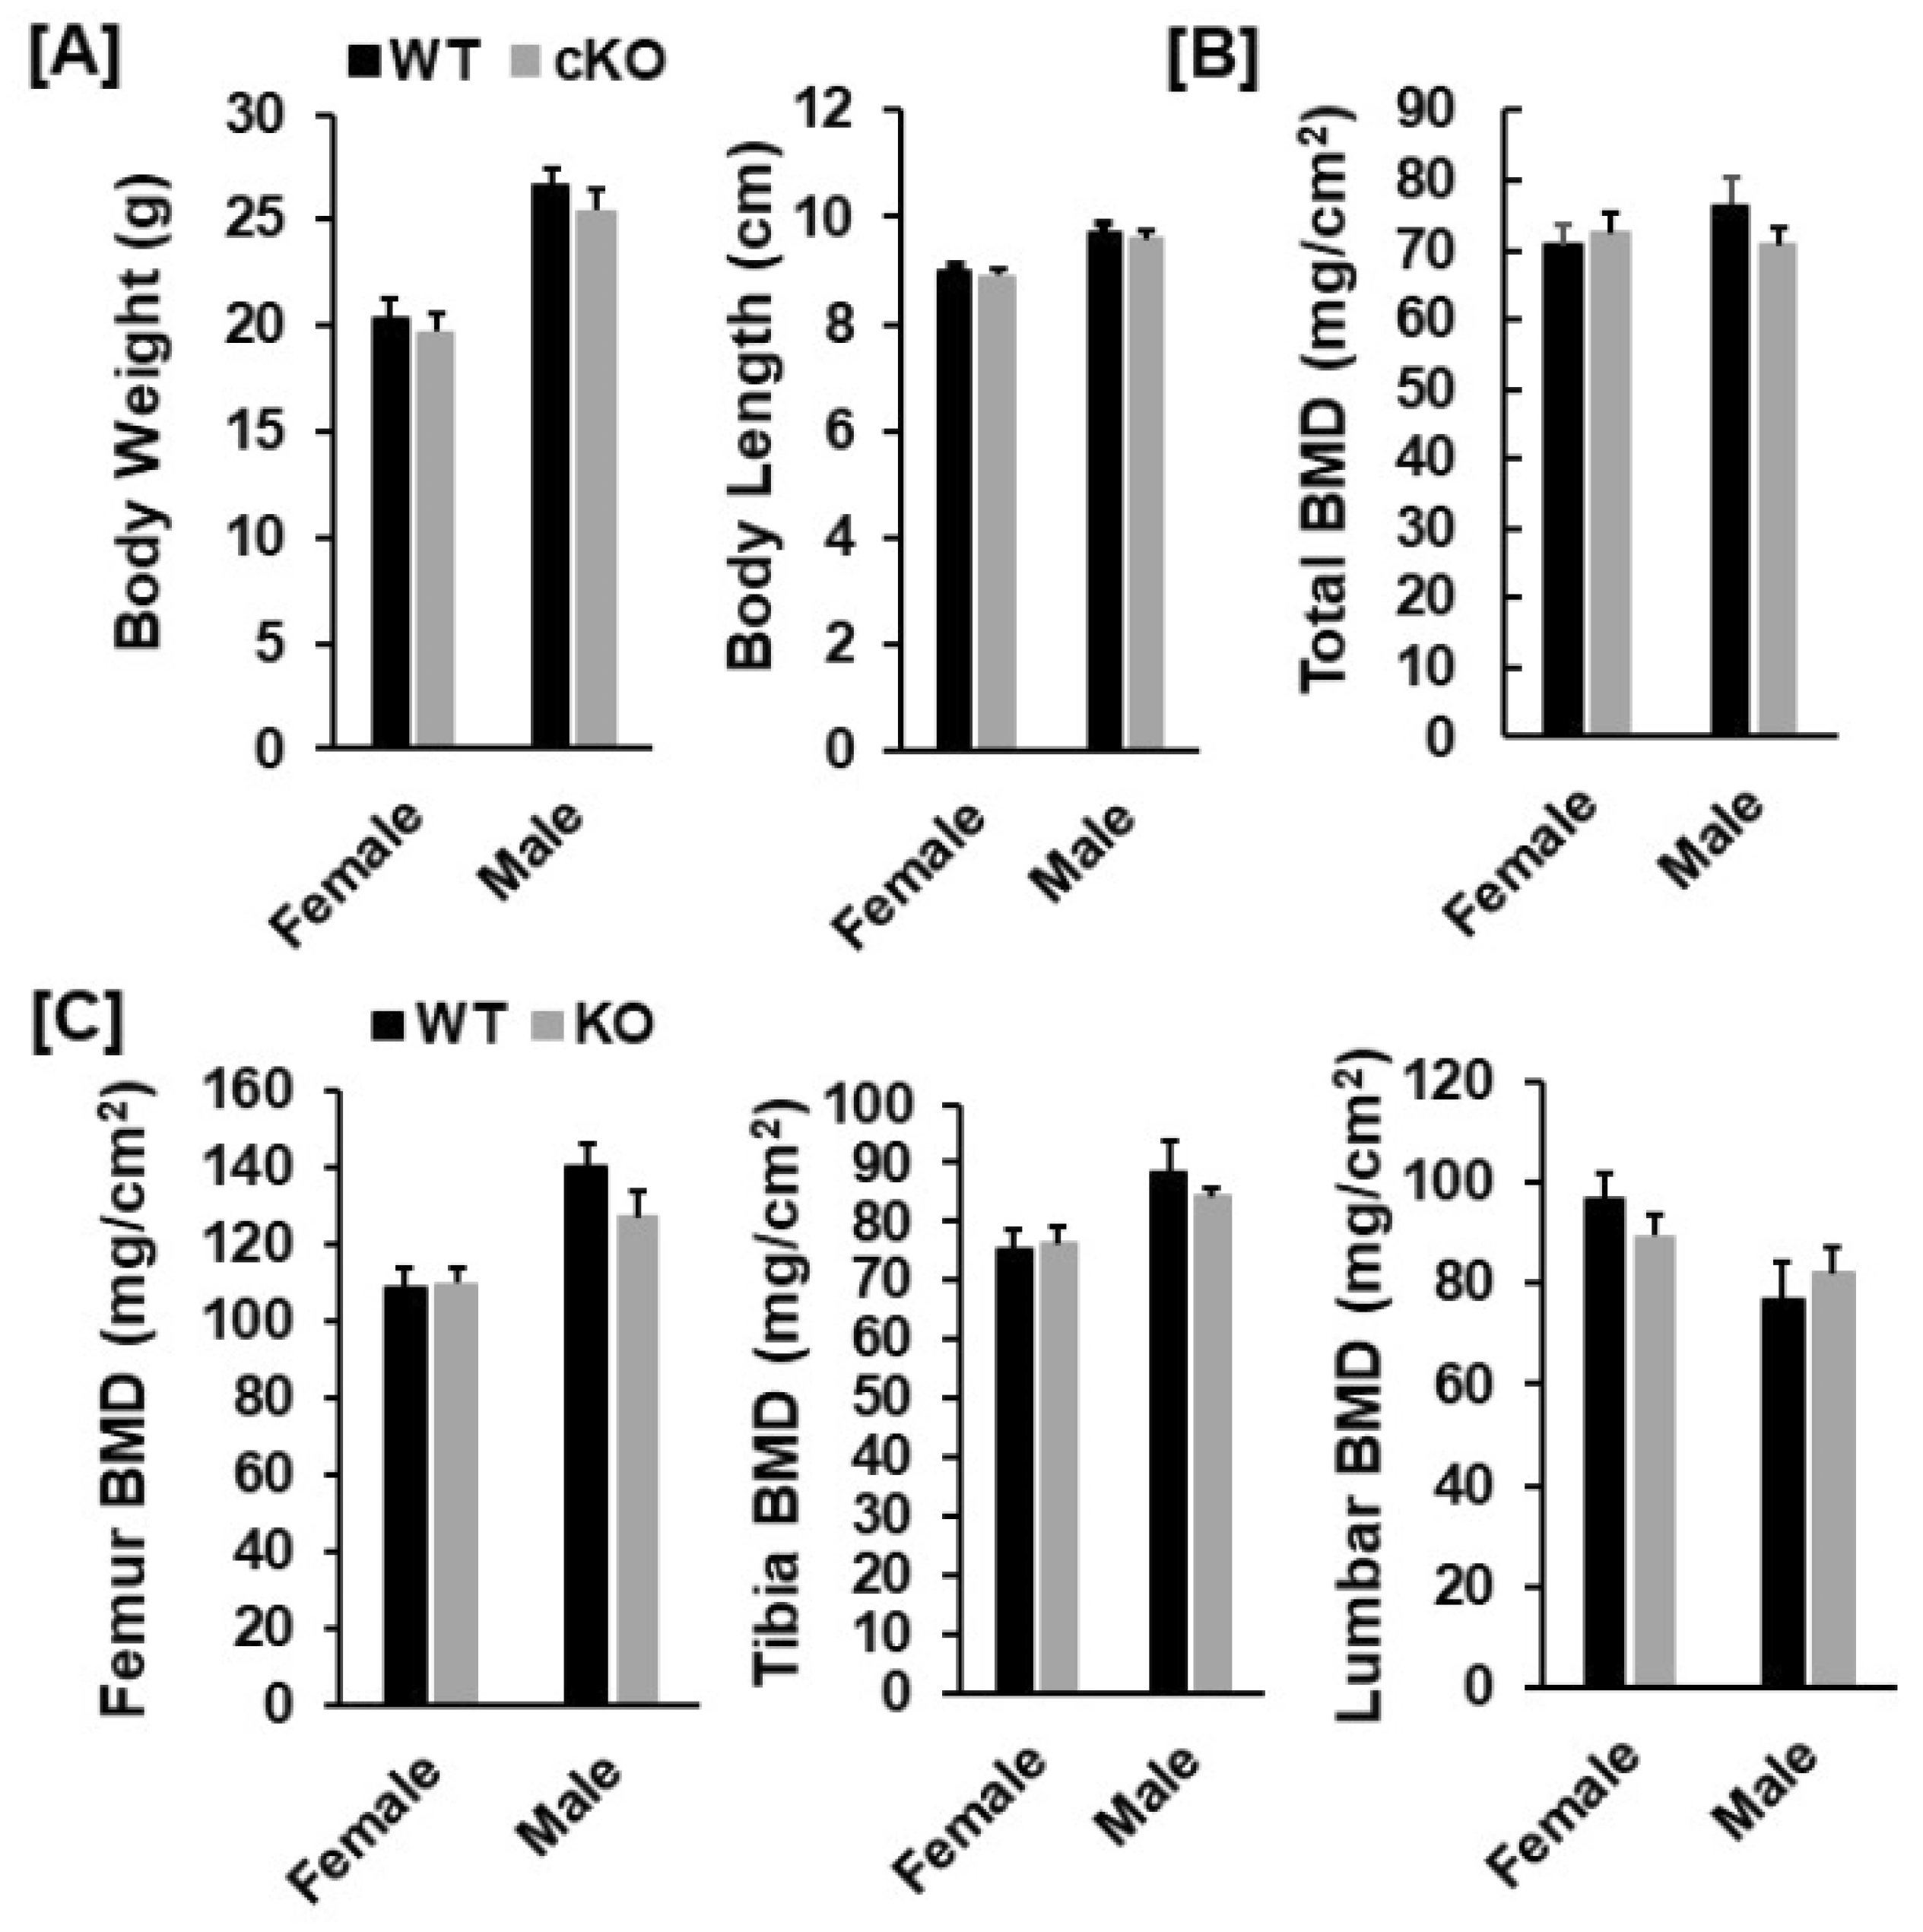
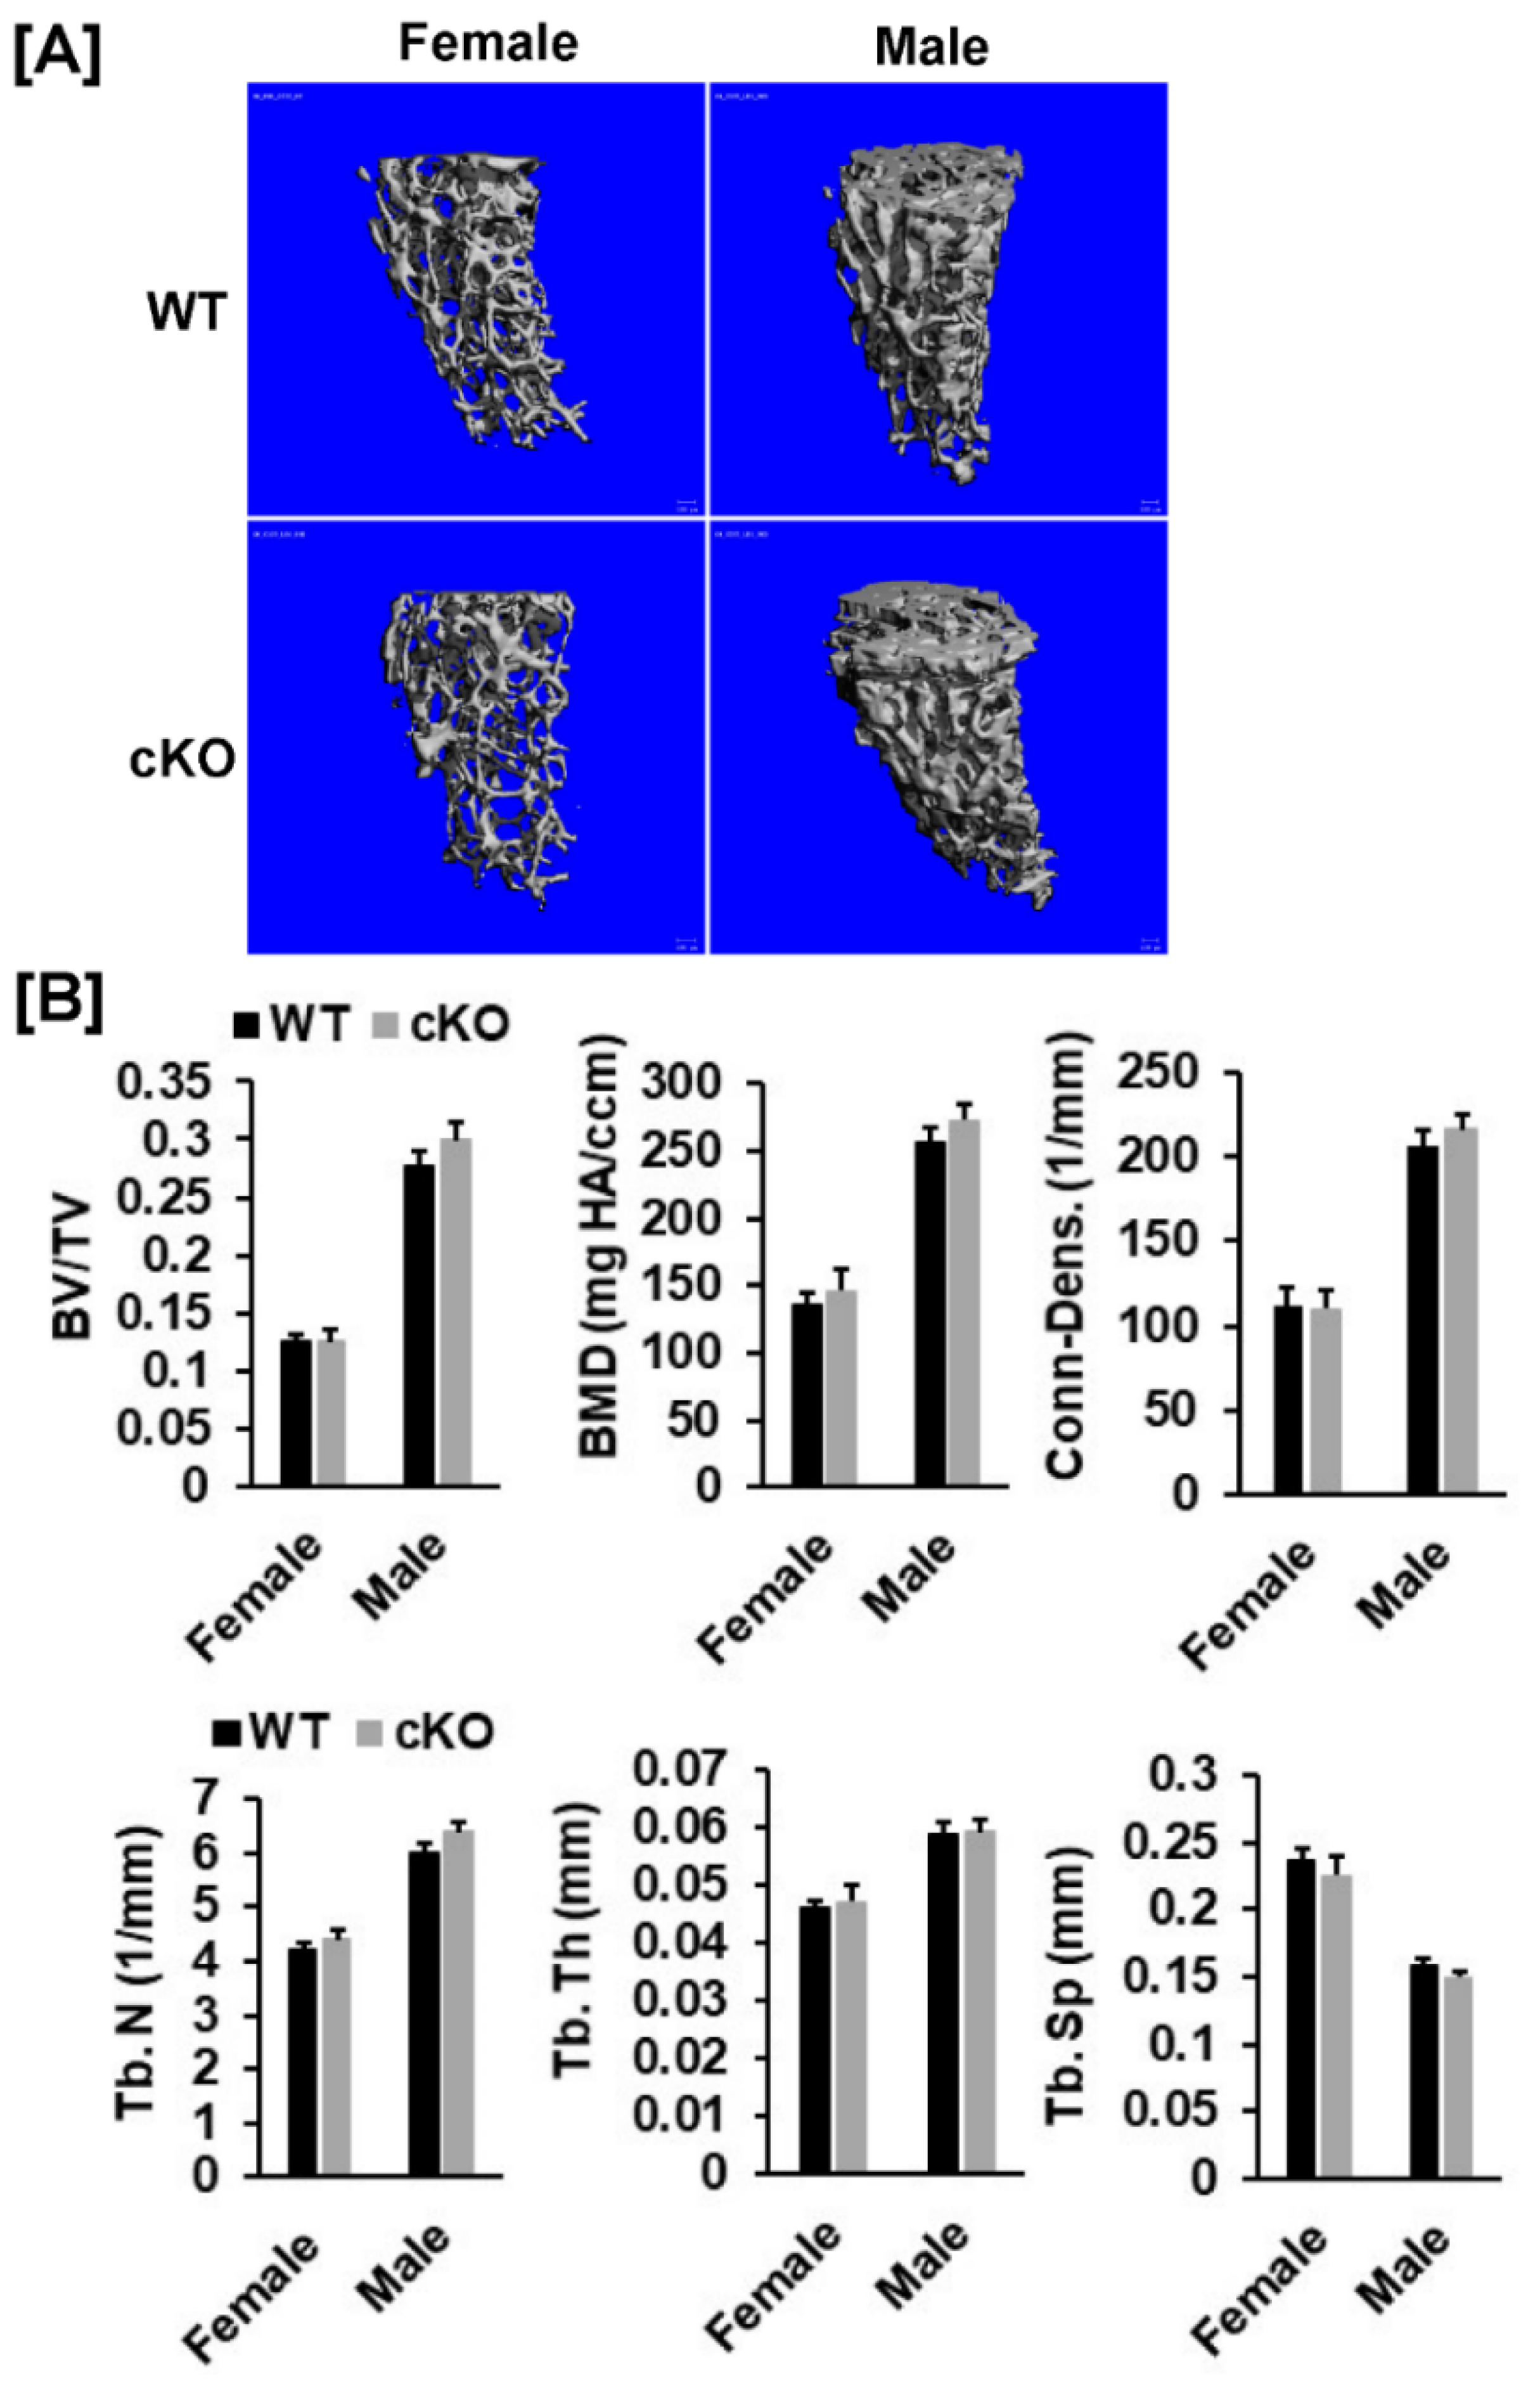
3.1. Conditional Knockout of Phd3 in Col2α1-Expressing Cells Does Not Impair Skeletal Development in Mice

To disrupt the expression of Phd3 in chondrocytes, we generated Phd3 cKO mice by crossing the Phd3flox/flox mice with the Col2α1-Cre transgenic mice, in which the Cre was found to be specifically expressed in Col2α1-expressing cells [14,17]. After two generations of breeding, the Phd3flox/flox; Col2α1-Cre+ cKO mice were generated and compared to Phd3flox/flox or Phd3flox/+; Cre WT littermates. The cKO mice were born alive with the expected Mendelian frequency and grew normally. To test whether Phd3 is disrupted in the bones of cKO mice, total RNA was extracted from the distal femur epiphysis and growth plate region of 16-week old cKO and WT mice and used for real-time PCR with specific primers. Figure 1B shows that the Phd3 mRNA level was reduced by 59% in the cKO mice as compared to the WT control mice. The expression level of Phd2 was not affected in the epiphyses of Phd3 cKO mice. At 16 weeks of age, neither body weight nor body length were significantly different in the cKO mice compared to gender-matched control mice for either females or males (Figure 2A).
Our DXA analyses found that total body, femur, tibia and lumbar BMDs were unchanged in both female and male cKO mice compared to gender-matched control mice (Figure 2B,C). While the BMD of total body, femur, and tibia of male cKO mice were slightly less compared to WT mice, these changes were not statistically significant (p > 0.05). Consistent with DXA data, μCT analyses of the trabecular bone of the femurs from 16-week old mice revealed that neither BV/TV nor any of the trabecular bone parameters including connectivity density (Conn-Dens.), trabecular number (Tb. N), trabecular thickness (Tb. Th) and trabecular spacing (Tb. Sp) in Phd3 cKO mice were significantly different from the gender-matched WT mice for either genders (Figure 3A,B). Disruption of the Phd3 gene in chondrocytes did not affect the cortical BMD or BV/TV of the femurs either (Figure 4A,B). The tibial BV/TV, BMD, Conn-Dens., Tb. N, Tb. Th, and Tb. Sp in cKO mice were comparable to those from WT mice for either genders (Figure 5A). Deficiency of Phd3 expression in chondrocytes had no effect on cortical BV/TV and BMD of the tibia either (Figure 5B).

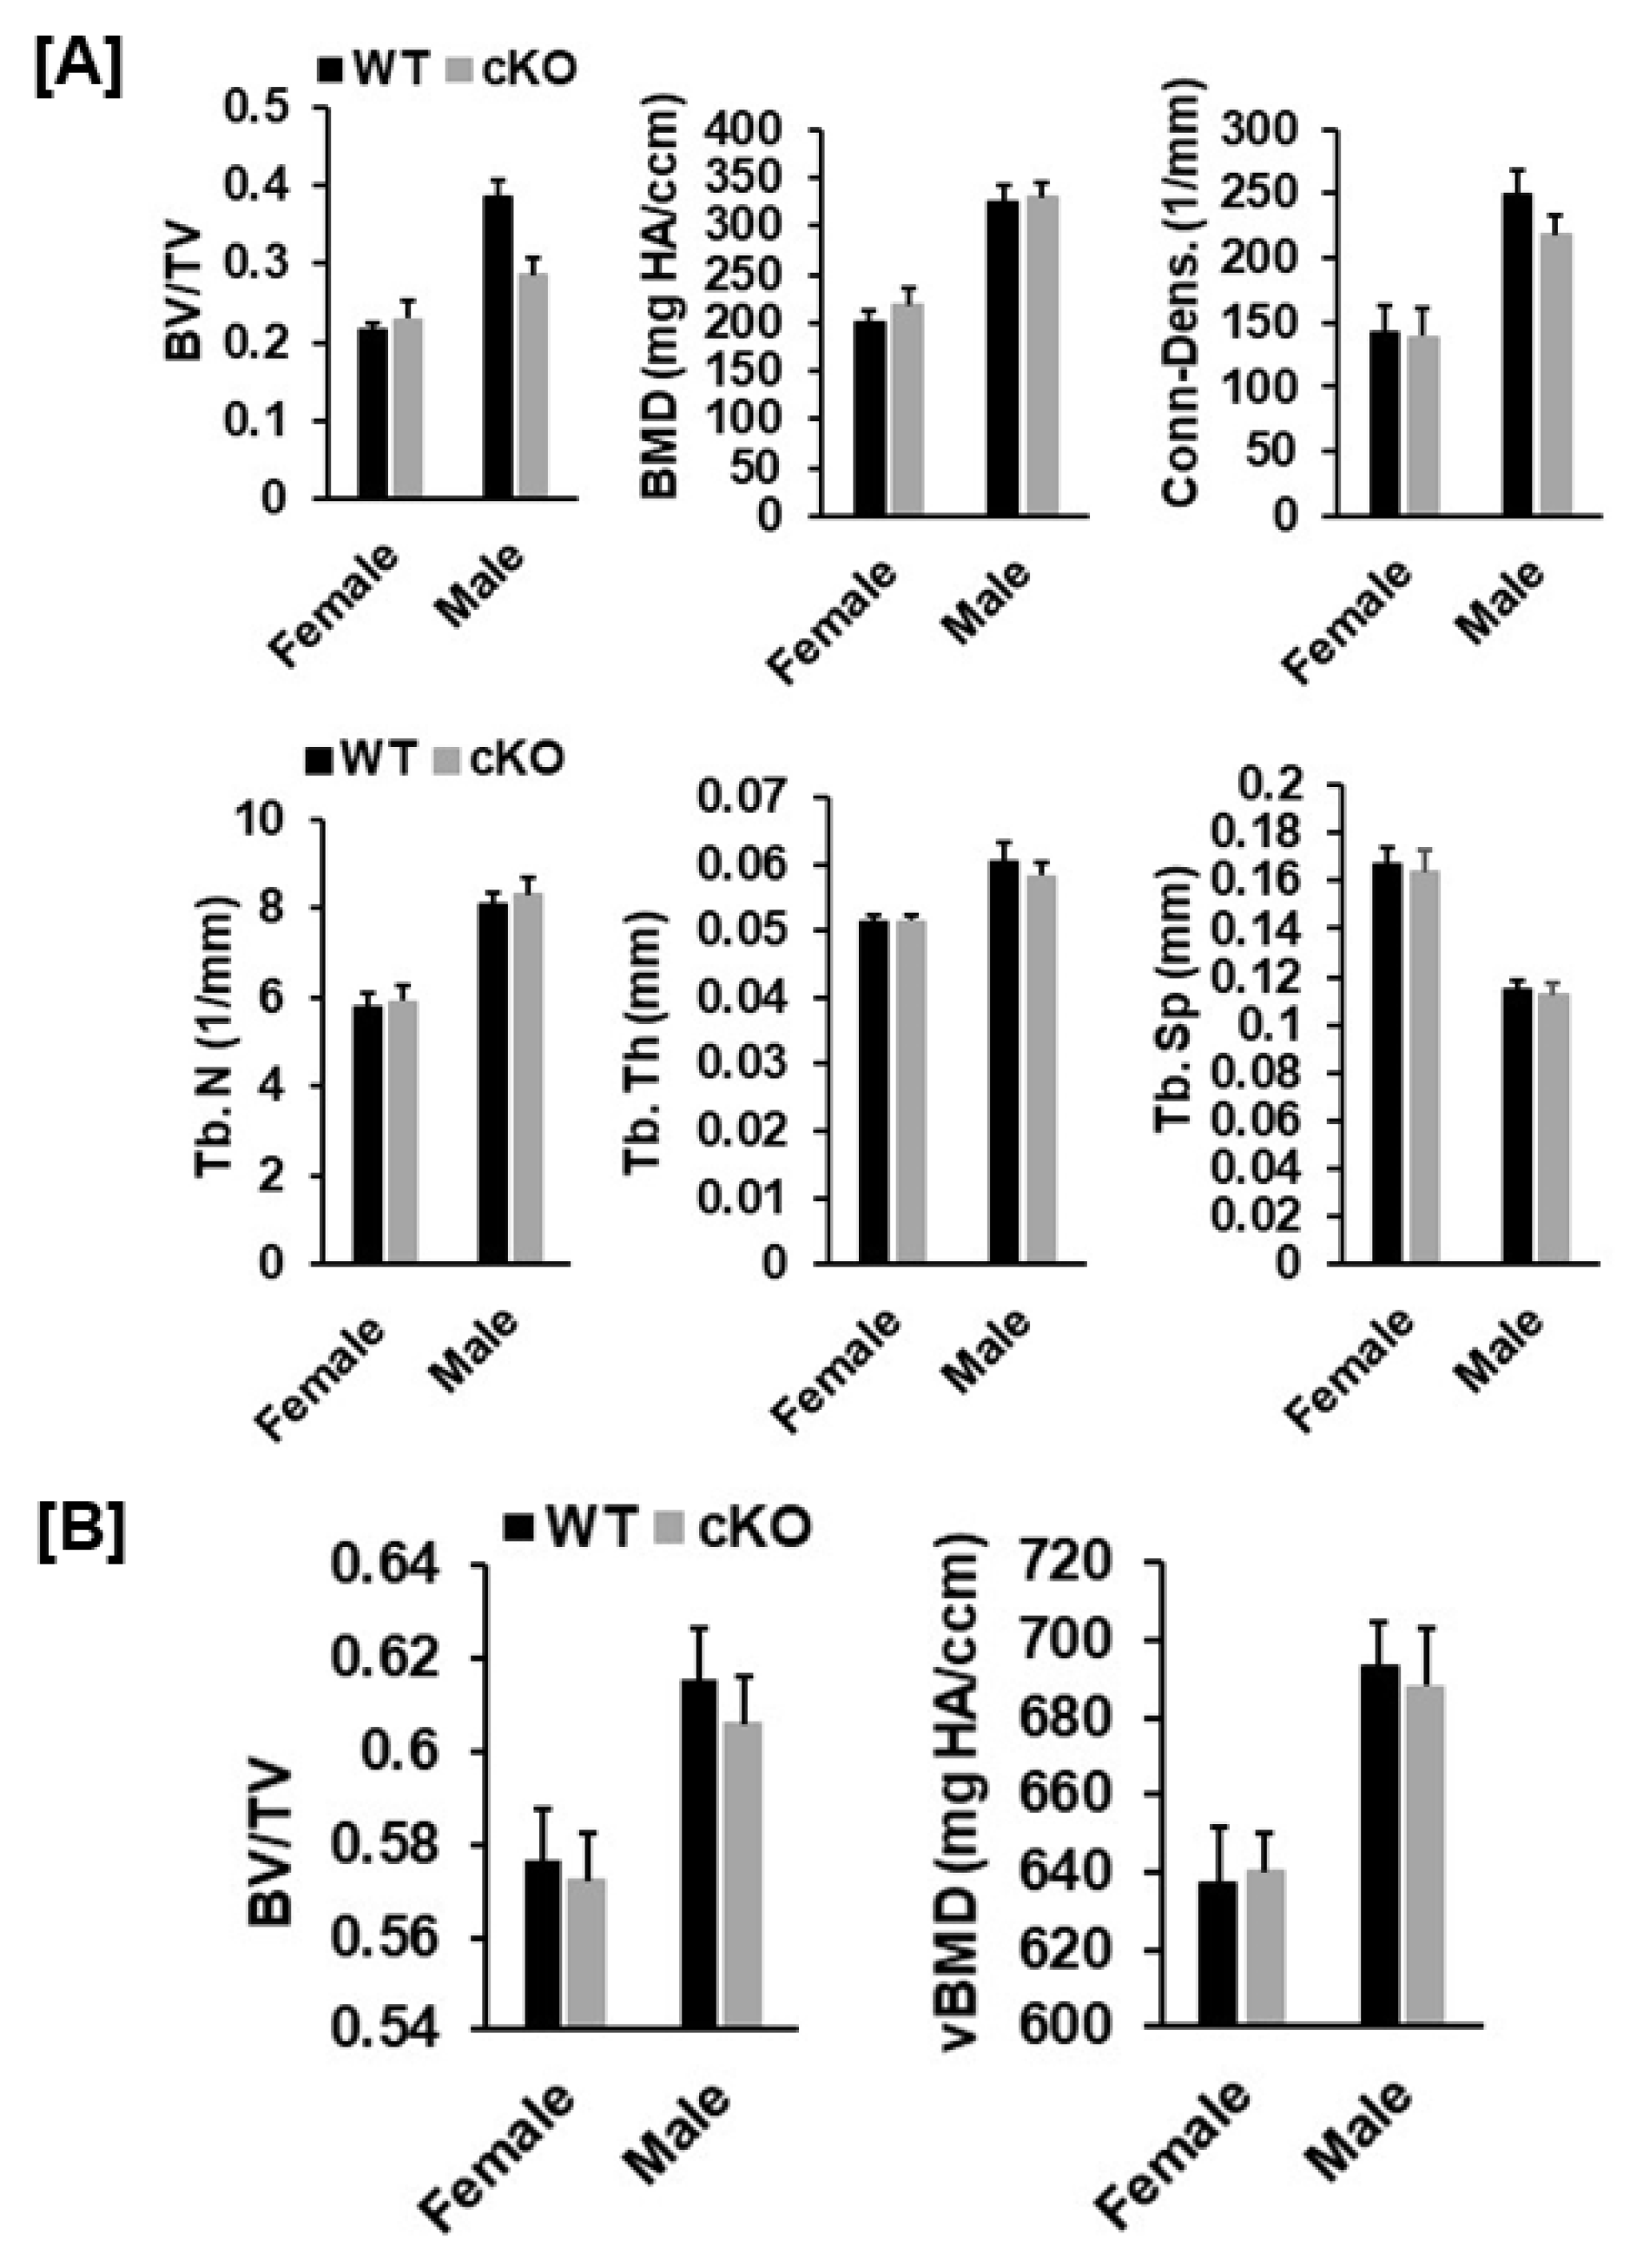
3.2. Disruption of Phd3 Expression in Col2α1-Expressing Cells Does Not Affect Chondrocyte Differentiation and Epiphysis Development in Mice

To investigate whether disruption of the Phd3 gene in Col2α1 expressing cells affects chondrocyte differentiation and epiphysis development and growth in mice, we examined the distal femoral growth plates, which contain mostly chondrocytes that contribute to endochondral bone formation, from the cKO and WT control mice. Our histological analyses found that chondrocyte differentiation was not affected in cKO mice as compared to WT controls. There was no change in the expression level of collagen 10 in the growth plate of cKO mice, as evidenced by immunohistochemistry. The decalcified knee joint sections showed that there were no changes in the width and area of the articular cartilage in the cKO mice as compared to WT mice for both genders (Figure 6A–C). Micro-CT analyses found that there was no difference of BV/TV of the femoral epiphyses between the cKO and WT mice (Figure 6D). To further confirm that disruption of Phd3 expression in chondrocyte has no effect on chondrocyte differentiation, we isolated primary chondrocytes from the ribs of two pairs of two-week old female and male mice, and knocked down the expression of Phd3 in the primary chondrocyte cultures by infecting the cells with lentivirus shRNA against to mouse Phd3 gene or Lentivirus scramble control shRNA. Phd3 mRNA was reduced by 34% (p < 0.01) in the lentivirus-Phd3 shRNA transduced cells (Figure 6E). Expression levels of chondrogenic markers, Col2α1 and aggrecan were not changed between the knockdown cells expressing shRNA against Phd3 and the control chondrocytes expressing scramble shRNA. Expression of chondrocyte differentiation marker Col10 was unchanged in the knockdown chondrocytes. Expression level of transcription factor Sox9 was comparable in the Phd3 knockdown cells as compared to control chondrocytes (Figure 6E).

4. Discussion

Three Phds are widely expressed in different organs at the transcript level. Phd1 is expressed at the highest level in testes, whereas Phd2 is the highest in the heart [28]. At the protein level, however, PHD2 is the most abundant in all mouse organs including bones [29]. In our previous studies, we found that PHD2 was predominantly expressed in osteoblasts and played an important role in regulating bone formation by modulating expression of Osx and bone formation marker genes [13]. Targeted disruption of Phd2 in osteoblasts leads to short stature and premature death at 12 to 14 weeks of age. BMD in femurs and bone volume fraction (BV/TV) in the femoral trabecular bones of cKO mice were significantly decreased. In contrast, mice with conditional disruption of Phd2 in chondrocytes were born normal, but quickly became growth-retarded due to increased cartilage matrix mineralization. The Phd2 cKO mice exhibited increased endochondral bone formation in multiple skeletal sites including long bones and vertebrae [30]. Interestingly, the expression levels of Phd3 were markedly elevated in both growth plate chondrocytes of the chondrocyte-specific Phd2-cKO mice in vivo and in Ad-Cre-mediated knockdown of Phd2 expression primary chondrocytes in vitro. Our observation raised a question as to whether the compensatory increase in PHD3 expression in chondrocytes lacking PHD2 contributes to increased endochondral bone formation observed in the chondrocyte-specific Phd2 cKO mice. To test this possibility, we conditionally disrupted the Phd3 gene in the Col2α1 expressing cells by crossing Phd3 floxed mice with Col2α1-Cre mice. We found that neither body weight nor body length was significantly different in the Phd3 cKO mice compared to Cre; Phd3flox/flox WT mice at 16 weeks of age. Areal BMDs of total body, femur, tibia, and lumbar skeletal sites were not significantly different between the cKO and WT mice either. Micro-CT measurements revealed significant gender differences in the trabecular bone volume adjusted for tissue volume at the secondary spongiosa of the femur and tibia for both genotypes, but no genotype difference was found for any of the trabecular bone measurements of either femur or tibia. There was no change in the bone volume of the epiphysis growth plate of the femur in the cKO mice as compared to the gender-matched WT littermates. In agreement with the µCT data, our histology analyses did not reveal changes in articular cartilage thickness and area. The chondrocytes differentiated normally in the knee joints of the cKO mice. Consistent with the in vivo data, lentiviral shRNA-mediated partial knockdown of Phd3 expression in chondrocytes did not affect expression of markers of chondrocyte differentiation (Col2, Col10, Acan, Sox9). These data as well as the findings from our previous study suggest that Phd2 but not Phd3 expressed in chondrocytes regulates endochondral bone formation, and the compensatory increase in Phd3 expression in the chondrocytes of Phd2 cKO mice is not the cause for increased trabecular bone mass in Phd2 cKO mice [14]. In future, we will confirm the role of PHD2 deficiency induced PHD3 overexpression in chondrocyte differentiation and growth plate development in Phd2/3 double knockout mice. We will also verify the expression levels of the chondrocyte differentiation markers in primary chondrocytes derived from the Phd3 global KO mice.
PHD enzymes catalyze hydroxylation of the specific proline and asparagine residues of their substrates, such as hypoxia-inducible factor (HIF)-α [31]. Both HIF1α and HIF2α contain two sites of prolyl hydroxylation sites (e.g., the NODD and CODD). Prolyl-4 hydroxylation at two sites within a central degradation domain of HIF1α by PHDs, mainly PHD-2, mediates interactions with the VHL E3 ubiquitin ligase complex that targets HIF1α for proteasomal degradation [1,32]. Hydroxylation of an asparaginyl residue in the C-terminal activation domain by PHDs inhibits transcriptional activity by preventing interaction with co-activator, p300/CBP and inactivates HIF1α functions [33]. Recent studies have suggested that there exits PHD substrate specificity and preference. PHD3 was found to hydroxylate CODD but not NODD sequences, while PHD1 and PHD2 hydroxylate both CODD and NODD. PHD1 and PHD3 are more active on HIF2α than HIF1α, whereas PHD2 was more effective on the HIF1α [5]. In agreement with this study, mice with disruption of Phd2 had an accumulation of HIF1α but not HIF2α in the liver and kidneys, whereas mice with deficiency of both PHD1 and PHD3 had hepatic accumulation of HIF2α but not HIF1α [29,34]. On the other hand, conditional disruption of Hif1α in cells of osteoblastic lineage impaired skeletal development [35,36]. These studies indicate that the differential effects on HIF1α versus HIF2α is determined by NODD rather than CODD sequences and hydroxylation. Furthermore, mice with conditional disruption of Hif1α in the condensing mesenchyme had shortened bones, less-mineralized skulls and widened sutures due to massive apoptosis and altered proliferation of chondrocytes in the growth plate [35]. By contrast, mice lacking Hif-2α had only a modest decrease in trabecular bone volume [37]. Because PHD2 is found to be localized in the nucleus, and it influences hydroxylation of methyl cytosine of HIF1a and VEGF promoters, it is possible that PHD2 and PHD3 may epigenetically regulate different promoters of transcription factors that are essential for chondrocyte differentiation [38]. Accordingly, our studies together with others provide evidence that PHD3 is not essential for regulation of HIF1α stability and skeletal development in mice.

Author Contributions

Conceptualization, S.M.; methodology, S.P. and G.A.G.; formal analysis, W.X., S.P. and Y.C.; data curation, W.X., S.P. and G.A.G.; writing—original draft preparation, W.X.; writing—review and editing, W.X. and S.M.; supervision, S.M.; funding acquisition, S.M. All authors have read and agreed to the published version of the manuscript.

Funding

This work was supported by a BLR & D merit review grant, 101 BX1396, from the Department of Veterans Affairs (VA). S.M. is a recipient of Senior Research Career Scientist Award from the VA. All work was performed in facilities provided by the VA.

Institutional Review Board Statement

Animal procedures were performed by a protocol approved by the Institutional Animal Care and Use Committee of the Jerry L. Pettis Memorial Veterans Affairs Medical Center, in accordance with the National Institutes of Health guidelines.

Acknowledgments

The authors thank Catrina Alarcon for her technical assistance.

Conflicts of Interest

The authors declare no conflict of interest.

References

  1. Epstein, A.C.; Gleadle, J.M.; McNeill, L.A.; Hewitson, K.S.; O’Rourke, J.; Mole, D.R. C elegans EGL-9 and mammalian homologs define a family of dioxygenases that regulate HIF by prolyl hydroxylation. Cell 2001, 107, 43–54. [Google Scholar] [CrossRef] [Green Version]
  2. Lando, D.; Peet, D.J.; Whelan, D.A.; Gorman, J.J.; Whitelaw, M.L. Asparagine hydroxylation of the HIF transactivation domain a hypoxic switch. Science 2002, 295, 858–861. [Google Scholar] [CrossRef]
  3. Berra, E.; Ginouves, A.; Pouyssegur, J. The hypoxia-inducible-factor hydroxylases bring fresh air into hypoxia signalling. EMBO Rep. 2006, 7, 41–45. [Google Scholar] [CrossRef] [Green Version]
  4. Villar, D.; Vara-Vega, A.; Landazuri, M.O.; Del Peso, L. Identification of a region on hypoxia-inducible-factor prolyl 4-hydroxylases that determines their specificity for the oxygen degradation domains. Biochem. J. 2007, 408, 231–240. [Google Scholar] [CrossRef] [Green Version]
  5. Appelhoff, R.J.; Tian, Y.M.; Raval, R.R.; Turley, H.; Harris, A.L.; Pugh, C.W. Differential function of the prolyl hydroxylases PHD1, PHD2, and PHD3 in the regulation of hypoxia-inducible factor. J. Biol. Chem. 2004, 279, 38458–38465. [Google Scholar] [CrossRef] [Green Version]
  6. Huang, L.E.; Bunn, H.F. Hypoxia-inducible factor and its biomedical relevance. J. Biol. Chem. 2003, 278, 19575–19578. [Google Scholar] [CrossRef] [Green Version]
  7. Wan, C.; Shao, J.; Gilbert, S.R.; Riddle, R.C.; Long, F.; Johnson, R.S. Role of HIF-1alpha in skeletal development. Ann. N. Y. Acad. Sci. 2010, 1192, 322–326. [Google Scholar] [CrossRef] [Green Version]
  8. Cummins, E.P.; Berra, E.; Comerford, K.M.; Ginouves, A.; Fitzgerald, K.T.; Seeballuck, F. Prolyl hydroxylase-1 negatively regulates IkappaB kinase-beta, giving insight into hypoxia-induced NFkappaB activity. Proc. Natl. Acad. Sci. USA 2006, 103, 18154–18159. [Google Scholar] [CrossRef] [Green Version]
  9. Xie, L.; Xiao, K.; Whalen, E.J.; Forrester, M.T.; Freeman, R.S.; Fong, G. Oxygen-regulated beta(2)-adrenergic receptor hydroxylation by EGLN3 and ubiquitylation by pVHL. Sci. Signal. 2009, 2, ra33. [Google Scholar] [CrossRef] [Green Version]
  10. Ferguson, J.E., III; Wu, Y.; Smith, K.; Charles, P.; Powers, K.; Wang, H. ASB4 is a hydroxylation substrate of FIH and promotes vascular differentiation via an oxygen-dependent mechanism. Mol. Cell. Biol. 2007, 27, 6407–6419. [Google Scholar] [CrossRef] [Green Version]
  11. Qi, H.H.; Ongusaha, P.P.; Myllyharju, J.; Cheng, D.; Pakkanen, O.; Shi, Y. Prolyl 4-hydroxylation regulates Argonaute 2 stability. Nature 2008, 455, 421–424. [Google Scholar] [CrossRef]
  12. Takeda, K.; Ho, V.C.; Takeda, H.; Duan, L.J.; Nagy, A.; Fong, G.H. Placental but not heart defects are associated with elevated hypoxia-inducible factor alpha levels in mice lacking prolyl hydroxylase domain protein 2. Mol. Cell. Biol. 2006, 26, 8336–8346. [Google Scholar] [CrossRef] [Green Version]
  13. Cheng, S.; Xing, W.; Pourteymoor, S.; Mohan, S. Conditional disruption of the prolyl hydroxylase domain-containing protein 2 (Phd2) gene defines its key role in skeletal development. J. Bone Miner. Res. 2014, 29, 2276–2286. [Google Scholar] [CrossRef]
  14. Cheng, S.; Xing, W.; Pourteymoor, S.; Schulte, J.; Mohan, S. Conditional deletion of prolyl hydroxylase domain-containing protein 2 (Phd2) gene reveals its essential role in chondrocyte function and endochondral bone formation. Endocrinology 2015, 1, en20151473. [Google Scholar] [CrossRef] [Green Version]
  15. Duan, L.J.; Takeda, K.; Fong, G.H. Hematological, hepatic, and retinal phenotypes in mice deficient for prolyl hydroxylase domain proteins in the liver. Am. J. Pathol. 2014, 184, 1240–1250. [Google Scholar] [CrossRef] [Green Version]
  16. Minamishima, Y.A.; Moslehi, J.; Bardeesy, N.; Cullen, D.; Bronson, R.T.; Kaelin, W.G., Jr. Somatic inactivation of the PHD2 prolyl hydroxylase causes polycythemia and congestive heart failure. Blood 2008, 111, 3236–3244. [Google Scholar] [CrossRef] [Green Version]
  17. Ovchinnikov, D.A.; Deng, J.M.; Ogunrinu, G.; Behringer, R.R. Col2a1-directed expression of Cre recombinase in differentiating chondrocytes in transgenic mice. Genesis 2000, 26, 145–146. [Google Scholar] [CrossRef]
  18. Xing, W.; Liu, J.; Cheng, S.; Vogel, P.; Mohan, S.; Brommage, R. Targeted disruption of leucine-rich repeat kinase 1 but not leucine-rich repeat kinase 2 in mice causes severe osteopetrosis. J. Bone Miner. Res. 2013, 28, 1962–1974. [Google Scholar] [CrossRef]
  19. Bouxsein, M.L.; Boyd, S.K.; Christiansen, B.A.; Guldberg, R.E.; Jepsen, K.J.; Muller, R. Guidelines for assessment of bone microstructure in rodents using micro-computed tomography. J. Bone Miner. Res. 2010, 25, 1468–1486. [Google Scholar] [CrossRef]
  20. Xing, W.; Pourteymoor, S.; Mohan, S. Ascorbic acid regulates osterix expression in osteoblasts by activation of prolyl hydroxylase and ubiquitination-mediated proteosomal degradation pathway. Physiol. Genom. 2011, 43, 749–757. [Google Scholar] [CrossRef] [Green Version]
  21. Xing, W.; Kim, J.; Wergedal, J.; Chen, S.T.; Mohan, S. Ephrin B1 regulates bone marrow stromal cell differentiation and bone formation by influencing TAZ transactivation via complex formation with NHERF1. Mol. Cell. Biol. 2010, 30, 711–721. [Google Scholar] [CrossRef] [PubMed] [Green Version]
  22. Beamer, W.G.; Donahue, L.R.; Rosen, C.J.; Baylink, D.J. Genetic variability in adult bone density among inbred strains of mice. Bone 1996, 18, 397–403. [Google Scholar] [CrossRef]
  23. Qin, X.; Wergedal, J.E.; Rehage, M.; Tran, K.; Newton, J.; Lam, P. Pregnancy-associated plasma protein-A increases osteoblast proliferation in vitro and bone formation in vivo. Endocrinology 2006, 147, 5653–5661. [Google Scholar] [CrossRef] [Green Version]
  24. Cheng, S.; Xing, W.; Zhou, X.; Mohan, S. Haploinsufficiency of osterix in chondrocytes impairs skeletal growth in mice. Physiol. Genom. 2013, 45, 917–923. [Google Scholar] [CrossRef] [Green Version]
  25. Xing, W.; Singgih, A.; Kapoor, A.; Alarcon, C.M.; Baylink, D.J.; Mohan, S. Nuclear factor-E2-related factor-1 mediates ascorbic acid induction of osterix expression via interaction with antioxidant-responsive element in bone cells. J. Biol. Chem. 2007, 282, 22052–22061. [Google Scholar] [CrossRef] [Green Version]
  26. Xing, W.; Baylink, D.; Kesavan, C.; Hu, Y.; Kapoor, S.; Chadwick, R.B. Global gene expression analysis in the bones reveals involvement of several novel genes and pathways in mediating an anabolic response of mechanical loading in mice. J. Cell. Biochem. 2005, 96, 1049–1060. [Google Scholar] [CrossRef]
  27. Livak, K.J.; Schmittgen, T.D. Analysis of relative gene expression data using real-time quantitative PCR and the 2(-Delta Delta C(T)) Method. Methods 2001, 25, 402–408. [Google Scholar] [CrossRef]
  28. Lieb, M.E.; Menzies, K.; Moschella, M.C.; Ni, R.; Taubman, M.B. Mammalian EGLN genes have distinct patterns of mRNA expression and regulation. Biochem. Cell Biol. 2002, 80, 421–426. [Google Scholar] [CrossRef]
  29. Takeda, K.; Aguila, H.L.; Parikh, N.S.; Li, X.; Lamothe, K.; Duan, L.J. Regulation of adult erythropoiesis by prolyl hydroxylase domain proteins. Blood 2008, 111, 3229–3235. [Google Scholar] [CrossRef] [Green Version]
  30. Laperre, K.F.P.; Van Looveren, R.; Bouillon, R.; Carmeliet, P.; Carmeliet, G. Deletion of the oxygen-sensor PHD2 in chondrocytes results in increased cartilage and bone mineralization. J. Bone Miner. Res. 2008, 1, S44. [Google Scholar]
  31. Fong, G.H.; Takeda, K. Role and regulation of prolyl hydroxylase domain proteins. Cell Death Differ. 2008, 15, 635–641. [Google Scholar] [CrossRef] [Green Version]
  32. Bruick, R.K.; McKnight, S.L. A conserved family of prolyl-4-hydroxylases that modify HIF. Science 2001, 294, 1337–1340. [Google Scholar] [CrossRef] [PubMed] [Green Version]
  33. Metzen, E.; Berchner-Pfannschmidt, U.; Stengel, P.; Marxsen, J.H.; Stolze, I.; Klinger, M. Intracellular localisation of human HIF-1 alpha hydroxylases: Implications for oxygen sensing. J. Cell Sci. 2003, 116, 1319–1326. [Google Scholar] [CrossRef] [Green Version]
  34. Takeda, K.; Cowan, A.; Fong, G.H. Essential role for prolyl hydroxylase domain protein 2 in oxygen homeostasis of the adult vascular system. Circulation 2007, 116, 774–781. [Google Scholar] [CrossRef] [PubMed]
  35. Provot, S.; Zinyk, D.; Gunes, Y.; Kathri, R.; Le, Q.; Kronenberg, H.M. Hif-1alpha regulates differentiation of limb bud mesenchyme and joint development. J. Cell Biol. 2007, 177, 451–464. [Google Scholar] [CrossRef] [PubMed]
  36. Wan, C.; Gilbert, S.R.; Wang, Y.; Cao, X.; Shen, X.; Ramaswamy, G. Activation of the hypoxia-inducible factor-1alpha pathway accelerates bone regeneration. Proc. Natl. Acad. Sci. USA 2008, 105, 686–691. [Google Scholar] [CrossRef] [Green Version]
  37. Shomento, S.H.; Wan, C.; Cao, X.; Faugere, M.C.; Bouxsein, M.L.; Clemens, T.L. Hypoxia-inducible factors 1alpha and 2alpha exert both distinct and overlapping functions in long bone development. J. Cell. Biochem. 2010, 109, 196–204. [Google Scholar] [CrossRef]
  38. Lindsey, R.C.; Cheng, S.; Mohan, S. Vitamin C effects on 5-hydroxymethylcytosine and gene expression in osteoblasts and chondrocytes: Potential involvement of PHD2. PLoS ONE 2019, 14, e0220653. [Google Scholar] [CrossRef] [Green Version]
Figure 1. Generation of chondrocyte specific Phd3 KO mice. (A): A breeding strategy of generation of chondrocyte specific Phd3 cKO mice and control WT mice. (B): Phd3 expression was partially disrupted in the bones of cKO mice. Total RNA was extracted from the distal femur epiphysis and growth plate region of 16-week old cKO and WT female mice and used for real-time PCR (n = 3).
Cells 10 02200 g001
Figure 2. DXA analyses revealed no significant changes in bone parameters in the Phd3 cKO mice at 16 weeks of age. (A): Body weight and body length of the WT and cKO mice, respectively. (B,C): Total body, femur, tibia, and lumbar BMD of the WT and the cKO mice, respectively, measured by DXA.
Cells 10 02200 g002
Figure 3. Micro-CT analysis revealed no changes in trabecular parameters of the femur of the Phd3 cKO mice at 16 weeks of age. (A): Micro-CT images of the trabecular bone of the distal. (B): Quantitative data of trabecular parameters of the femur (BV/TV, BMD, Conn-Dens., Tb. N, Tb. Th, and Tb. Sp).
Cells 10 02200 g003
Figure 4. There were no changes in cortical parameters of the femur of the Phd3 cKO mice at 16 weeks of age. (A): Micro-CT images of the cortical bone of the femur. (B): Quantitative data of cortical BV/TV and BMD of the femur.
Cells 10 02200 g004
Figure 5. Micro-CT analysis revealed no changes in trabecular and cortical parameters of the tibia of the Phd3 cKO mice at 16 weeks of age. (A): Quantitative data of trabecular parameters of the tibia (BV/TV, BMD, Conn-Dens., Tb. N, Tb. Th, and Tb. Sp). (B): Quantitative data of cortical BV/TV and BMD of the tibia.
Cells 10 02200 g005
Figure 6. Knockdown of Phd3 expression did not influence chondrocyte differentiation. (A): Bone sections from the distal femurs of the WT and cKO female mice were stained with safranin red and methyl green. Articular cartilage was stained as red. Bone sections from the distal femurs of the WT and cKO female mice were also immuno-stained with Collagen 10 (Col10) (primary antibody dilution 1:100). Positive Col10-positive chondrocytes in the growth plates were stained as red. (B,C): Quantitative data of articular cartilage width and area of the distal femur. (D): Micro-CT data of the femoral epiphysis. (E): Knockdown of Phd3 expression in chondrocytes did not affect expression of Col2α1, Acan, Col10α1 or Sox9. Primary chondrocytes were transduced with Lentivirus-shRNA against Phd3 or non-specific control Lentivirus shRNA. The transduced cells were differentiated for 3 days, followed by RNA extraction for real time PCR. Data normalized to chondrocytes transduced with control lentiviral shRNA particles. A = p < 0.05 vs. control shRNA (n = 4).
Cells 10 02200 g006
Table 1. Primer sequences used for real time PCR.
GeneForward PrimerReverse Primer
Ppia5′-CCATGGCAAATGCTGGACCA5′-TCCTGGACCCAAAACGCTCC
Phd3
Phd2
5′-GGGACGCCAAGTTACACGGA
5′-GAAGCTGGGCAACTACAGGA
5′-GGGCTCCACGTCTGCTACAA
5′-CATGTCACGCATCTTCCATC
Col25′-TGGCTTCCACTTCAGCTATG5′-AGGTAGGCGATGCTGTTCTT
Col105′-ACGGCACGCCTACGATGT5′-CCATGATTGCACTCCCTGAA
Acan5′-GACCAGGAAGGGAGGAGTAG5′-CAGCCGAGAAATGACACC
Sox95′-CGGAGGAAGTCGGTGAAGA5′-GTCGGTTTTGGGAGTGGTG
Publisher’s Note: MDPI stays neutral with regard to jurisdictional claims in published maps and institutional affiliations.

