
High-Density EEG in a Charles Bonnet Syndrome Patient during and without Visual Hallucinations: A Case-Report Study

 ,
, 
Abstract
1. Introduction
2. Materials and Methods
2.1. Case Report
2.2. Procedure
2.3. EEG Pre-Processing
2.4. Spectral and Connectivity Analyses
2.5. Graph Analysis
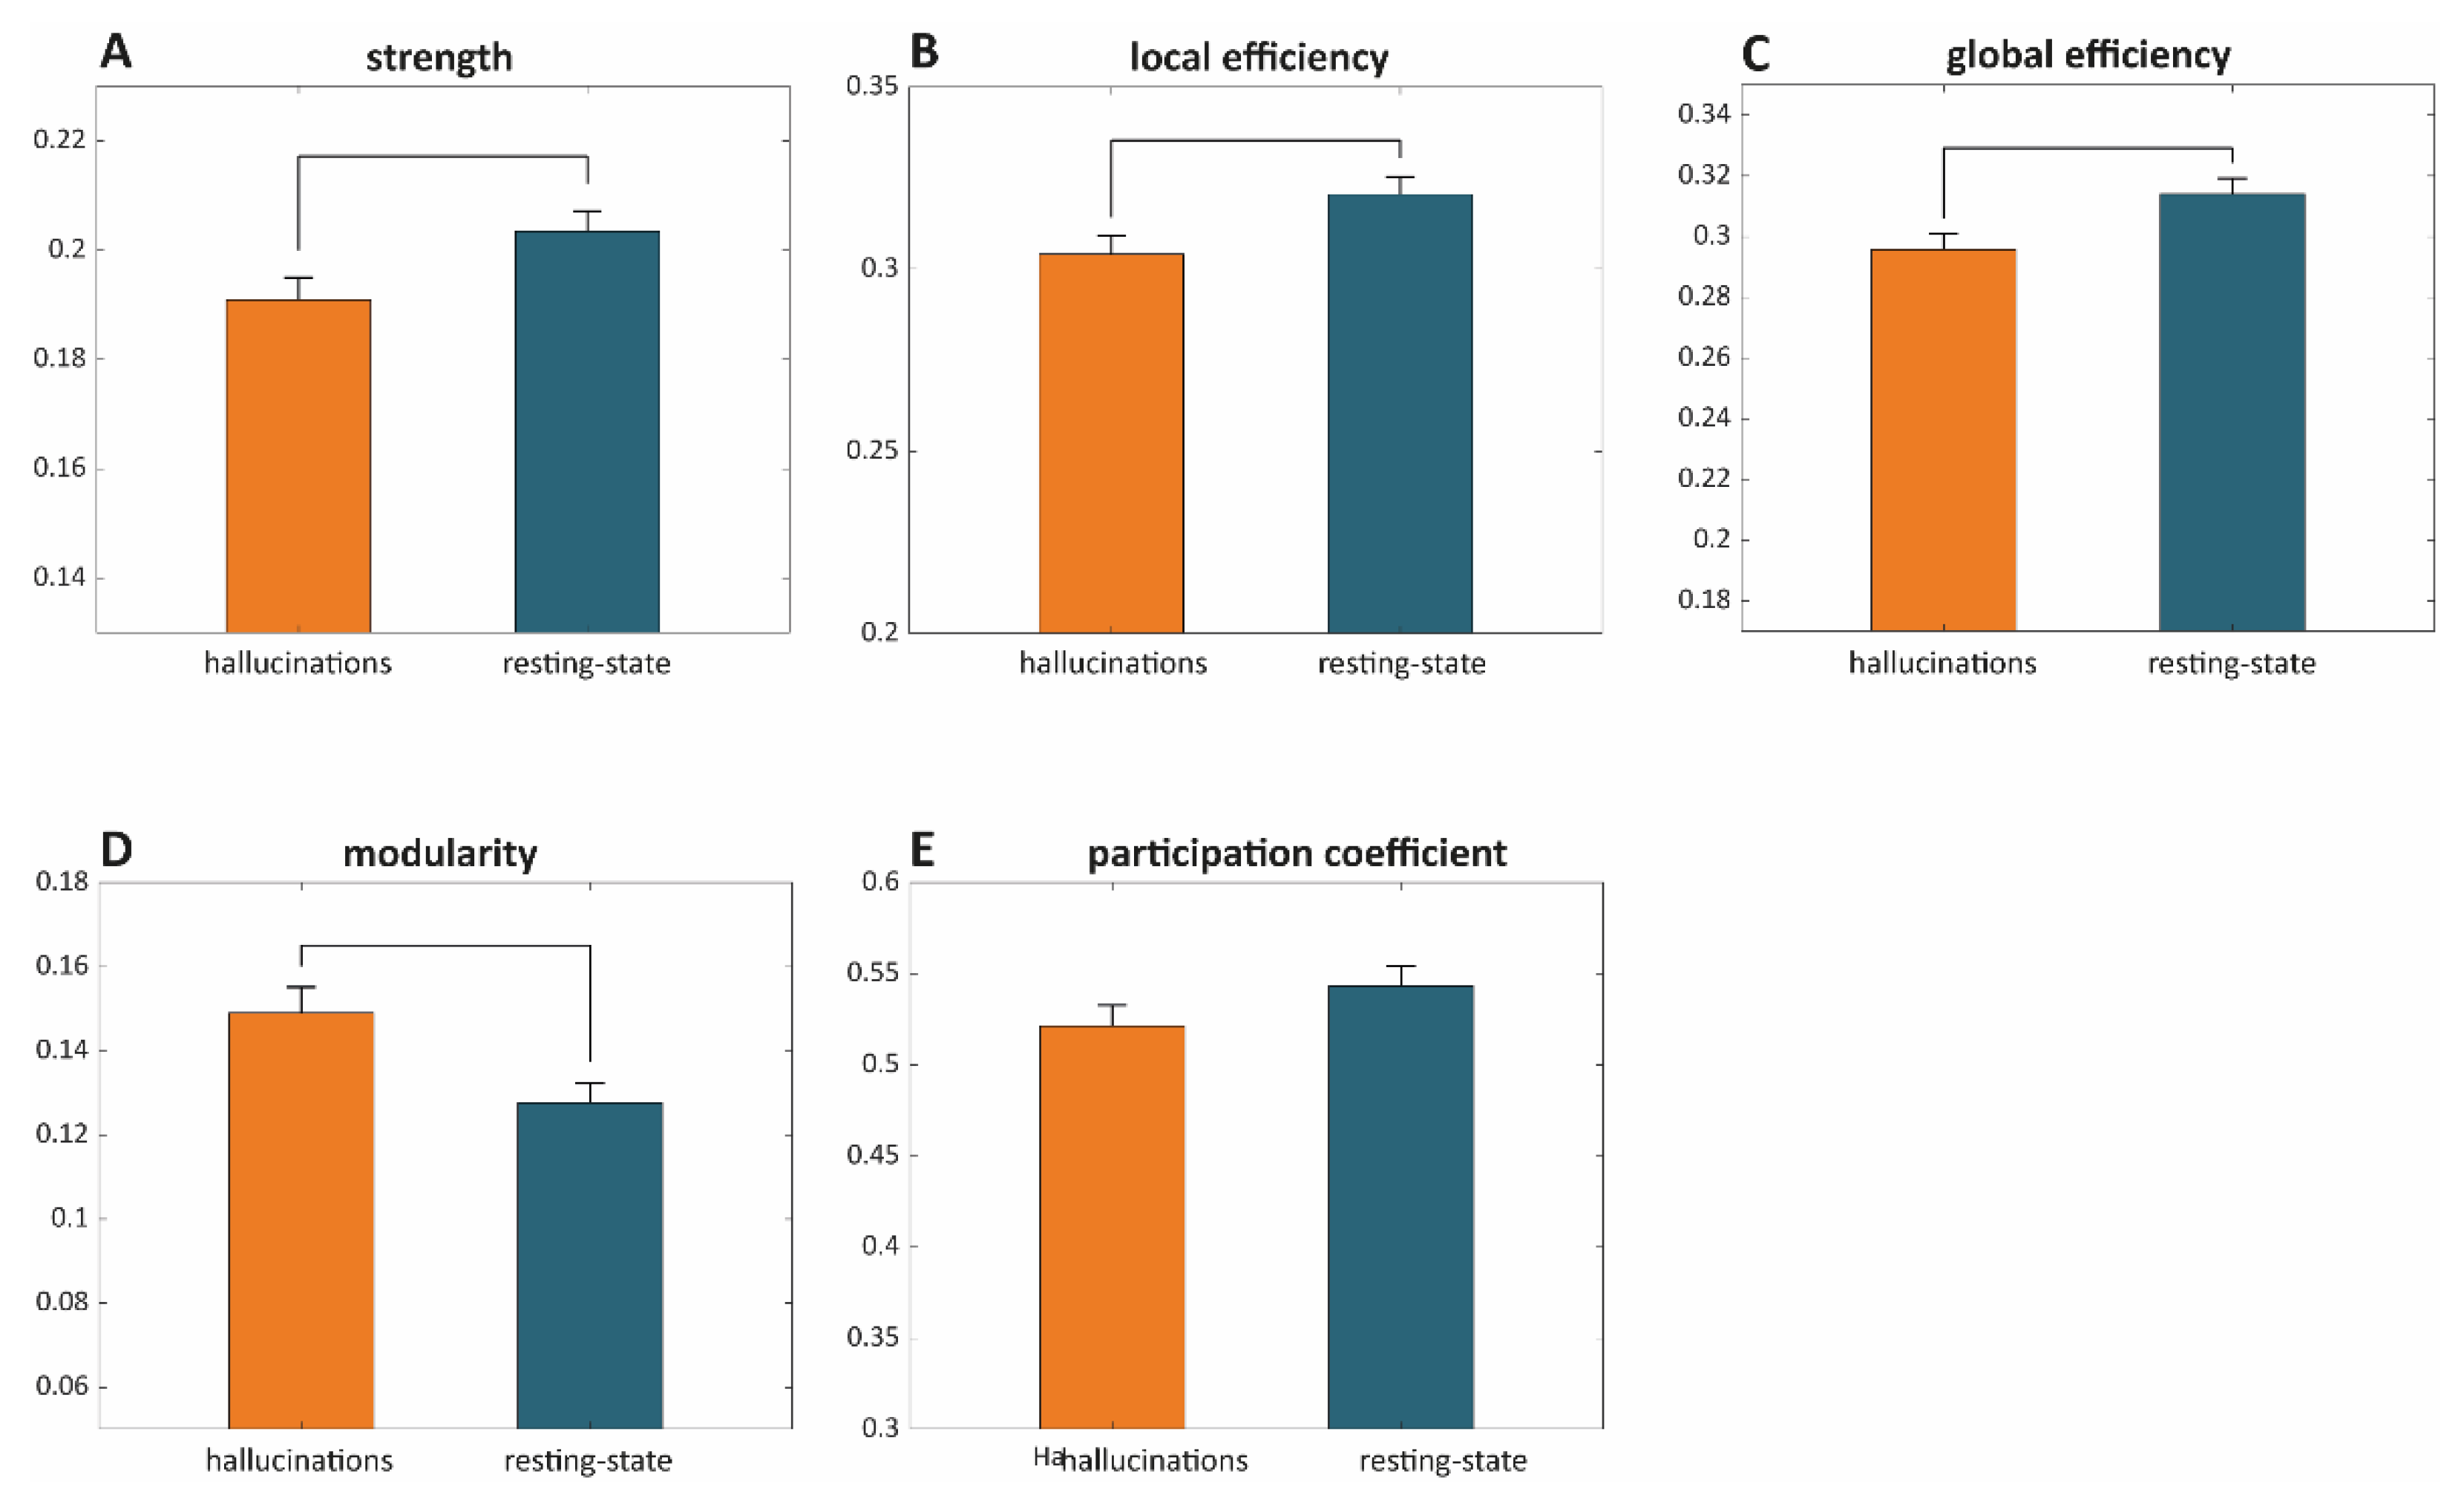
- Strength: The strength of a node is defined as the sum of its edges. The mean graph strength is, thus, estimated as the average over nodal strengths.
- Local efficiency provides a measure of the degree of information integration between the immediate neighbors of a given network node. The mean local efficiency thus reflects the degree of local connectivity within a graph [30].
- Global efficiency provides a measure of network integration and is defined as the average inverse shortest path length [30].
- Modular structure and modularity: The modular structure of a graph is estimated by subdividing the network into groups of nodes (maximizing the number of within-group links and minimizing the number of between-group links). Modularity indicates the degree of reliability of a given modular structure [31].
- Participation coefficient provides an estimate of the degree to which an included node of a given module is linked with other modules. Nodes with a high participation coefficient promote inter-modular integration and, as such, a network with a high participation coefficient is likely to also be globally interconnected.
2.6. Lempel–Ziv Complexity
- The average signal value (over the single epoch) was estimated and subtracted from the signal’s original time series (sje); the resulting signal was then linearly detrended (sje*). Note that j identifies the jth channel and e the eth epoch.
- The analytic signal of sje* was estimated using the Hilbert transform.
- The binarization threshold (thje) for each channel and epoch was obtained as the average over the epoch of the analytic signal absolute value.
- For each band, the EEG signal at each electrode and epoch (sje) was binarized based on the estimated threshold (thje). If sjek ≥ thje, sbjek = 1, otherwise sbjek = 0. Note that k identifies the kth time sample, and sb is the resulting binarized signal.
2.7. Statistical Procedures
2.7.1. Spectral Power, Lempel–Ziv Complexity and Classical Connectivity Analyses
2.7.2. Graph Metrics
3. Results
3.1. Neuropsychological Examination
3.2. Ophthalmological Examination
3.3. Neurological Examination
3.4. EEG
3.4.1. Content of the Visual Hallucinations Experienced during the VH Condition
3.4.2. EEG Analyses
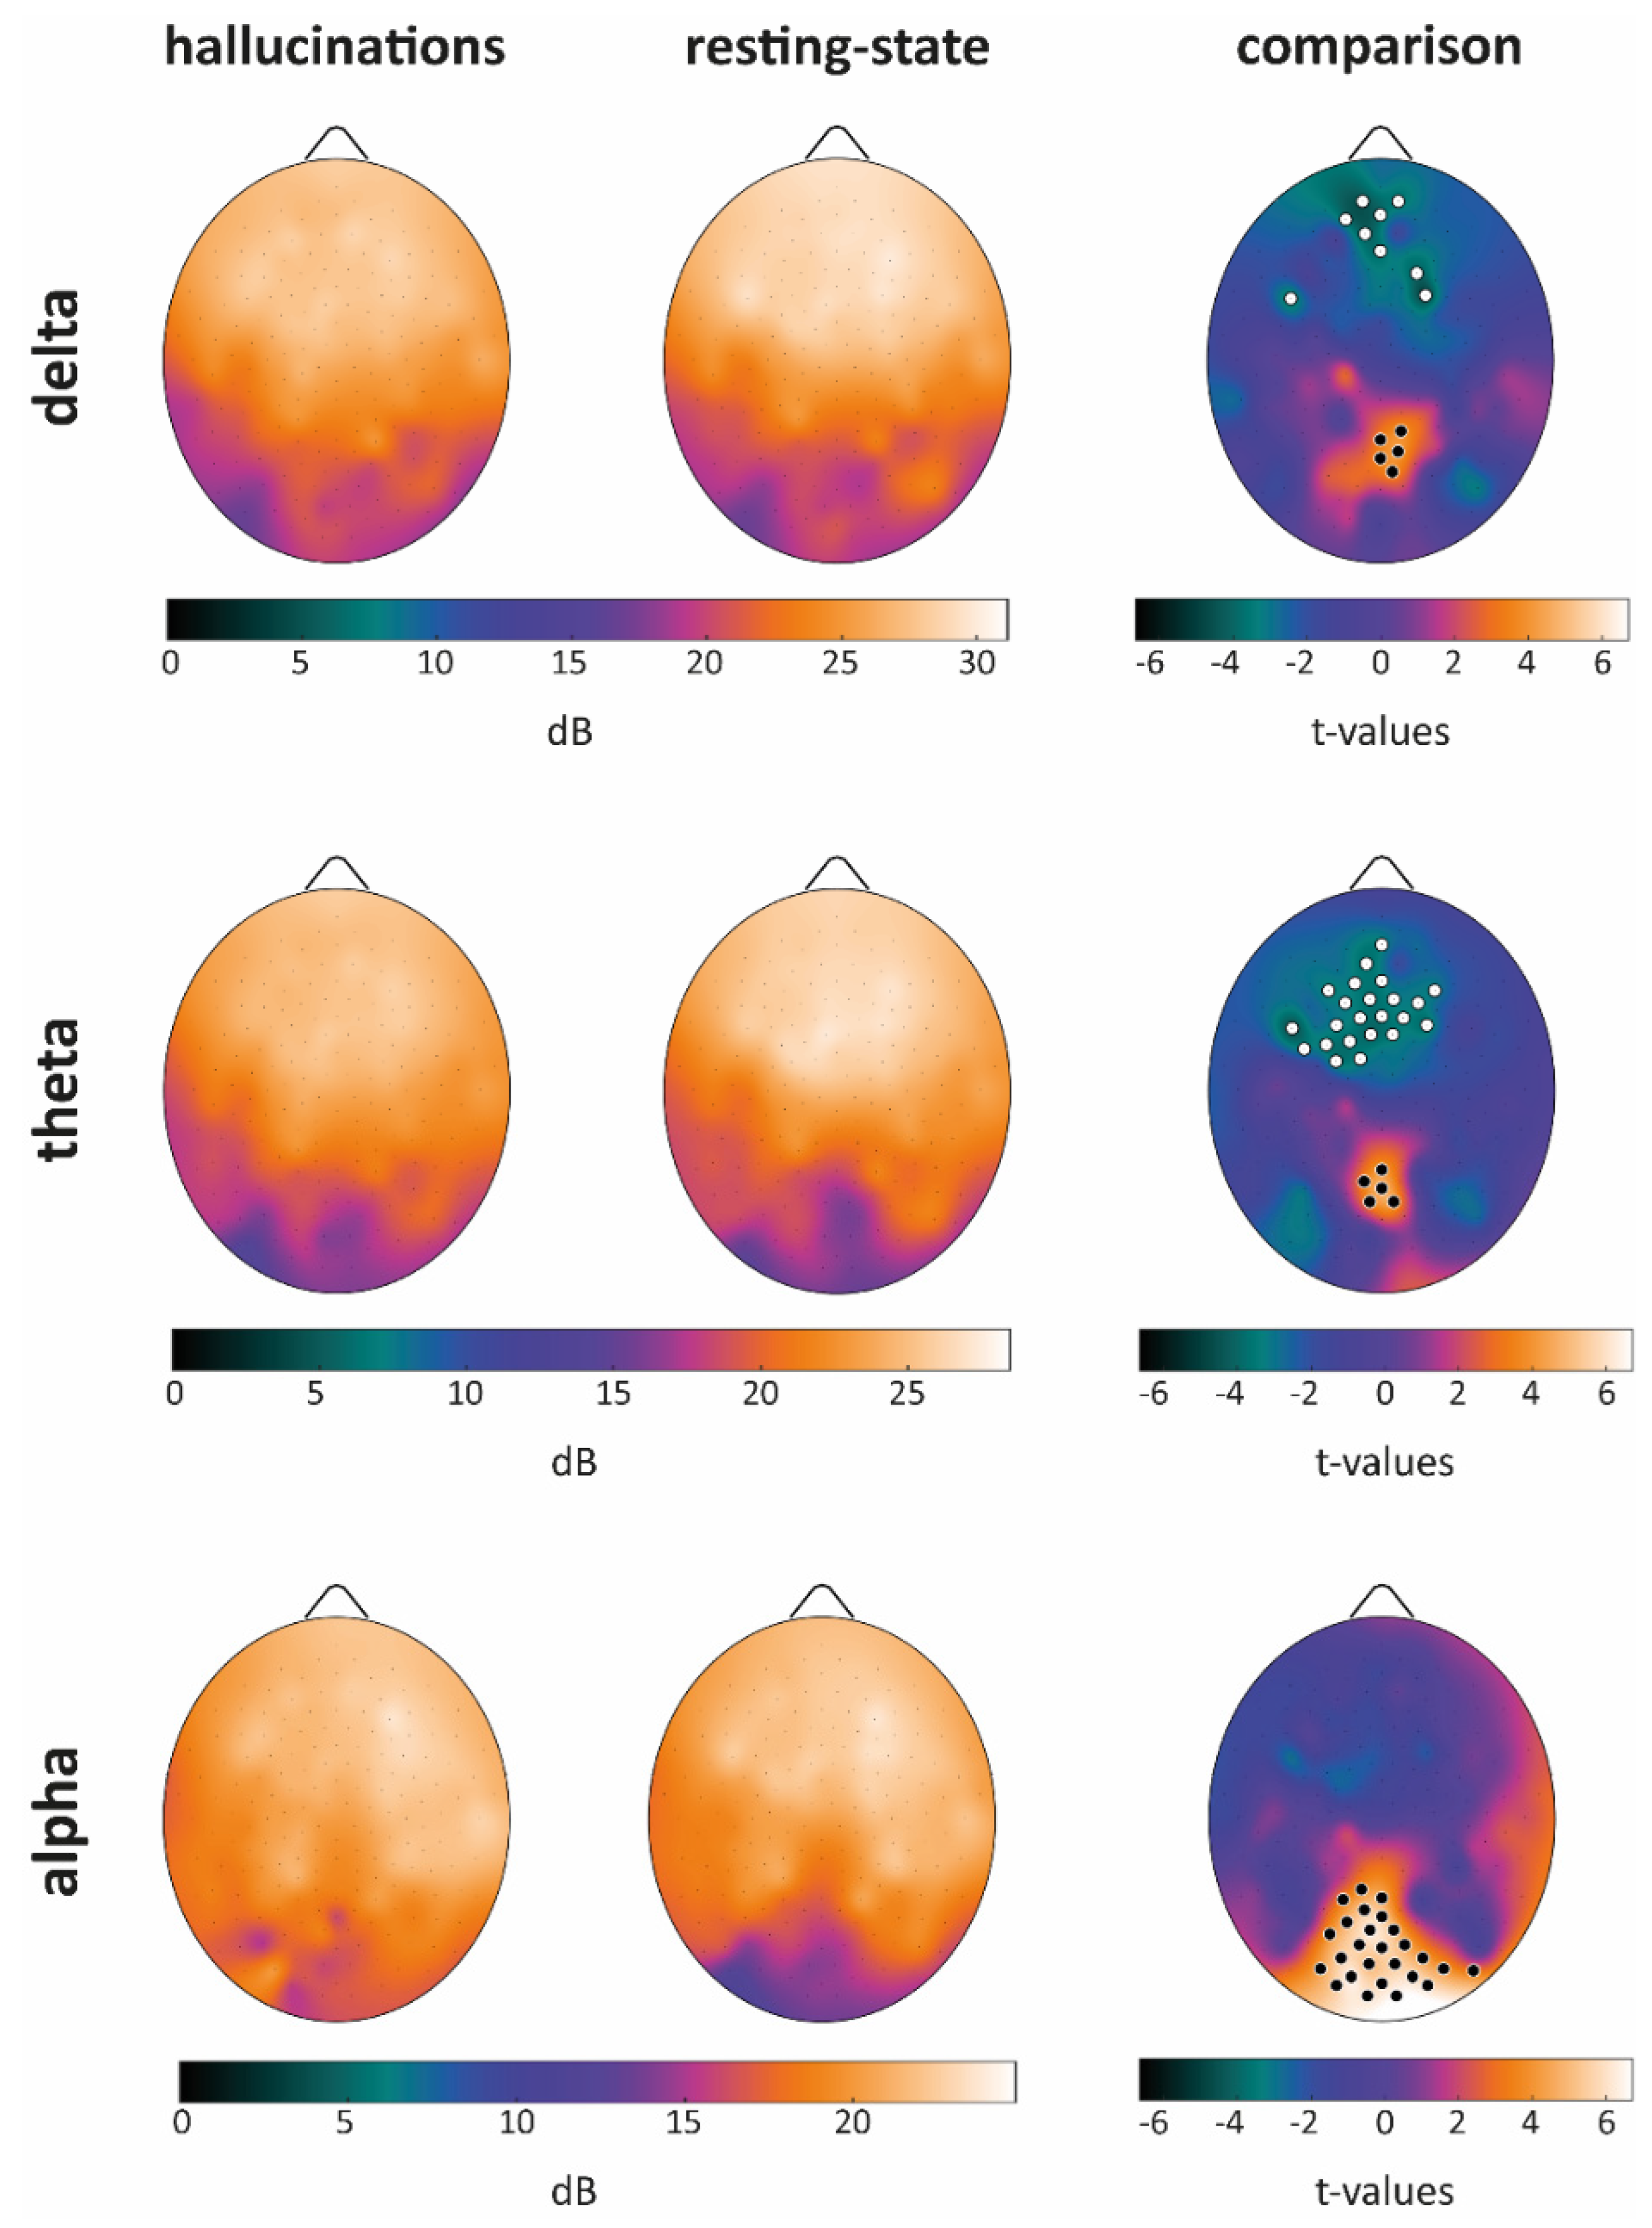
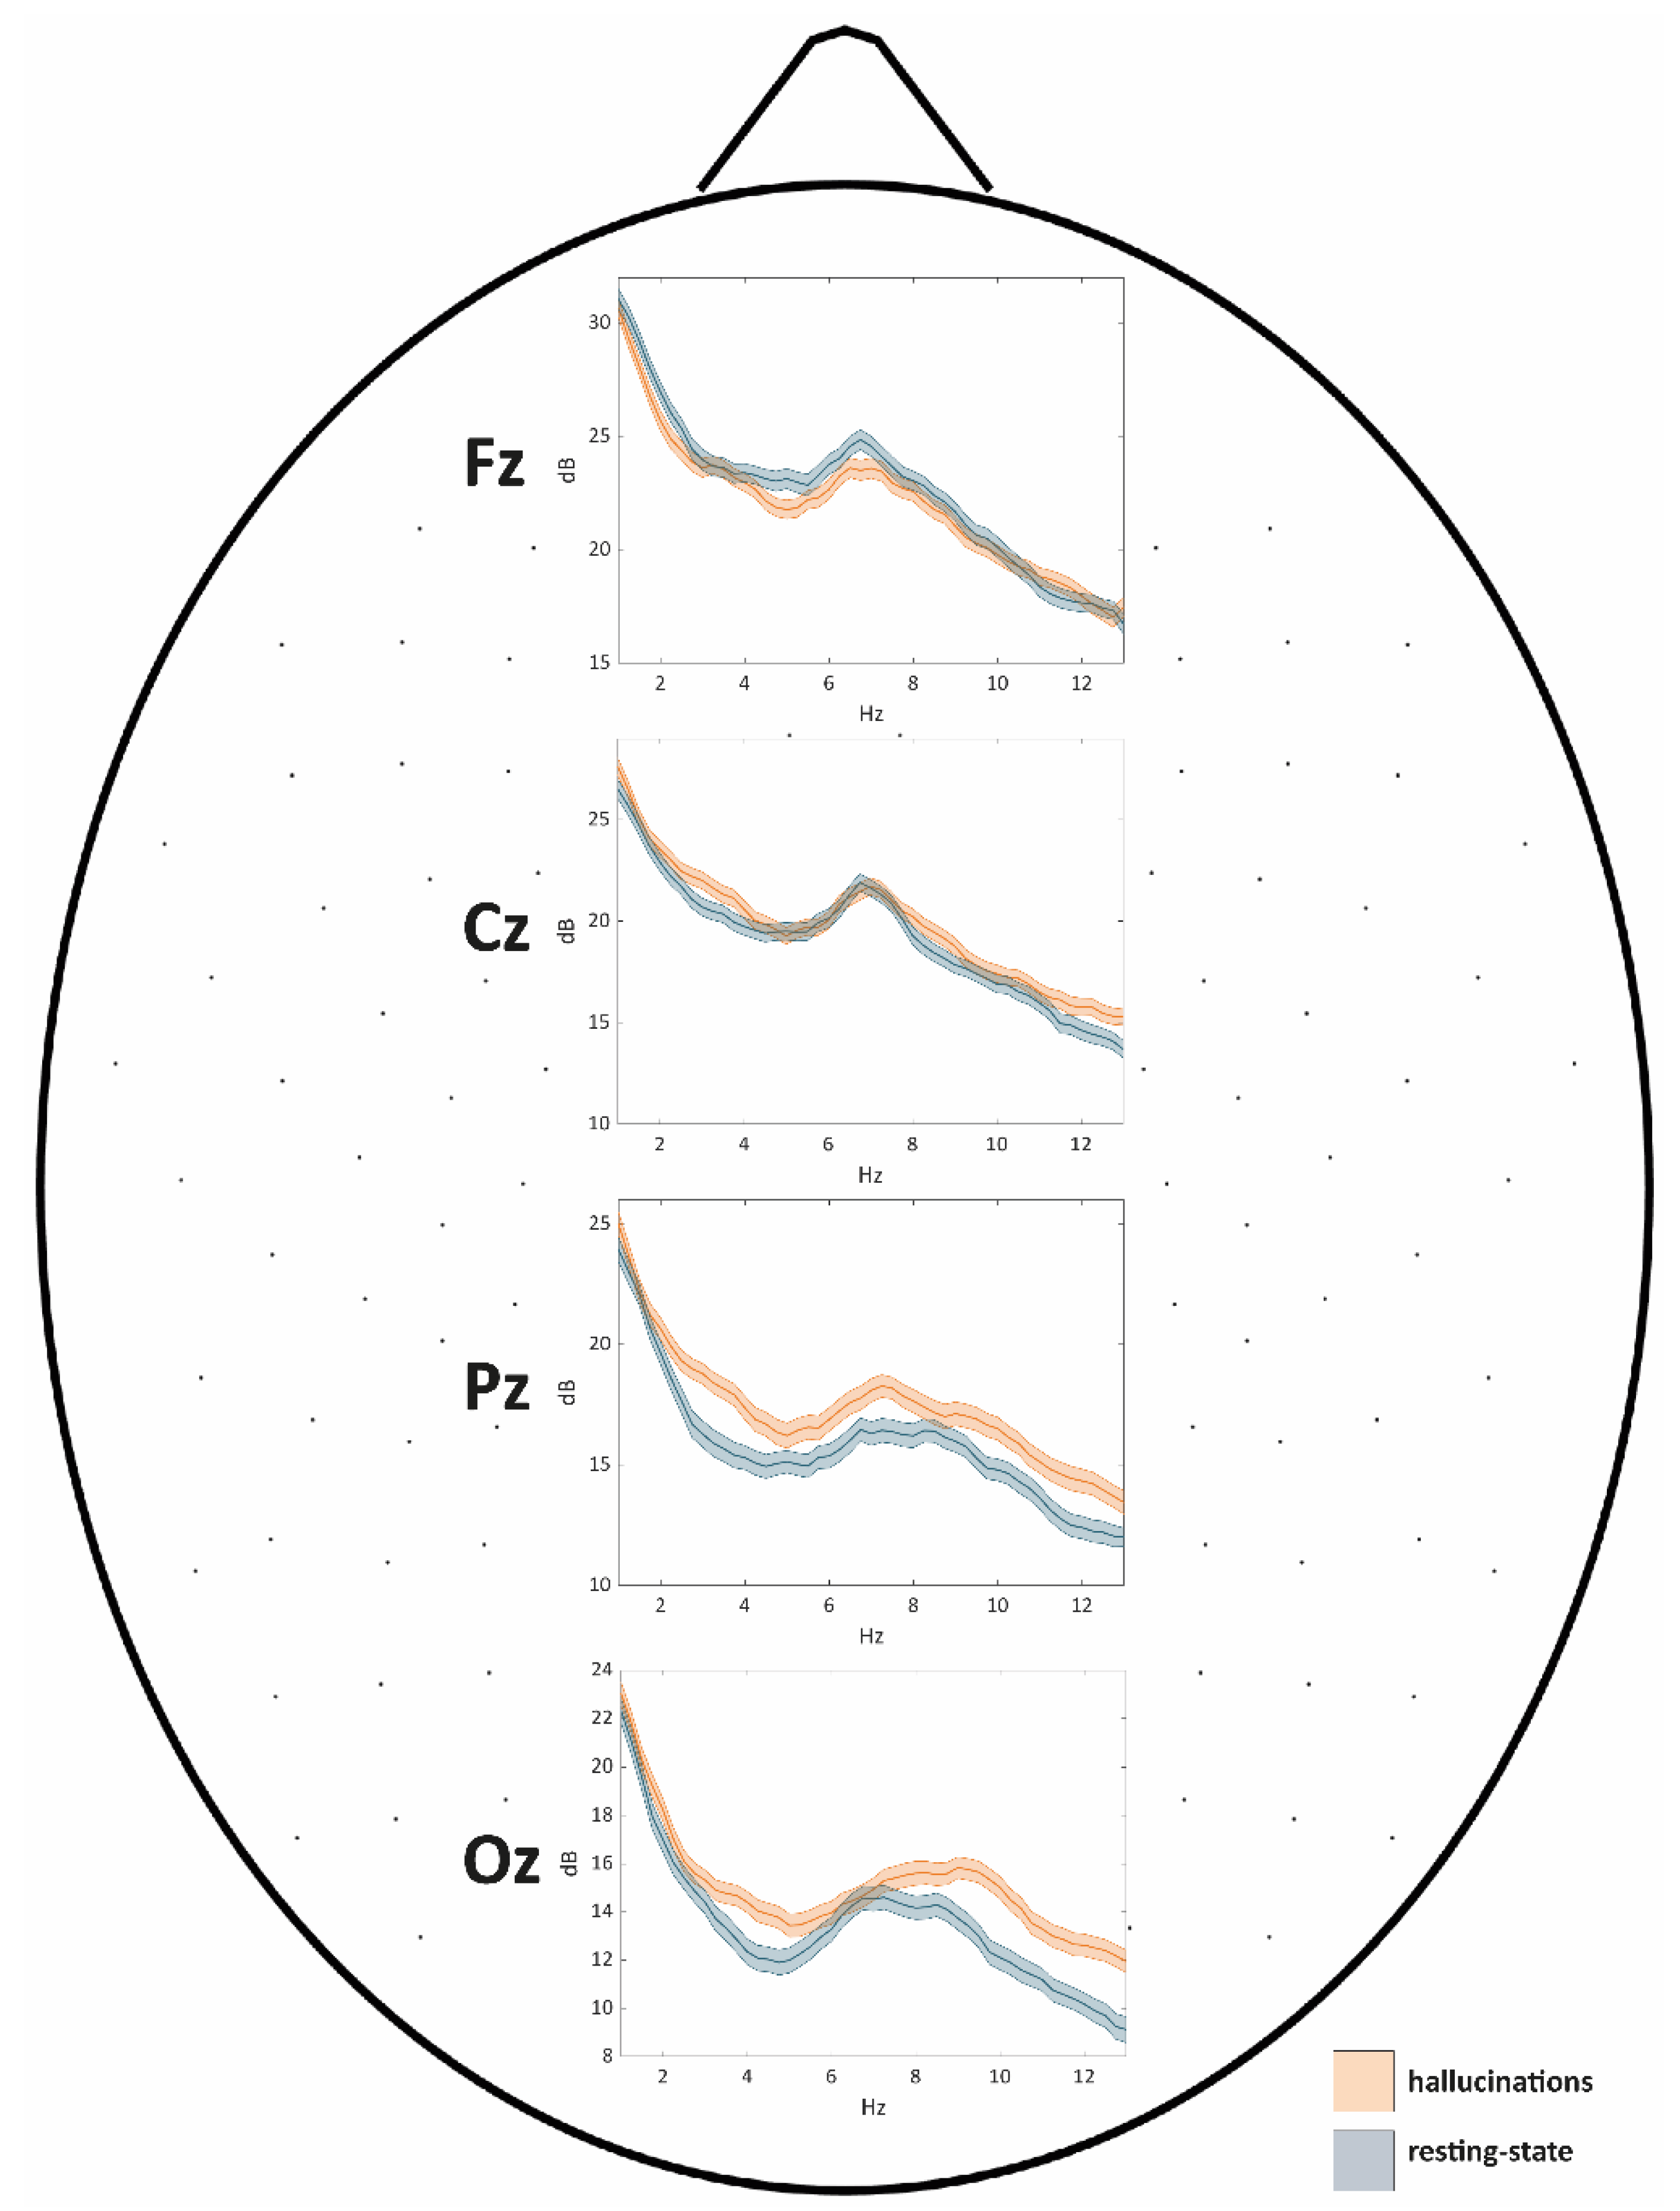
Power Spectral Density
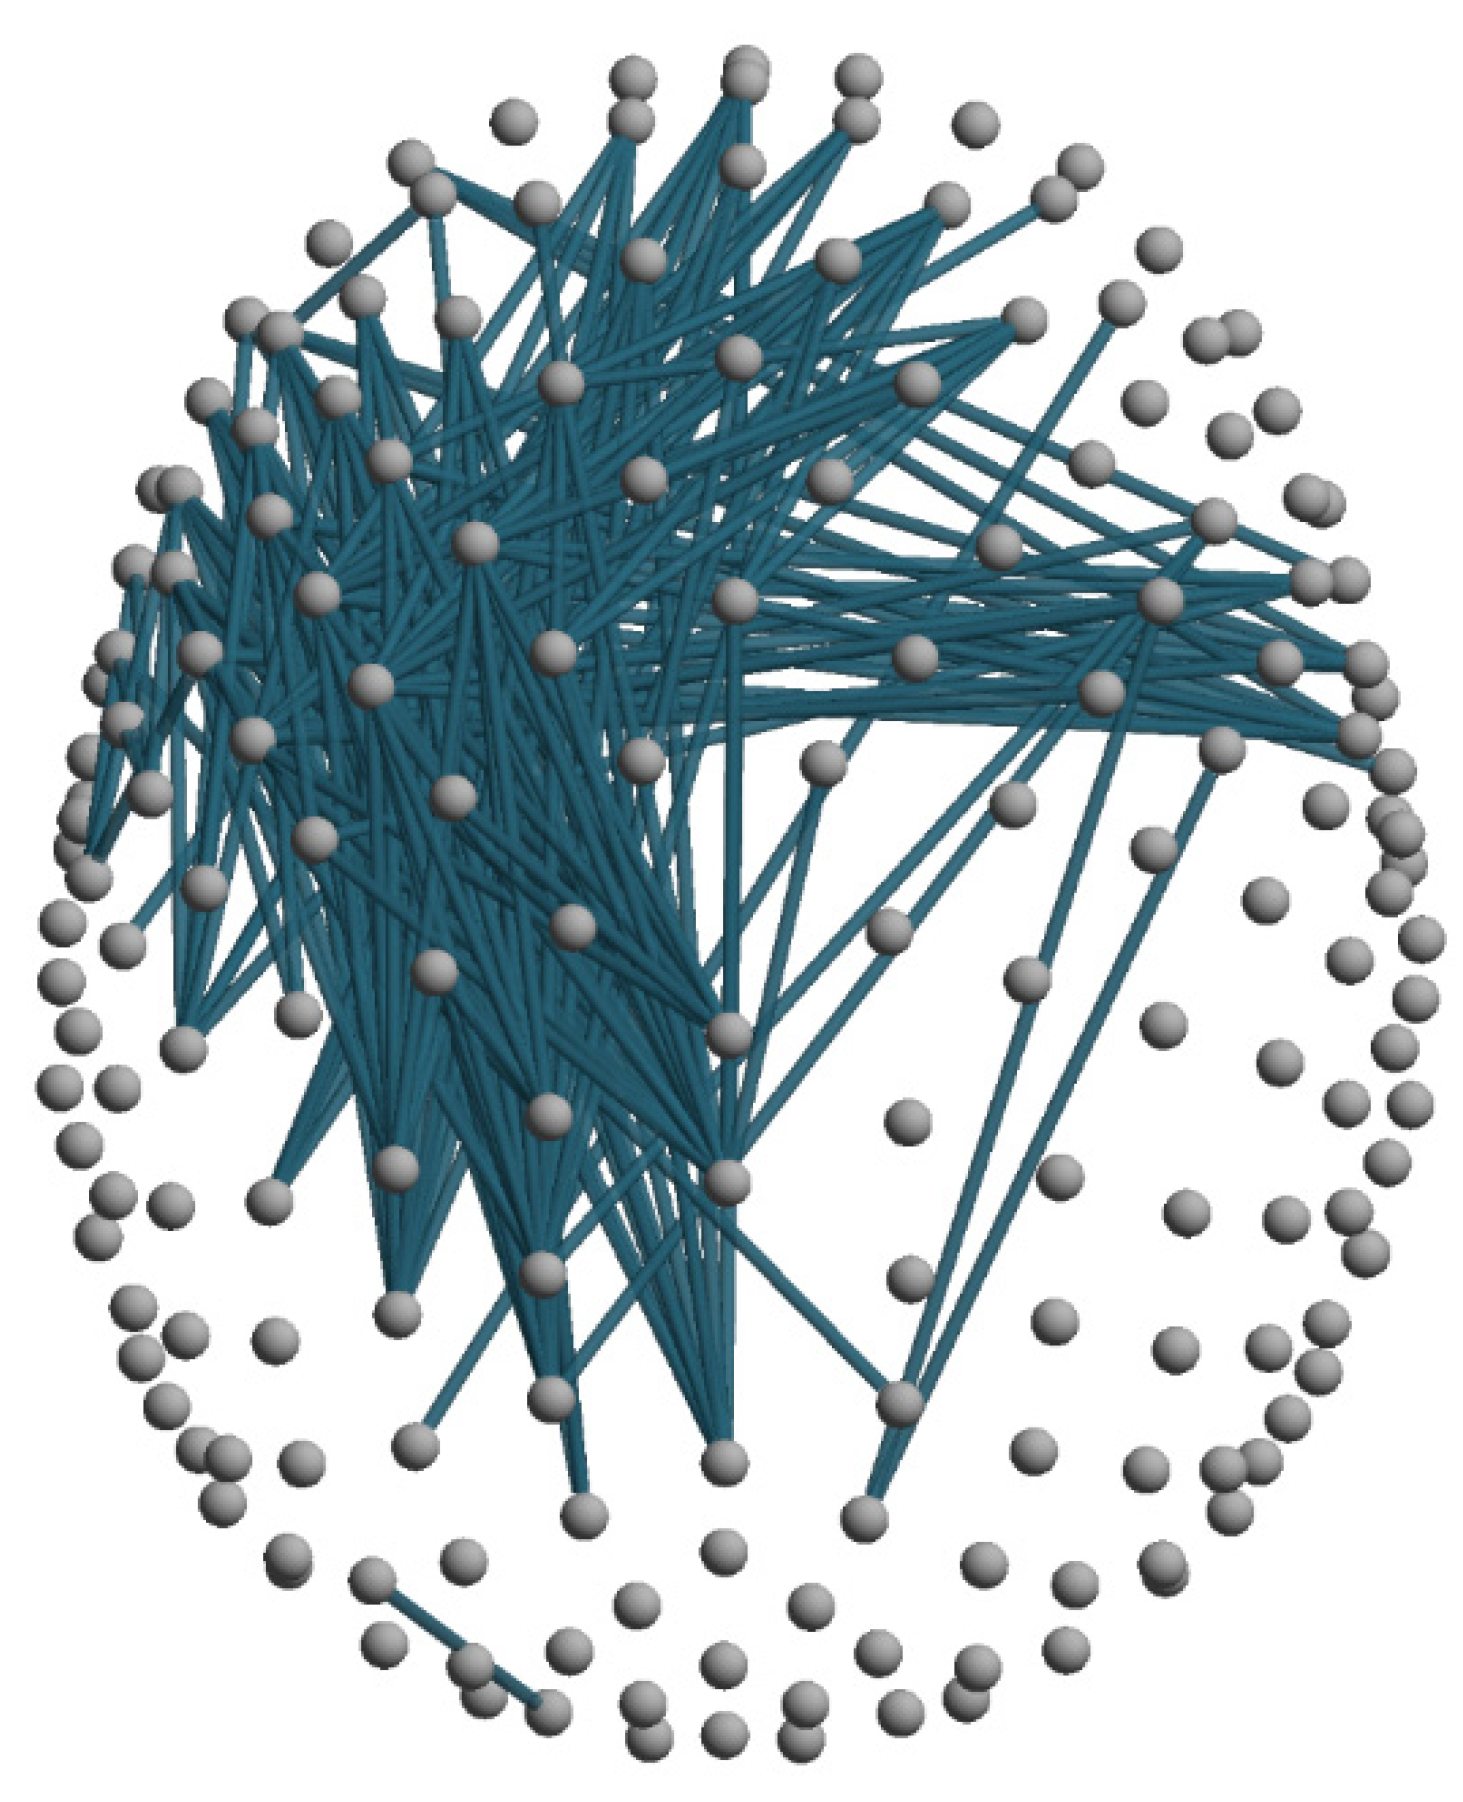
Classical Connectivity Analysis (dwPLI)
Graph Theoretic Metrics
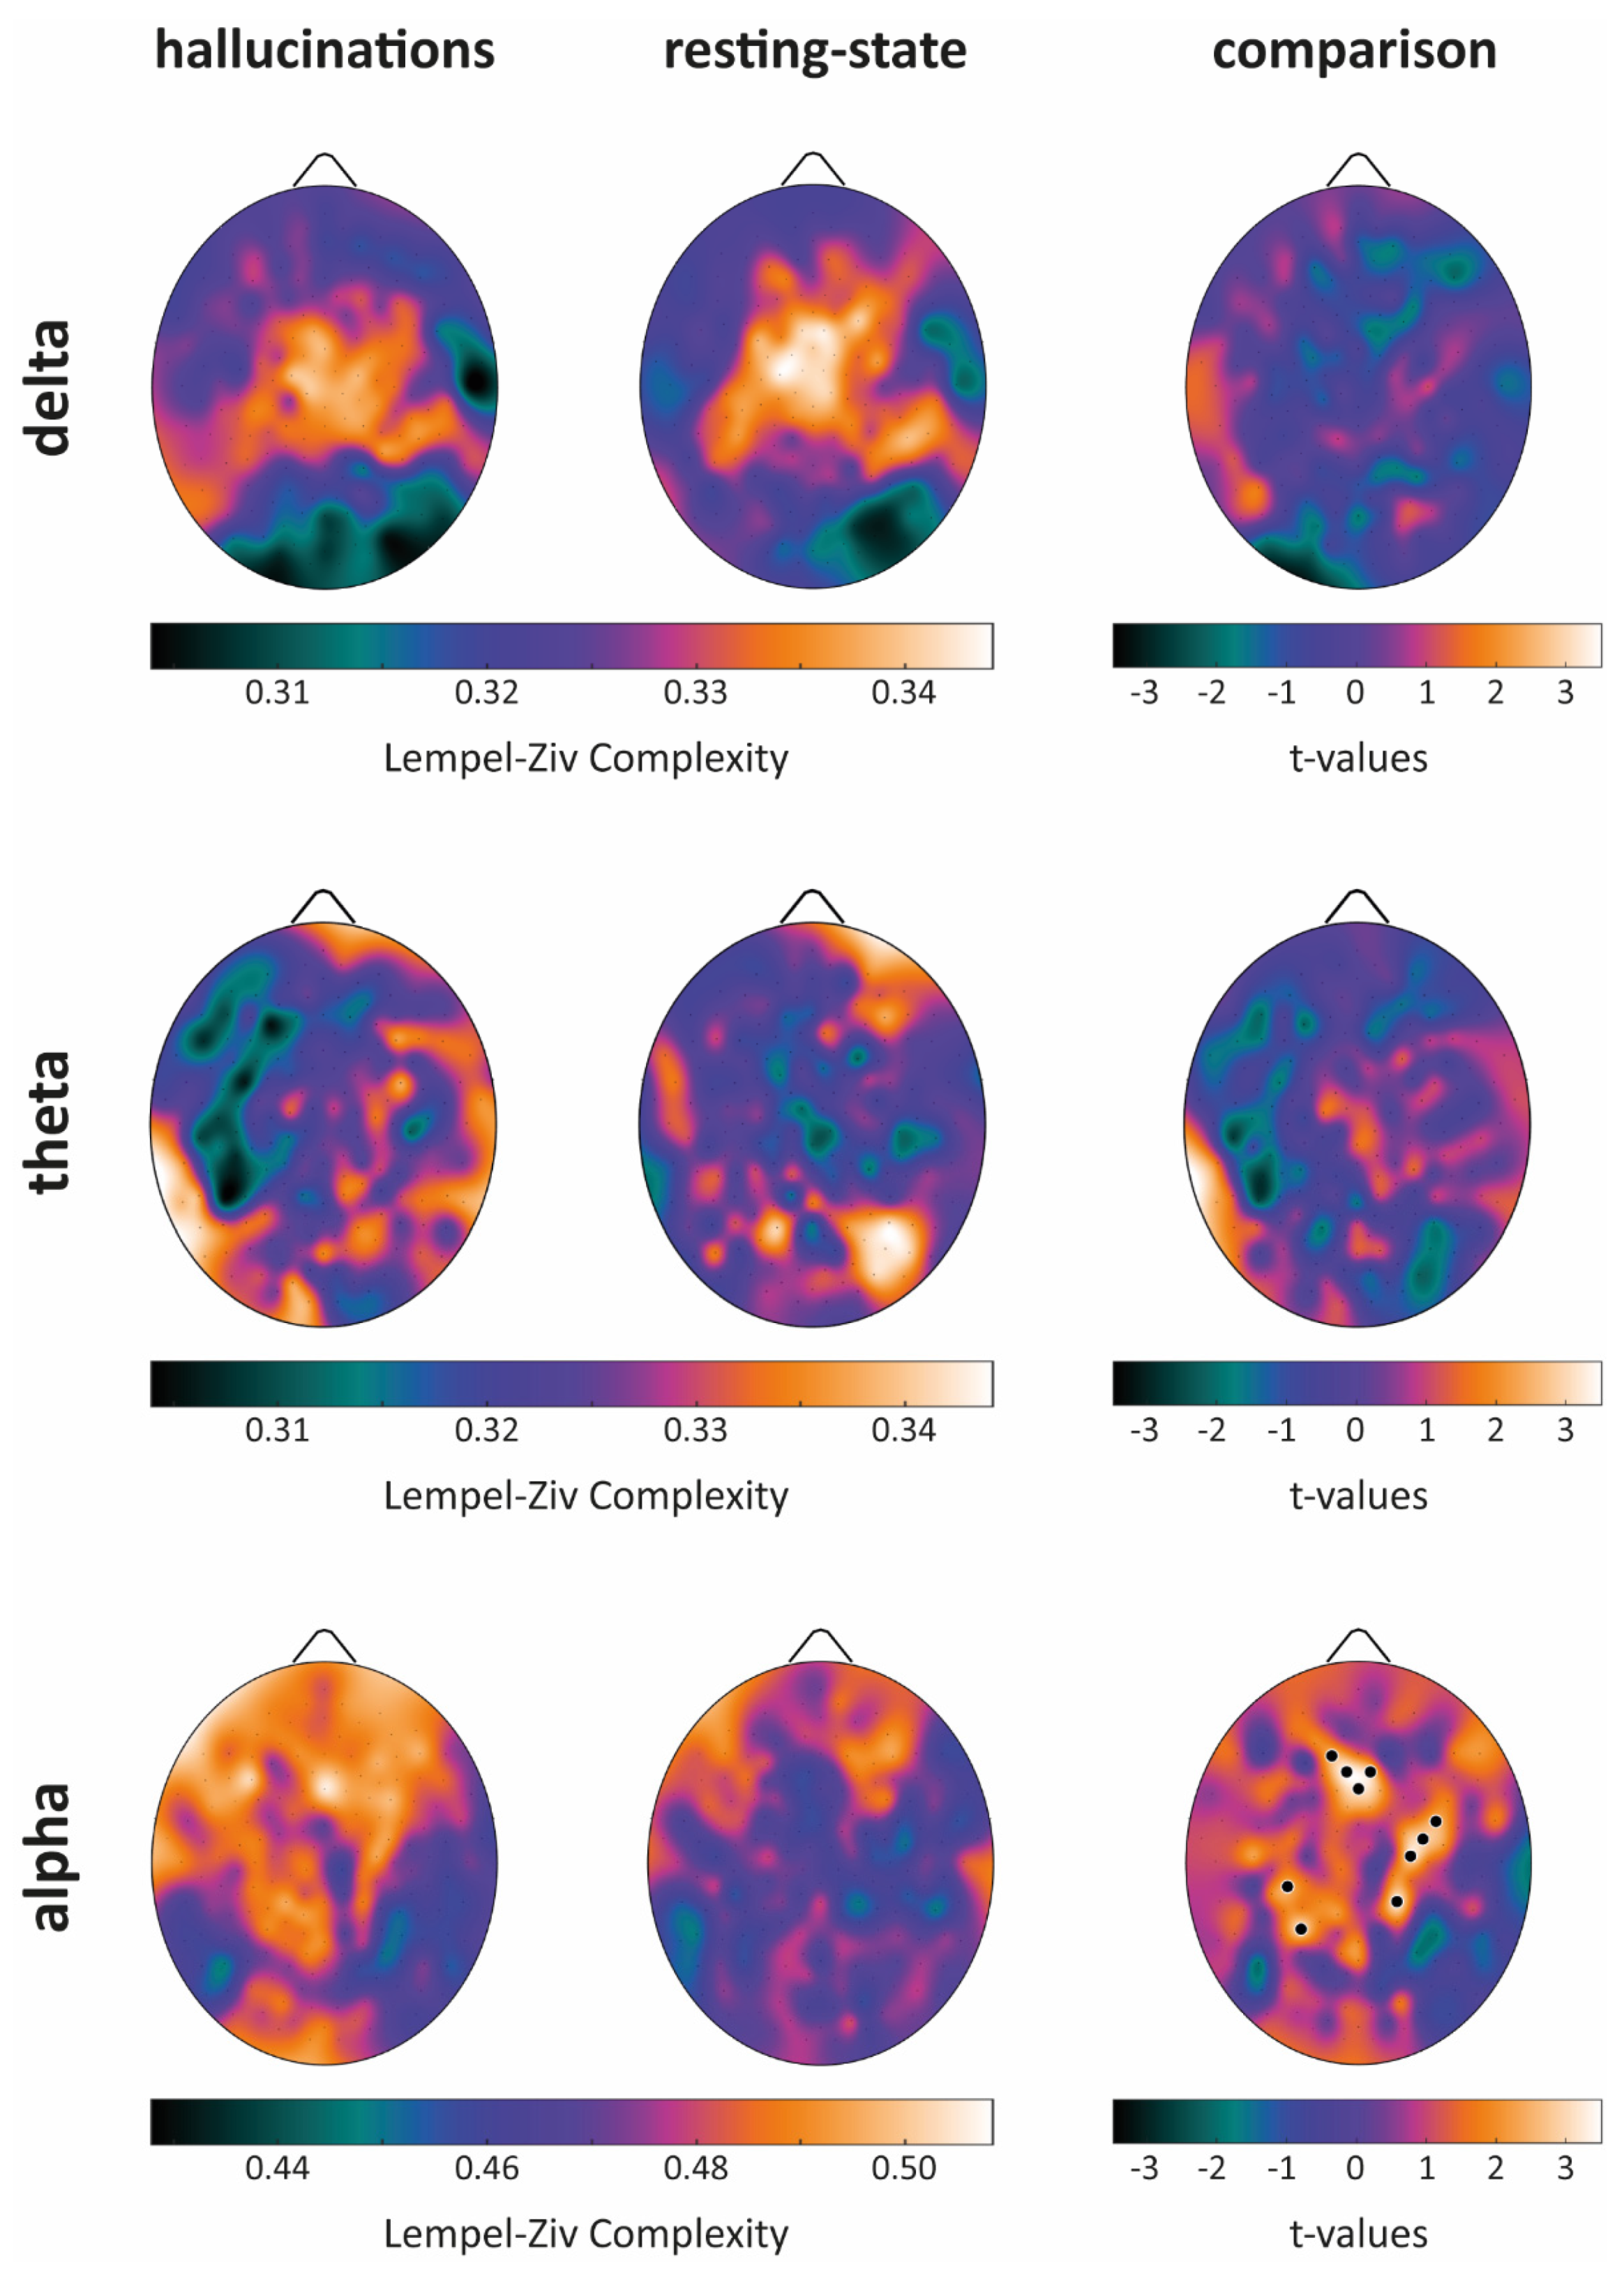
Lempel–Ziv Complexity
4. Discussion
5. Conclusions
Supplementary Materials
Author Contributions
Funding
Institutional Review Board Statement
Informed Consent Statement
Data Availability Statement
Conflicts of Interest
References
- Teunisse, R.J.; Cruysberg, J.R.M.; Verbeek, A.; Zitman, F.G. The Charles Bonnet syndrome: A large prospective study in the Netherlands. Br. J. Psychiatry 1995, 166, 254–257. [Google Scholar] [CrossRef] [PubMed]
- Damas-Mora, J.; Skelton-Robinson, M.; Jenner, F.A. The Charles Bonnet syndrome in perspective. Psychol. Med. 1982, 12, 251–261. [Google Scholar] [CrossRef]
- Bonnet, C. Essai Analytique Sur Les Facultés de L’âme; Philibert: Copenhagen, Denmark, 1760; pp. 426–428. [Google Scholar]
- Adachi, N.; Nagayama, M.; Anami, K.; Arima, K.; Matsudal, H. Asymmetrical blood flow in the temporal lobe in the Charles Bonnet syndrome: Serial neuroimaging study. Behav. Neurol 1994, 7, 97–99. [Google Scholar] [CrossRef] [PubMed][Green Version]
- Chen, J.J. Diagnosis and treatment of psychiatric commordity in a patient with Charles Bonnet syndrome. Case Rep. Psychiatry 2014, 2014, 195847. [Google Scholar] [CrossRef]
- Kazui, H.; Ishii, R.; Yoshida, T.; Ikezawa, K.; Takaya, M.; Tokunaga, H.; Tanaka, T.; Takeda, M. Neuroimaging studies in patients with Charles Bonnet Syndrome. Psychogeriatrics 2009, 9, 77–84. [Google Scholar] [CrossRef] [PubMed]
- Kishi, T.; Uegaki, J.; Kitani, M.; Fujimoto, A.; Naganuma, R. The usefulness of single photon emission computed tomography in Charles Bonnet syndrome: A case with occipital lobe involvement. Gen. Hosp. Psychiatry 2000, 22, 132–135. [Google Scholar] [CrossRef]
- Rovner, B.W. The Charles Bonnet syndrome: Visual hallucinations caused by vision impairment. Geriatrics 2002, 57, 45–46. [Google Scholar]
- Terao, T. The present state of Charles Bonnet syndrome. Psychogeriatrics 2002, 2, 6–14. [Google Scholar] [CrossRef]
- Cogan, D. Visual hallucinations as release phenomena. Graefes Arch. Clin. Exp. Ophtahlmol. 1973, 188, 139–150. [Google Scholar] [CrossRef] [PubMed]
- Schultz, G.; Melzack, R. The Charles Bonnet syndrome: ‘Phantom visual images’. Perception 1991, 20, 809–825. [Google Scholar] [CrossRef]
- Painter, D.R.; Dwyer, M.F.; Kamke, M.R.; Mattingley, J.B. Stimulus-driven cortical hyperexcitability in individuals with Charles Bonnet hallucinations. Curr. Biol. 2018, 28, 3475–3480. [Google Scholar] [CrossRef]
- Vacchiano, V.; Tonon, C.; Mitolo, M.; Evangelisti, S.; Carbonelli, M.; Liguori, R.; Lodi, R.; Carelli, V.; la Morgia, C. Functional MRI study in a case of Charles Bonnet syndrome related to LHON. BMC Neurol. 2019, 19, 350. [Google Scholar] [CrossRef]
- Hahamy, A.; Wilf, M.; Rosin, B.; Behrmann, M.; Malach, R. How do the blind ‘see’? The role of spontaneous brain activity in self-generated perception. Brain 2021, 144, 340–353. [Google Scholar] [CrossRef] [PubMed]
- Shiraishi, Y.; Terao, T.; Ibi, K.; Nakamura, J.; Tawara, A. Charles Bonnet syndrome and visual acuity—The involvement of dynamic or acute sensory deprivation. Eur. Arch. Psychiatry Clin. Neurosci. 2004, 254, 362–364. [Google Scholar] [CrossRef] [PubMed]
- Caras, I.; Littman, N.; Abo, A. Proceedings: Debilitating Eye Diseases. Stem Cells Transl. Med. 2014, 20, 1393–1400. [Google Scholar] [CrossRef]
- Mattis, S. Dementia Rating Scale: Professional Manual; Psychological Assessment Resources: Odessa, FL, USA, 1988. [Google Scholar]
- Sokal, R.R.; Rohlf, F.J. Biometry: The Principles and Practice of Statistics in Biological Research; Freeman: New York, NY, USA, 1995. [Google Scholar]
- Nasreddine, Z.S.; Phillips, N.A.; Bedirian, V.; Charbonneau, S.; Whitehead, V.; Collin, I.; Cummings, J.L.; Chertkow, H. The Montreal Cognitive Assessment, MoCA: A brief screening tool for mild cognitive impairment. J. Am. Geriatr. Soc. 2005, 53, 695–699. [Google Scholar] [CrossRef]
- Martial, C.; Larroque, S.K.; Cavaliere, C.; Wannez, S.; Annen, J.; Kupers, R.; Laureys, S.; Di Perri, C. Resting-state functional connectivity and cortical thickness characterization of a patient with Charles Bonnet Syndrome. PLoS ONE 2019, 14, e0219656. [Google Scholar]
- Delorme, A.; Makeig, S. EEGLAB: An open source toolbox for analysis of single-trial EEG dynamics including independent component analysis. J. Neurosci. Methods 2004, 134, 9–21. [Google Scholar] [CrossRef]
- Piarulli, A.; Zaccaro, A.; Laurino, M.; Menicucci, D.; De Vito, A.; Bruschini, L.; Berrettini, S.; Bergamasco, M.; Laureys, S.; Gemignani, A. Ultra-slow mechanical stimulation of olfactory epithelium modulates consciousness by slowing cerebral rhythms in humans. Sci. Rep. 2018, 8, 6581. [Google Scholar] [CrossRef] [PubMed]
- Makeig, S.; Bell, A.J.; Jung, T.P.; Sejnowski, T.J. Independent component analysis of electroencephalographic data. In Advances in Neural Information Processing Systems 8; Touretzky, D.S., Hasselmo, M.E., Eds.; Neural Information Processing Systems, NIPS Foundation; MIT Press: Cambridge, MA, USA, 1996; pp. 145–151. [Google Scholar]
- Junghofer, M.; Elbert, T.; Tucker, D.M.; Rockstroh, B. Statistical control of artifacts in dense array EEG/MEG studies. Psychophysiology 2000, 37, 523–532. [Google Scholar] [CrossRef]
- Chennu, S.; Finoia, P.; Kamau, E.; Allanson, J.; Williams, G.B.; Monti, M.M.; Noreika, V.; Arnatkeviciute, A.; Canales-Johnson, A.; Olivares, F.; et al. Spectral signatures of reorganised brain networks in disorders of consciousness. PLoS Comput. Biol. 2004, 10, e1003887. [Google Scholar] [CrossRef]
- Vinck, M.; Oostenveld, R.; van Wingerden, M.; Battaglia, F.; Pennartz, C.M. An improved index of phase-synchronization for electrophysiological data in the presence of volume-conduction, noise and sample-size bias. Neuroimage 2011, 55, 1548–1565. [Google Scholar] [CrossRef] [PubMed]
- Xia, M.; Wang, J.; He, Y. BrainNet Viewer: A network visualization tool for human brain connectomics. PLoS ONE 2013, 8, e68910. [Google Scholar] [CrossRef]
- Chennu, S.; Annen, J.; Wannez, S.; Thibaut, A.; Chatelle, C.; Cassol, H.; Martens, G.; Schnakers, C.; Gosseries, O.; Menon, D.; et al. Brain networks predict metabolism, diagnosis and prognosis at the bedside in disorders of consciousness. Brain 2017, 140, 2120–2132. [Google Scholar] [CrossRef] [PubMed]
- Rubinov, M.; Kötter, R.; Hagmann, P.; Sporns, O. Brain connectivity toolbox: A collection of complex network measurements and brain connectivity datasets. NeuroImage 2009, 47, S169. [Google Scholar] [CrossRef]
- Latora, V.; Marchiori, M. Efficient behavior of small-world networks. Phys. Rev. Lett. 2001, 87, 198701. [Google Scholar] [CrossRef]
- Newman, M.E. Analysis of weighted networks. Phys. Rev. E Stat. Nonlin Soft Matter Phys. 2004, 70, 056131. [Google Scholar] [CrossRef] [PubMed]
- Schartner, M.; Seth, A.; Noirhomme, Q.; Boly, M.; Bruno, M.-A.; Laureys, S.; Barrett, A. Complexity of Multi-Dimensional Spontaneous EEG Decreases during Propofol Induced General Anaesthesia. PLoS ONE 2015, 10, e0133532. [Google Scholar] [CrossRef] [PubMed]
- Lempel, A.; Ziv, J. On the Complexity of Finite Sequences. IEEE Trans. Inf. Theory 1976, 22, 75–81. [Google Scholar] [CrossRef]
- Nichols, T.E.; Holmes, A.P. Nonparametric permutation tests for functional neuroimaging: A primer with examples. Hum. Brain Mapp. 2001, 15, 1–25. [Google Scholar] [CrossRef]
- Ludbrook, J.; Dudley, H. Why permutation tests are superior to t and f tests in biomedical research. Am. Stat. 1998, 52, 127–132. [Google Scholar] [CrossRef]
- Benjamini, Y.; Hochberg, Y. Controlling the False Discovery Rate: A practical and powerful approach to multiple testing. J. R Stat. Soc. 1995, 57, 289–300. [Google Scholar] [CrossRef]
- Bullmore, E.; Sporns, O. Complex brain networks: Graph theoretical analysis of structural and functional systems. Nat. Rev. Neurosci. 2009, 10, 186–198. [Google Scholar] [CrossRef]
- Hughes, S.W.; Crunelli, V. Thalamic Mechanisms of EEG Alpha Rhythms and Their Pathological Implications. Neuroscientist 2005, 11, 357–372. [Google Scholar] [CrossRef] [PubMed]
- Krigseis, A.; Henninghausen, E.; Rösler, F.; Röder, B. Reduced EEG alpha activity over parieto-occipital brain areas in congenitally blind adults. Clin. Neuropysiol. 2006, 117, 1560–1573. [Google Scholar] [CrossRef]
- Novikova, L.A. Blindness and the Electrical Activity of the Brain: Electroencephalographic Studies of the Effects of Sensory Impairment, 23rd ed.; American Foundation for the Blind: Arlington, VA, USA, 1974. [Google Scholar]
- Bacigalupo, F.; Luck, S.J. Lateralized suppression of alpha-band EEG activity as a mechanism of target processing. J. Neurosci. 2019, 39, 900–917. [Google Scholar] [CrossRef]
- Ishii, R.; Canuet, L.; Aoki, Y.; Hata, M.; Iwase, M.; Ikeda, S.; Nishida, K.; Ikeda, M. Healthy and Pathological Brain Aging: From the Perspective of Oscillations, Functional Connectivity, and Signal Complexity. Neuropsychobiology 2017, 75, 151–161. [Google Scholar] [CrossRef]
- Cavanna, A.E.; Trimble, M.R. The precuneus: A review of its functional anatomy and behavioural correlates. Brain 2006, 129, 564–583. [Google Scholar] [CrossRef] [PubMed]
- Gusnard, D.A. Being a self: Considerations from functional imaging. Conscious. Cogn. 2005, 14, 679–697. [Google Scholar] [CrossRef]
- Northoff, G.; Heinzel, A.; de Greck, M.; Bermpohl, F.; Dobrowolny, H.; Panksepp, J. Self-referential processing in our brain-A meta-analysis of imaging studies on the self. NeuroImage 2006, 31, 440–457. [Google Scholar] [CrossRef]
- Cavanna, A.E. The precuneus and consciousness. CNS Spectr. 2014, 12, 545–552. [Google Scholar] [CrossRef]
- Garrison, J.R.; Saviola, F.; Morgenroth, E.; Barker, H.; Lurhs, M.; Simons, J.S.; Fernyhough, C.; Allen, P. Did I imagine that? The functional role of paracingulate cortex in reality monitoring. BioRxiv 2020. [Google Scholar] [CrossRef]
- Geueke, A.; Morley, M.G.; Morley, K.; Lorch, A.; Jackson, M.; Lambrou, A.; Oteng-Amoako, A. Anxiety and Charles Bonnet Syndrome. J. Vis. Impair. Blind. 2012, 106, 145–153. [Google Scholar] [CrossRef]
- Cavanagh, J.F.; Frank, M.J. Frontal theta as a mechanism for cognitive control. Trends Cogn. Sci. 2014, 18, 414–421. [Google Scholar] [CrossRef] [PubMed]
- Ffytche, D.H.; Howard, R.J.; Brammer, M.J.; David, A.; Woodruff, P.; Williams, S. The anatomy of conscious vision: An fMRI study of visual hallucinations. Nat. Neurosc. 1998, 1, 738–742. [Google Scholar] [CrossRef] [PubMed]
- Liu, Y.; Liang, M.; Zhou, Y.; He, Y.; Hao, Y.; Song, M.; Yu, C.; Liu, H.; Jiang, T. Disrupted small-world networks in schizophrenia. Brain 2008, 131, 945–961. [Google Scholar] [CrossRef]
- Ottet, M.-C.; Schaer, M.; Debbané, M.; Cammoun, L.; Thiran, J.-P.; Eliez, S. Graph theory reveals disconnected hubs in 22q11DS and altered nodal efficiency in patients with hallucinations. Front. Hum. Neurosci. 2013, 7, 402. [Google Scholar] [CrossRef] [PubMed]
- Alderson-Day, B.; Diederen, K.; Fernyhough, C.; Ford, J.M.; Horga, G.; Margulies, D.S.; McCarthy-Jones, S.; Northoff, G.; Shine, J.M.; Turner, J.; et al. Auditory Hallucinations and the Brain’s Resting-State Networks: Findings and Methodological Observations. Schizophr. Bull. 2016, 42, 1110–1123. [Google Scholar] [CrossRef] [PubMed]
- Shine, J.M.; O’Callaghan, C.; Halliday, G.M.; Lewis, S.J.G. Tricks of the mind: Visual hallucinations as disorders of attention. Prog Neurobiol. 2014, 116, 58–65. [Google Scholar] [CrossRef] [PubMed]
- Timmermann, C.; Roseman, L.; Schartner, M.; Milliere, R.; Williams, L.T.J.; Erritzoe, D.; Muthukumaraswamy, S.; Ashton, M.; Bendrioua, A.; Kaur, O.; et al. Neural correlates of the DMT experience assessed with multivariate EEG. Sci. Rep. 2019, 9, 16324. [Google Scholar] [CrossRef] [PubMed]
- Schwartzman, D.J.; Schartner, M.; Ador, B.B.; Simonelli, F.; Chang, A.Y.-C.; Seth, A.K. Increased spontaneous EEG signal diversity during stroboscopically-induced altered states of consciousness. BioRxiv 2019, 511766. [Google Scholar] [CrossRef]
- Carhart-Harris, R. The entropic brain-revisited. Neuropharmacology 2018, 142, 167–178. [Google Scholar] [CrossRef] [PubMed]


Publisher’s Note: MDPI stays neutral with regard to jurisdictional claims in published maps and institutional affiliations. |
© 2021 by the authors. Licensee MDPI, Basel, Switzerland. This article is an open access article distributed under the terms and conditions of the Creative Commons Attribution (CC BY) license (https://creativecommons.org/licenses/by/4.0/).
Share and Cite
Piarulli, A.; Annen, J.; Kupers, R.; Laureys, S.; Martial, C. High-Density EEG in a Charles Bonnet Syndrome Patient during and without Visual Hallucinations: A Case-Report Study. Cells 2021, 10, 1991. https://doi.org/10.3390/cells10081991
Piarulli A, Annen J, Kupers R, Laureys S, Martial C. High-Density EEG in a Charles Bonnet Syndrome Patient during and without Visual Hallucinations: A Case-Report Study. Cells. 2021; 10(8):1991. https://doi.org/10.3390/cells10081991
Chicago/Turabian StylePiarulli, Andrea, Jitka Annen, Ron Kupers, Steven Laureys, and Charlotte Martial. 2021. "High-Density EEG in a Charles Bonnet Syndrome Patient during and without Visual Hallucinations: A Case-Report Study" Cells 10, no. 8: 1991. https://doi.org/10.3390/cells10081991
APA StylePiarulli, A., Annen, J., Kupers, R., Laureys, S., & Martial, C. (2021). High-Density EEG in a Charles Bonnet Syndrome Patient during and without Visual Hallucinations: A Case-Report Study. Cells, 10(8), 1991. https://doi.org/10.3390/cells10081991