
Identification of Lung and Blood Microbiota Implicated in COVID-19 Prognosis

 , and
, and 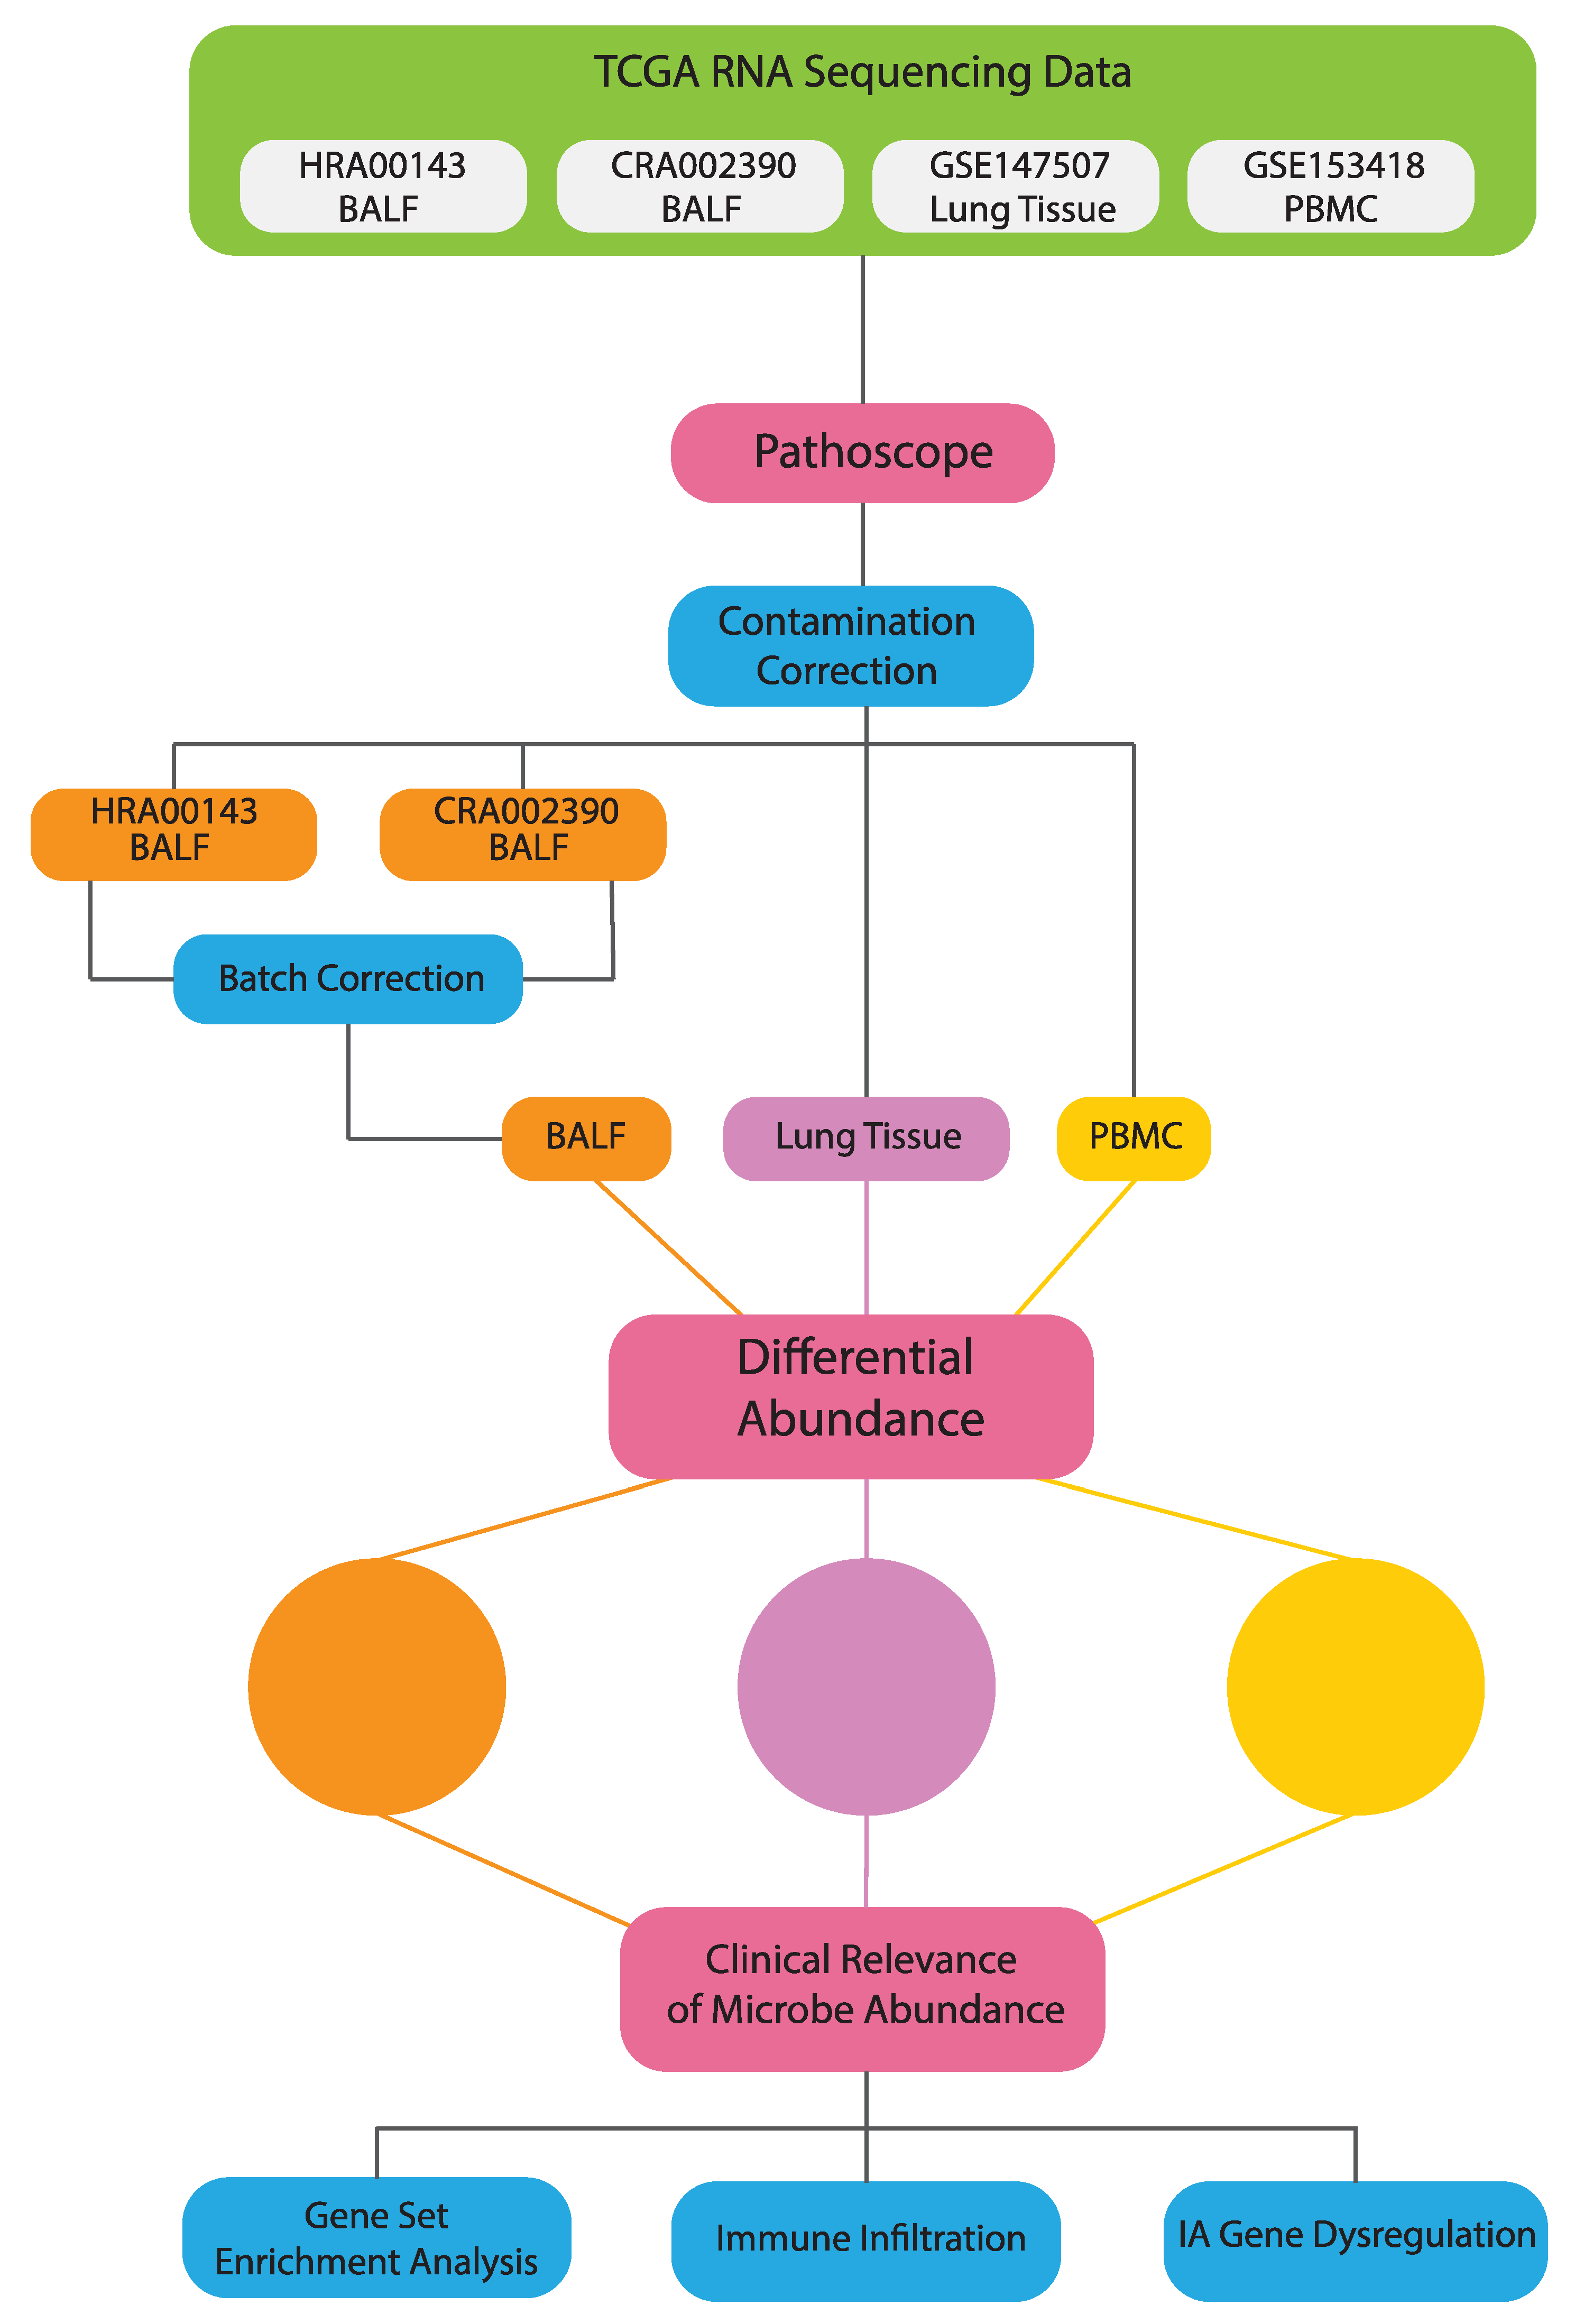
Abstract
1. Introduction
2. Materials and Methods
2.1. Data Acquisition
2.2. Extraction of Microbial Reads
2.3. Differential Microbial Abundance between COVID19 and Normal Patients
2.4. Correlation between Microbial Abundance and IA Gene Expression
2.5. Correlation between Microbial Abundance and Immune Cell Abundances
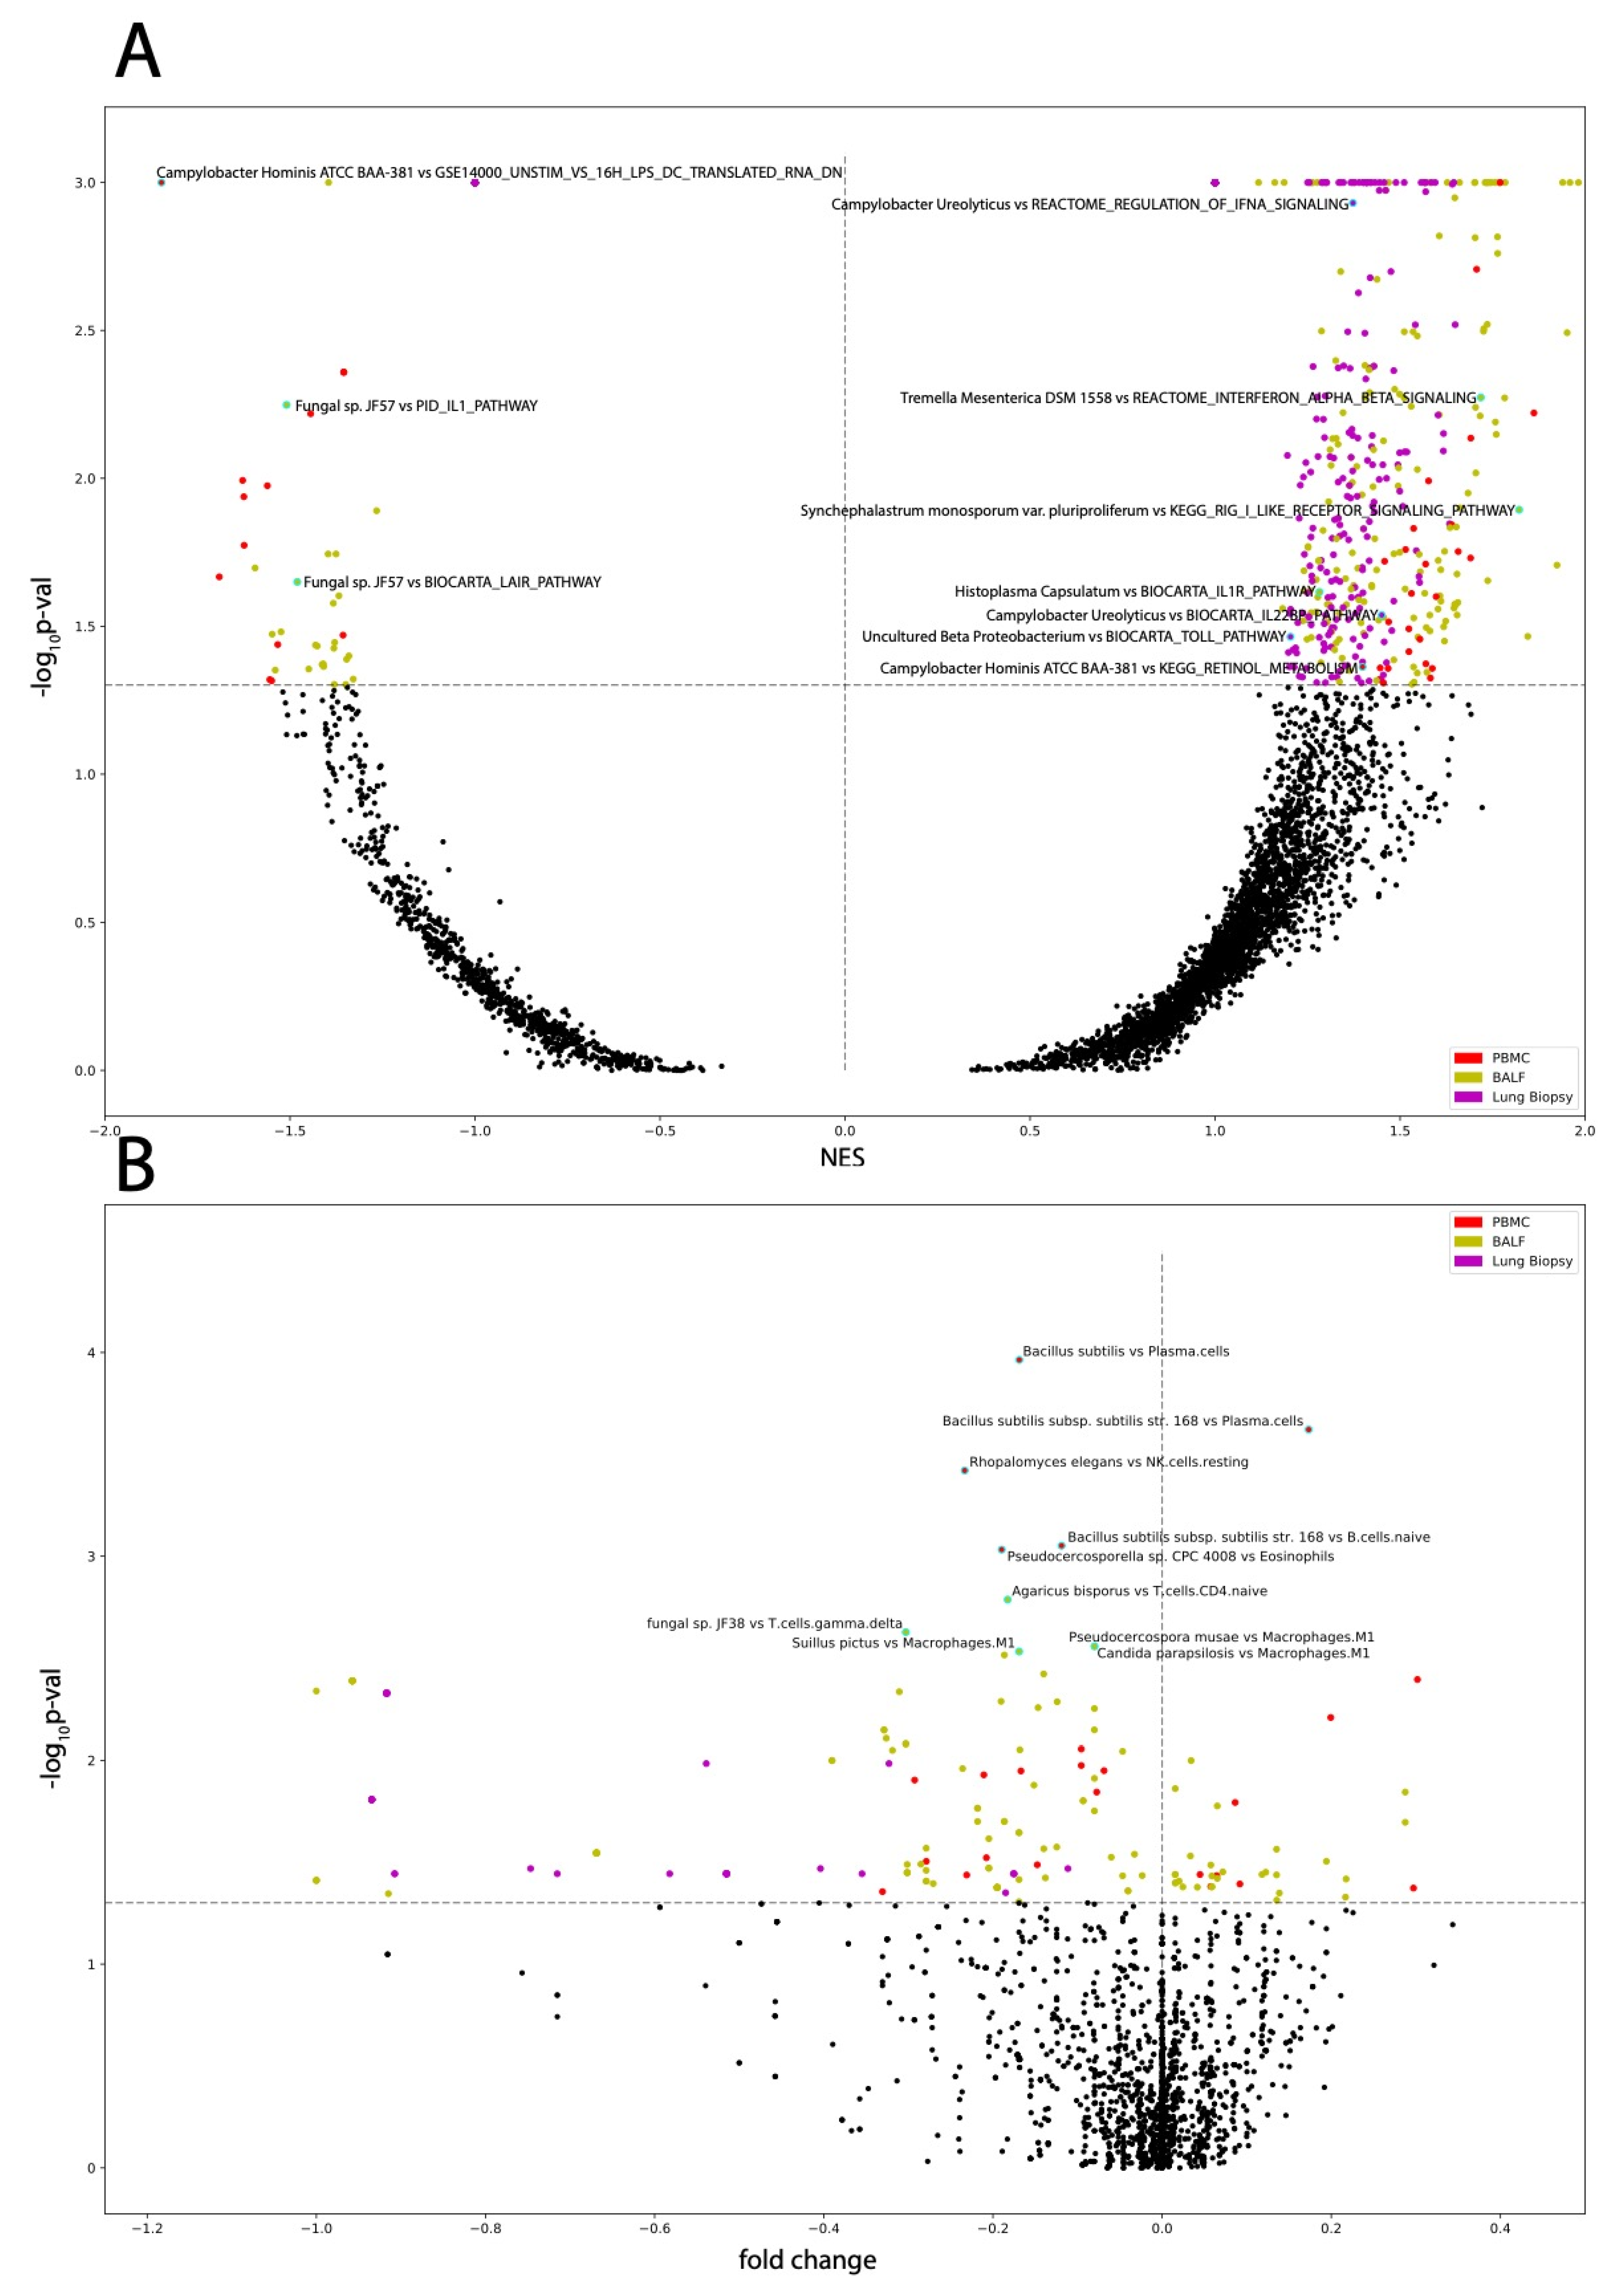
2.6. GSEA (Correlation of Microbial Abundance and Covid Status to Canonical Pathways and Immune-Associated Signatures)
2.7. Contamination Correction Using Spearman’s Correlation
3. Results
3.1. Differential Microbial Abundance in COVID-19 Tissue and Normal Tissue
3.2. Immune Landscape of COVID-19 Patients
3.3. Microbes in Blood Are Correlated to Disease Severity
3.4. Microbes from PBMC Samples Correlate to Immune Infiltration and to Dysregulation of Immunological Signatures and Canonical Pathways
3.5. Microbes from BALF Samples Correlate to Immune Infiltration and to Dysregulation of Immunological Signatures and Canonical Pathways
3.6. Microbes from Lung Biopsy Samples Correlate to Immune Infiltration and to Dysregulation of Immunological Signatures and Canonical Pathways
3.7. Negligible Contaminants Found in Differentially Abundant Microbes
4. Discussion
Supplementary Materials
Author Contributions
Funding
Institutional Review Board Statement
Informed Consent Statement
Data Availability Statement
Conflicts of Interest
References
- COVID-19 Dashboard by the Center for Systems Science and Engineering (CSSE) at Johns Hopkins University. Available online: https://gisanddata.maps.arcgis.com/apps/opsdashboard/index.html#/bda7594740fd40299423467b48e9ecf6 (accessed on 19 March 2021).
- Berlin, D.A.; Gulick, R.M.; Martinez, F.J. Severe Covid-19. N. Engl. J. Med. 2020, 383, 2451–2460. [Google Scholar] [CrossRef] [PubMed]
- Interim Clinical Guidance for Management of Patients with Confirmed Coronavirus Disease (COVID-19). Available online: https://www.cdc.gov/coronavirus/2019-ncov/hcp/clinical-guidance-management-patients.html (accessed on 19 March 2021).
- Byambasuren, O.; Cardona, M.; Bell, K.; Clark, J.; McLaws, M.L.; Glasziou, P. Estimating the extent of asymptomatic COVID-19 and its potential for community transmission: Systematic review and meta-analysis. J. Assoc. Med. Microbiol. Infect. Dis. Can. 2020, 5, 223–234. [Google Scholar] [CrossRef]
- Greenhalgh, T.; Knight, M.; Buxton, M.; Husain, L. Management of post-acute covid-19 in primary care. BMJ 2020, 370, 3026. [Google Scholar] [CrossRef]
- Siordia, J.A., Jr. Epidemiology and clinical features of COVID-19: A review of current literature. J. Clin. Virol. 2020, 127, 104357. [Google Scholar] [CrossRef] [PubMed]
- Ruan, Q.; Yang, K.; Wang, W.; Jiang, L.; Song, J. Clinical predictors of mortality due to COVID-19 based on an analysis of data of 150 patients from Wuhan, China. Intensive Care Med. 2020, 46, 846–848. [Google Scholar] [CrossRef]
- Coperchini, F.; Chiovato, L.; Croce, L.; Magri, F.; Rotondi, M. The cytokine storm in COVID-19: An overview of the involvement of the chemokine/chemokine-receptor system. Cytokine Growth Factor Rev. 2020, 53, 25–32. [Google Scholar] [CrossRef] [PubMed]
- Khatiwada, S.; Subedi, A. Lung microbiome and coronavirus disease 2019 (COVID-19): Possible link and implications. Hum. Microb. J. 2020, 17, 100073. [Google Scholar] [CrossRef]
- Yeoh, Y.K.; Zuo, T.; Lui, G.C.; Zhang, F.; Liu, Q.; Li, A.Y.; Chung, A.C.; Cheung, C.P.; Tso, E.Y.; Fung, K.S.; et al. Gut microbiota composition reflects disease severity and dysfunctional immune responses in patients with COVID-19. Gut 2021, 70, 698–706. [Google Scholar] [CrossRef]
- Dickson, R.P.; Schultz, M.J.; van der Poll, T.; Schouten, L.R.; Falkowski, N.R.; Luth, J.E.; Sjoding, M.W.; Brown, C.A.; Chanderraj, R.; Huffnagle, G.B.; et al. Biomarker Analysis in septic ICU patients (BASIC) consortium. Lung microbiota predict clinical outcomes in critically ill patients. Am. J. Respir. Crit. Care Med. 2020, 201, 555–563. [Google Scholar] [CrossRef]
- Sommariva, M.; Le Noci, V.; Bianchi, F.; Camelliti, S.; Balsari, A.; Tagliabue, E.; Sfondrini, L. The lung microbiota: Role in maintaining pulmonary immune homeostasis and its implications in cancer development and therapy. Cell. Mol. Life Sci. 2020, 77, 2739–2749. [Google Scholar] [CrossRef]
- Fan, J.; Li, X.; Gao, Y.; Zhou, J.; Wang, S.; Huang, B.; Wu, J.; Cao, Q.; Chen, Y.; Wang, Z.; et al. The lung tissue microbiota features of 20 deceased patients with COVID-19. J. Infect. 2020, 81, e64–e67. [Google Scholar] [CrossRef]
- Yuki, K.; Fujiogi, M.; Koutsogiannaki, S. COVID-19 pathophysiology: A review. Clin. Immunol. 2020, 215, 108427. [Google Scholar] [CrossRef]
- Arunachalam, P.S.; Wimmers, F.; Mok, C.K.P.; Perera, R.A.; Scott, M.; Hagan, T.; Sigal, N.; Feng, Y.; Bristow, L.; Tsang, O.T.Y.; et al. Systems biological assessment of immunity to mild versus severe COVID-19 infection in humans. Science 2020, 369, 1210–1220. [Google Scholar] [CrossRef] [PubMed]
- Hong, C.; Manimaran, S.; Shen, Y.; Perez-Rogers, J.F.; Byrd, A.L.; Castro-Nallar, E.; Crandall, K.A.; Johnson, W.E. PathoScope 2.0: A complete computational framework for strain identification in environmental or clinical sequencing samples. Microbiome 2014, 2, 33. [Google Scholar] [CrossRef]
- Johnson, W.E.; Li, C.; Rabinovic, A. Adjusting batch effects in microarray expression data using empirical Bayes methods. Biostatistics 2007, 8, 118–127. [Google Scholar] [CrossRef]
- Dobin, A.; Davis, C.A.; Schlesinger, F.; Drenkow, J.; Zaleski, C.; Jha, S.; Batut, P.; Chaisson, M.; Gingeras, T.R. STAR: Ultrafast universal RNA-seq aligner. Bioinformatics 2013, 29, 15–21. [Google Scholar] [CrossRef]
- Newman, A.M.; Steen, C.B.; Liu, C.L.; Gentles, A.J.; Chaudhuri, A.A.; Scherer, F.; Khodadoust, M.S.; Esfahani, M.S.; Luca, B.A.; Steiner, D.; et al. Determining cell type abundance and expression from bulk tissues with digital cytometry. Nat. Biotechnol. 2019, 37, 773–782. [Google Scholar] [CrossRef]
- Subramanian, A.; Tamayo, P.; Mootha, V.K.; Mukherjee, S.; Ebert, B.L.; Gillette, M.A.; Paulovich, A.; Pomeroy, S.L.; Golub, T.R.; Lander, E.S.; et al. Gene set enrichment analysis: A knowledge-based approach for interpreting genome-wide expression profiles. Proc. Natl. Acad. Sci. USA 2005, 102, 15545–15550. [Google Scholar] [CrossRef]
- Shannon, P.; Markiel, A.; Ozier, O.; Baliga, N.S.; Wang, J.T.; Ramage, D.; Amin, N.; Schwikowski, B.; Ideker, T. Cytoscape: A software environment for integrated models of biomolecular interaction networks. Genome Res. 2003, 13, 2498–2504. [Google Scholar] [CrossRef]
- Ross, A.C.; Stephensen, C.B. Vitamin A and retinoids in antiviral responses. FASEB J. 1996, 10, 979–985. [Google Scholar] [CrossRef] [PubMed]
- Pino-Lagos, K.; Guo, Y.; Noelle, R.J. Retinoic acid: A key player in immunity. BioFactors 2010, 36, 430–436. [Google Scholar] [CrossRef]
- O’Dwyer, D.N.; Dickson, R.P.; Moore, B.B. The lung microbiome, immunity, and the pathogenesis of chronic lung disease. J. Immunol. 2016, 196, 4839–4847. [Google Scholar] [CrossRef] [PubMed]
- Leng, L.; Cao, R.; Ma, J.; Mou, D.; Zhu, Y.; Li, W.; Lv, L.; Gao, D.; Zhang, S.; Gong, F.; et al. Pathological features of COVID-19-associated lung injury: A preliminary proteomics report based on clinical samples. Sig. Transduct. Target. Ther. 2020, 5, 240. [Google Scholar] [CrossRef] [PubMed]
- Burgos-Portugal, J.A.; Kaakoush, N.O.; Raftery, M.J.; Mitchell, H.M. Pathogenic potential of Campylobacter ureolyticus. Infect. Immun. 2012, 80, 883–890. [Google Scholar] [CrossRef]
- Aguilera-Arreola, M.G.; Ostria-Hernández, M.L.; Albarrán-Fernández, E.; Juárez-Enriquez, S.R.; Majalca-Martínez, C.; Rico-Verdín, B.; Ruiz, E.A.; Ruiz-Palma, M.; Morales-García, M.R.; Contreras-Rodríguez, A. Correct identification of ochrobactrum anthropi from blood culture using 16rRNA sequencing: A first case report in an immunocompromised patient in Mexico. Front. Med. 2018, 5, 205. [Google Scholar] [CrossRef]
- Romero Gómez, M.P.; Peinado Esteban, A.M.; Sobrino Daza, J.A.; Sáez Nieto, J.A.; Alvarez, D.; Peña García, P. Prosthetic mitral valve endocarditis due to Ochrobactrum anthropi: Case report. J. Clin. Microbiol. 2004, 42, 3371–3373. [Google Scholar] [CrossRef]
- Mahmood, M.S.; Sarwari, A.R.; Khan, M.A.; Sophie, Z.; Khan, E.; Sami, S. Infective endocarditis and septic embolization with Ochrobactrum anthropi: Case report and review of literature. J. Infect. 2000, 40, 287–290. [Google Scholar] [CrossRef]
- Braun, M.; Jonas, J.B.; Schönherr, U.; Naumann, G.O. Ochrobactrum anthropi endophthalmitis after uncomplicated cataract surgery. Am. J. Ophthalmol. 1996, 122, 272–273. [Google Scholar] [CrossRef]
- Chang, H.J.; Christenson, J.C.; Pavia, A.T.; Bobrin, B.D.; Bland, L.A.; Carson, L.A.; Arduino, M.J.; Verma, P.; Aguero, S.M.; Carroll, K.; et al. Ochrobactrum anthropi meningitis in pediatric pericardial allograft transplant recipients. J. Infect. Dis. 1996, 173, 656–660. [Google Scholar] [CrossRef][Green Version]
- Jelveh, N.; Cunha, B.A. Ochrobactrum anthropi bacteremia. Heart Lung 1999, 28, 145–146. [Google Scholar] [CrossRef]
- Yazdanifar, M.; Mashkour, N.; Bertaina, A. Making a case for using γδ T cells against SARS-CoV-2. Crit. Rev. Microbiol. 2020, 46, 689–702. [Google Scholar] [CrossRef]
- Martini, A.M.; Moricz, B.S.; Ripperger, A.K.; Tran, P.M.; Sharp, M.E.; Forsythe, A.N.; Kulhankova, K.; Salgado-Pabón, W.; Jones, B.D. Association of novel Streptococcus sanguinis virulence factors with pathogenesis in a native valve infective endocarditis model. Front. Microbiol. 2020, 11, 10. [Google Scholar] [CrossRef]
- De Castilhos, J.; Zamir, E.; Hippchen, T.; Rohrbach, R.; Schmidt, S.; Hengler, S.; Schumacher, H.; Neubauer, M.; Kunz, S.; Müller-Esch, T.; et al. COVID-19 severity and complications associated with low diversity, dysbiosis and predictive metagenome features of the oropharyngeal microbiome. Res. Sq. 2021. [Google Scholar] [CrossRef]
- Ferreira-Gomes, M.; Kruglov, A.; Durek, P.; Heinrich, F.; Tizian, C.; Heinz, G.A.; Pascual-Reguant, A.; Du, W.; Mothes, R.; Fan, C.; et al. In severe COVID-19, SARS-CoV-2 induces a chronic, TGF-β-dominated adaptive immune response. medRxiv 2020. [Google Scholar] [CrossRef]
- Irshad, M.; Nasir, N.; Hashmi, U.H.; Farooqi, J.; Mahmood, S.F. Invasive pulmonary infection by Syncephalastrum species: Two case reports and review of literature. IDCases 2020, 21, e00913. [Google Scholar] [CrossRef] [PubMed]
- Pérez-Torrado, R.; Querol, A. Opportunistic strains of saccharomyces cerevisiae: A potential risk sold in food products. Front. Microbiol. 2016, 6, 1522. [Google Scholar] [CrossRef]
- Trofa, D.; Gácser, A.; Nosanchuk, J.D. Candida parapsilosis, an emerging fungal pathogen. Clin. Microbiol. Rev. 2008, 21, 606–625. [Google Scholar] [CrossRef]
- Horwath, M.C.; Fecher, R.A.; Deepe, G.S., Jr. Histoplasma capsulatum, lung infection and immunity. Future. Microbiol. 2015, 10, 967–975. Available online: https://www.nature.com/articles/s41577-020-0288-3 (accessed on 1 January 2021). [CrossRef] [PubMed]
- Rehwinkel, J.; Gack, M.U. RIG-I-like receptors: Their regulation and roles in RNA sensing. Nat. Rev. Immunol. 2020, 20, 537–551. [Google Scholar] [CrossRef]
- Orekhov, A.N.; Orekhova, V.A.; Nikiforov, N.G.; Myasoedova, V.A.; Grechko, A.V.; Romanenko, E.B.; Zhang, D.; Chistiakov, D.A. Monocyte differentiation and macrophage polarization. Vessel Plus 2019, 3, 10. [Google Scholar] [CrossRef]
- Chackraborty, S. SARS-Cov2 enables anaerobic bacteria (Prevotella, et al) to colonize the lungs disrupting homeostasis, causing long-drawn chronic symptoms, and acute severe symptoms (ARDS, septic shock, clots, arterial stroke) which finds resonance, with key differences, in the ‘forgotten disease’ Lemierre Syndrome, enabled by Epstein Barr Virus. OSF Prepr. 2020. [Google Scholar] [CrossRef]
- Ren, L.; Wang, Y.; Zhong, J.; Zhang, D.; Xiao, Y.; Yang, J.; Fan, G.; Guo, L.; Shen, Z.; Liu, W.; et al. Dynamics of the upper respiratory tract microbiota and its association with fatality in COVID-19 patients. Res. Sq. 2020. [Google Scholar] [CrossRef]
- Xu, R.; Lu, R.; Zhang, T.; Zhang, T.; Wu, Q.; Cai, W.; Han, X.; Wan, Z.; Jin, X.; Zhang, Z.; et al. Temporal association between human upper respiratory and gut bacterial microbiomes during the course of COVID-19 in adults. Commun. Biol. 2021, 4, 240. [Google Scholar] [CrossRef]
- Soye, K.J.; Trottier, C.; Richardson, C.D.; Ward, B.J.; Miller, W.H., Jr. RIG-I is required for the inhibition of measles virus by retinoids. PLoS ONE 2011, 6, 22323. [Google Scholar] [CrossRef] [PubMed]
- Boulanger, M.; Molina, E.; Wang, K.; Kickler, T.; Xu, Y.; Garibaldi, B.T. Peripheral plasma cells associated with mortality benefit in severe COVID-19: A marker of disease resolution. Am. J. Med. 2021, 1, 40. [Google Scholar] [CrossRef]
- Man, S.M. The clinical importance of emerging Campylobacter species. Nat. Rev. Gastroenterol. Hepatol. 2011, 8, 669. [Google Scholar] [CrossRef]
- Markazi, A.; Bracci, P.M.; McGrath, M.; Gao, S.J. Pseudomonas aeruginosa stimulates inflammation and enhances Kaposi’s sarcoma herpesvirus-induced cell proliferation and cellular transformation through both lipopolysaccharide and flagellin. mBio 2020, 11, e02843-20. [Google Scholar] [CrossRef]
- Rajkumari, N.; John, N.V.; Mathur, P.; Misra, M.C. Antimicrobial resistance in Pseudomonas sp. causing infections in trauma patients: A 6 year experience from a South Asian country. J. Glob. Infect. Dis. 2014, 6, 182–185. [Google Scholar] [CrossRef] [PubMed]
- Lin, C.K.; Kazmierczak, B.I. Inflammation: A double-edged sword in the response to Pseudomonas aeruginosa infection. J. Innate Immun. 2017, 9, 250–261. [Google Scholar] [CrossRef]


Publisher’s Note: MDPI stays neutral with regard to jurisdictional claims in published maps and institutional affiliations. |
© 2021 by the authors. Licensee MDPI, Basel, Switzerland. This article is an open access article distributed under the terms and conditions of the Creative Commons Attribution (CC BY) license (https://creativecommons.org/licenses/by/4.0/).
Share and Cite
Dereschuk, K.; Apostol, L.; Ranjan, I.; Chakladar, J.; Li, W.T.; Rajasekaran, M.; Chang, E.Y.; Ongkeko, W.M. Identification of Lung and Blood Microbiota Implicated in COVID-19 Prognosis. Cells 2021, 10, 1452. https://doi.org/10.3390/cells10061452
Dereschuk K, Apostol L, Ranjan I, Chakladar J, Li WT, Rajasekaran M, Chang EY, Ongkeko WM. Identification of Lung and Blood Microbiota Implicated in COVID-19 Prognosis. Cells. 2021; 10(6):1452. https://doi.org/10.3390/cells10061452
Chicago/Turabian StyleDereschuk, Kypros, Lauren Apostol, Ishan Ranjan, Jaideep Chakladar, Wei Tse Li, Mahadevan Rajasekaran, Eric Y. Chang, and Weg M. Ongkeko. 2021. "Identification of Lung and Blood Microbiota Implicated in COVID-19 Prognosis" Cells 10, no. 6: 1452. https://doi.org/10.3390/cells10061452
APA StyleDereschuk, K., Apostol, L., Ranjan, I., Chakladar, J., Li, W. T., Rajasekaran, M., Chang, E. Y., & Ongkeko, W. M. (2021). Identification of Lung and Blood Microbiota Implicated in COVID-19 Prognosis. Cells, 10(6), 1452. https://doi.org/10.3390/cells10061452