
Nucleoporin TPR Affects C2C12 Myogenic Differentiation via Regulation of Myh4 Expression

 , , ,
, , , 
Abstract
:
1. Introduction
2. Materials and Methods
2.1. Cell Culture, Differentiation, Plasmid Transfection, esiRNA Transfection and shRNA Transformation
2.2. Western Blots
2.3. Immunofluorescence
2.4. Antibodies
2.5. Image Analysis
2.6. Chromatin Immunoprecipitation
2.7. Evaluation of ChIP-Seq Data
2.8. Quantitative PCR
3. Results
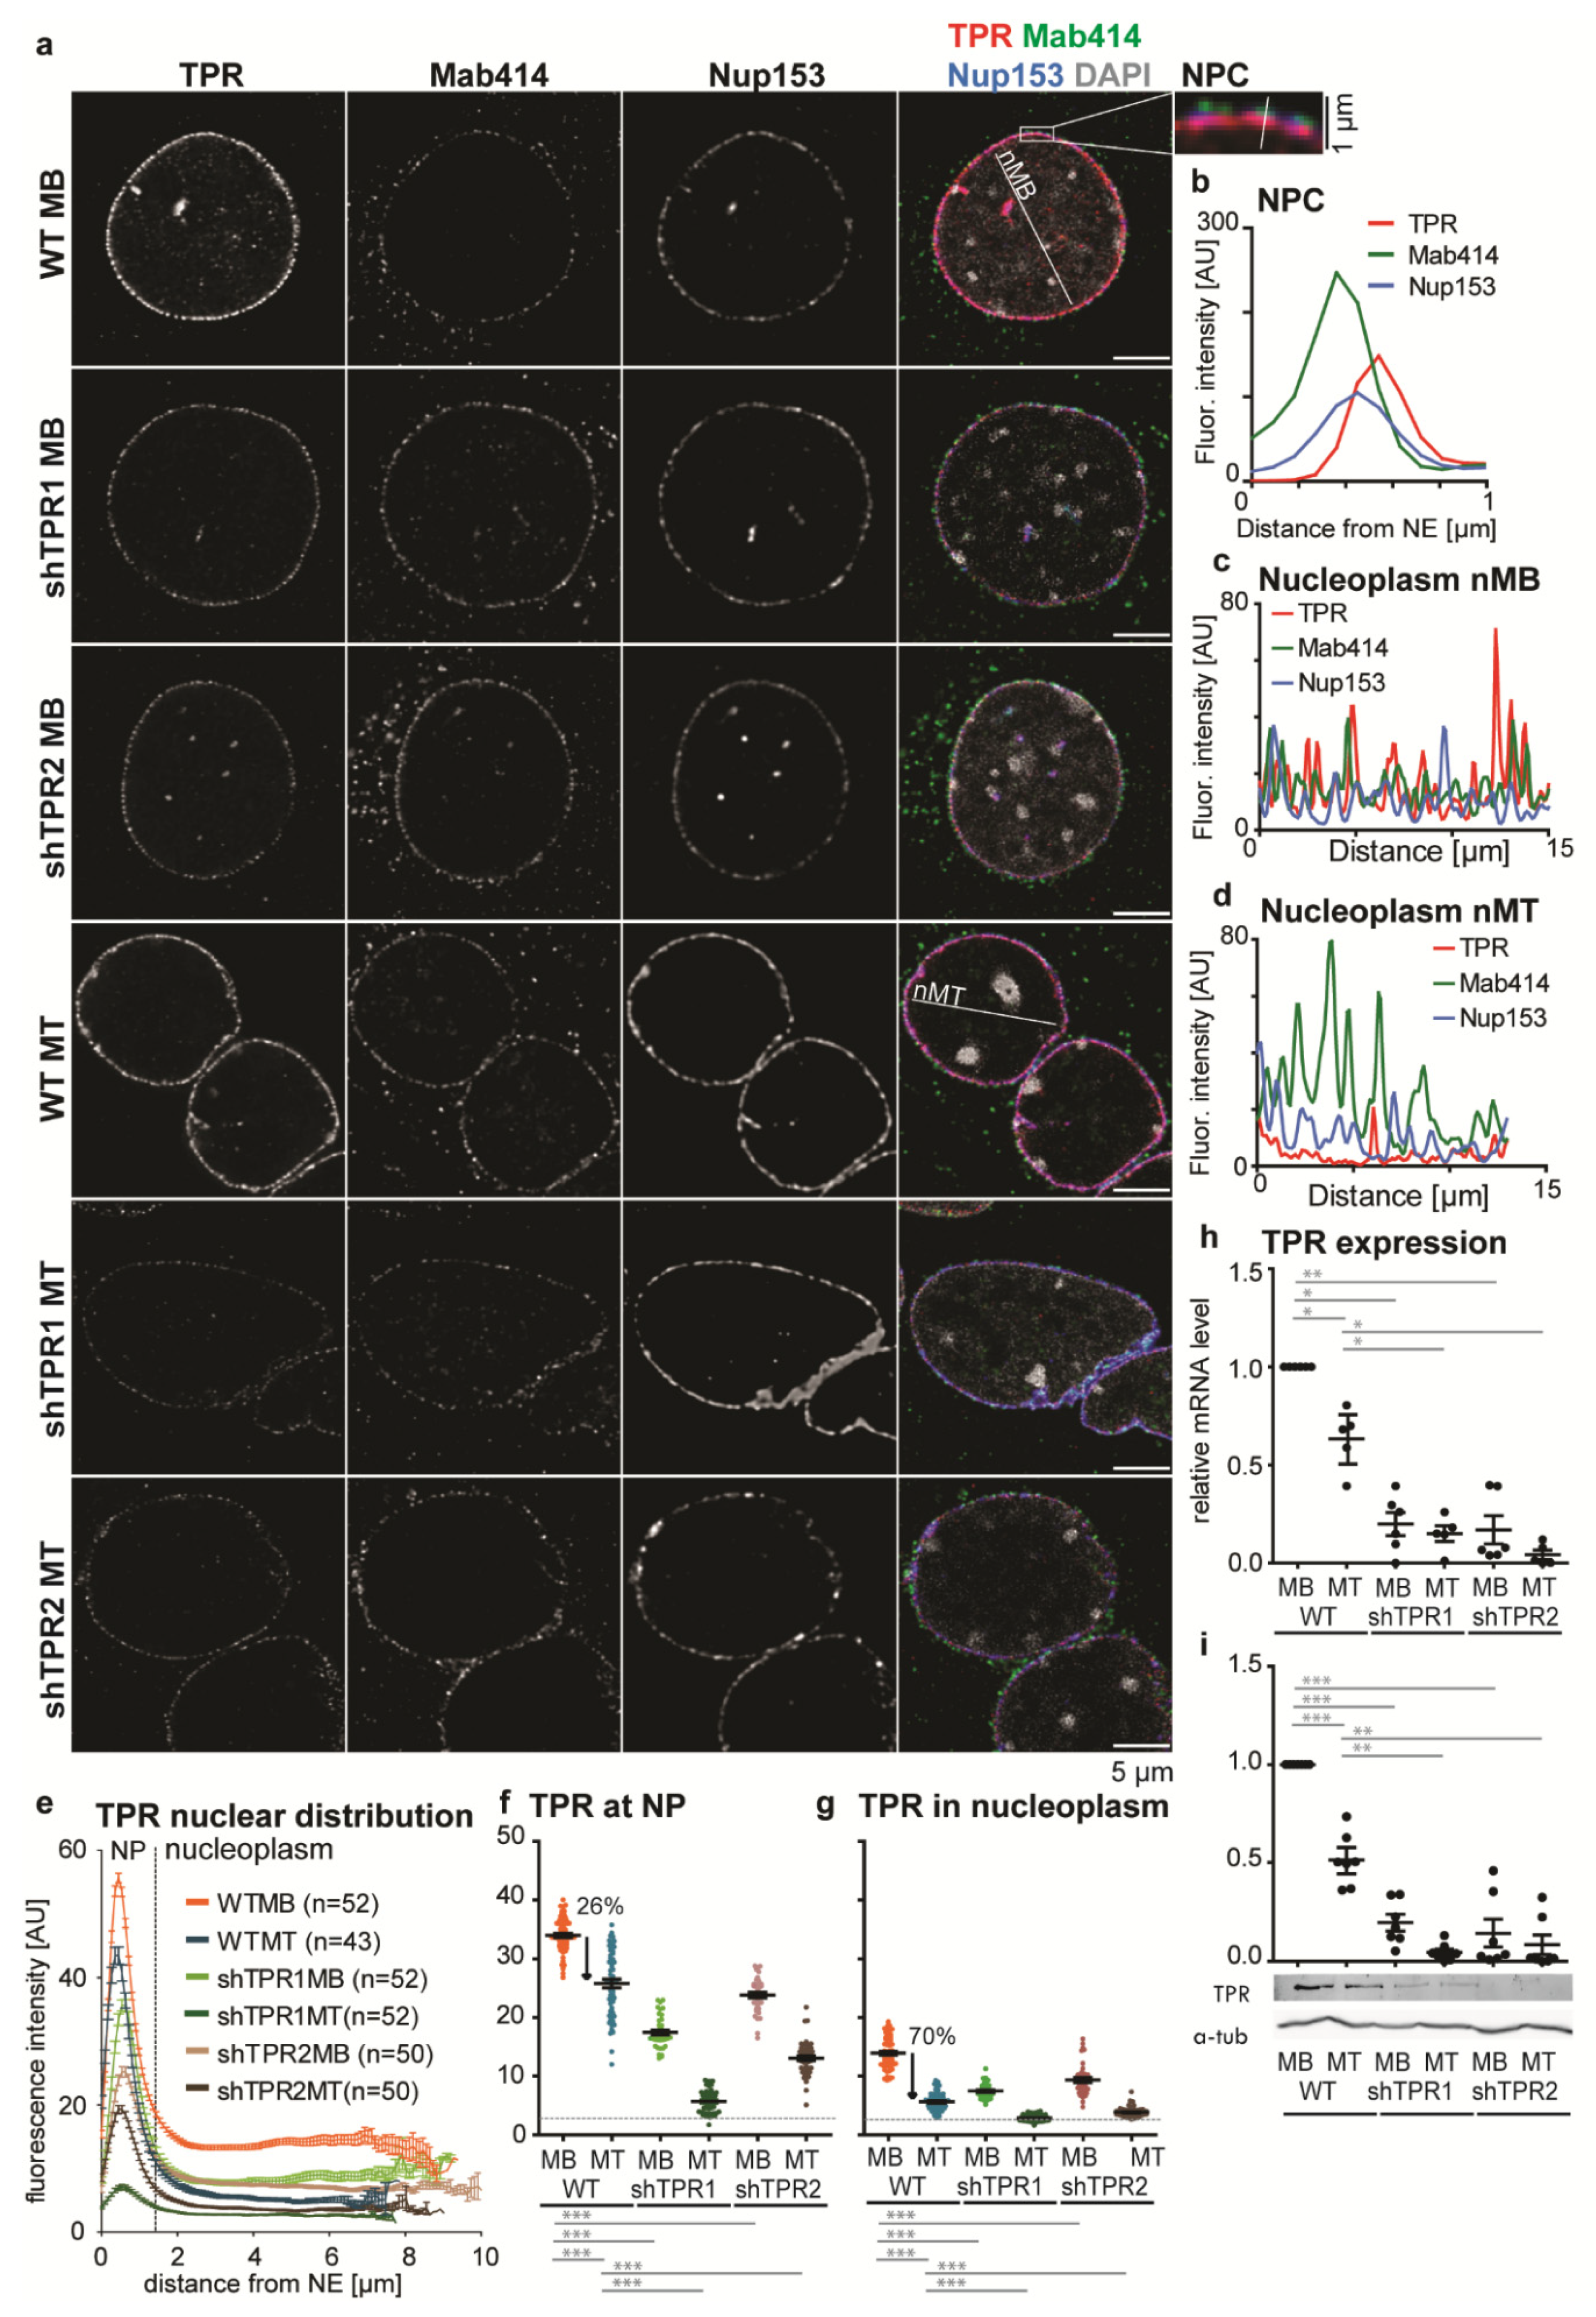
3.1. A Nucleoplasmic Pool of TPR Is Present in C2C12 Myoblasts and Diminishes in C2C12 Myotubes
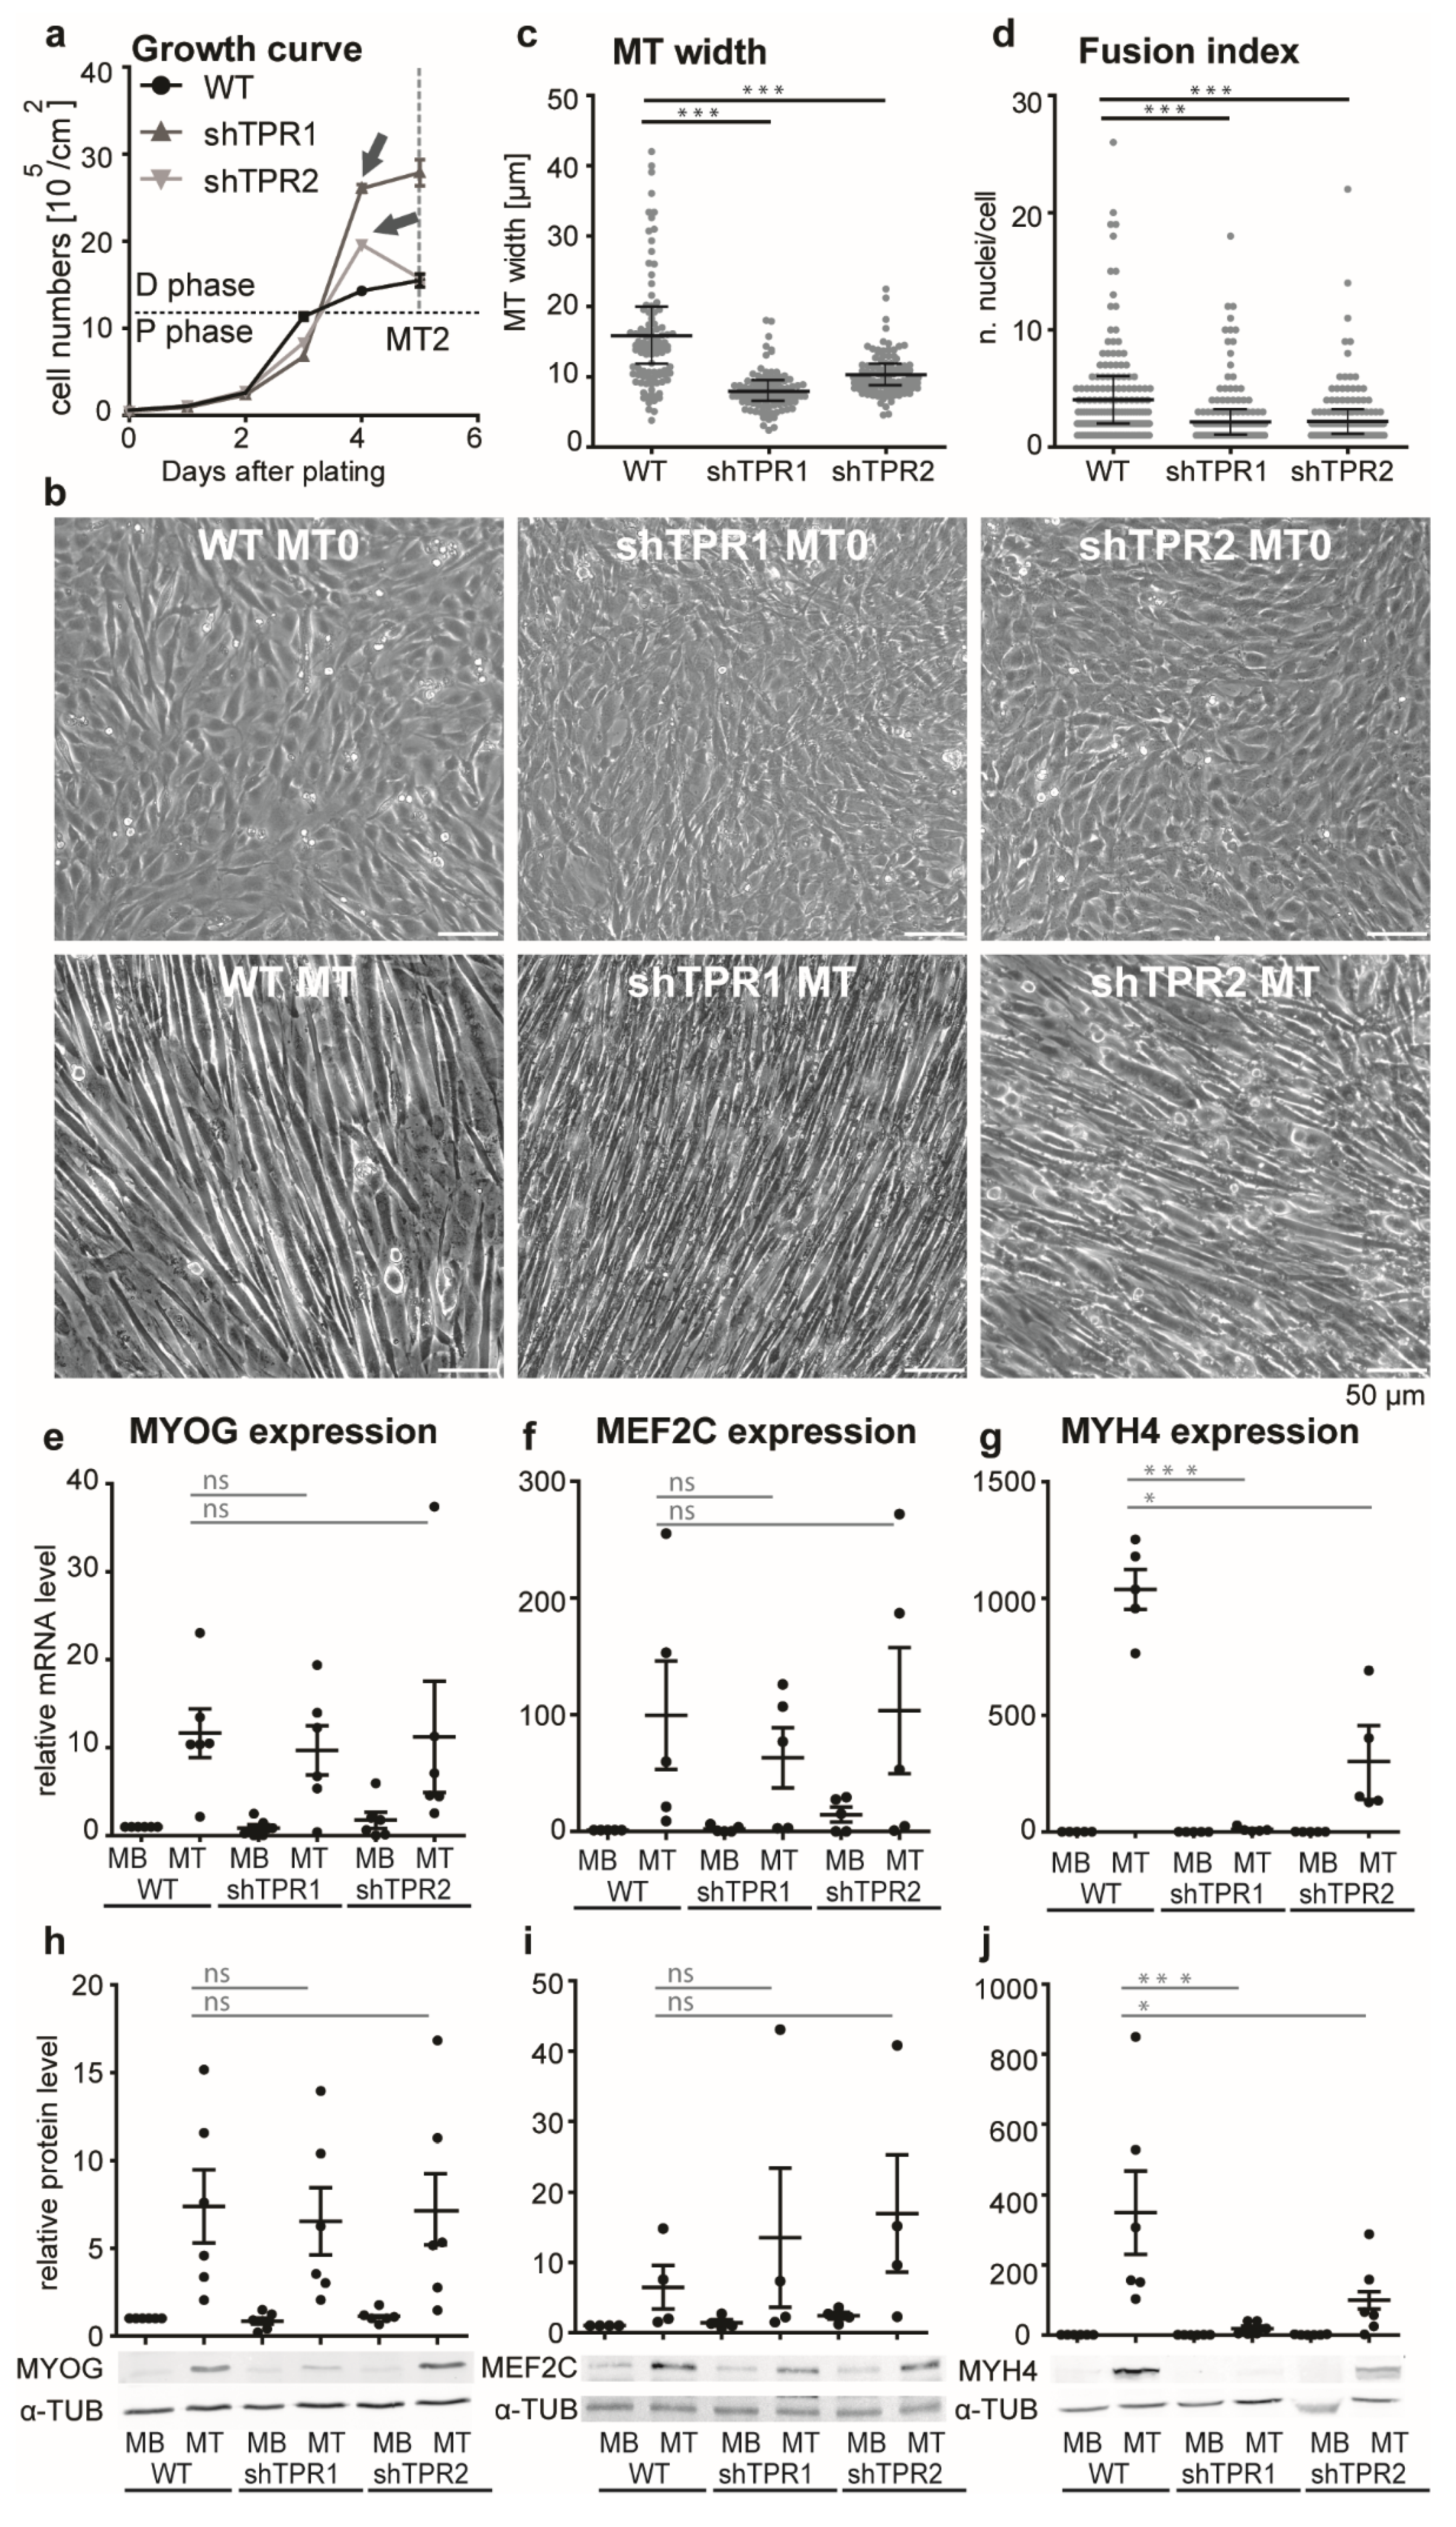
3.2. TPR Affects C2C12 Differentiation
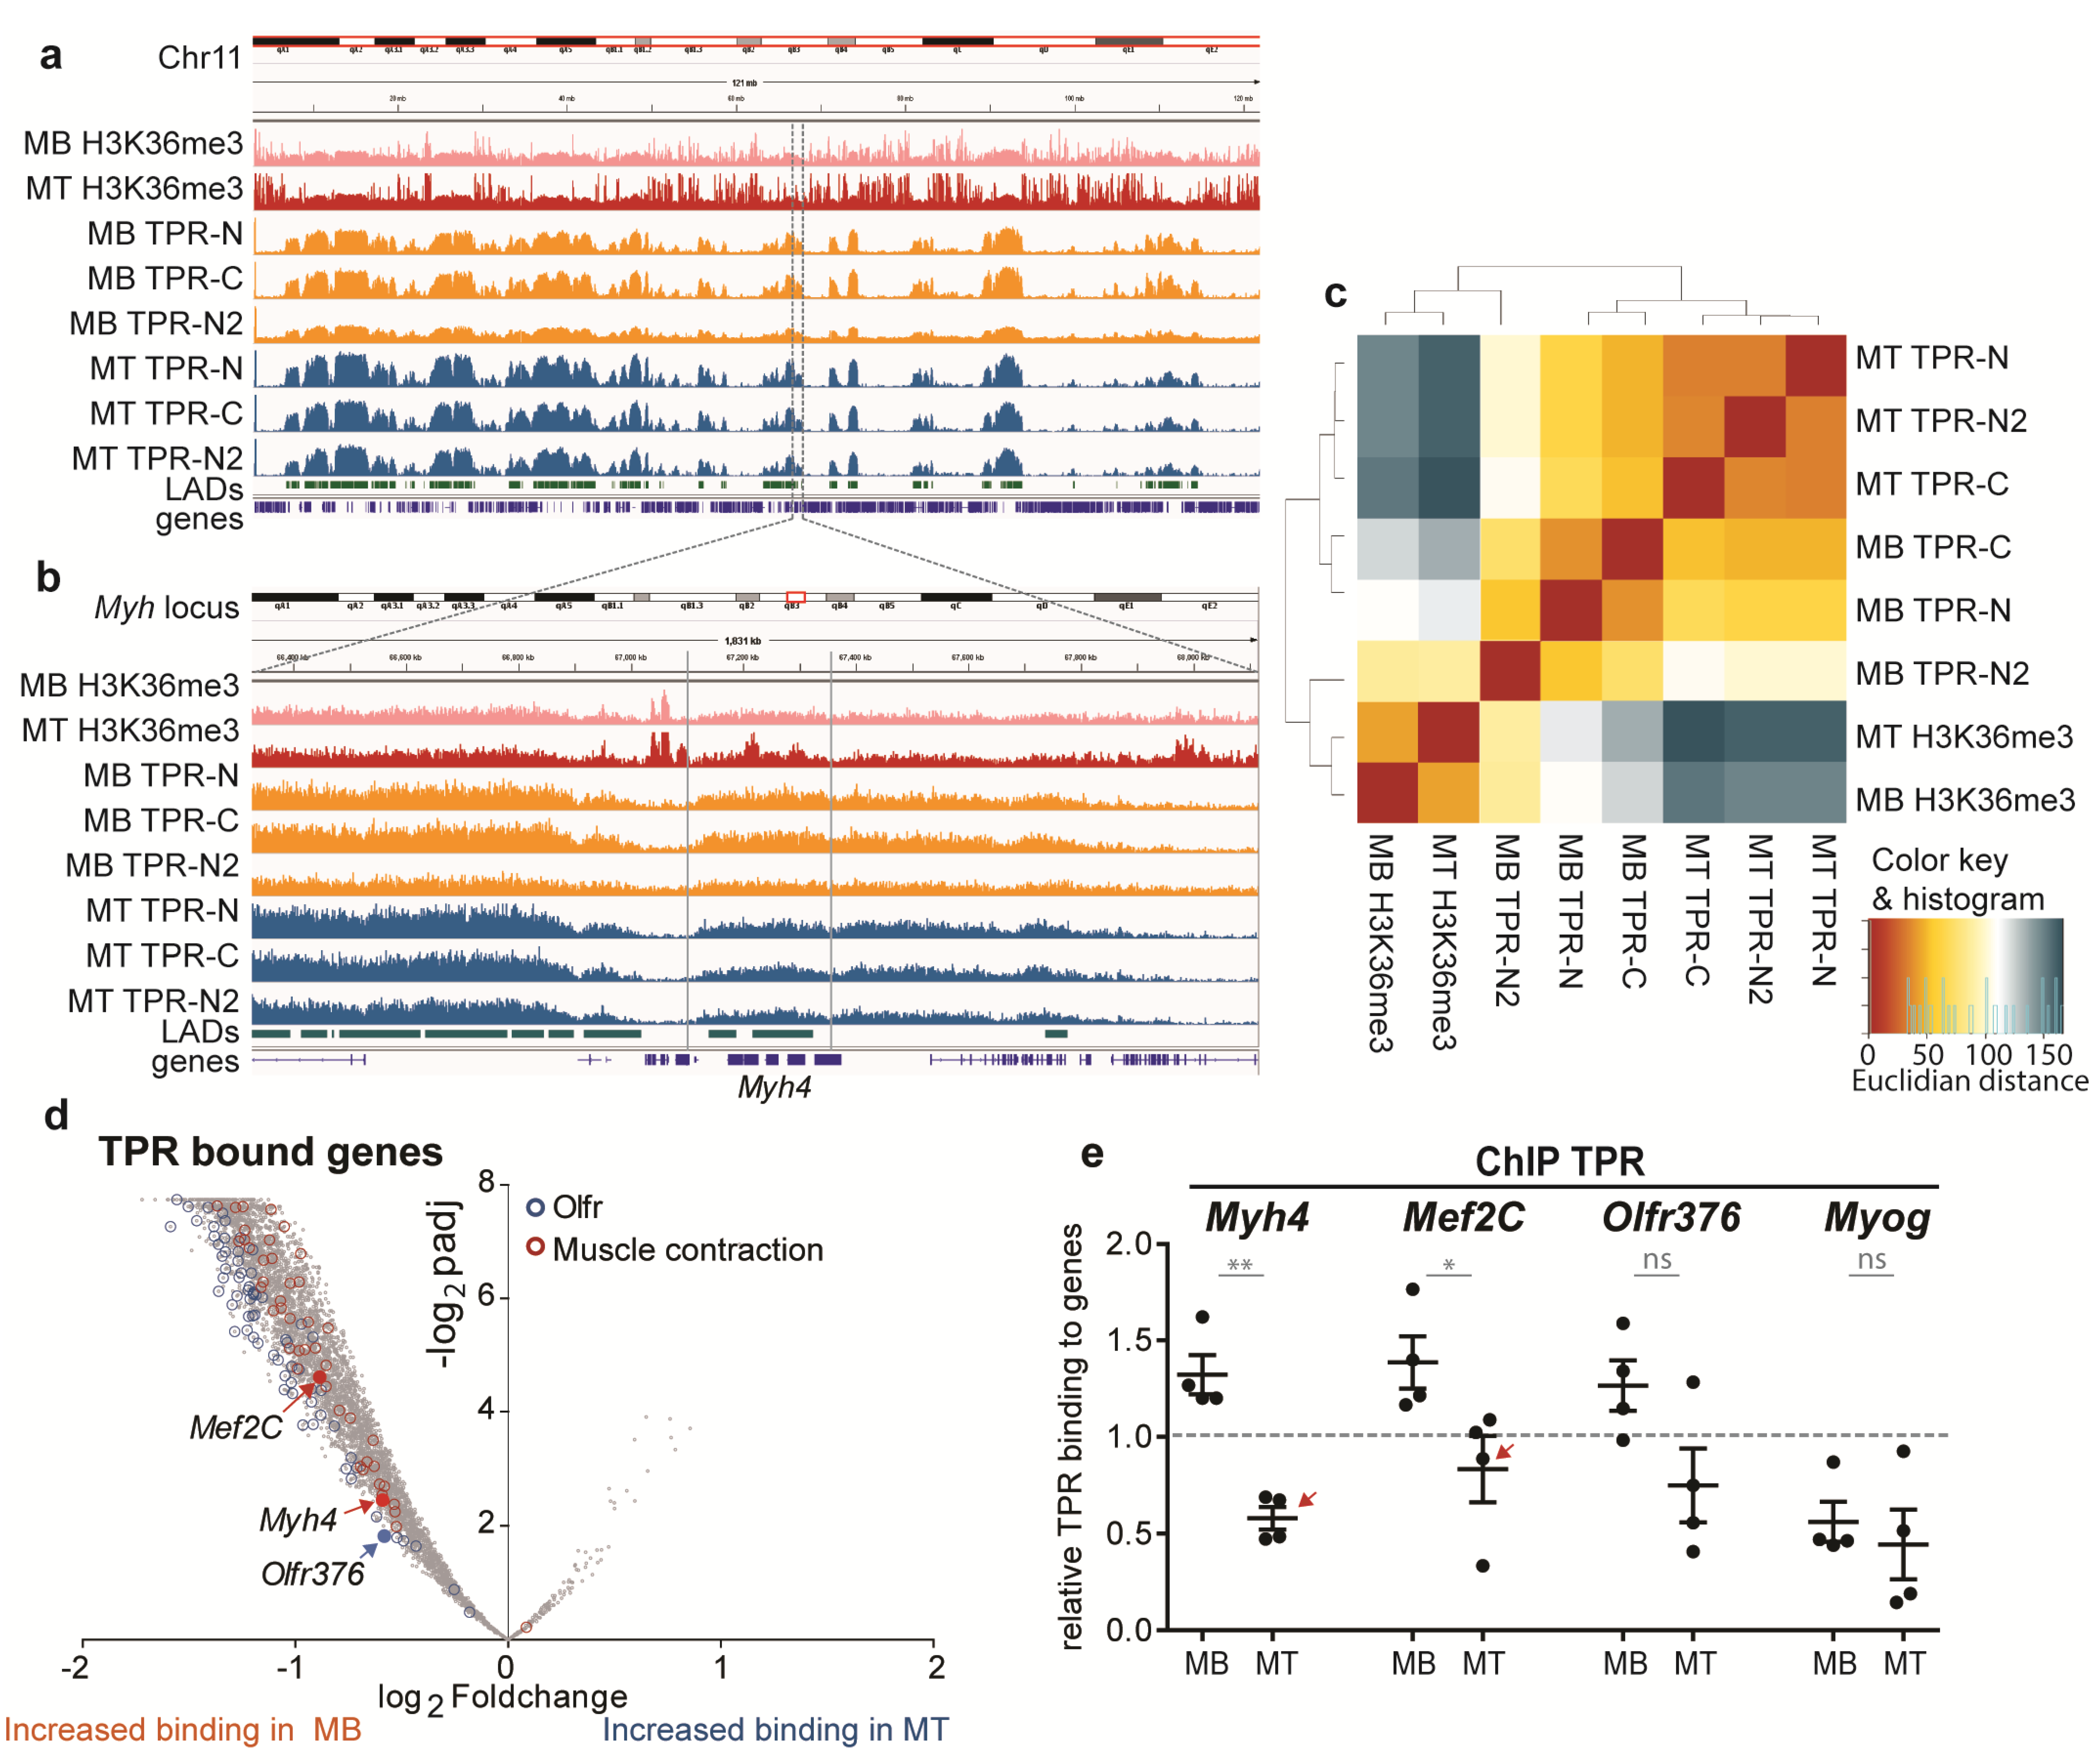
3.3. TPR Binds Megadomains of DNA That Partly Overlap with LADs
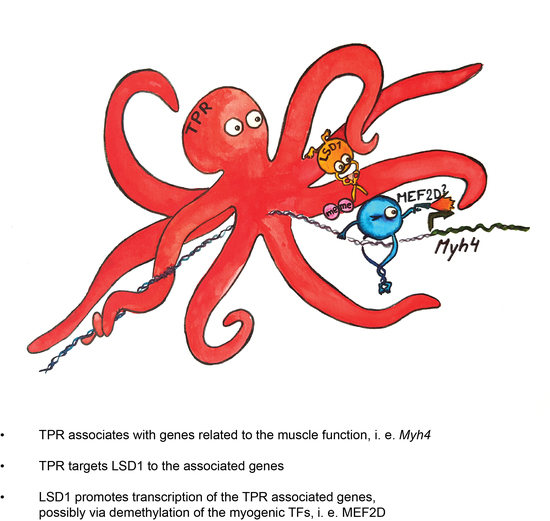
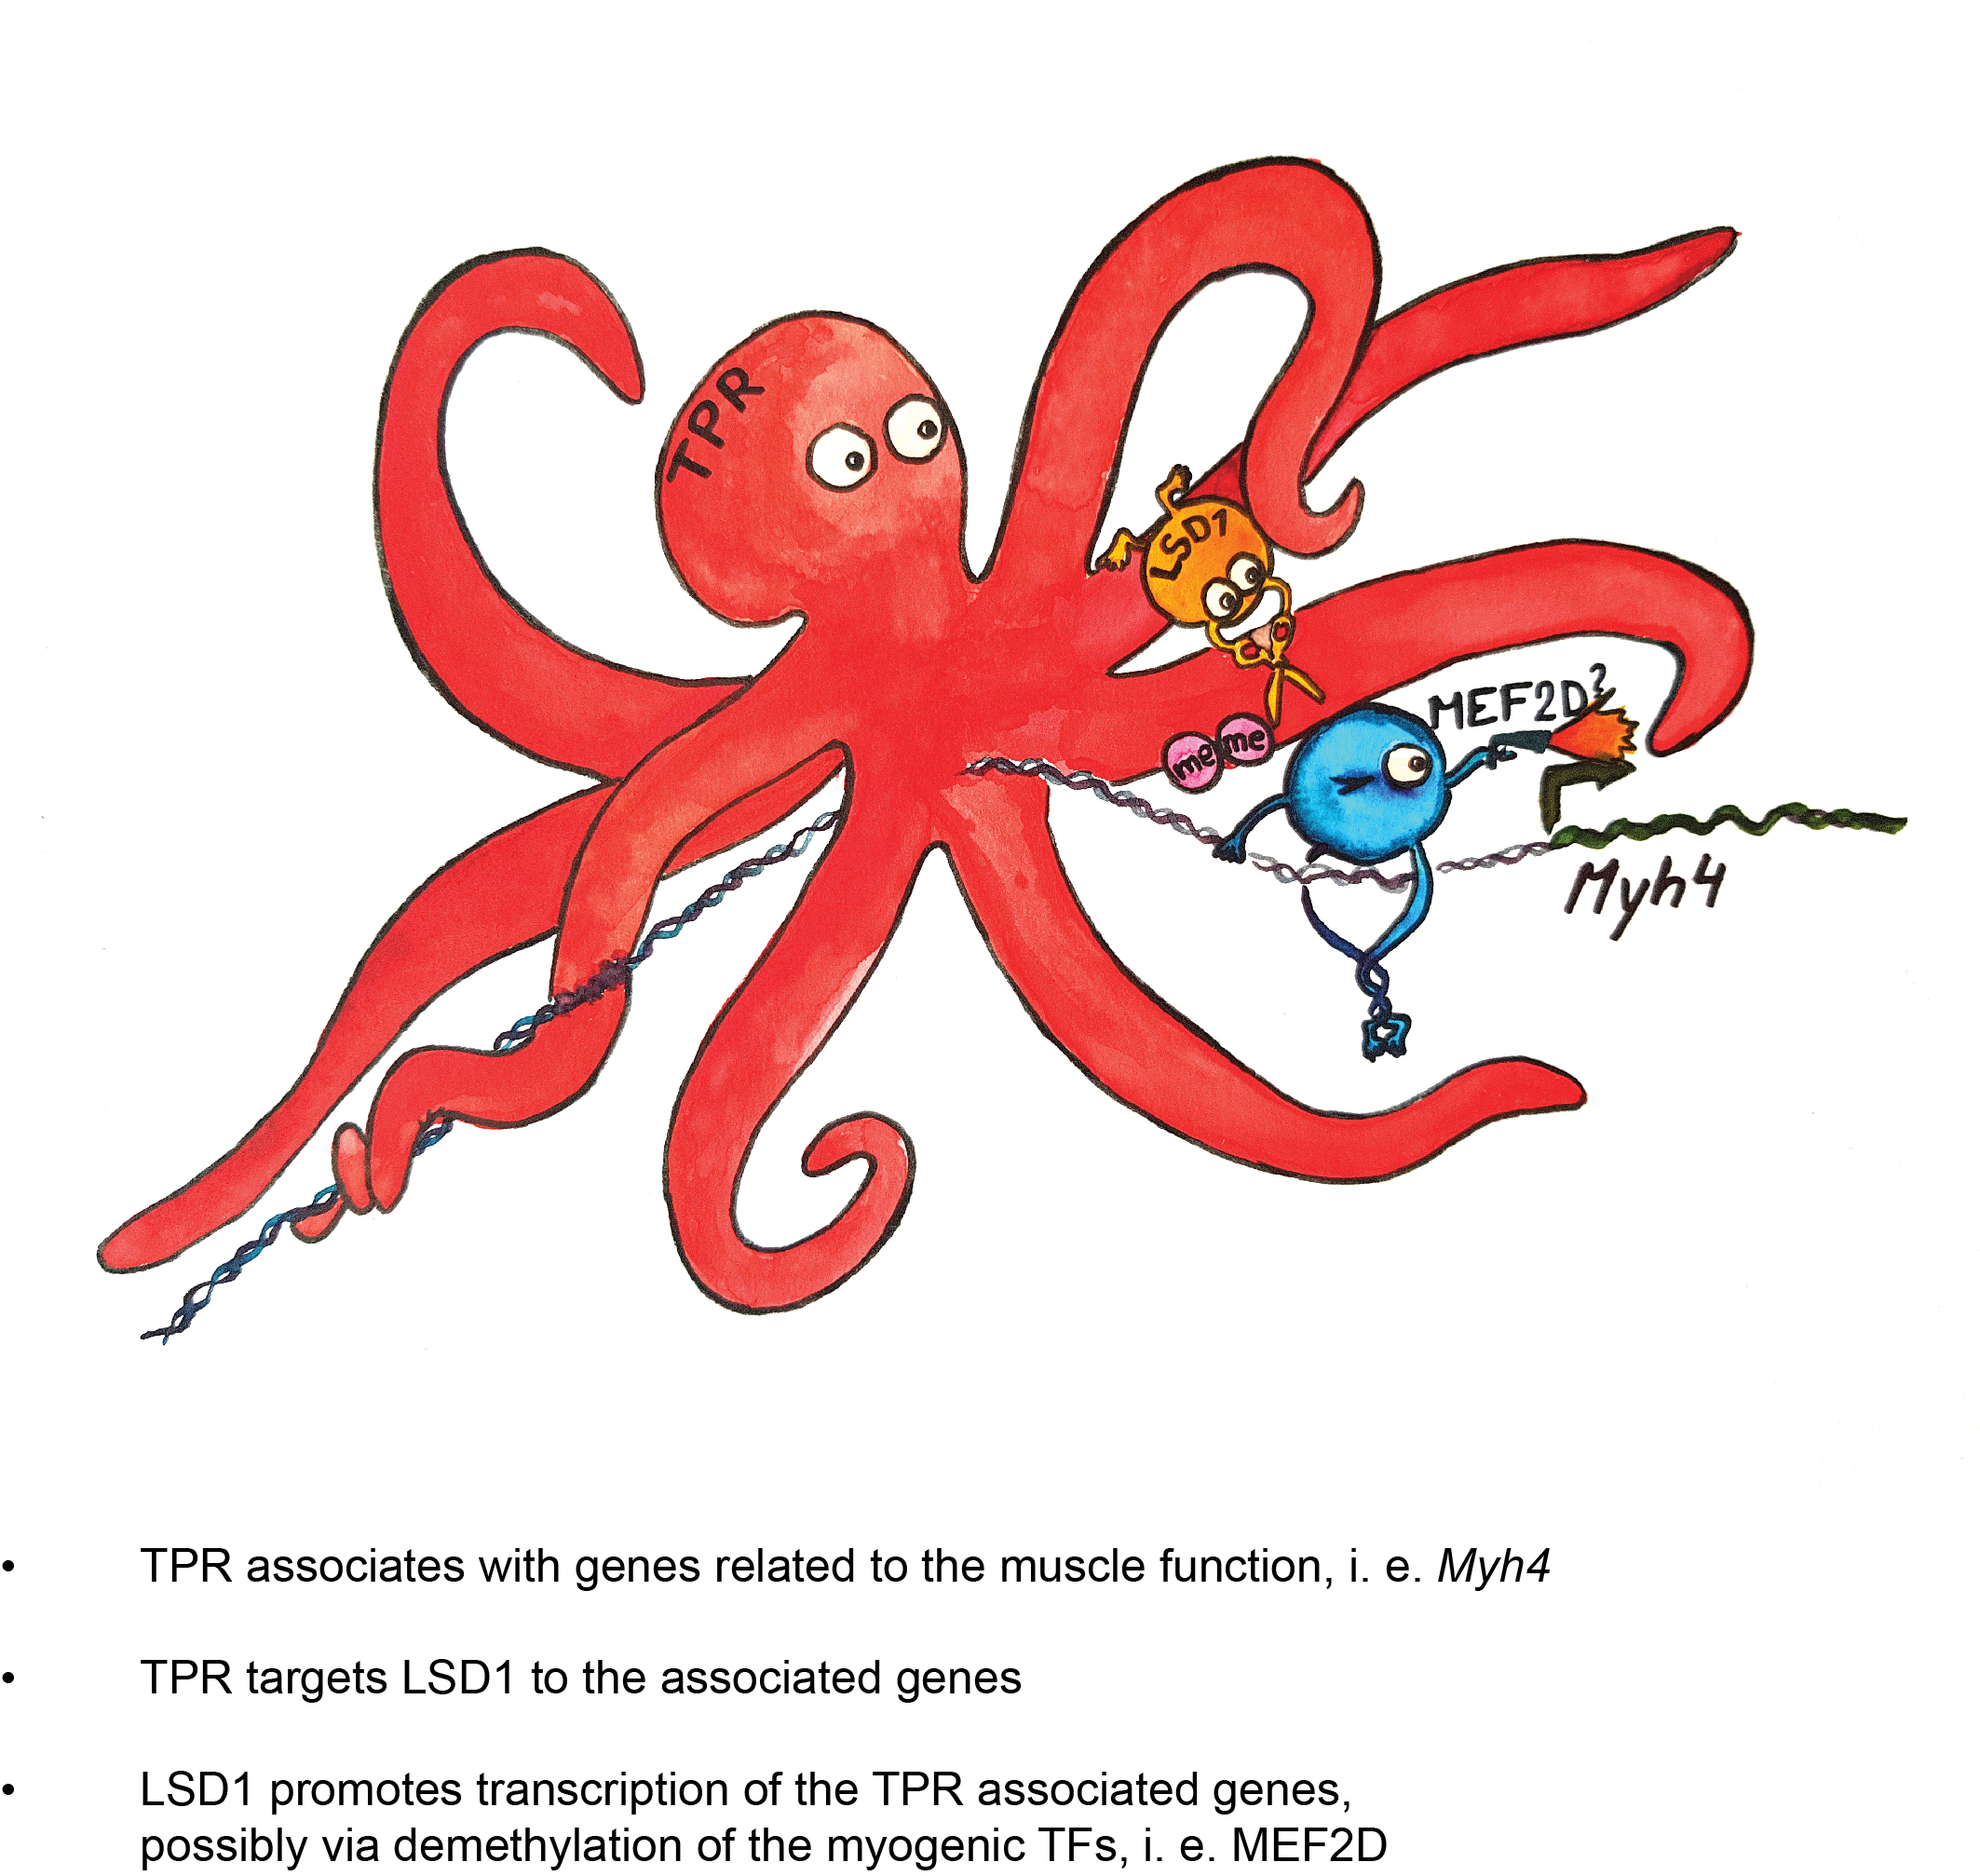
3.4. TPR Is Present at Myh4 and Other Genes Associated with Muscle Differentiation and Promotes Their Expression
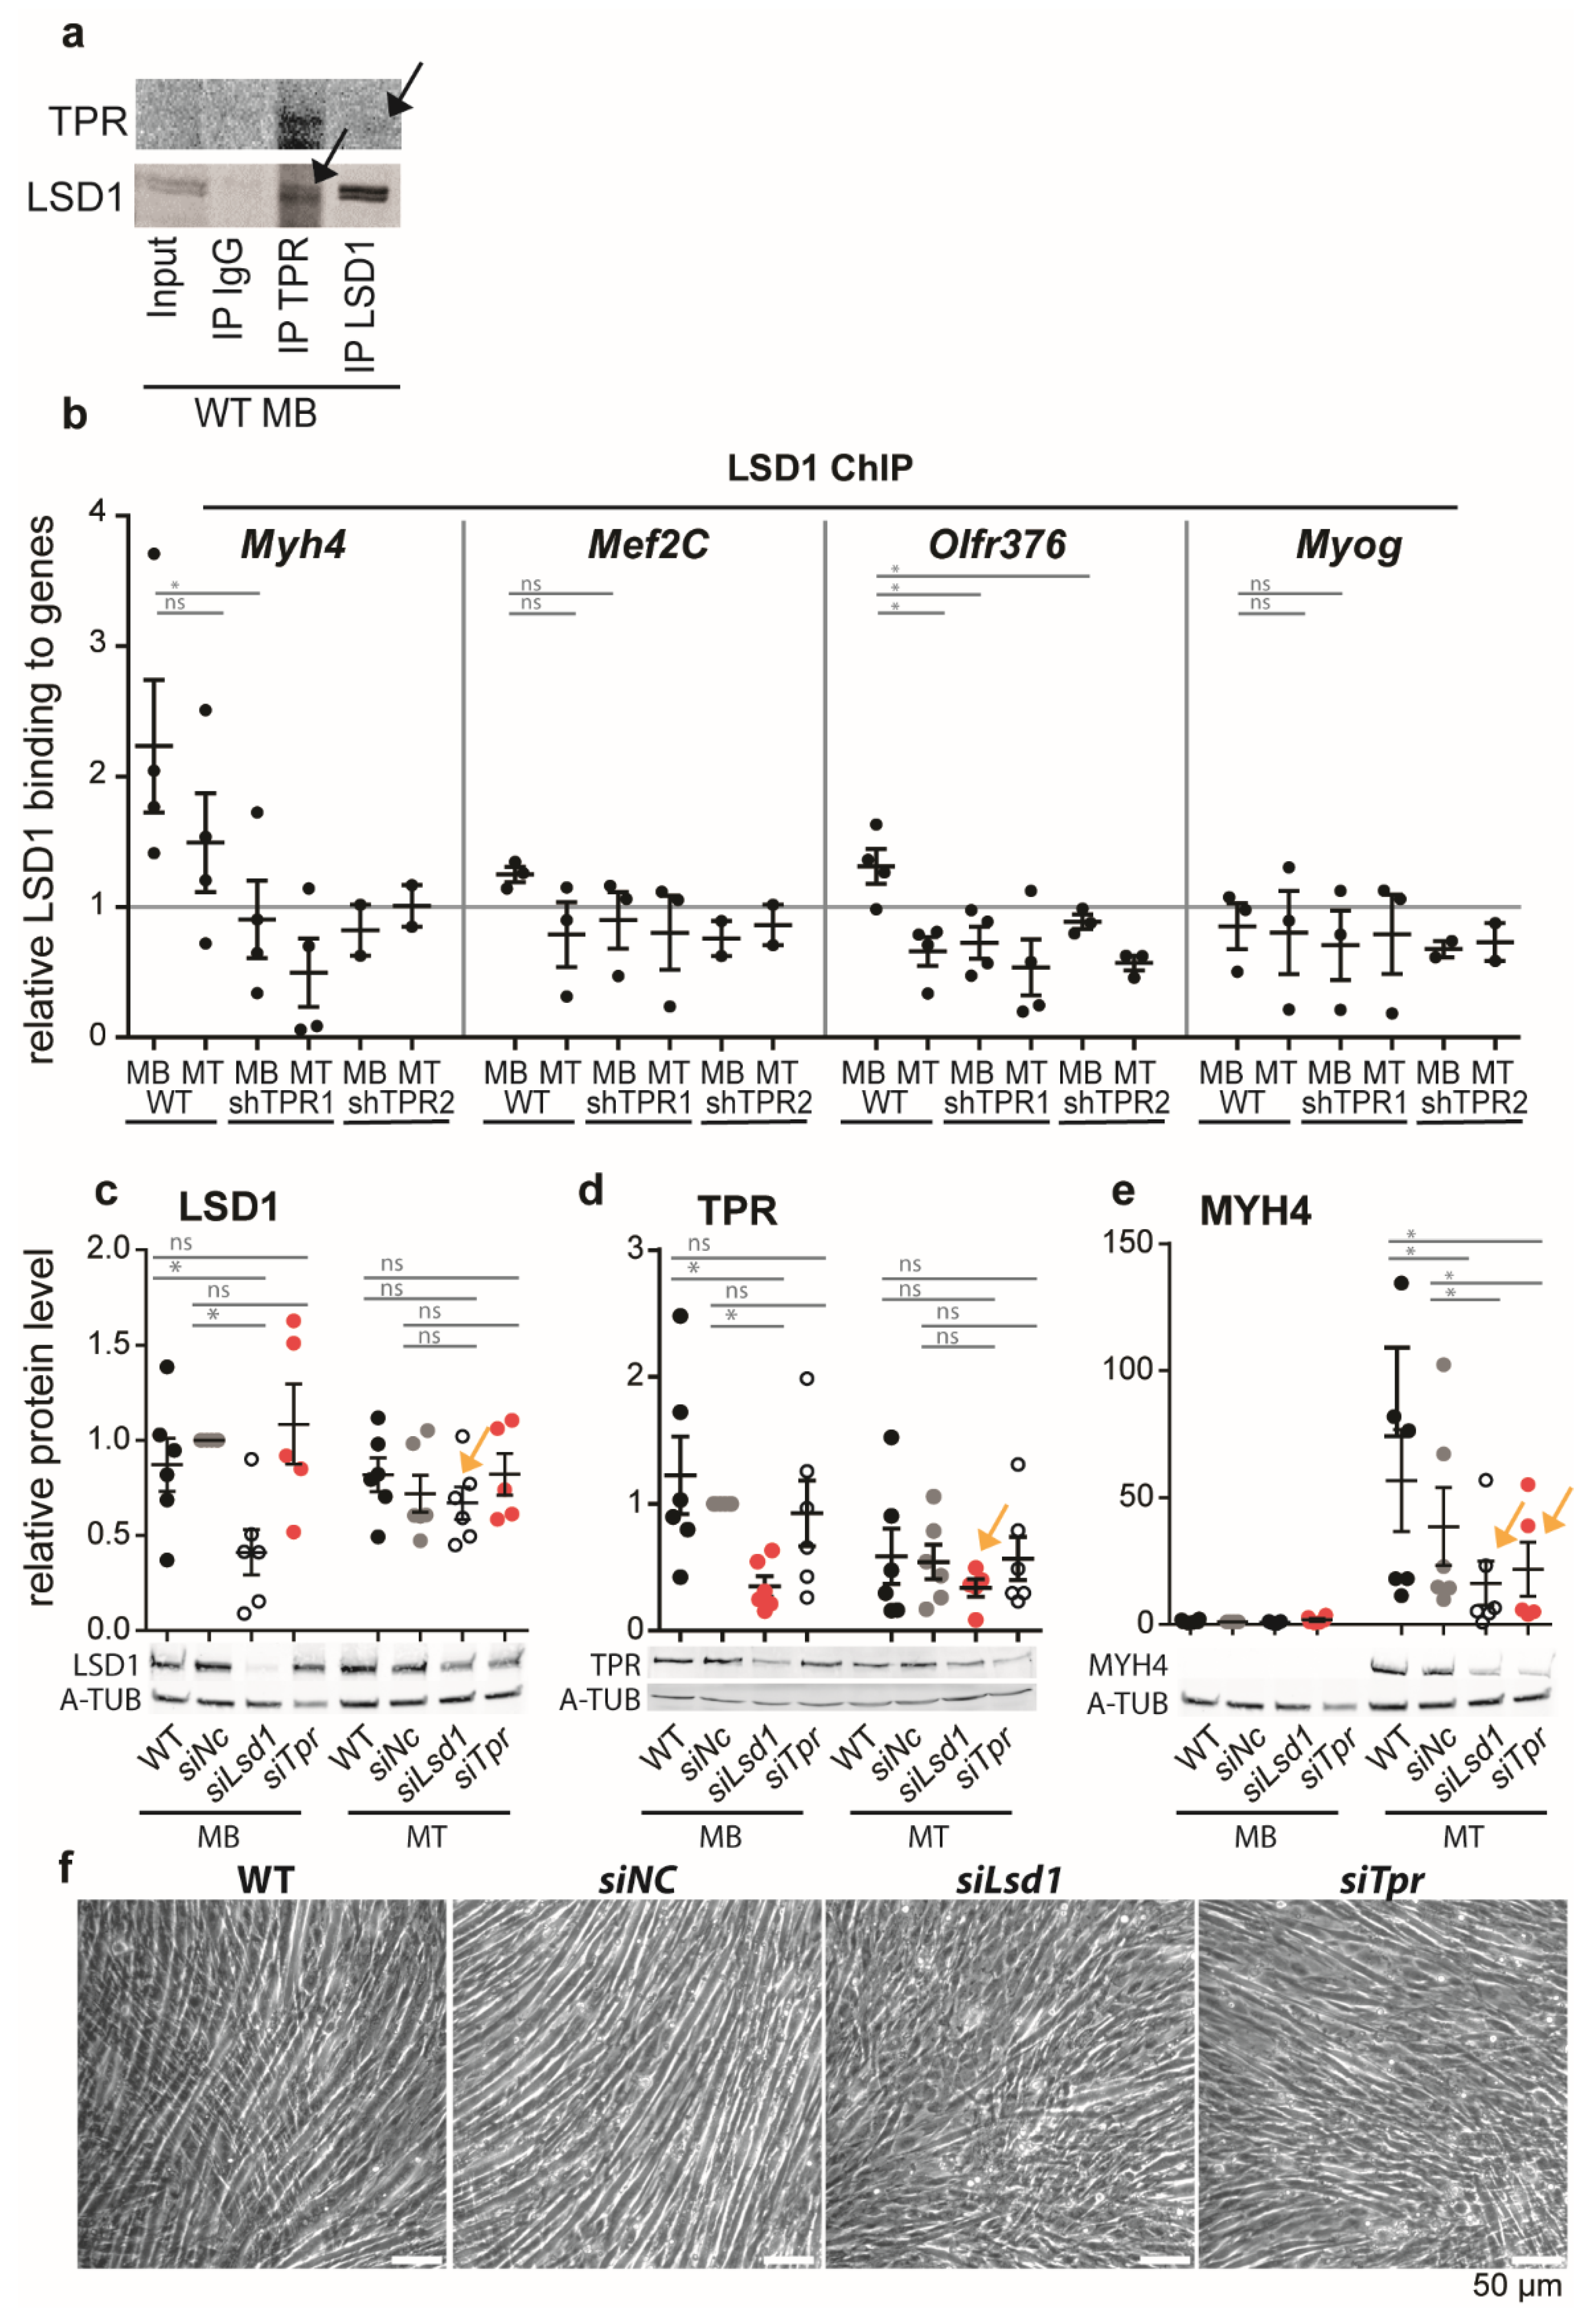
3.5. TPR Targets LSD1 to Myh4 and Olfr376 but Not to Mef2C
4. Discussion
Supplementary Materials
Author Contributions
Funding
Institutional Review Board Statement
Informed Consent Statement
Data Availability Statement
Acknowledgments
Conflicts of Interest
References
- Kuhn, T.M.; Pascual-Garcia, P.; Gozalo, A.; Little, S.C.; Capelson, M. Chromatin targeting of nuclear pore proteins induces chromatin decondensation. J. Cell Biol. 2019, 218, 2945–2961. [Google Scholar] [CrossRef] [Green Version]
- Pascual-Garcia, P.; Debo, B.; Aleman, J.R.; Talamas, J.A.; Lan, Y.; Nguyen, N.H.; Won, K.J.; Capelson, M. Metazoan Nuclear Pores Provide a Scaffold for Poised Genes and Mediate Induced Enhancer-Promoter Contacts. Mol. Cell 2017, 66, 63–76. [Google Scholar] [CrossRef] [PubMed] [Green Version]
- Raices, M.; Bukata, L.; Sakuma, S.; Borlido, J.; Hernandez, L.S.; Hart, D.O.; D’Angelo, M.A. Nuclear Pores Regulate Muscle Development and Maintenance by Assembling a Localized Mef2C Complex. Dev. Cell 2017, 41, 540–554.e7. [Google Scholar] [CrossRef] [Green Version]
- Su, Y.; Pelz, C.; Huang, T.; Torkenczy, K.; Wang, X.; Cherry, A.; Daniel, C.J.; Liang, J.; Nan, X.; Dai, M.-S.; et al. Post-translational modification localizes MYC to the nuclear pore basket to regulate a subset of target genes involved in cellular responses to environmental signals. Genes Dev. 2018, 32, 1398–1419. [Google Scholar] [CrossRef]
- Ibarra, A.; Benner, C.; Tyagi, S.; Cool, J.; Hetzer, M.W. Nucleoporin-mediated regulation of cell identity genes. Genes Dev. 2016, 30, 2253–2258. [Google Scholar] [CrossRef] [PubMed]
- Krull, S.; Dörries, J.; Boysen, B.; Reidenbach, S.; Magnius, L.; Norder, H.; Thyberg, J.; Cordes, V.C. Protein Tpr is required for establishing nuclear pore-associated zones of heterochromatin exclusion. EMBO J. 2010, 29, 1659–1673. [Google Scholar] [CrossRef] [PubMed] [Green Version]
- Buchwalter, A.L.; Liang, Y.; Hetzer, M.W. Nup50 is required for cell differentiation and exhibits transcription-dependent dynamics. Mol. Biol. Cell 2014, 25, 2472–2484. [Google Scholar] [CrossRef] [PubMed] [Green Version]
- Kalverda, B.; Pickersgill, H.; Shloma, V.V.; Fornerod, M. Nucleoporins directly stimulate expression of developmental and cell-cycle genes inside the nucleoplasm. Cell 2010, 140, 360–371. [Google Scholar] [CrossRef] [PubMed] [Green Version]
- Capelson, M.; Liang, Y.; Schulte, R.; Mair, W.; Wagner, U.; Hetzer, M.W. Chromatin-bound nuclear pore components regulate gene expression in higher eukaryotes. Cell 2010, 140, 372. [Google Scholar] [CrossRef] [Green Version]
- Frosst, P.; Guan, T.; Subauste, C.; Hahn, K.; Gerace, L. Tpr is localized within the nuclear basket of the pore complex and has a role in nuclear protein export. J. Cell Biol. 2002, 156, 617–630. [Google Scholar] [CrossRef] [Green Version]
- Krull, S.; Thyberg, J.; Björkroth, B.; Rackwitz, H.-R.; Cordes, V.C. Nucleoporins as Components of the Nuclear Pore Complex Core Structure and Tpr as the Architectural Element of the Nuclear Basket. Mol. Biol. Cell 2004, 15, 4261–4277. [Google Scholar] [CrossRef] [Green Version]
- Aksenova, V.; Lee, H.N.; Smith, A.; Chen, S.; Bhat, P.; Iben, J.; Echeverria, C.; Fontoura, B.; Arnaoutov, A.; Dasso, M. Distinct Basket Nucleoporins roles in Nuclear Pore Function and Gene Expression: Tpr is an integral component of the TREX-2 mRNA export pathway. bioRxiv 2019, 685263. [Google Scholar] [CrossRef]
- Lee, E.S.; Wolf, E.J.; Ihn, S.S.J.; Smith, H.W.; Emili, A.; Palazzo, A.F. TPR is required for the efficient nuclear export of mRNAs and lncRNAs from short and intron-poor genes. Nucleic Acids Res. 2020, 48, 11645–11663. [Google Scholar] [CrossRef]
- Vomastek, T.; Iwanicki, M.P.; Burack, W.R.; Tiwari, D.; Kumar, D.; Parsons, J.T.; Weber, M.J.; Nandicoori, V.K. Extracellular Signal-Regulated Kinase 2 (ERK2) Phosphorylation Sites and Docking Domain on the Nuclear Pore Complex Protein Tpr Cooperatively Regulate ERK2-Tpr Interaction. Mol. Cell. Biol. 2008, 28, 6954–6966. [Google Scholar] [CrossRef] [Green Version]
- Fontoura, B.M.; Dales, S.; Blobel, G.; Zhong, H. The nucleoporin Nup98 associates with the intranuclear filamentous protein network of TPR. Proc. Natl. Acad. Sci. USA 2001, 98, 3208–3213. [Google Scholar] [CrossRef] [PubMed] [Green Version]
- Agarwal, S.; Yadav, S.K.; Dixit, A. Heterologous expression of Translocated promoter region protein, Tpr, identified as a transcription factor from Rattus norvegicus. Protein Expr. Purif. 2011, 77, 112–117. [Google Scholar] [CrossRef] [PubMed]
- Jin, W.; Liu, M.; Peng, J.; Jiang, S. Function analysis of Mef2c promoter in muscle differentiation. Biotechnol. Appl. Biochem. 2017, 64, 647–656. [Google Scholar] [CrossRef]
- Stuart, C.A.; Stone, W.L.; Howell, M.E.A.; Brannon, M.F.; Hall, H.K.; Gibson, A.L.; Stone, M.H. Myosin content of individual human muscle fibers isolated by laser capture microdissection. Am. J. Physiol. Cell Physiol. 2016, 310, C381–C389. [Google Scholar] [CrossRef] [Green Version]
- Shi, Y.; Lan, F.; Matson, C.; Mulligan, P.; Whetstine, J.R.; Cole, P.A.; Casero, R.A.; Shi, Y. Histone demethylation mediated by the nuclear amine oxidase homolog LSD1. Cell 2004, 119, 941–953. [Google Scholar] [CrossRef] [PubMed] [Green Version]
- Wang, J.; Telese, F.; Tan, Y.; Li, W.; Jin, C.; He, X.; Basnet, H.; Ma, Q.; Merkurjev, D.; Zhu, X.; et al. LSD1n is an H4K20 demethylase regulating memory formation via transcriptional elongation control. Nat. Neurosci. 2015, 18, 1256–1264. [Google Scholar] [CrossRef]
- Metzger, E.; Wissmann, M.; Yin, N.; Müller, J.M.; Schneider, R.; Peters, A.H.F.M.; Günther, T.; Buettner, R.; Schüle, R. LSD1 demethylates repressive histone marks to promote androgen-receptor-dependent transcription. Nature 2005, 437, 436–439. [Google Scholar] [CrossRef] [PubMed]
- Majello, B.; Gorini, F.; Saccà, C.D.; Amente, S. Expanding the Role of the Histone Lysine-Specific Demethylase LSD1 in Cancer. Cancers 2019, 11, 324. [Google Scholar] [CrossRef] [PubMed] [Green Version]
- Choi, J.; Jang, H.; Kim, H.; Kim, S.-T.; Cho, E.-J.; Youn, H.-D. Histone demethylase LSD1 is required to induce skeletal muscle differentiation by regulating myogenic factors. Biochem. Biophys. Res. Commun. 2010, 401, 327–332. [Google Scholar] [CrossRef]
- Choi, J.; Jang, H.; Kim, H.; Lee, J.-H.; Kim, S.-T.; Cho, E.-J.; Youn, H.-D. Modulation of lysine methylation in myocyte enhancer factor 2 during skeletal muscle cell differentiation. Nucleic Acids Res. 2014, 42, 224–234. [Google Scholar] [CrossRef] [PubMed] [Green Version]
- Scionti, I.; Hayashi, S.; Mouradian, S.; Girard, E.; Esteves de Lima, J.; Morel, V.; Simonet, T.; Wurmser, M.; Maire, P.; Ancelin, K.; et al. LSD1 Controls Timely MyoD Expression via MyoD Core Enhancer Transcription. Cell Rep. 2017, 18, 1996–2006. [Google Scholar] [CrossRef] [Green Version]
- Munehira, Y.; Yang, Z.; Gozani, O. Systematic Analysis of Known and Candidate Lysine Demethylases in the Regulation of Myoblast Differentiation. J. Mol. Biol. 2017, 429, 2055–2065. [Google Scholar] [CrossRef]
- Anan, K.; Hino, S.; Shimizu, N.; Sakamoto, A.; Nagaoka, K.; Takase, R.; Kohrogi, K.; Araki, H.; Hino, Y.; Usuki, S.; et al. LSD1 mediates metabolic reprogramming by glucocorticoids during myogenic differentiation. Nucleic Acids Res. 2018, 46, 5441–5454. [Google Scholar] [CrossRef] [Green Version]
- Tosic, M.; Allen, A.; Willmann, D.; Lepper, C.; Kim, J.; Duteil, D.; Schüle, R. Lsd1 regulates skeletal muscle regeneration and directs the fate of satellite cells. Nat. Commun. 2018, 9, 366. [Google Scholar] [CrossRef]
- Langmead, B.; Salzberg, S.L. Fast gapped-read alignment with Bowtie 2. Nat. Methods 2012, 9, 357–359. [Google Scholar] [CrossRef] [Green Version]
- Andrews, S. FastQC: A Quality Control Tool for High Throughput Sequence Data. 2010. Available online: http://www.bioinformatics.babraham.ac.uk/projects/fastqc/ (accessed on 15 February 2017).
- García-Alcalde, F.; Okonechnikov, K.; Carbonell, J.; Cruz, L.M.; Götz, S.; Tarazona, S.; Dopazo, J.; Meyer, T.F.; Conesa, A. Qualimap: Evaluating next-generation sequencing alignment data. Bioinformatics 2012, 28, 2678–2679. [Google Scholar] [CrossRef]
- Zhang, Y.; Liu, T.; Meyer, C.A.; Eeckhoute, J.; Johnson, D.S.; Bernstein, B.E.; Nusbaum, C.; Myers, R.M.; Brown, M.; Li, W.; et al. Model-based analysis of ChIP-Seq (MACS). Genome Biol. 2008, 9, R137. [Google Scholar] [CrossRef] [Green Version]
- Love, M.I.; Anders, S.; Kim, V.; Huber, W. RNA-Seq workflow: Gene-level exploratory analysis and differential expression. F1000Research 2015, 4, 1070. [Google Scholar] [CrossRef]
- Anders, S.; Huber, W. Differential expression analysis for sequence count data. Genome Biol. 2010, 11, R106. [Google Scholar] [CrossRef] [Green Version]
- Tyanova, S.; Temu, T.; Sinitcyn, P.; Carlson, A.; Hein, M.Y.; Geiger, T.; Mann, M.; Cox, J. The Perseus computational platform for comprehensive analysis of proteomics data. Nat. Methods 2016, 13, 731–740. [Google Scholar] [CrossRef] [PubMed]
- Cox, J.; Mann, M. 1D and 2D annotation enrichment: A statistical method integrating quantitative proteomics with complementary high-throughput data. BMC Bioinform. 2012, 13 (Suppl. 16), S12. [Google Scholar] [CrossRef] [Green Version]
- Kanehisa, M.; Sato, Y.; Furumichi, M.; Morishima, K.; Tanabe, M. New approach for understanding genome variations in KEGG. Nucleic Acids Res. 2019, 47, D590–D595. [Google Scholar] [CrossRef] [PubMed] [Green Version]
- Kanehisa, M.; Goto, S. KEGG: Kyoto encyclopedia of genes and genomes. Nucleic Acids Res. 2000, 28, 27–30. [Google Scholar] [CrossRef] [PubMed]
- Gough, J.; Karplus, K.; Hughey, R.; Chothia, C. Assignment of homology to genome sequences using a library of hidden Markov models that represent all proteins of known structure. J. Mol. Biol. 2001, 313, 903–919. [Google Scholar] [CrossRef]
- Jacinto, F.V.; Benner, C.; Hetzer, M.W. The nucleoporin Nup153 regulates embryonic stem cell pluripotency through gene silencing. Genes Dev. 2015, 29, 1224–1238. [Google Scholar] [CrossRef] [PubMed] [Green Version]
- Fišerová, J.; Maninová, M.; Sieger, T.; Uhlířová, J.; Šebestová, L.; Efenberková, M.; Čapek, M.; Fišer, K.; Hozák, P. Nuclear pore protein TPR associates with lamin B1 and affects nuclear lamina organization and nuclear pore distribution. Cell. Mol. Life Sci. 2019. [Google Scholar] [CrossRef] [PubMed]
- Chal, J.; Pourquié, O. Making muscle: Skeletal myogenesis in vivo and in vitro. Development 2017, 144, 2104–2122. [Google Scholar] [CrossRef] [PubMed] [Green Version]
- Chen, B.; You, W.; Wang, Y.; Shan, T. The regulatory role of Myomaker and Myomixer-Myomerger-Minion in muscle development and regeneration. Cell. Mol. Life Sci. 2020, 77, 1551–1569. [Google Scholar] [CrossRef]
- Zhang, P.; Wong, C.; Liu, D.; Finegold, M. Harper JW and Elledge SJ: p21(CIP1) and p57(KIP2) control muscle differentiation at the myogenin step. Genes Dev. 1999, 13, 213–224. [Google Scholar] [CrossRef]
- Asp, P.; Blum, R.; Vethantham, V.; Parisi, F.; Micsinai, M.; Cheng, J.; Bowman, C.; Kluger, Y.; Dynlacht, B.D. Genome-wide remodeling of the epigenetic landscape during myogenic differentiation. Proc. Natl. Acad. Sci. USA 2011, 108, E149–E158. [Google Scholar] [CrossRef] [Green Version]
- Wu, F.; Yao, J. Spatial compartmentalization at the nuclear periphery characterized by genome-wide mapping. BMC Genom. 2013, 14, 591. [Google Scholar] [CrossRef] [Green Version]
- Aisenberg, W.H.; Huang, J.; Zhu, W.; Rajkumar, P.; Cruz, R.; Santhanam, L.; Natarajan, N.; Yong, H.M.; De Santiago, B.; Oh, J.J.; et al. Defining an olfactory receptor function in airway smooth muscle cells. Sci. Rep. 2016, 6, 38231. [Google Scholar] [CrossRef] [Green Version]
- Pavlath, G.K. A new function for odorant receptors. Cell Adhes. Migr. 2010, 4, 502–506. [Google Scholar] [CrossRef] [Green Version]
- David-Watine, B. Silencing Nuclear Pore Protein Tpr Elicits a Senescent-Like Phenotype in Cancer Cells. PLoS ONE 2011, 6, e22423. [Google Scholar] [CrossRef]
- Funasaka, T.; Tsuka, E.; Wong, R.W. Regulation of autophagy by nucleoporin Tpr. Sci. Rep. 2012, 2, 878. [Google Scholar] [CrossRef] [PubMed] [Green Version]
- Liang, Y.; Franks, T.M.; Marchetto, M.C.; Gage, F.H.; Hetzer, M.W. Dynamic association of NUP98 with the human genome. PLoS Genet. 2013, 9, e1003308. [Google Scholar] [CrossRef] [PubMed]
- Mattout, A.; Cabianca, D.S.; Gasser, S.M. Chromatin states and nuclear organization in development—A view from the nuclear lamina. Genome Biol. 2015, 16, 1–15. [Google Scholar] [CrossRef] [PubMed] [Green Version]
- Acakpo-Satchivi, L.J.R.; Edelmann, W.; Sartorius, C.; Lu, B.D.; Wahr, P.A.; Watkins, S.C.; Metzger, J.M.; Leinwand, L.; Kucherlapati, R. Growth and Muscle Defects in Mice Lacking Adult Myosin Heavy Chain Genes. J. Cell Biol. 1997, 139, 1219–1229. [Google Scholar] [CrossRef] [PubMed]
- Dalesio, N.M.; Barreto Ortiz, S.F.; Pluznick, J.L.; Berkowitz, D.E. Olfactory, Taste, and Photo Sensory Receptors in Non-sensory Organs: It Just Makes Sense. Front. Physiol. 2018, 9, 1673. [Google Scholar] [CrossRef] [Green Version]
- Zhang, H.; Wen, J.; Bigot, A.; Chen, J.; Shang, R.; Mouly, V.; Bi, P. Human myotube formation is determined by MyoD–Myomixer/Myomaker axis. Sci. Adv. 2020, 6, eabc4062. [Google Scholar] [CrossRef]
- Ganassi, M.; Badodi, S.; Ortuste Quiroga, H.P.; Zammit, P.S.; Hinits, Y.; Hughes, S.M. Myogenin promotes myocyte fusion to balance fibre number and size. Nat. Commun. 2018, 9, 4232. [Google Scholar] [CrossRef] [Green Version]
- Milano-Foster, J.; Ray, S.; Home, P.; Ganguly, A.; Bhattacharya, B.; Bajpai, S.; Pal, A.; Mason, C.W.; Paul, S. Regulation of human trophoblast syncytialization by histone demethylase LSD1. J. Biol. Chem. 2019, 294, 17301–17313. [Google Scholar] [CrossRef] [PubMed]


| Targeted mRNA | Targeting Sequence | |
|---|---|---|
| shNC | None | TAAGGTTAAGTCGCCCTCGAT |
| shTPR1 | TPR C-terminus, 5916–5936 | TCTCCATCAGTACTTTCTTCT |
| shTPR2 | TPR C-terminus, 5989–6009 | TGTATAATCTCCCTGGGTAAC |
| ChIP-Seq | IgG | TPR-C | TPR-N | H3K36me3 |
|---|---|---|---|---|
| C2C12 MB | X | X | X | X |
| C2C12 MT | X | X | X | X |
| ChIP-qPCR | H3 | TPR | LSD1 | H3K9me2 |
|---|---|---|---|---|
| C2C12 MB | X | X | ||
| C2C12 MT | X | X | ||
| shTPR1 MB | X | X | X | X |
| shTPR1 MT | X | X | X | X |
| shTPR2 MB | X | X | X | X |
| shTPR2 MT | X | X | X | X |
| ChIP-qPCR | Forward | Reverse |
|---|---|---|
| Mef2C | CCAAAGTCCTCTCCTATGTGCTT | AGGCGCTTCACCTAACCAAG |
| Myh4 | ACGCTGAGATGGCCGTTTTC | CTCCCACGTCTTGCTTTTACTC |
| Olfr376 | TGAATGTGTGCTCCTCTCTATG | CACTTACTTACCACCACCATCAC |
| Myog | AGCCTTTTCCGACCTGATGG | CCCCATCATAGAAGTGGGGC |
| RT-qPCR | Forward | Reverse |
|---|---|---|
| GAPDH | GGAAGGGCTCATGACCACAG | GCCATCCACAGTCTTCTGGG |
| TPR | TCCAGGCATATCAGAGCGA | CACCAGGCTGACCTTTACCG |
| Mef2C | AACATTTGCCAAAAGCGGCA | GTGACAGGCGTGTTCCTACA |
| Myh4 | CACCCTGGAGGACCAACTGA | TTGCCTCGGGAAAGCTGAGAAA |
| Olfr376 | ATATGAGCCAGATGCAGGGC | GCCAGGAACAGGGCATAGAA |
| Myog | GTCCCAACCCAGGAGATCATT | AGTTGGGCATGGTTTCGTCT |
| MymK | CGATTCTTCTTTGAGGAATGGGA | TCCCAGCCTTCTTGTTGACC |
| MymX | AGCAGGAGGGCAAGAAGTTCA | CTCATGTCTTGGGAGCTCAGT |
| MyF5 | CGGATCACGTCTACAGAGCC | GCAGGAGTGATCATCGGGAG |
| MyoD1 | TACAGTGGCGACTCAGATGC | GGCCGCTGTAATCCATCATGC |
| P21 | CAGACCAGCCTGACAGATTTCTA | GAGGGCTAAGGCCGAAGATG |
| P57 | GAAGTTGAAGTCCCAGCGGT | ACCAATCAGCCAGCAGAACAG |
Publisher’s Note: MDPI stays neutral with regard to jurisdictional claims in published maps and institutional affiliations. |
© 2021 by the authors. Licensee MDPI, Basel, Switzerland. This article is an open access article distributed under the terms and conditions of the Creative Commons Attribution (CC BY) license (https://creativecommons.org/licenses/by/4.0/).
Share and Cite
Uhlířová, J.; Šebestová, L.; Fišer, K.; Sieger, T.; Fišerová, J.; Hozák, P. Nucleoporin TPR Affects C2C12 Myogenic Differentiation via Regulation of Myh4 Expression. Cells 2021, 10, 1271. https://doi.org/10.3390/cells10061271
Uhlířová J, Šebestová L, Fišer K, Sieger T, Fišerová J, Hozák P. Nucleoporin TPR Affects C2C12 Myogenic Differentiation via Regulation of Myh4 Expression. Cells. 2021; 10(6):1271. https://doi.org/10.3390/cells10061271
Chicago/Turabian StyleUhlířová, Jana, Lenka Šebestová, Karel Fišer, Tomáš Sieger, Jindřiška Fišerová, and Pavel Hozák. 2021. "Nucleoporin TPR Affects C2C12 Myogenic Differentiation via Regulation of Myh4 Expression" Cells 10, no. 6: 1271. https://doi.org/10.3390/cells10061271
APA StyleUhlířová, J., Šebestová, L., Fišer, K., Sieger, T., Fišerová, J., & Hozák, P. (2021). Nucleoporin TPR Affects C2C12 Myogenic Differentiation via Regulation of Myh4 Expression. Cells, 10(6), 1271. https://doi.org/10.3390/cells10061271