Figure 1.
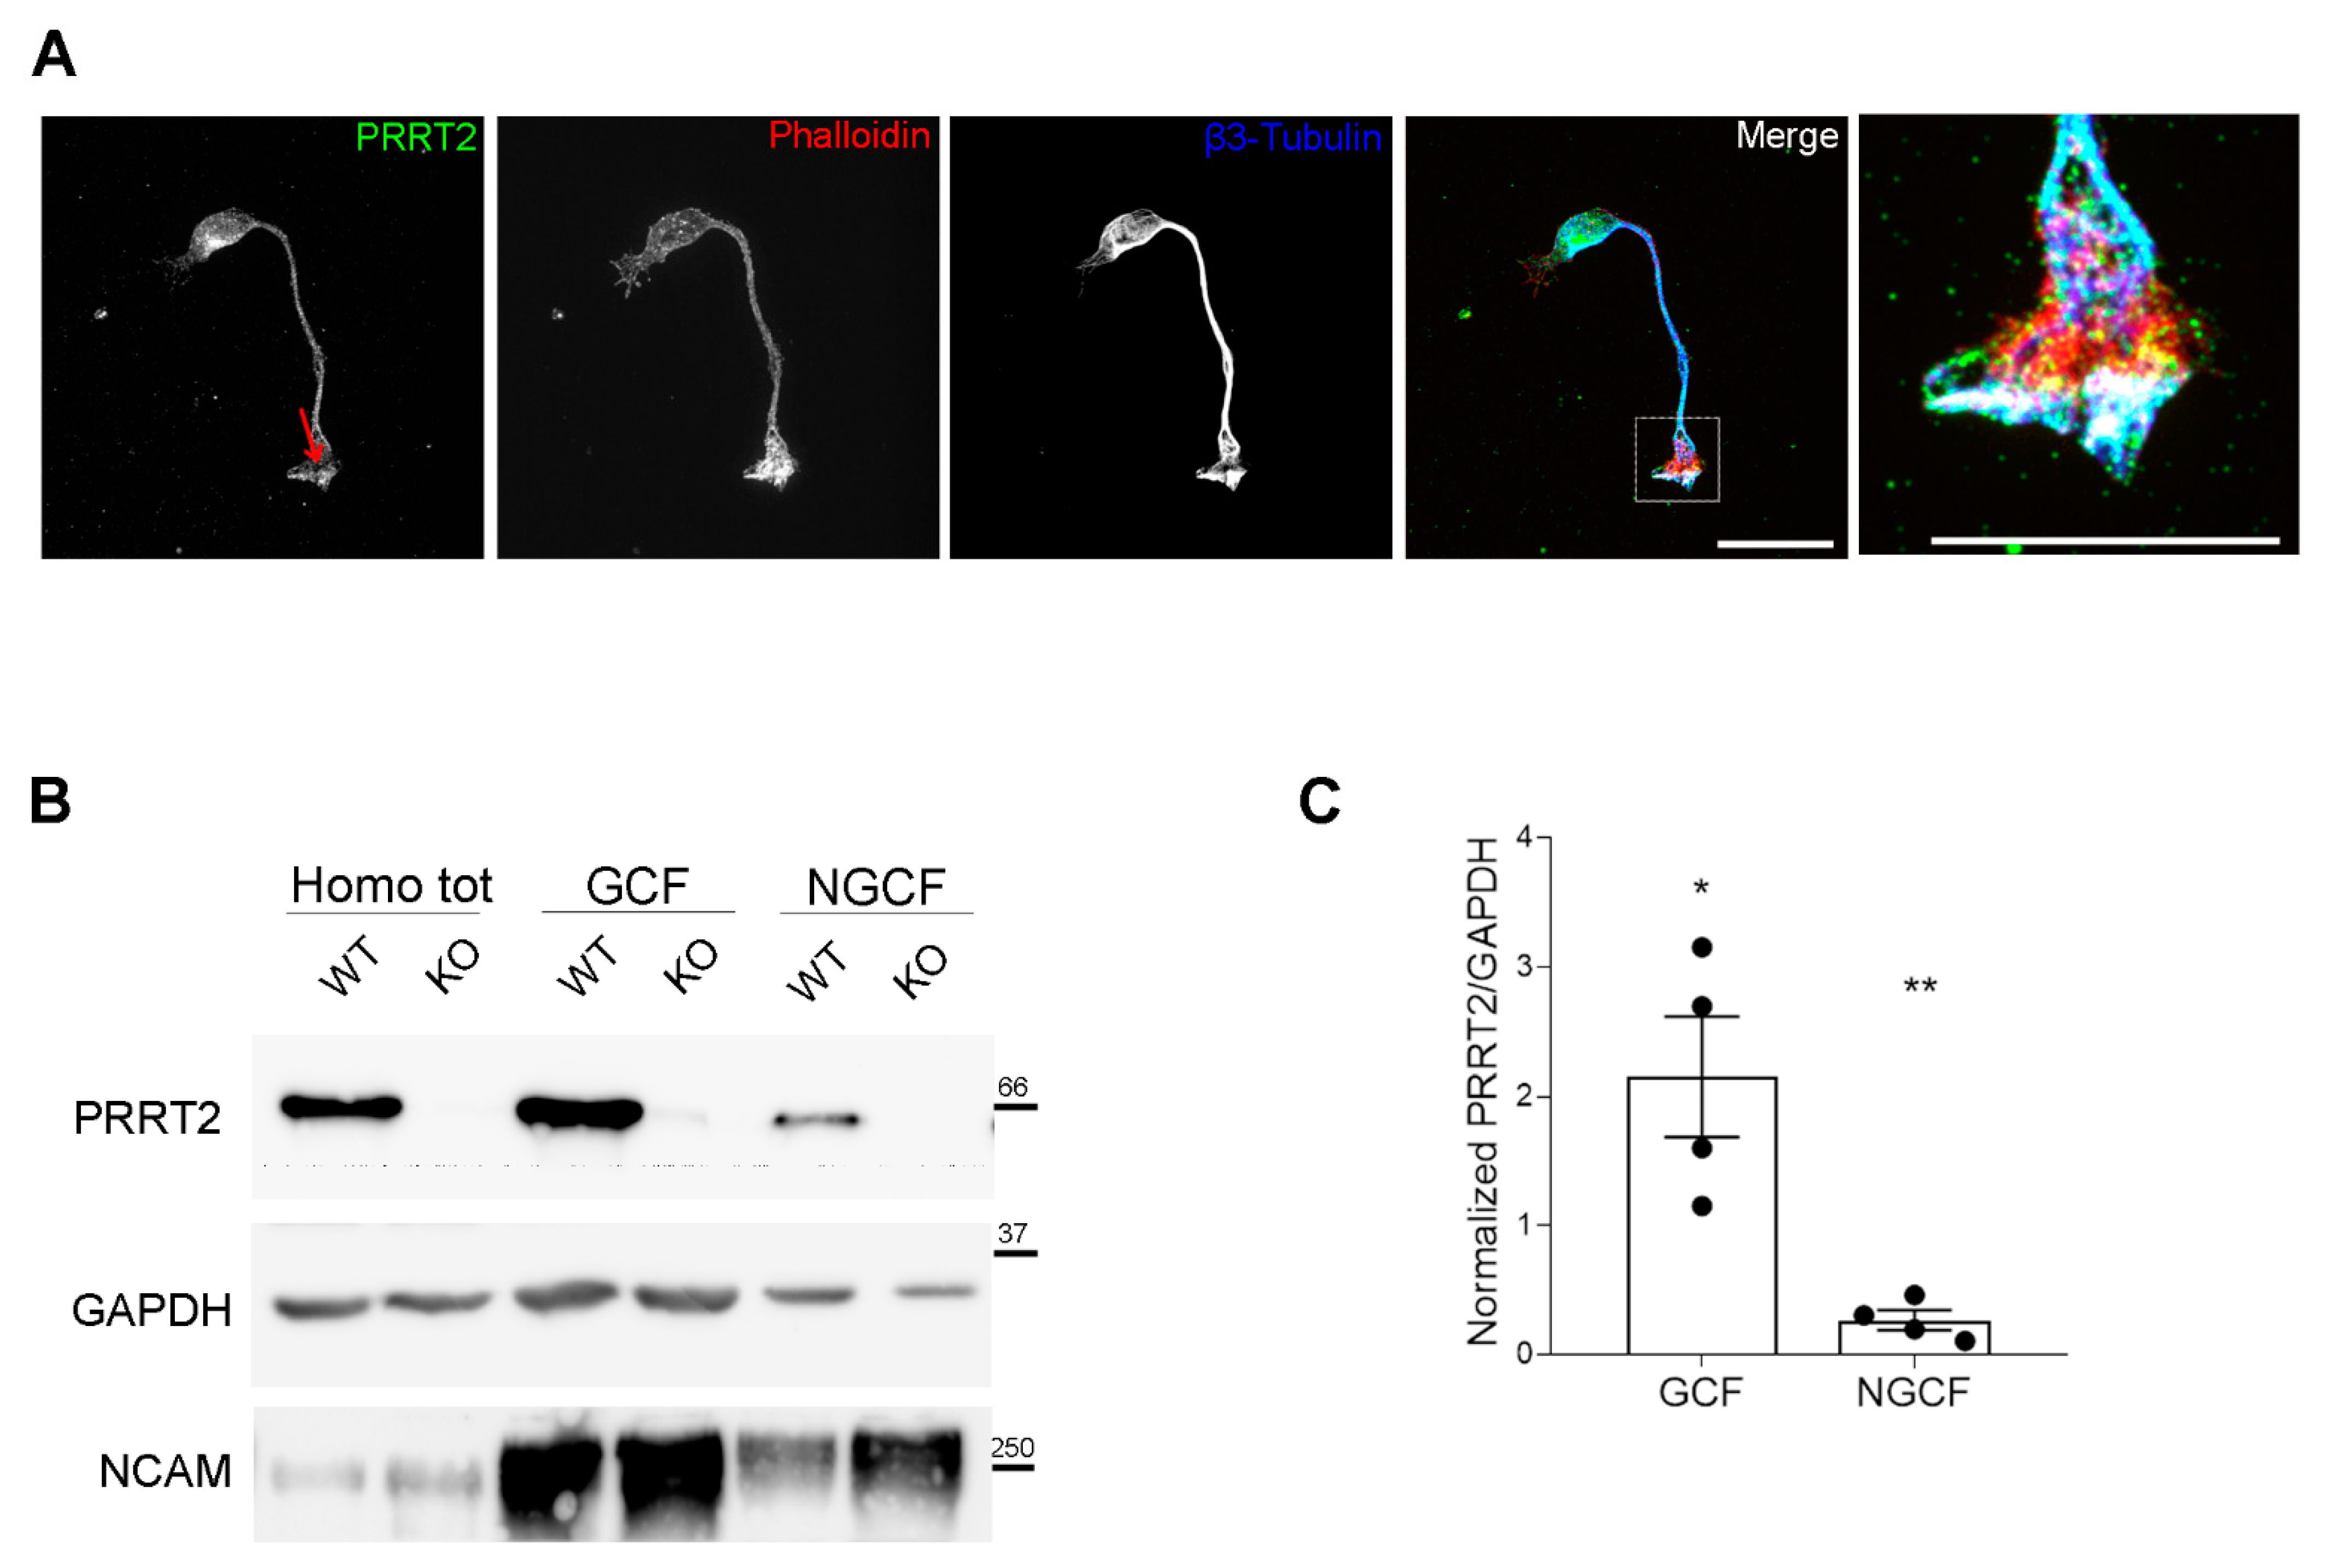
PRRT2 is enriched in the growth cones of in vitro developing neurons. (A) 1 DIV hippocampal neurons processed for immunofluorescence and stained for endogenous PRRT2, actin, and βIII-tubulin. Red arrow points to PRRT2 signal at the growth cone. The panel on the right shows a higher magnification of the inset in the Merge panel. Note the white signal at the tip of the growth cone, indicating overlapping of the signals for PRRT2, actin, and βIII-tubulin. Scale bar = 20 μm, inset scale bar = 10 μm. (B) Representative immunoblot of PRRT2 and NCAM in post-nuclear supernatant fraction (Homo tot), growth cone (GCF), and non-growth cone (NGCF) fractions from WT and PRRT2 KO P2/P3 brains. (C) Quantification of PRRT2 enrichment in WT fractions. PRRT2 band intensity was normalised on GAPDH for each sample and on the homogenate level, which was set to 1. Data are expressed as mean ± SEM of n = 4 embryos (Homo tot: 1, GCF: 2.2 ± 0.9, NGCF: 0.3 ± 0.1). One-way ANOVA + Tukey’s test; * p < 0.05 homo tot vs. GCF, ** p < 0.01 GCF vs. NGCF.
Figure 1.
PRRT2 is enriched in the growth cones of in vitro developing neurons. (A) 1 DIV hippocampal neurons processed for immunofluorescence and stained for endogenous PRRT2, actin, and βIII-tubulin. Red arrow points to PRRT2 signal at the growth cone. The panel on the right shows a higher magnification of the inset in the Merge panel. Note the white signal at the tip of the growth cone, indicating overlapping of the signals for PRRT2, actin, and βIII-tubulin. Scale bar = 20 μm, inset scale bar = 10 μm. (B) Representative immunoblot of PRRT2 and NCAM in post-nuclear supernatant fraction (Homo tot), growth cone (GCF), and non-growth cone (NGCF) fractions from WT and PRRT2 KO P2/P3 brains. (C) Quantification of PRRT2 enrichment in WT fractions. PRRT2 band intensity was normalised on GAPDH for each sample and on the homogenate level, which was set to 1. Data are expressed as mean ± SEM of n = 4 embryos (Homo tot: 1, GCF: 2.2 ± 0.9, NGCF: 0.3 ± 0.1). One-way ANOVA + Tukey’s test; * p < 0.05 homo tot vs. GCF, ** p < 0.01 GCF vs. NGCF.
![Cells 10 02666 g001]()
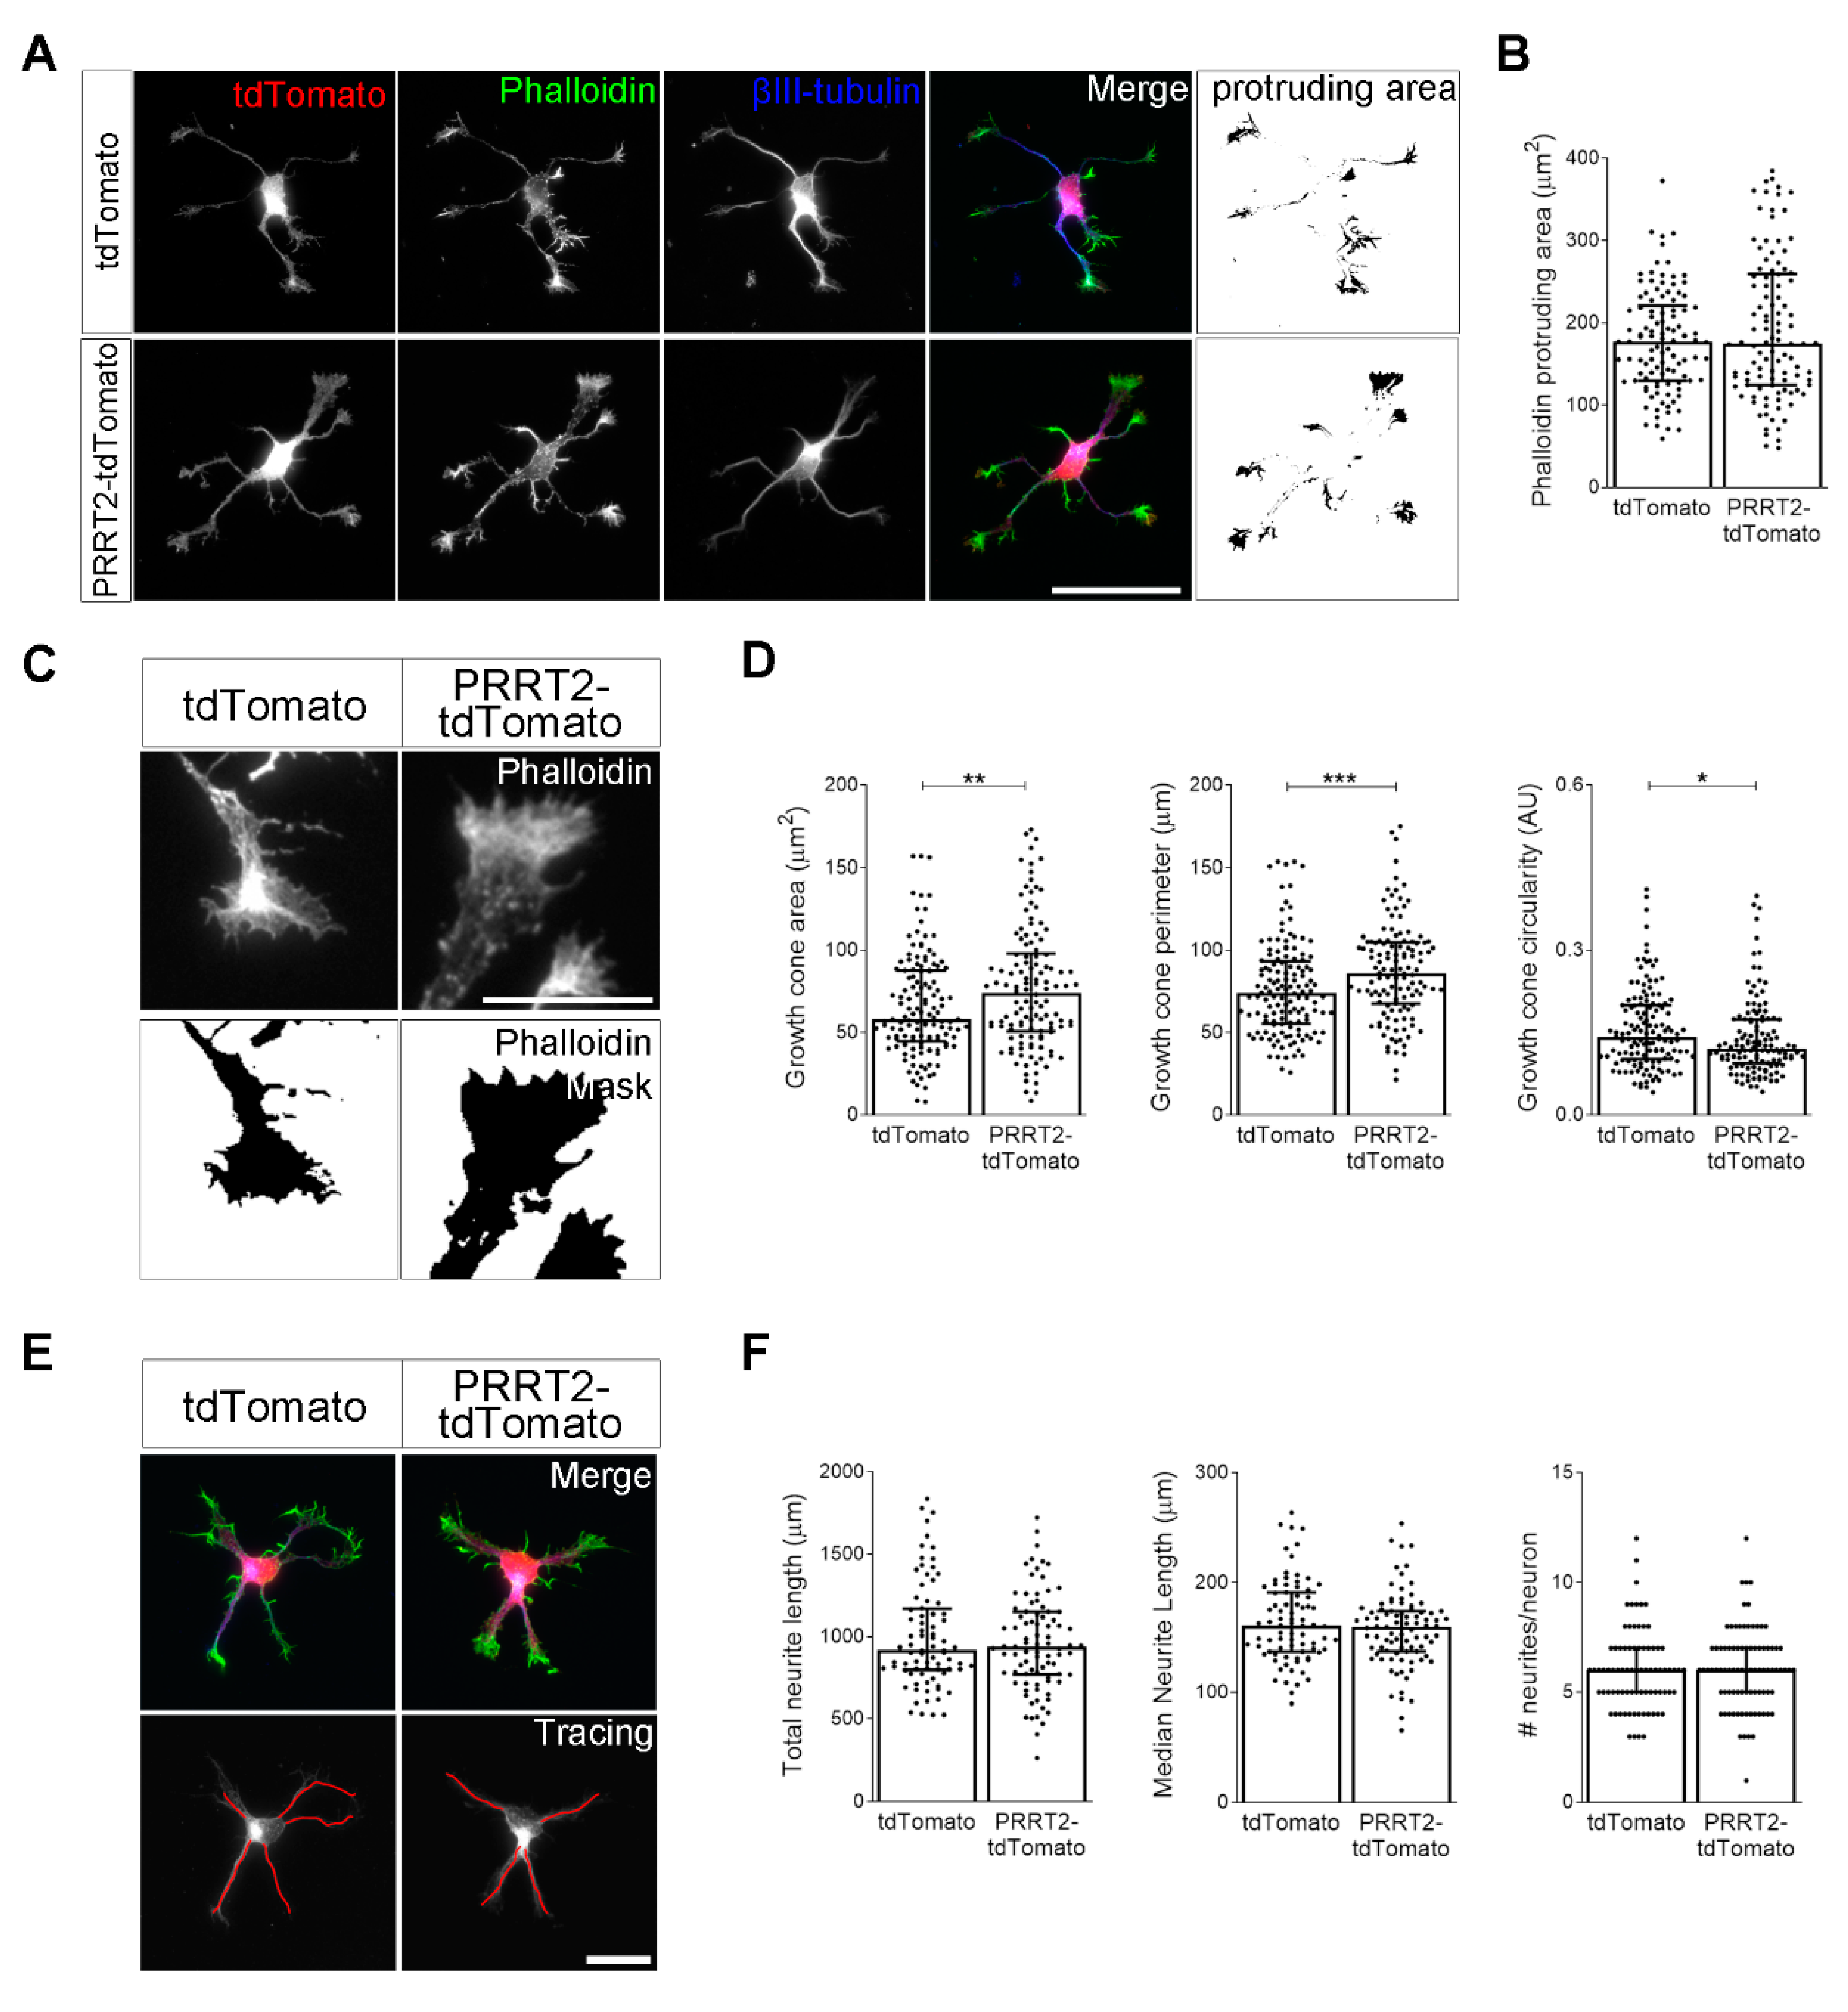
Figure 2.
PRRT2 overexpression in developing hippocampal neurons increased growth cone dimension and complexity. (A) 1 DIV embryonic hippocampal neurons electroporated at 0 DIV with tdTomato or PRRT2-IRES-tdTomato. Neurons were labelled with phalloidin to stain F-actin and an anti-βIII-tubulin antibody for neuronal microtubules. Actin protrusion area was calculated by subtracting the area of βIII-tubulin signal from F-actin area (protruding area). Scale bar = 50 µm. (B) Quantitative evaluation of actin protrusion area of neurons in (A). Data are expressed as median values ± interquartile range of n = total number of neurons from three independent cultures (tdTomato = 110, PRRT2-tdTomato = 106). Median F-actin protruding area (µm2): tdTomato = 177.4, PRRT2-tdTomato = 174.9. Statistical significance was determined by Mann–Whitney test. (C) The biggest growth cone was selected from the mask of the phalloidin channel of neurons described in (A), and its area, perimeter, and circularity were measured. Scale bar = 15 µm. (D) Quantitative analysis of growth cone parameters. Data are expressed as median ± interquartile range of n = total number of growth cones from three independent cultures (tdTomato = 137, PRRT2-tdTomato = 126). Median growth cone area (µm2): tdTomato = 58.24, PRRT2-tdTomato = 74.20; median growth cone perimeter (µm): tdTomato = 73.96, PRRT2-tdTomato = 85.98; median growth cone circularity (A.U.): tdTomato = 0.142, PRRT2-tdTomato = 0.121. Statistical significance was determined by Mann–Whitney test; * p < 0.05, ** p < 0.01, *** p < 0.001. (E) The NeuronJ plugin of the ImageJ software was used to trace the neurites on the βIII-tubulin channel of neurons described in (A). Scale bars = 20 µm. (F) Quantitative analysis of neuritic elongation expressed as median neurite length, total neurite length, and number of neurites/neurons. Data are expressed as median ± interquartile range of n = total number of neurons from three independent cultures (tdTomato = 80, PRRT2-tdTomato = 86). Median neurite length (µm): tdTomato = 160.7, PRRT2-tdTomato = 159.3; median total neurite length (µm): tdTomato = 915.5, PRRT2-tdTomato = 937.3; median neurites number/neuron: tdTomato = 6, PRRT2-tdTomato = 6. Statistical significance was determined by Mann–Whitney test.
![Cells 10 02666 g002]()
Figure 3.
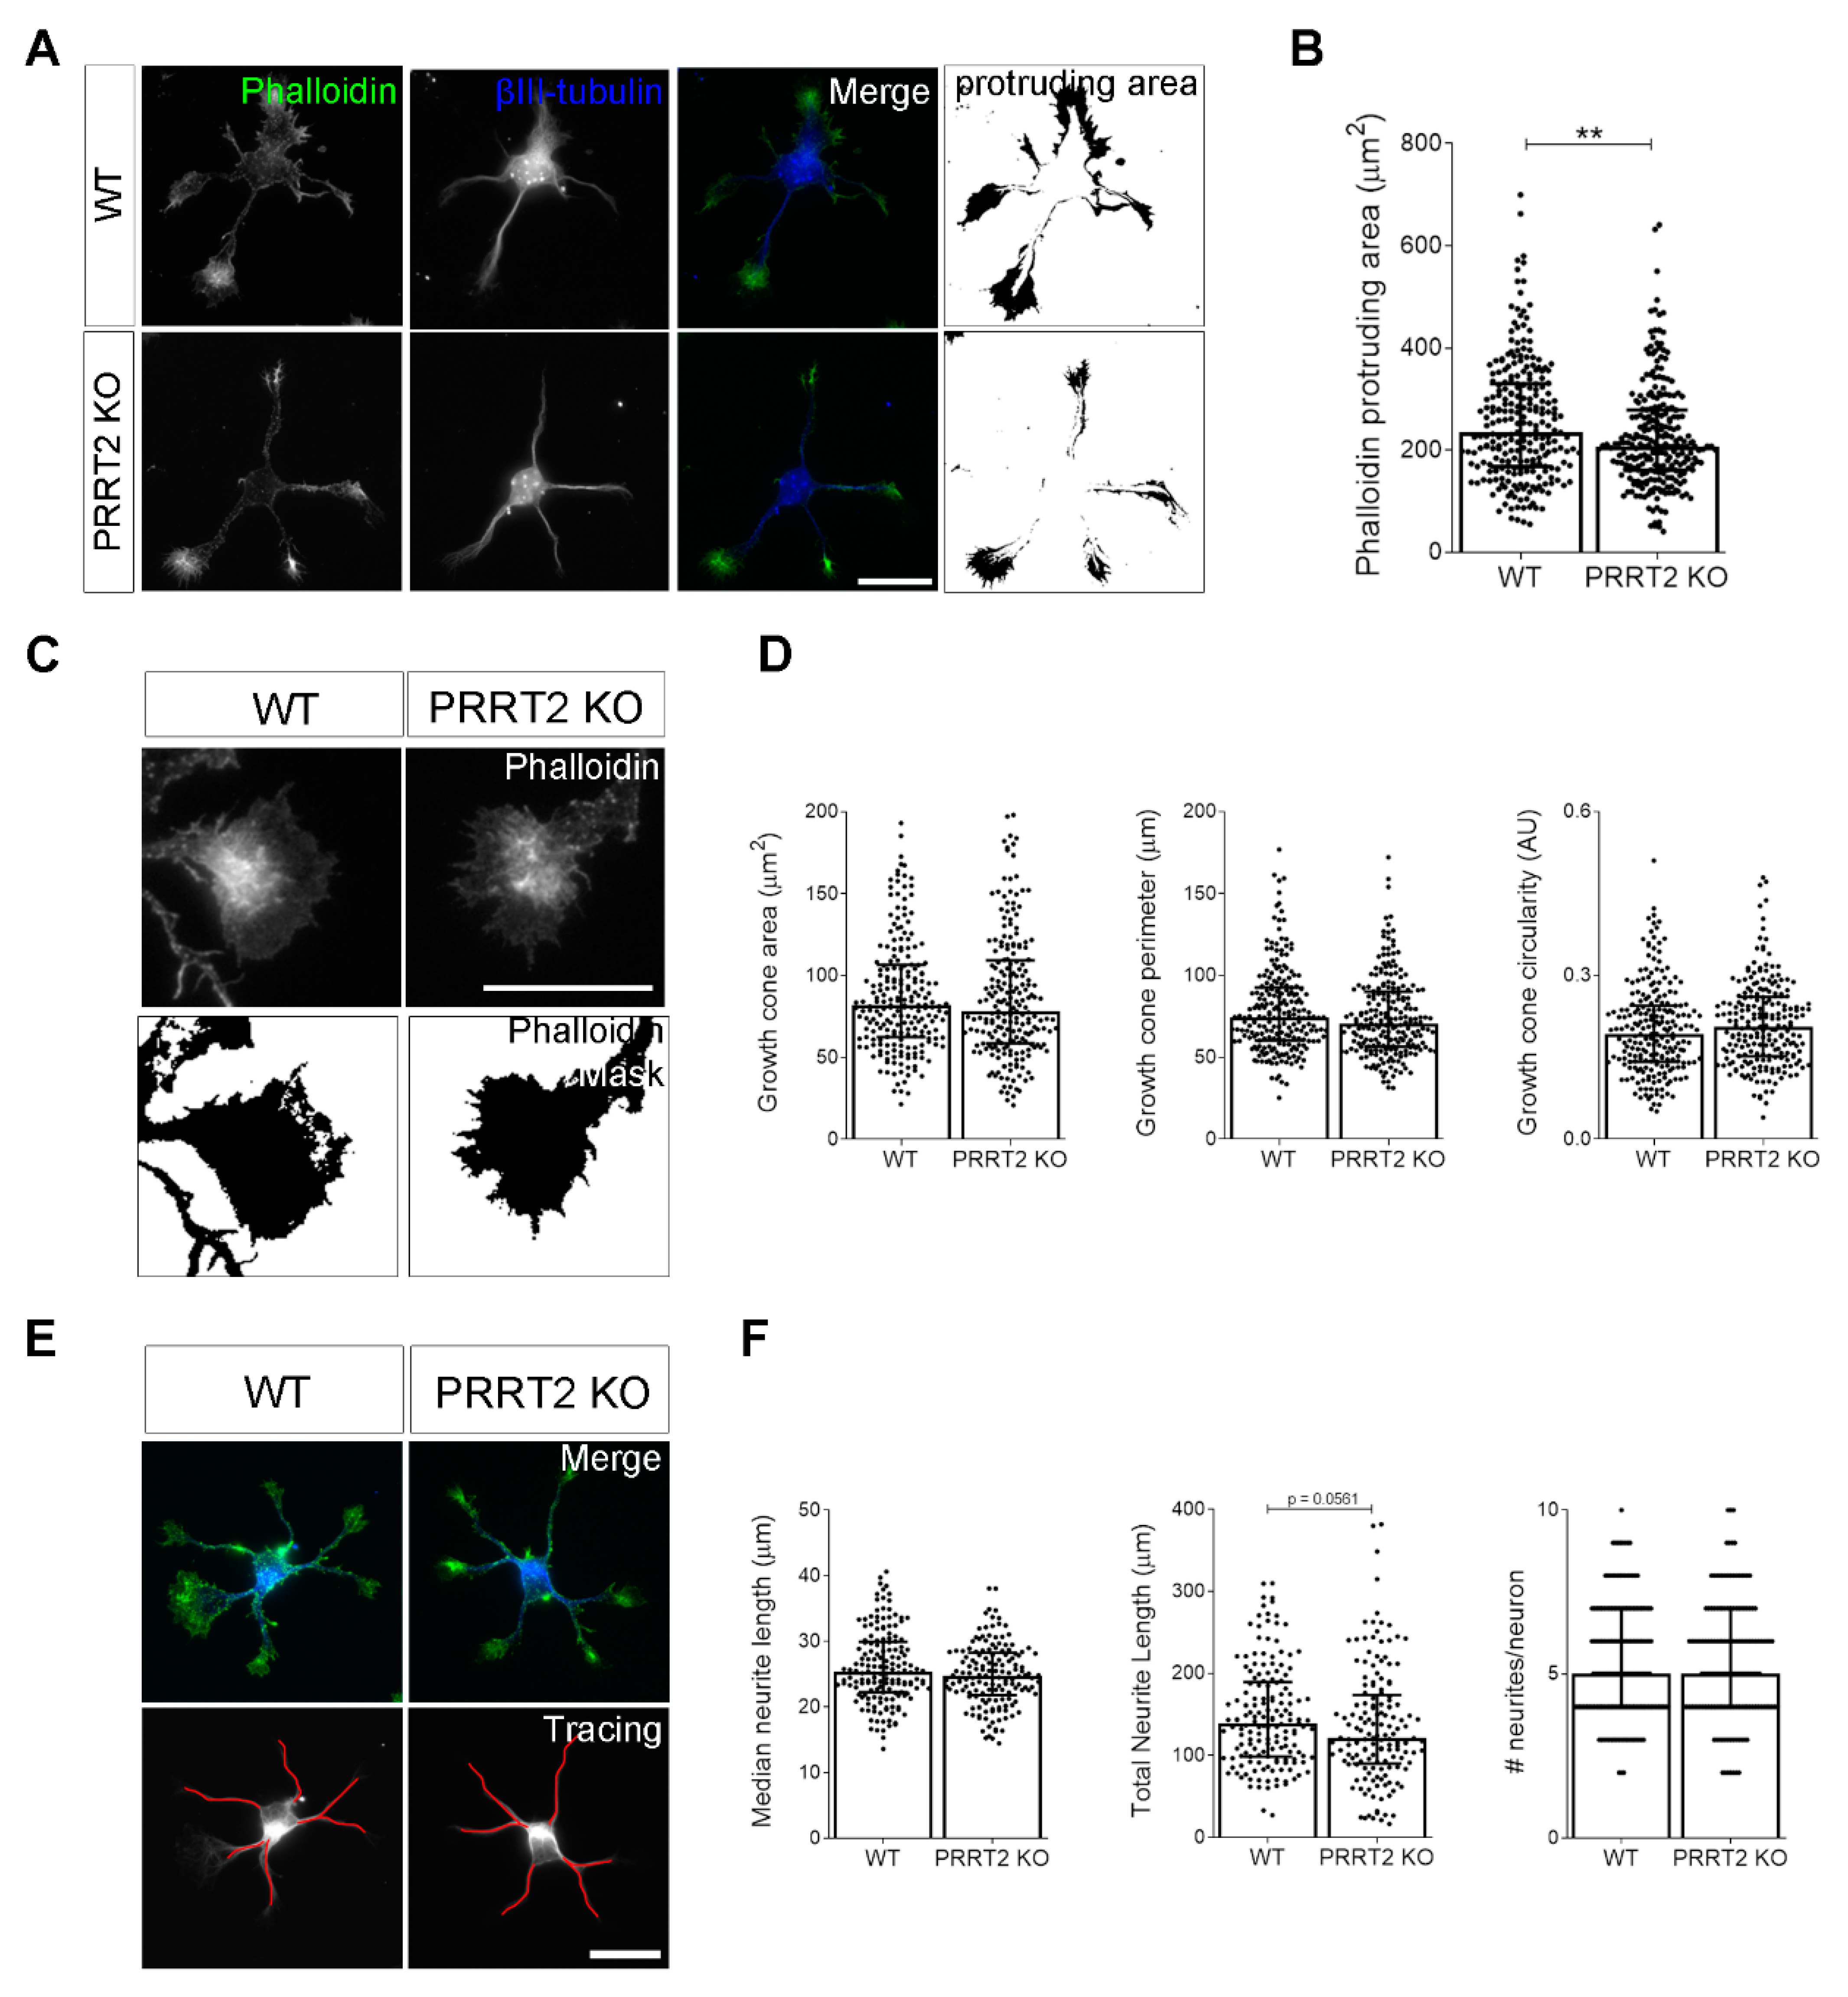
PRRT2 KO neurons display normal growth cone morphology. (A) Representative images of 1 DIV WT and PRRT2 KO hippocampal neurons. Neurons were labelled with phalloidin to stain F-actin and βIII-tubulin for neuronal microtubules. Scale bars = 20 µm. (B) Quantitative evaluation of actin protrusion areas. Actin protrusion area was calculated by subtracting the area of βIII-tubulin signal from F-actin area. Data are expressed as median values ± interquartile range of n = total number of neurons from four independent cultures (WT = 253, PRRT2 KO = 255). Median F-actin protruding area (µm2): WT = 235.5, PRRT2 KO = 207.8. Statistical significance was determined by Mann–Whitney test; ** p < 0.01. (C) The biggest growth cone was selected from the mask of the phalloidin channel on the neurons described in (A), and its area, perimeter, and circularity were measured. Scale bars = 20 µm. (D) Quantitative analysis of growth cone parameters. Data are expressed as median ± interquartile range of n = total number of growth cones from three independent cultures (WT = 223, PRRT2 KO = 220). Median growth cone area (µm2): WT = 81.87, PRRT2 KO = 77.86; median growth cone perimeter (µm): WT = 74.30, PRRT2 KO = 70.64; median growth cone circularity (A.U.): WT = 0.192, PRRT2 KO = 0.206. Statistical significance was determined by Mann–Whitney test. (E) The NeuronJ plugin of the ImageJ software was used to trace the neurites on the βIII-tubulin channel of neurons in (A). Scale bar = 20 μm. (F) Quantitative analysis of neuritic elongation expressed as median neurite length, total neurite length, and number of neurites/neurons. Data are expressed as median ± interquartile range of n = total number of neurons from three independent cultures (WT = 162; PRRT2 KO = 153). Median neurite length (µm): WT = 25.33, PRRT2 KO = 24.67; median total neurite length (µm): WT = 139.2, PRRT2 KO = 121.1; median neurites number/neuron: WT = 5, PRRT2 KO = 5. Statistical significance was determined by Mann–Whitney test.
Figure 3.
PRRT2 KO neurons display normal growth cone morphology. (A) Representative images of 1 DIV WT and PRRT2 KO hippocampal neurons. Neurons were labelled with phalloidin to stain F-actin and βIII-tubulin for neuronal microtubules. Scale bars = 20 µm. (B) Quantitative evaluation of actin protrusion areas. Actin protrusion area was calculated by subtracting the area of βIII-tubulin signal from F-actin area. Data are expressed as median values ± interquartile range of n = total number of neurons from four independent cultures (WT = 253, PRRT2 KO = 255). Median F-actin protruding area (µm2): WT = 235.5, PRRT2 KO = 207.8. Statistical significance was determined by Mann–Whitney test; ** p < 0.01. (C) The biggest growth cone was selected from the mask of the phalloidin channel on the neurons described in (A), and its area, perimeter, and circularity were measured. Scale bars = 20 µm. (D) Quantitative analysis of growth cone parameters. Data are expressed as median ± interquartile range of n = total number of growth cones from three independent cultures (WT = 223, PRRT2 KO = 220). Median growth cone area (µm2): WT = 81.87, PRRT2 KO = 77.86; median growth cone perimeter (µm): WT = 74.30, PRRT2 KO = 70.64; median growth cone circularity (A.U.): WT = 0.192, PRRT2 KO = 0.206. Statistical significance was determined by Mann–Whitney test. (E) The NeuronJ plugin of the ImageJ software was used to trace the neurites on the βIII-tubulin channel of neurons in (A). Scale bar = 20 μm. (F) Quantitative analysis of neuritic elongation expressed as median neurite length, total neurite length, and number of neurites/neurons. Data are expressed as median ± interquartile range of n = total number of neurons from three independent cultures (WT = 162; PRRT2 KO = 153). Median neurite length (µm): WT = 25.33, PRRT2 KO = 24.67; median total neurite length (µm): WT = 139.2, PRRT2 KO = 121.1; median neurites number/neuron: WT = 5, PRRT2 KO = 5. Statistical significance was determined by Mann–Whitney test.
![Cells 10 02666 g003]()
Figure 4.
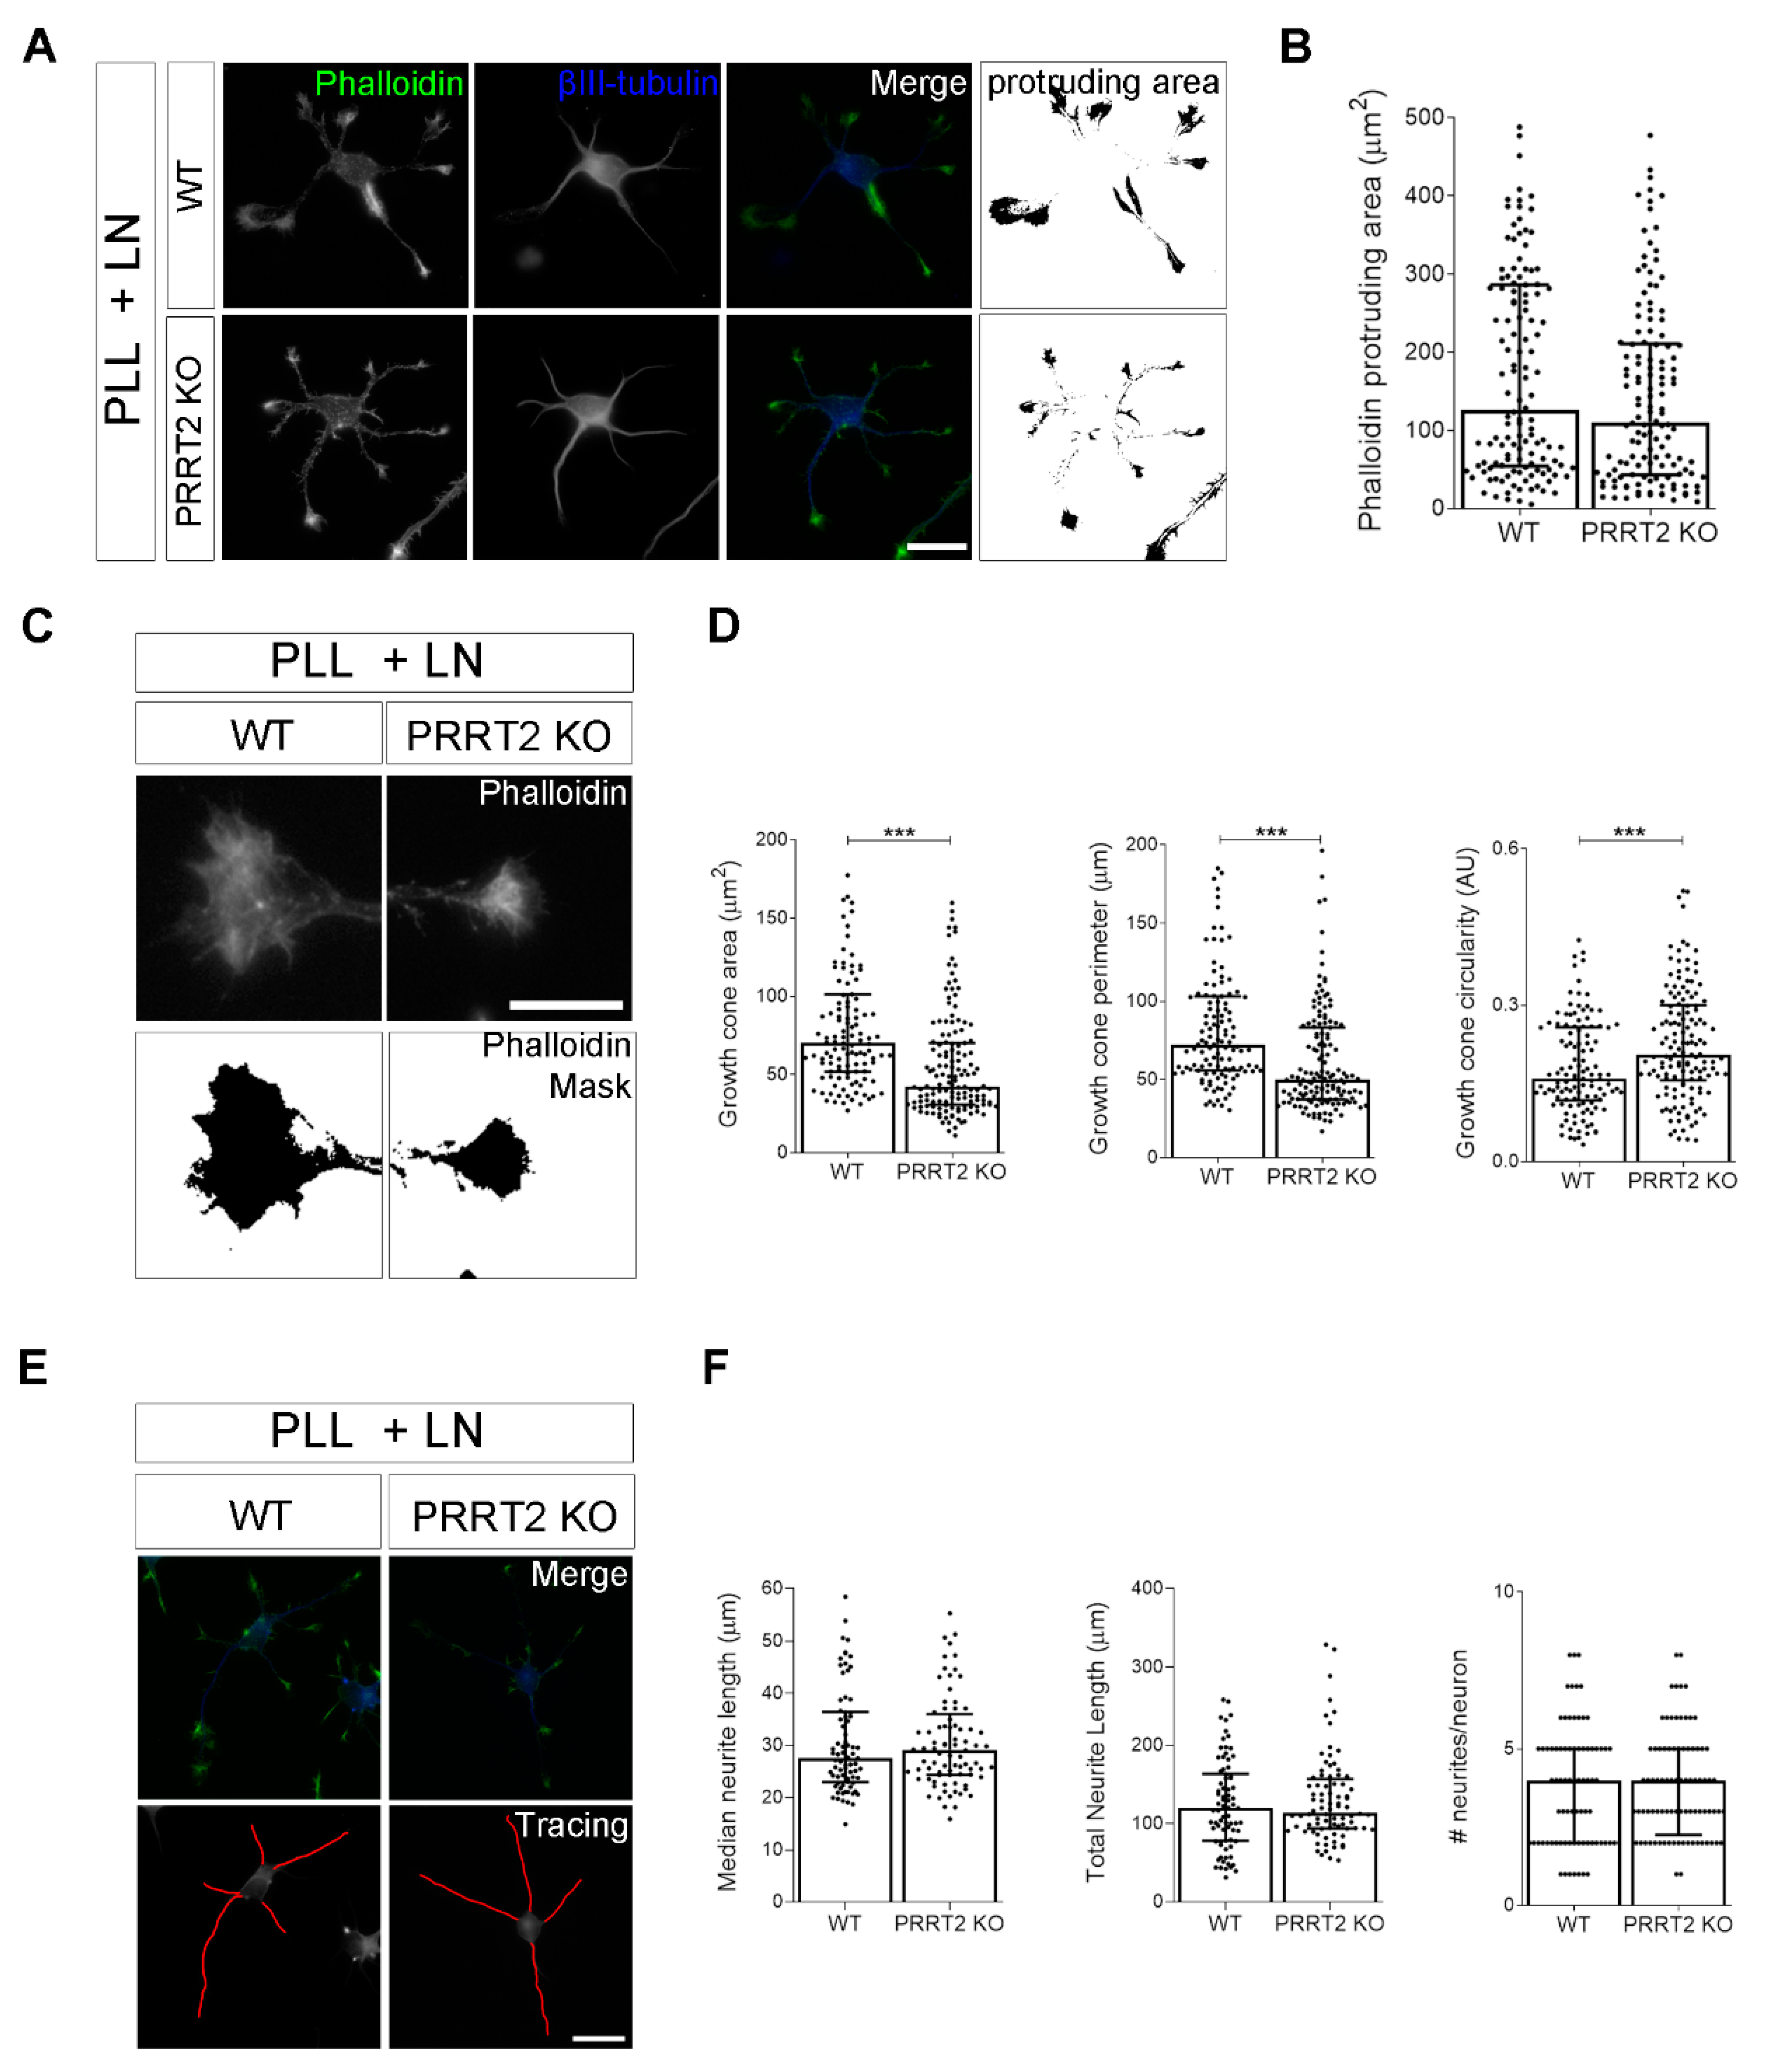
The loss of PRRT2 in hippocampal developing neurons plated on laminin disrupted growth cone size and complexity. (A) Representative images of 1 DIV WT and PRRT2 KO hippocampal neurons plated on poly-l-lysine and laminin (PLL + LN). Neurons were labelled with phalloidin to stain F-actin and βIII-tubulin for neuronal microtubules. Scale bars = 20 µm. (B) Quantitative evaluation of actin protrusion areas. Actin protrusion area was calculated by subtracting the area of βIII-tubulin signal from F-actin area. Data are expressed as median values ± interquartile range of n = total number of neurons from four independent cultures (WT = 130, PRRT2 KO = 134). Median F-actin protruding area (µm2): WT = 126.2, PRRT2 KO = 110.8. Statistical significance was determined by Mann–Whitney test. (C) The biggest growth cone was selected from the mask of the phalloidin channel on the neurons described in (A), and its area, perimeter, and circularity were measured. Scale bars = 20 µm. (D) Quantitative analysis of growth cone parameters. Data are expressed as median ± interquartile range of n = total number of growth cones from three independent cultures (WT = 119, PRRT2 KO = 142). Median growth cone area (µm2): WT = 70.35, PRRT2 KO = 42.47; median growth cone perimeter (µm): WT = 72.28, PRRT2 KO = 50.04; median growth cone circularity (A.U.): WT = 0.160, PRRT2 KO = 0.206. Statistical significance was determined by Mann–Whitney test; *** p < 0.001. (E) The NeuronJ plugin of the ImageJ software was used to trace the neurites on the βIII-tubulin channel of neurons in (A). Scale bar = 20 μm. (F) Quantitative analysis of neuritic elongation expressed as median neurite length, total neurite length, and number of neurites/neurons. Data are expressed as median ± interquartile range of n = total number of neurons from three independent cultures (WT = 78; PRRT2 KO = 84). Median neurite length (µm): WT = 25.33, PRRT2 KO = 24.67; median total neurite length (µm): WT = 119.9, PRRT2 KO = 114.4; median neurites number/neuron: WT = 4, PRRT2 KO = 4. Statistical significance was determined by Mann–Whitney test.
Figure 4.
The loss of PRRT2 in hippocampal developing neurons plated on laminin disrupted growth cone size and complexity. (A) Representative images of 1 DIV WT and PRRT2 KO hippocampal neurons plated on poly-l-lysine and laminin (PLL + LN). Neurons were labelled with phalloidin to stain F-actin and βIII-tubulin for neuronal microtubules. Scale bars = 20 µm. (B) Quantitative evaluation of actin protrusion areas. Actin protrusion area was calculated by subtracting the area of βIII-tubulin signal from F-actin area. Data are expressed as median values ± interquartile range of n = total number of neurons from four independent cultures (WT = 130, PRRT2 KO = 134). Median F-actin protruding area (µm2): WT = 126.2, PRRT2 KO = 110.8. Statistical significance was determined by Mann–Whitney test. (C) The biggest growth cone was selected from the mask of the phalloidin channel on the neurons described in (A), and its area, perimeter, and circularity were measured. Scale bars = 20 µm. (D) Quantitative analysis of growth cone parameters. Data are expressed as median ± interquartile range of n = total number of growth cones from three independent cultures (WT = 119, PRRT2 KO = 142). Median growth cone area (µm2): WT = 70.35, PRRT2 KO = 42.47; median growth cone perimeter (µm): WT = 72.28, PRRT2 KO = 50.04; median growth cone circularity (A.U.): WT = 0.160, PRRT2 KO = 0.206. Statistical significance was determined by Mann–Whitney test; *** p < 0.001. (E) The NeuronJ plugin of the ImageJ software was used to trace the neurites on the βIII-tubulin channel of neurons in (A). Scale bar = 20 μm. (F) Quantitative analysis of neuritic elongation expressed as median neurite length, total neurite length, and number of neurites/neurons. Data are expressed as median ± interquartile range of n = total number of neurons from three independent cultures (WT = 78; PRRT2 KO = 84). Median neurite length (µm): WT = 25.33, PRRT2 KO = 24.67; median total neurite length (µm): WT = 119.9, PRRT2 KO = 114.4; median neurites number/neuron: WT = 4, PRRT2 KO = 4. Statistical significance was determined by Mann–Whitney test.
![Cells 10 02666 g004]()
Figure 5.
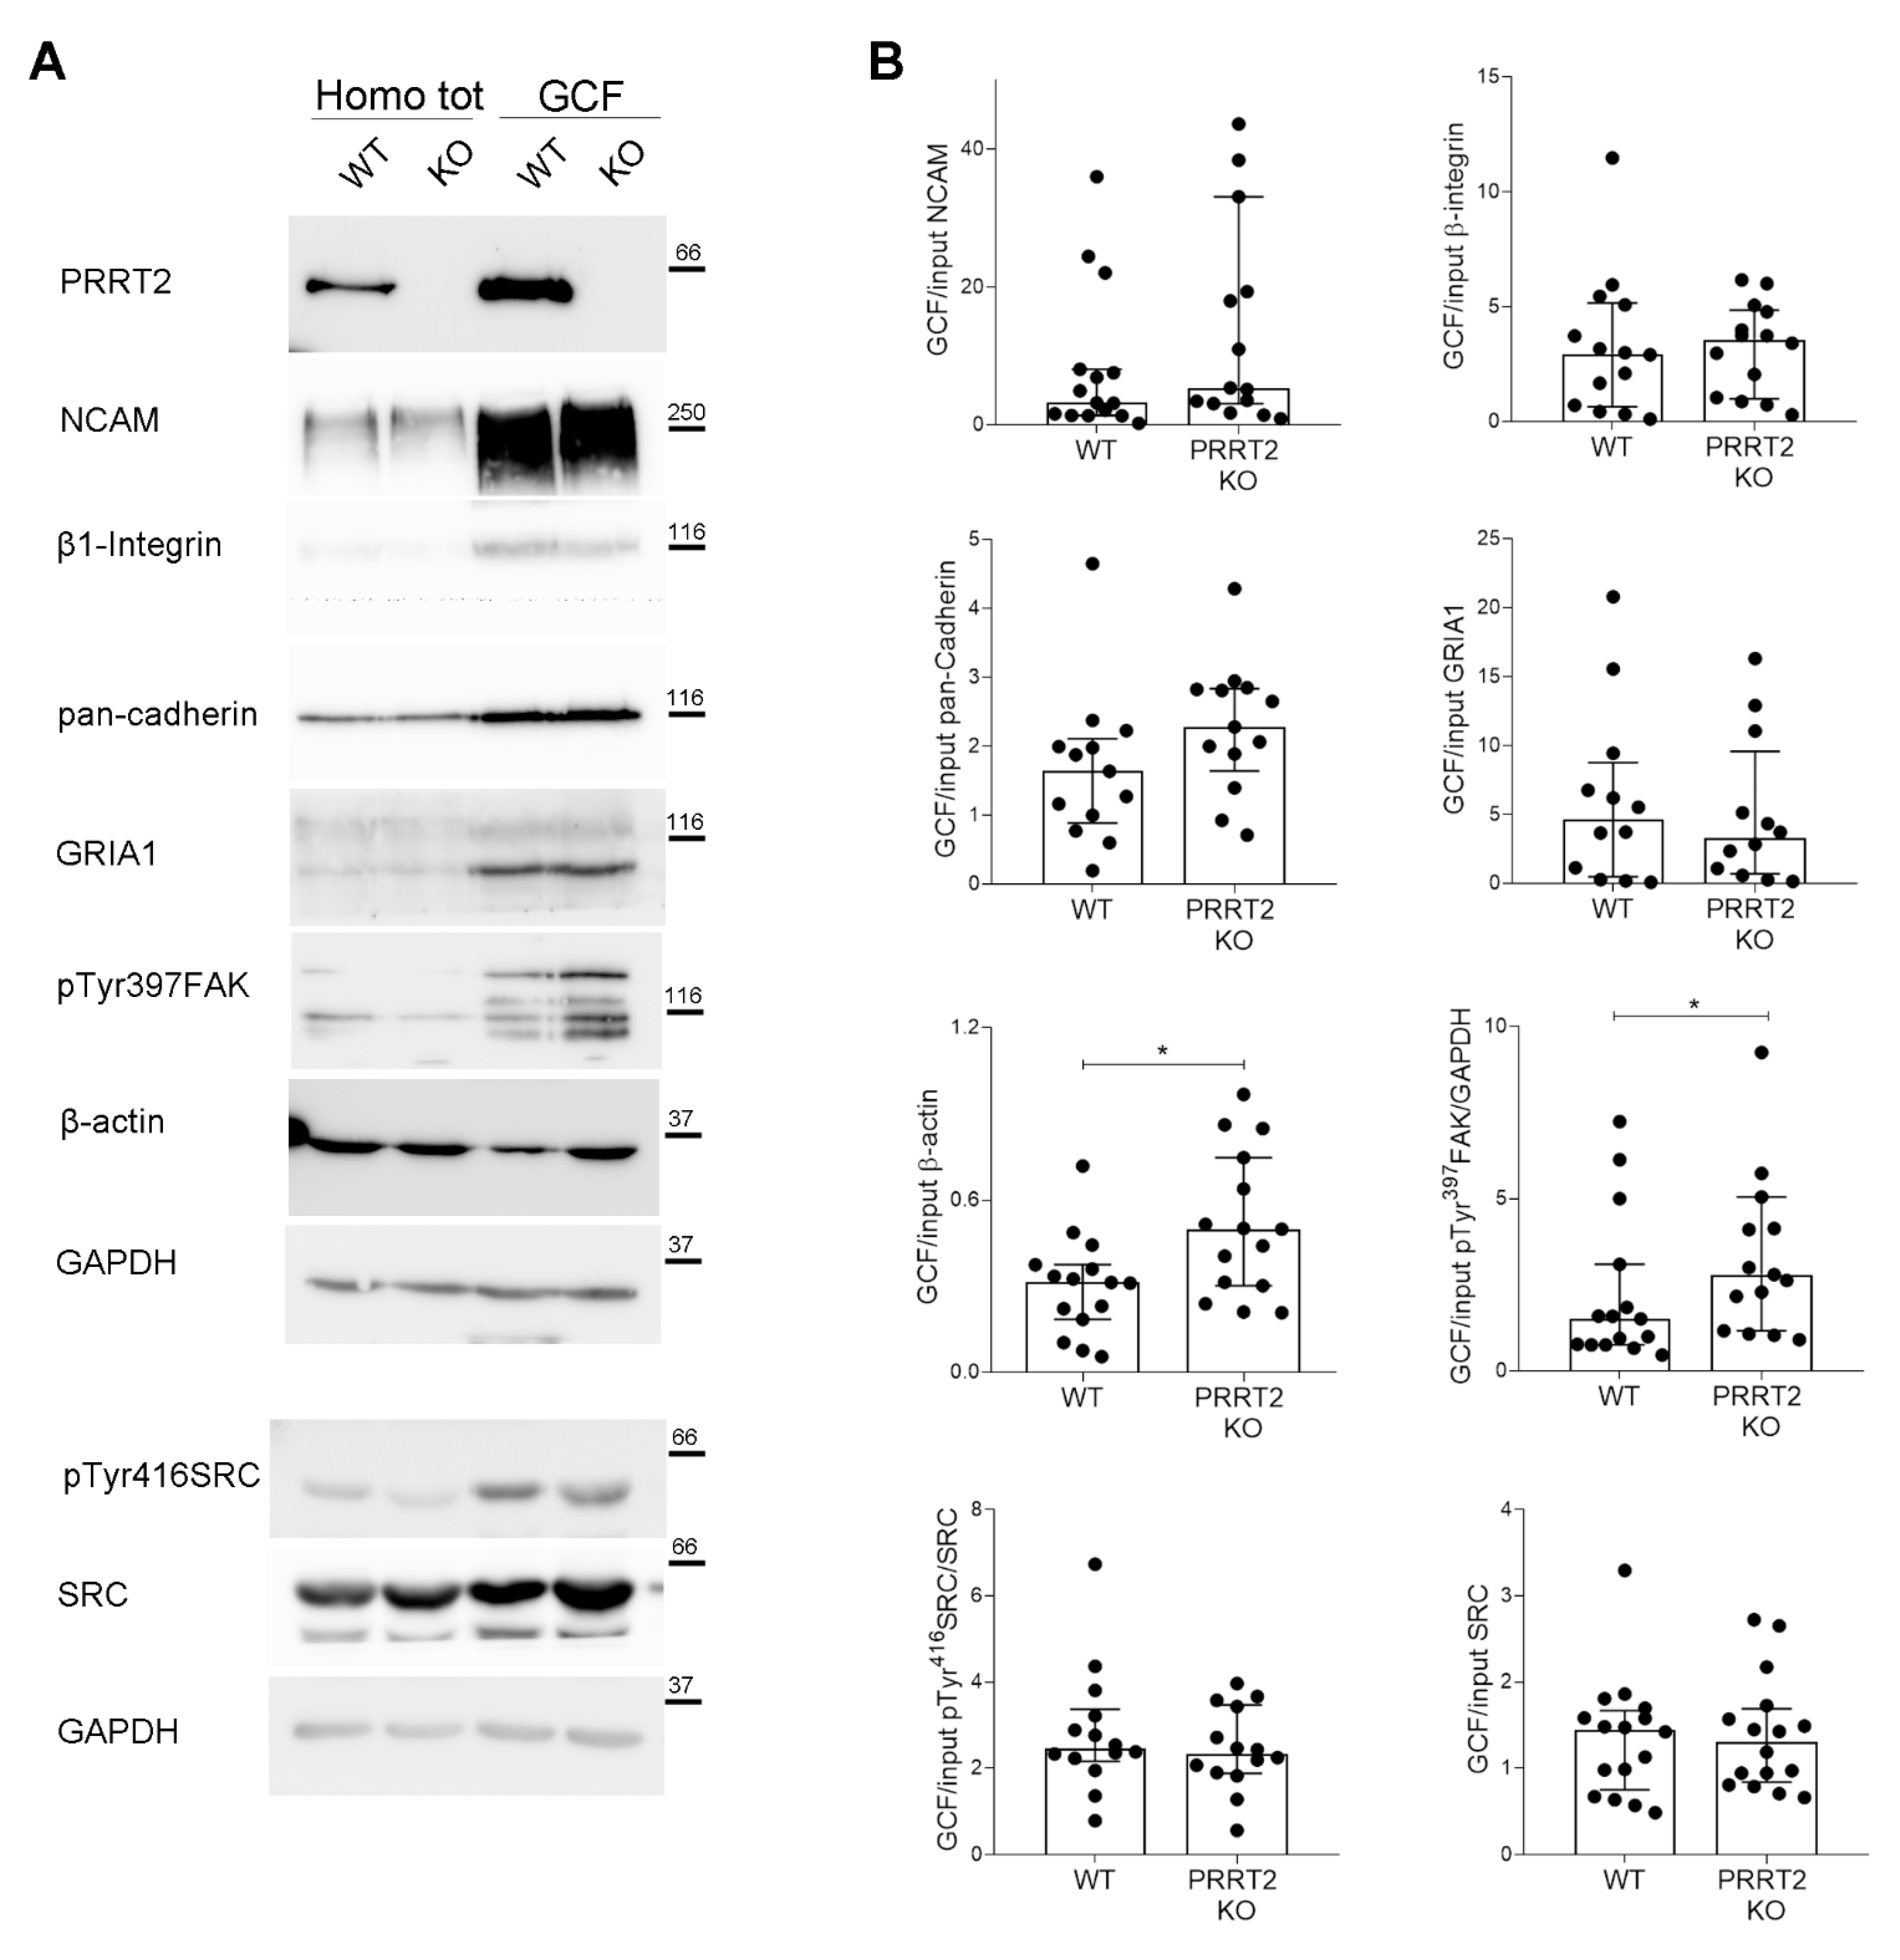
PRRT2 KO growth cones had an increased local actin and pTyr397FAK expression. (A) Representative immunoblot of PRRT2, NCAM, β1-Integrin, pan-cadherin, GRIA1, pTyr397FAK, β-actin, pTyr416SRC, SRC, and GAPDH in post-nuclear supernatant fraction (Homo tot) and growth cone fraction (GCF) from WT and PRRT2 KO embryonic brains. (B) Densitometric analysis of protein levels. Data are represented as ratio of GCF on total homogenate (Input). Median GCF/Input NCAM: WT = 3.2, PRRT2 KO = 5.4; β1-integrin: WT = 2.6, PRRT2 KO = 3.6; pan-cadherin: WT = 1.6, PRRT2 KO = 2.3; GluR1: WT = 4.6, PRRT2 KO = 3.2; β-actin: WT = 0.30, PRRT2 KO = 0.51, pTyr397FAK: WT = 1.5, PRRT2 KO = 2.8; pTyr416SRC: WT = 2.4, PRRT2 KO = 2.3; SRC: WT = 1.4, PRRT2 KO = 1.3. Data are expressed as median ± interquartile range of n = number of embryos. Mann–Whitney test; * p < 0.05.
Figure 5.
PRRT2 KO growth cones had an increased local actin and pTyr397FAK expression. (A) Representative immunoblot of PRRT2, NCAM, β1-Integrin, pan-cadherin, GRIA1, pTyr397FAK, β-actin, pTyr416SRC, SRC, and GAPDH in post-nuclear supernatant fraction (Homo tot) and growth cone fraction (GCF) from WT and PRRT2 KO embryonic brains. (B) Densitometric analysis of protein levels. Data are represented as ratio of GCF on total homogenate (Input). Median GCF/Input NCAM: WT = 3.2, PRRT2 KO = 5.4; β1-integrin: WT = 2.6, PRRT2 KO = 3.6; pan-cadherin: WT = 1.6, PRRT2 KO = 2.3; GluR1: WT = 4.6, PRRT2 KO = 3.2; β-actin: WT = 0.30, PRRT2 KO = 0.51, pTyr397FAK: WT = 1.5, PRRT2 KO = 2.8; pTyr416SRC: WT = 2.4, PRRT2 KO = 2.3; SRC: WT = 1.4, PRRT2 KO = 1.3. Data are expressed as median ± interquartile range of n = number of embryos. Mann–Whitney test; * p < 0.05.


 ,
, 