
Comparative Analysis of Six IRF Family Members in Alveolar Epithelial Cell-Intrinsic Antiviral Responses


Abstract
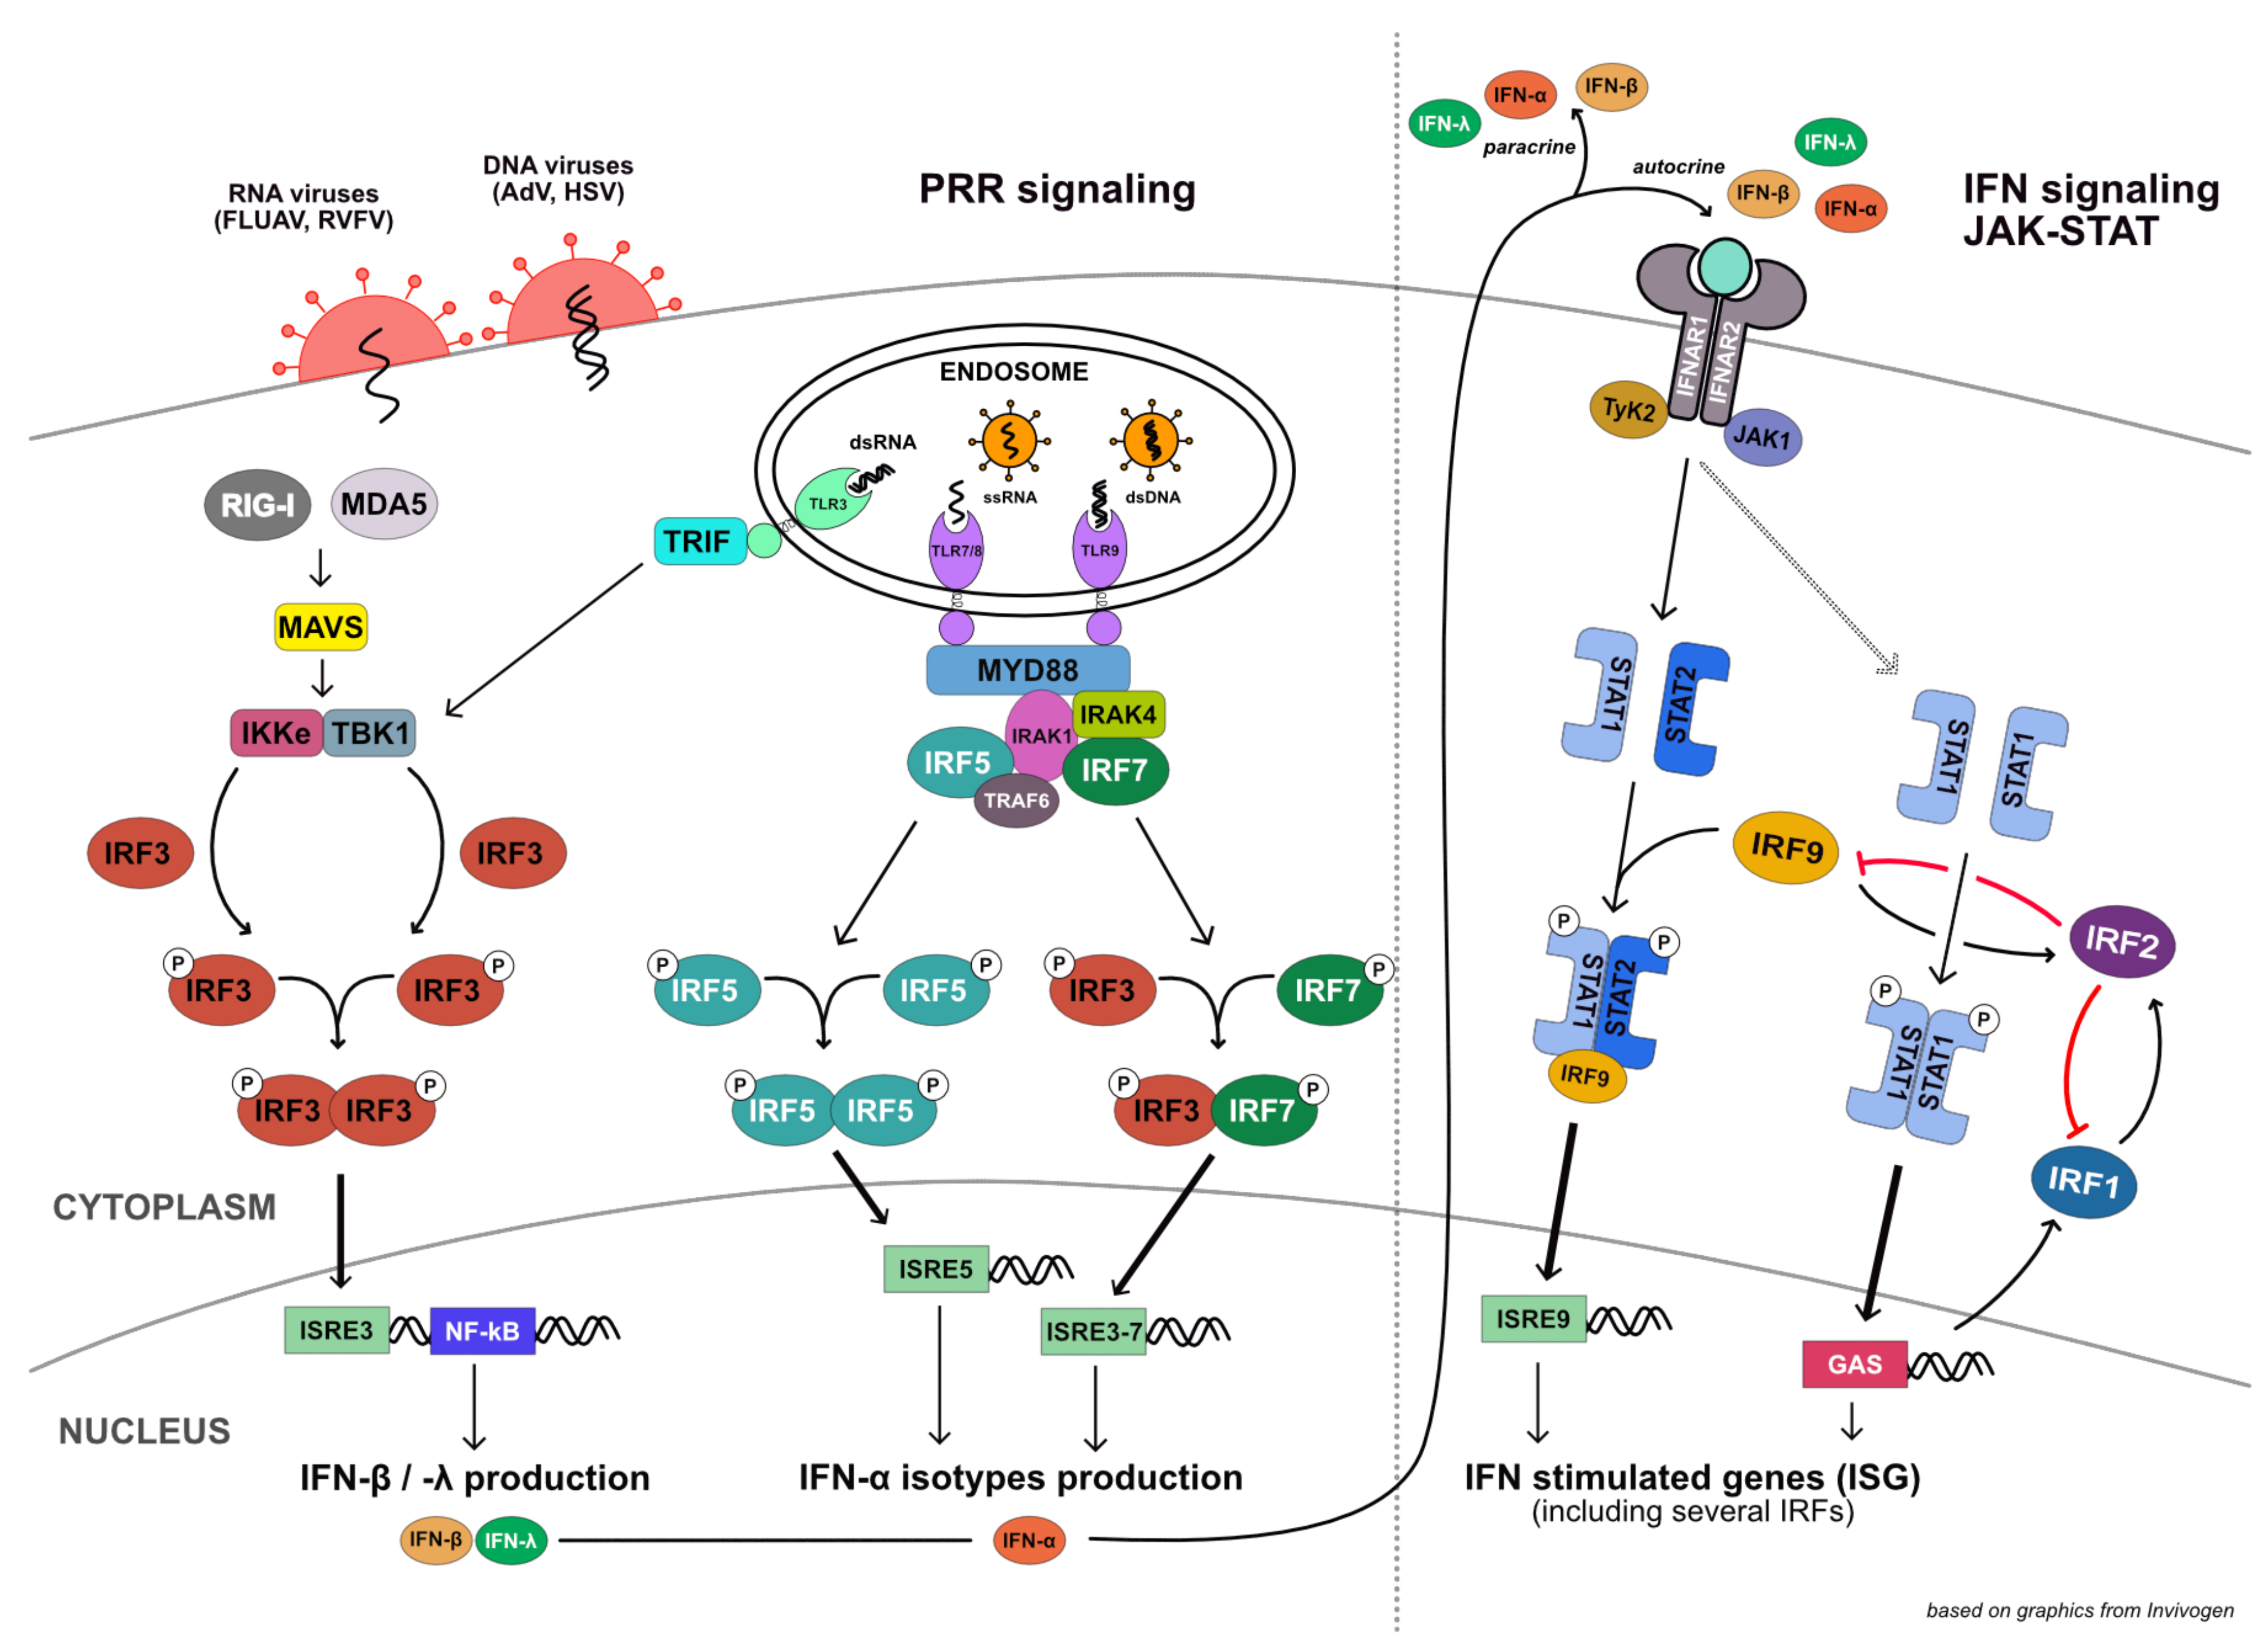
:1. Introduction
2. Materials and Methods
2.1. Cell Lines
2.1.1. Generation of A549 CRISPR/Cas9 Knockout Cell Lines
2.1.2. Validation of CRISPR/Cas9 Knockouts
Validation by Immunoblotting
Validation of Functional Knockout (Quantitative RT-PCR)
Validation by Sequencing of Genomic Loci
2.1.3. Generation of A549 Overexpression Cell Lines
Validation of IRF1, IRF5, and IRF7 Overexpression by Immunoblotting
Validation of IRF1, IRF5, and IRF7 Overexpression by Quantitative RT-PCR
2.2. Virus Stock Production and Titration
2.2.1. Influenza A SC35M Virus Stock Production
2.2.2. Rift Valley Fever Virus Stock Production
2.2.3. Adenovirus Stock Production
2.2.4. Herpes Simplex Virus 1 Stock Production
2.2.5. Virus Stock Titration by Plaque Assay
2.2.6. Virus Stock Titration by TCID50 Luciferase Assay
2.3. Virus Infections
2.3.1. Rift Valley Fever Virus Infection
2.3.2. Influenza A SC35M Virus Infection
2.3.3. Adenovirus Infection
2.3.4. Herpes Simplex Virus 1 Infection
2.4. IFN Stimulation
2.5. dsRNA Stimulation
2.6. Read-Out Methods
2.6.1. Read-Out by Luciferase Assay
2.6.2. Read-Out by Immunoblot
2.6.3. Read-Out by Quantitative RT-PCR
2.6.4. Read-Out by MSD Electroluminescent Multiplex Assay
2.7. Statistics
3. Results
3.1. Generation of Knockout Cell Lines and Regulation of IRF Expression
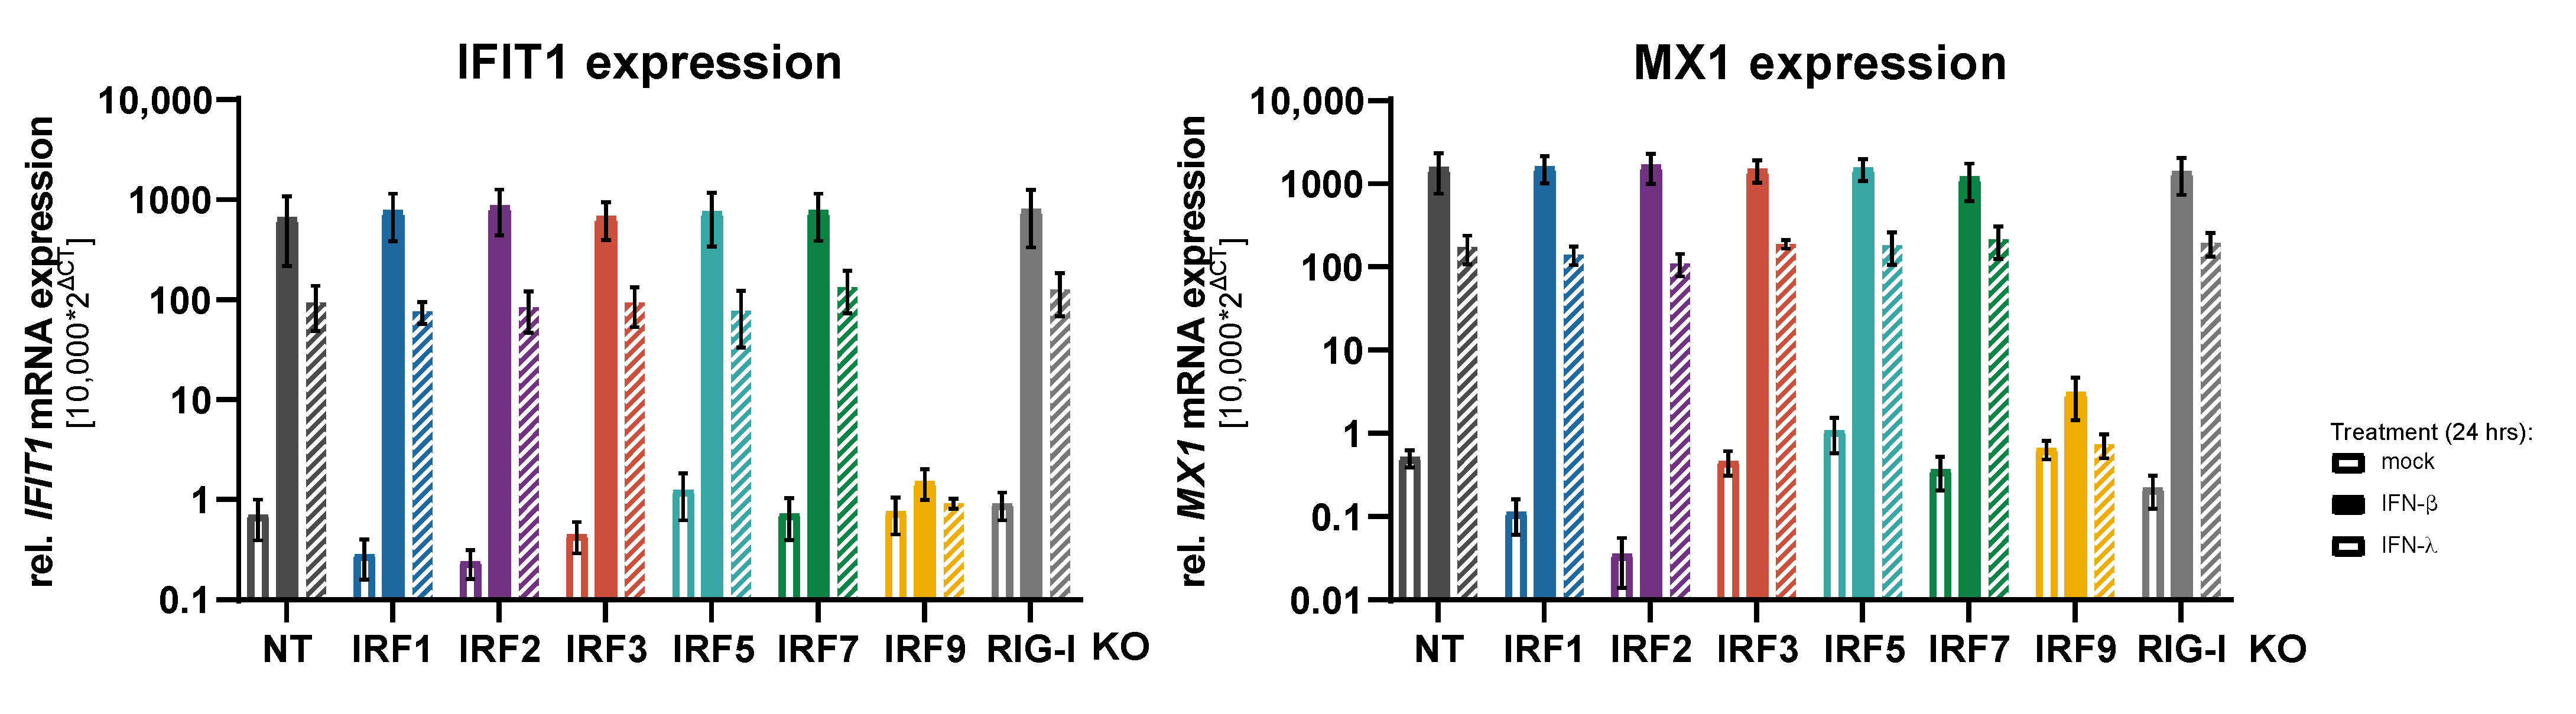
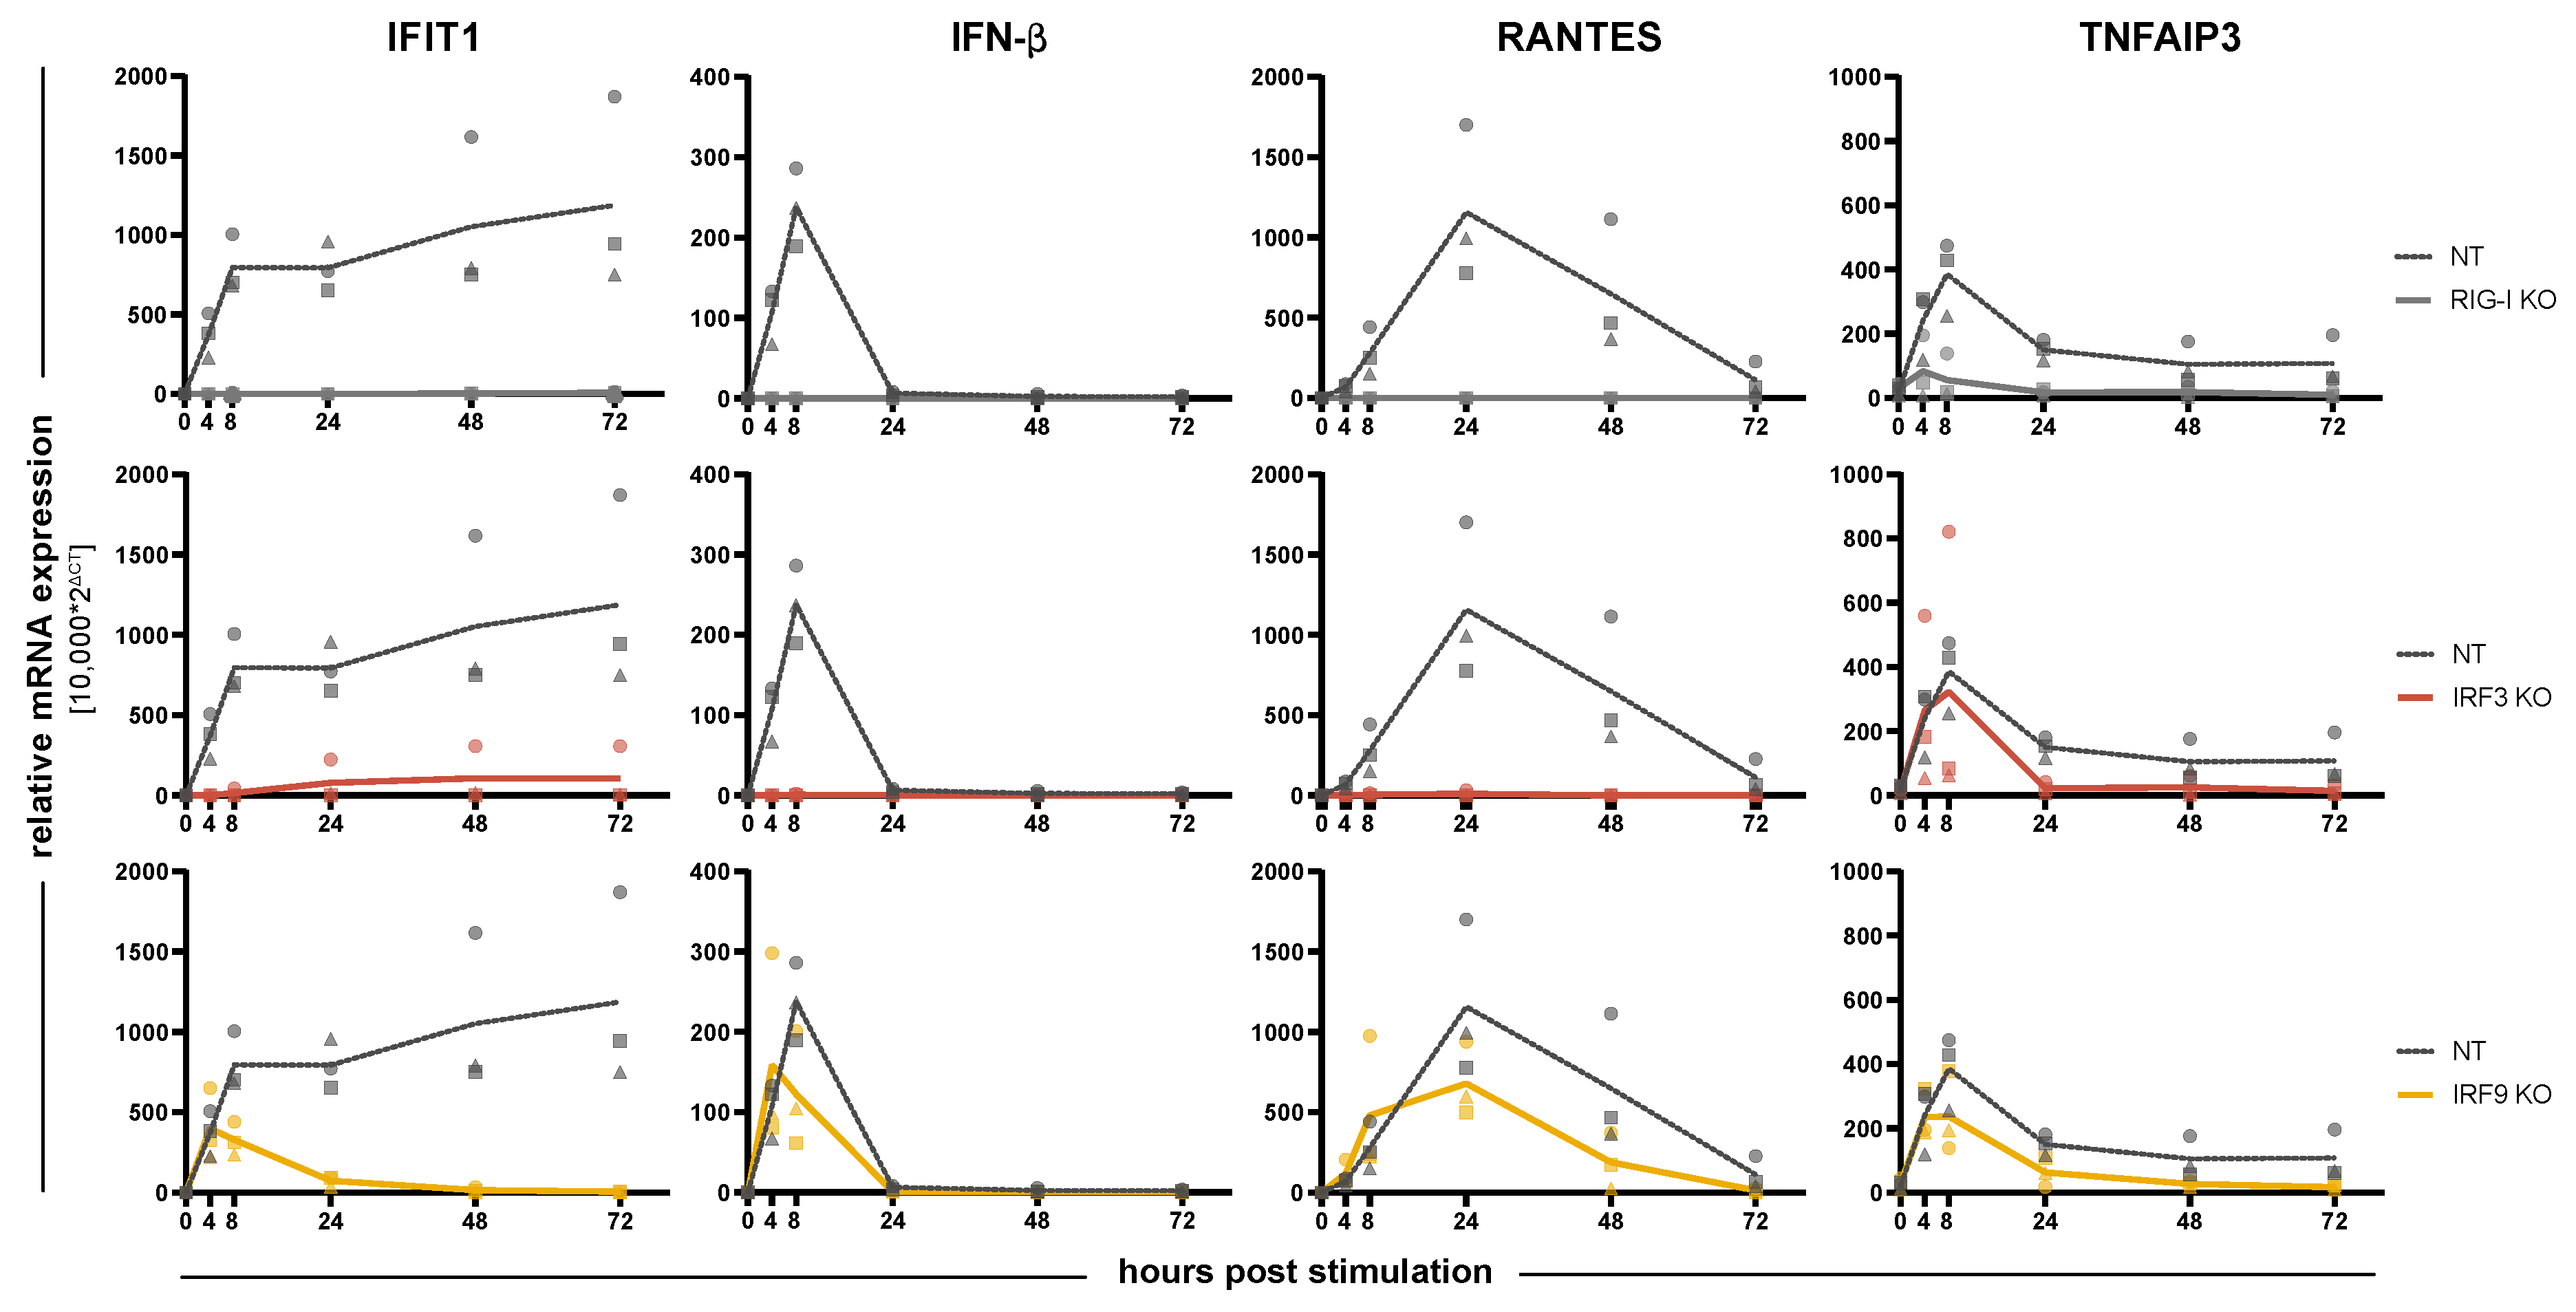
3.2. Impact of IRFs on the Induction of Antiviral Response Gene Expression
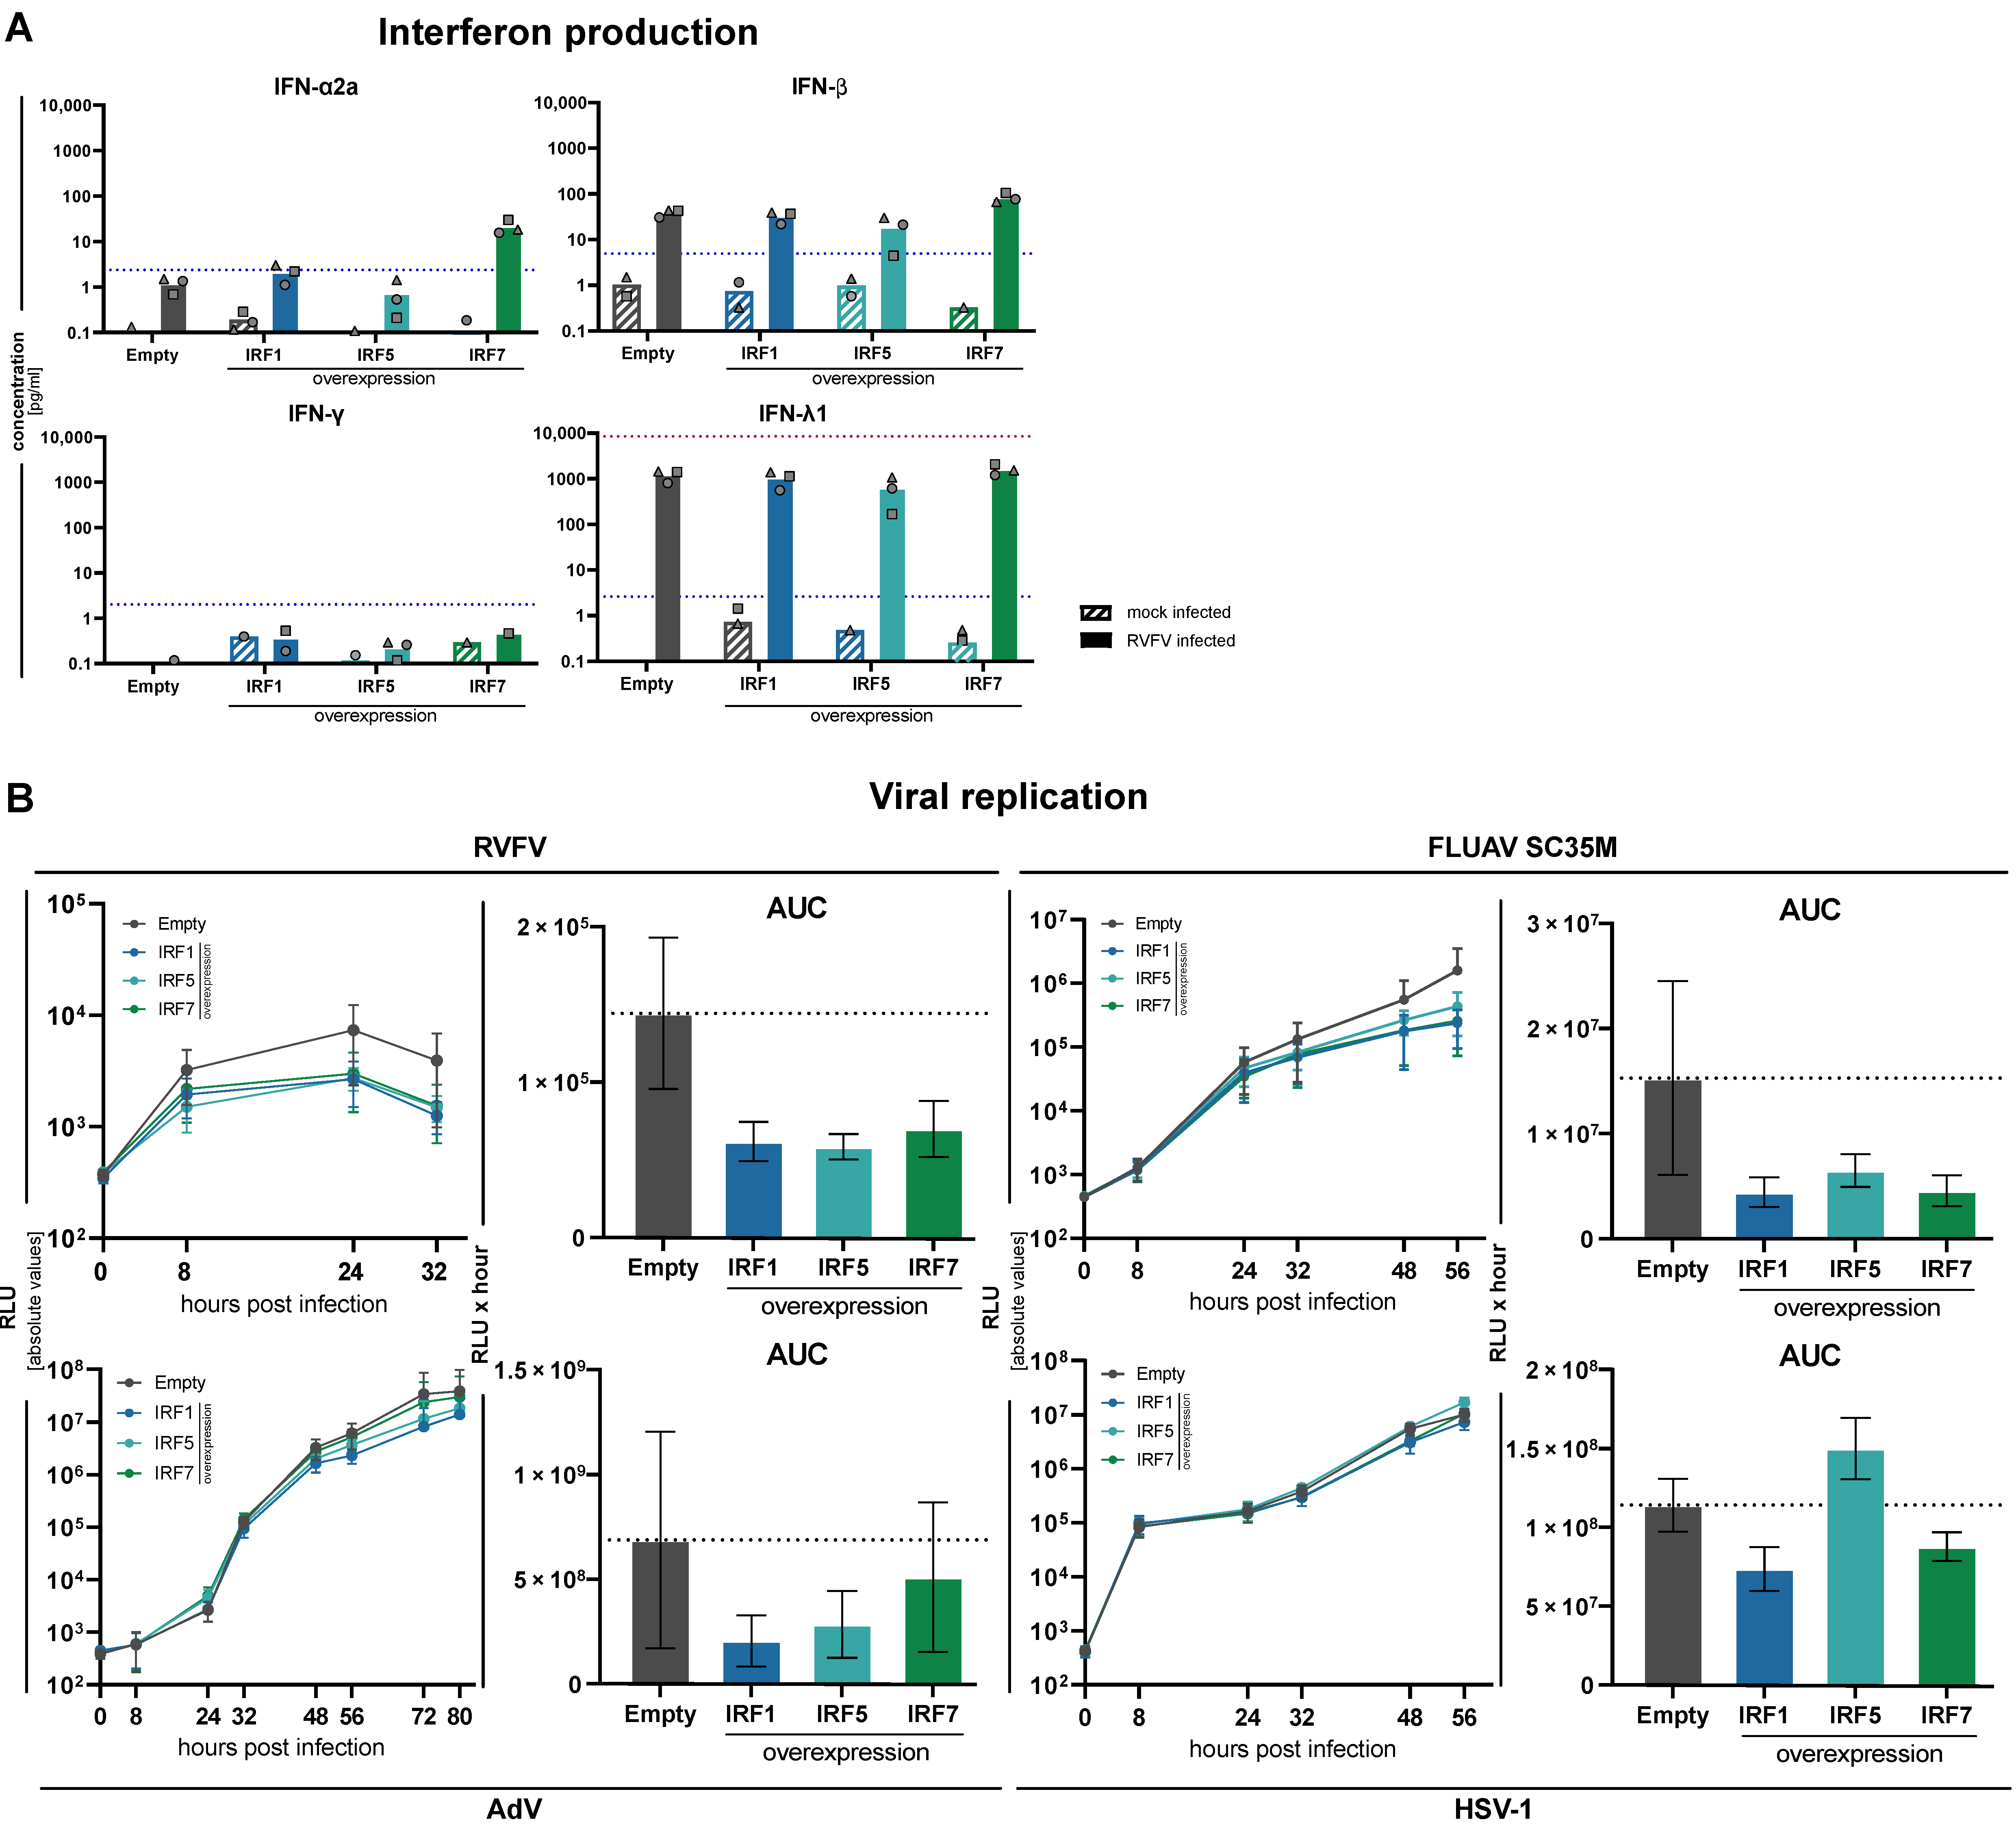
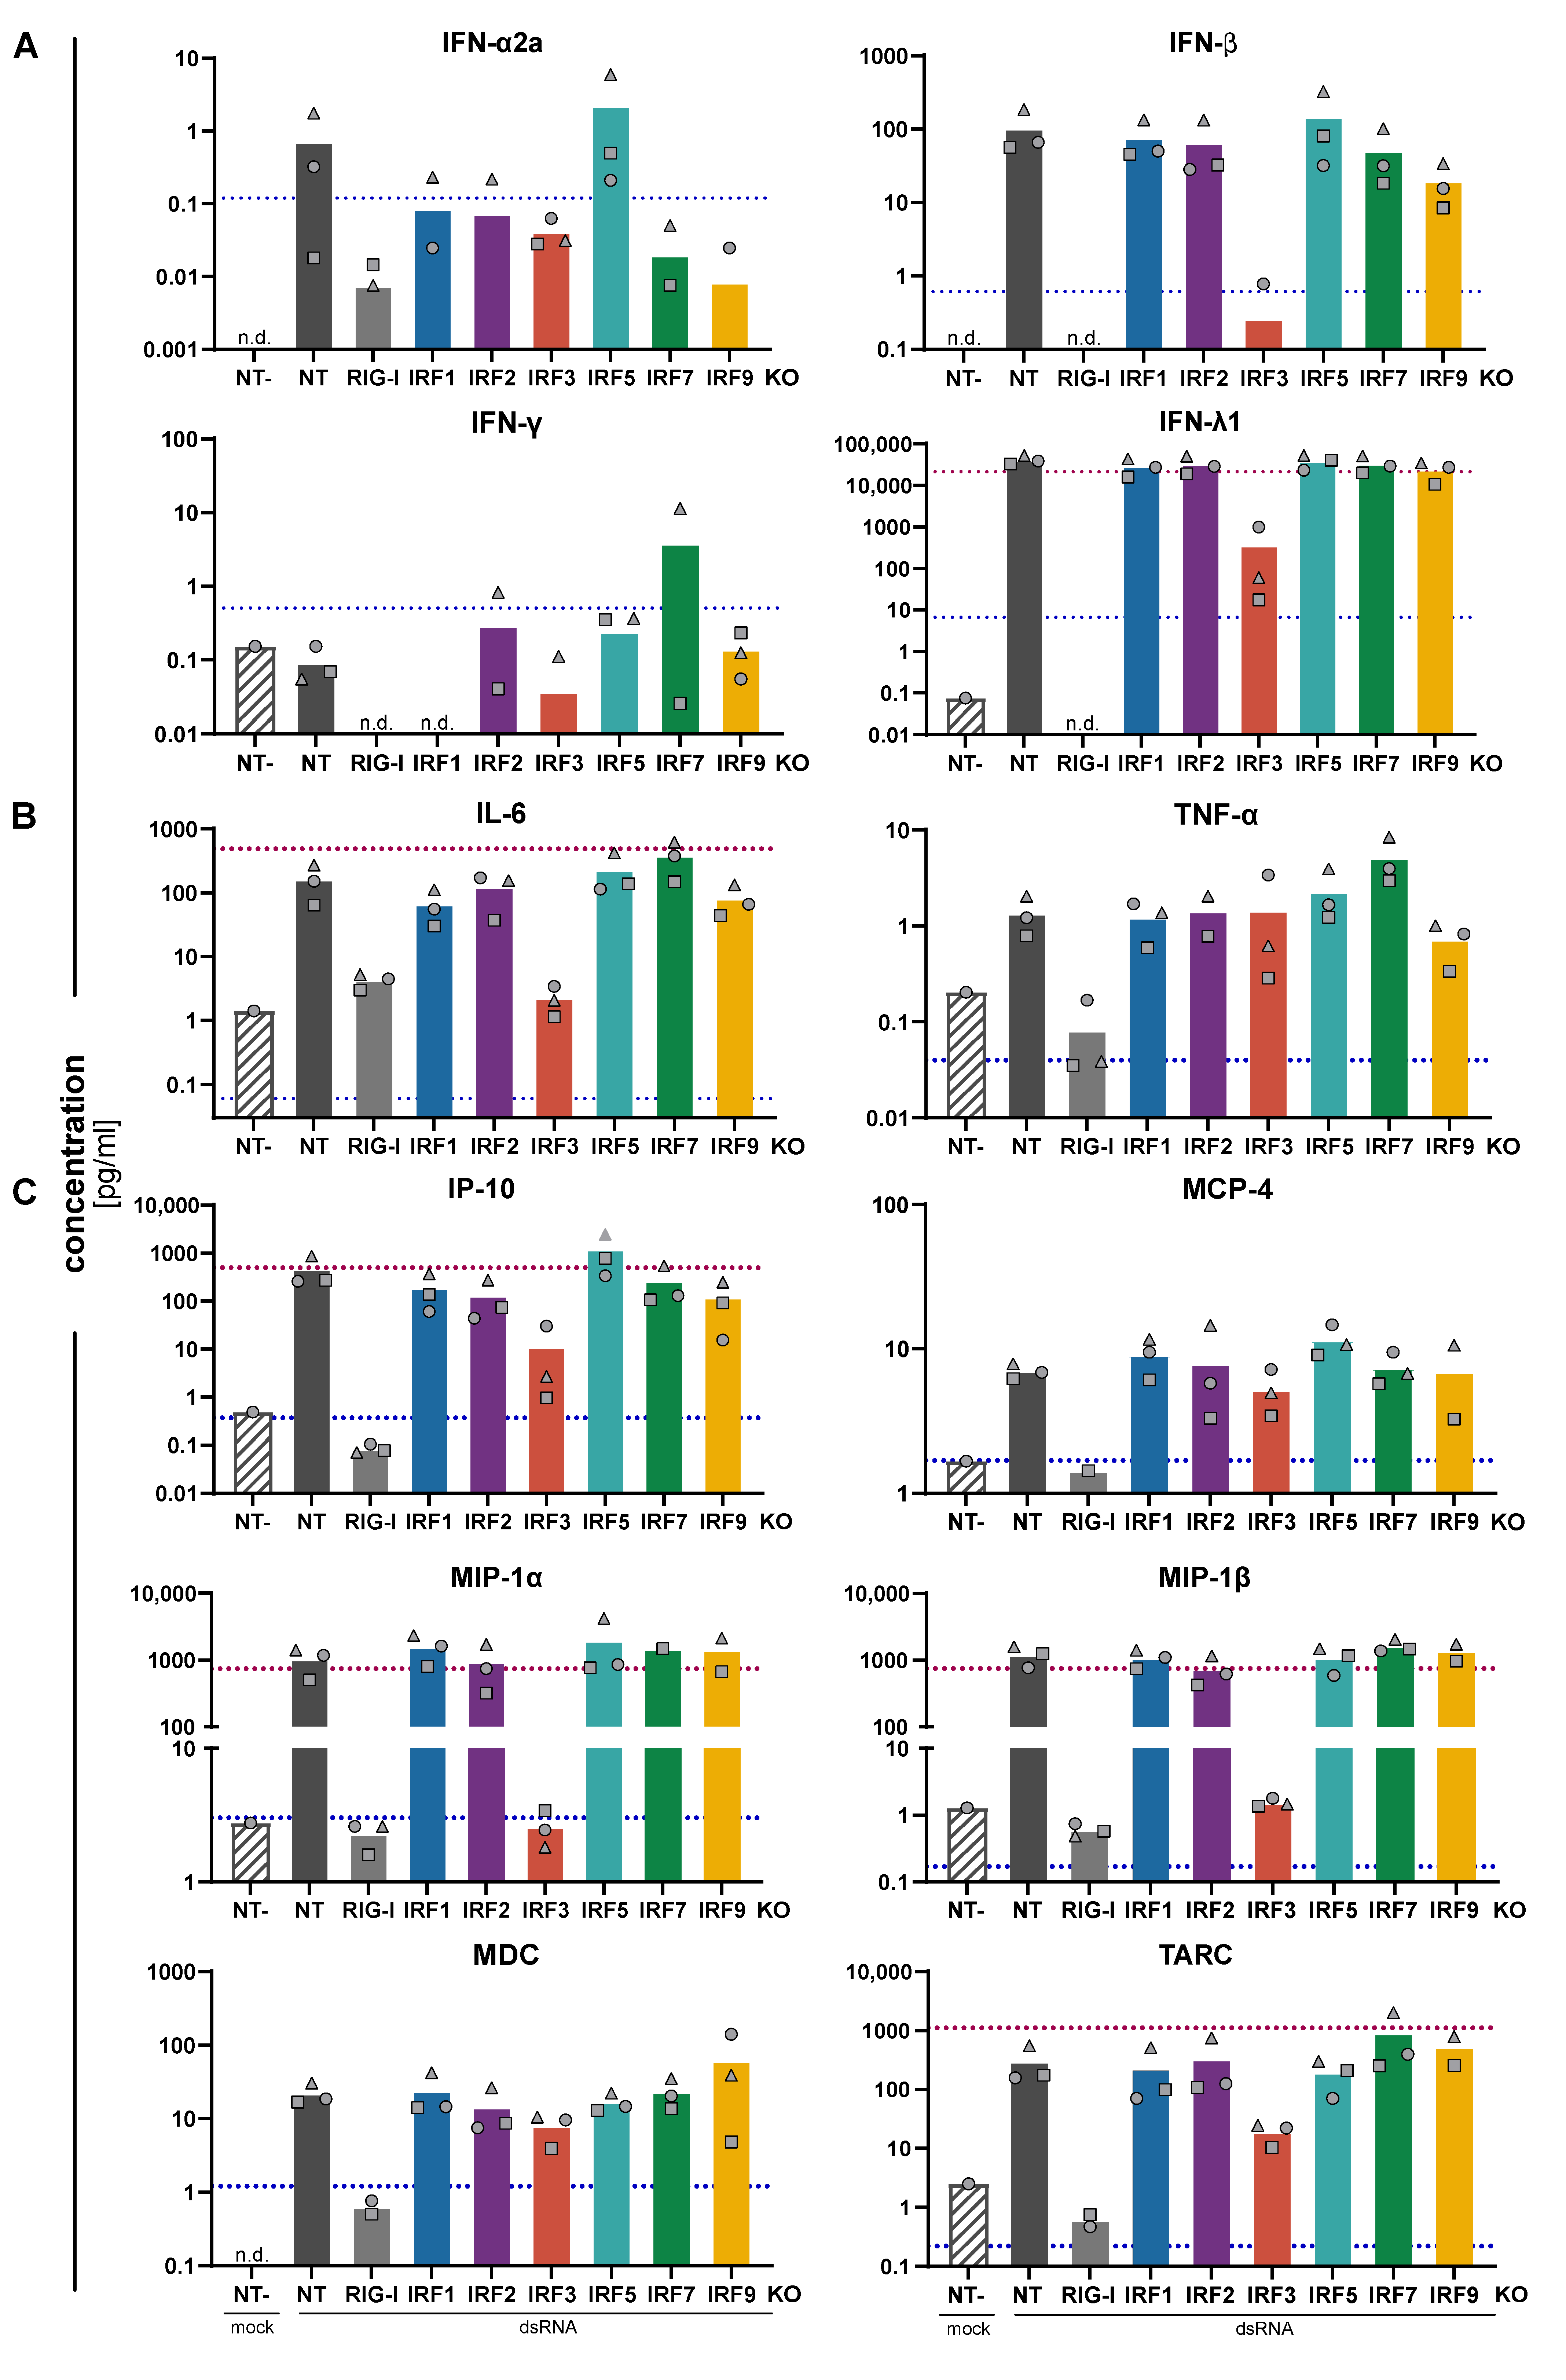
3.3. Impact of IRFs on the Expression Pattern of Cytokines and Chemokines
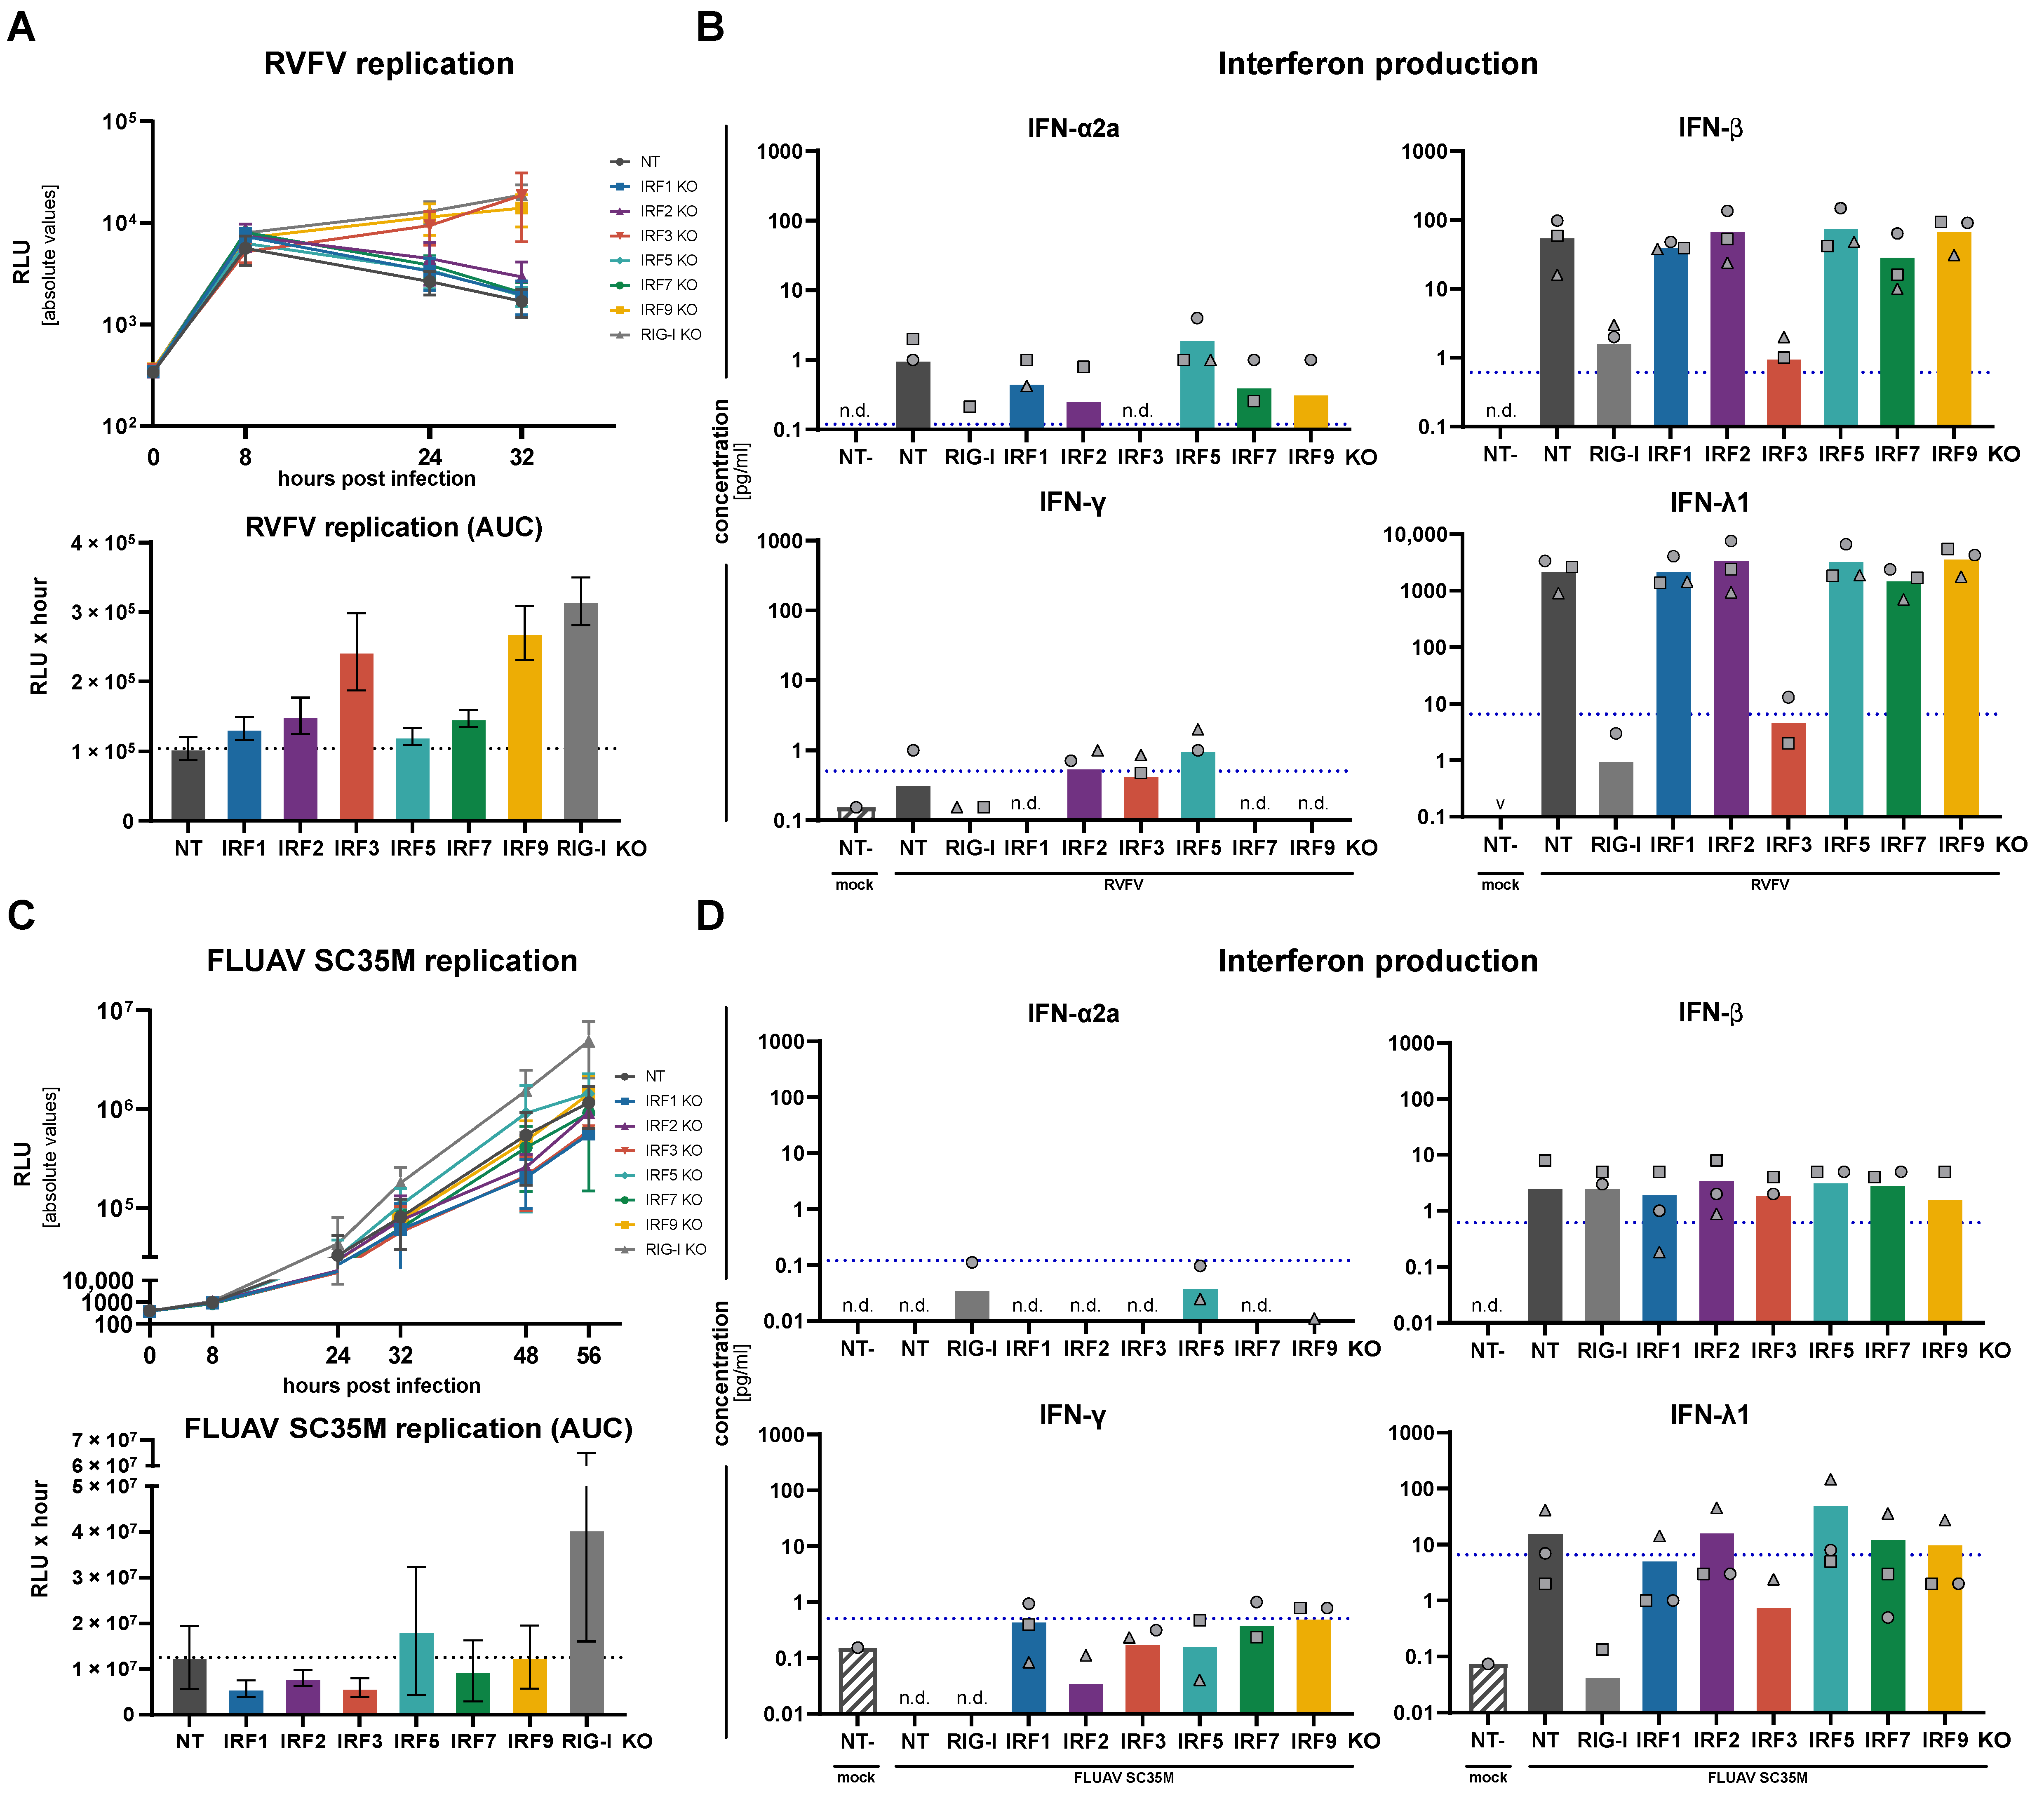
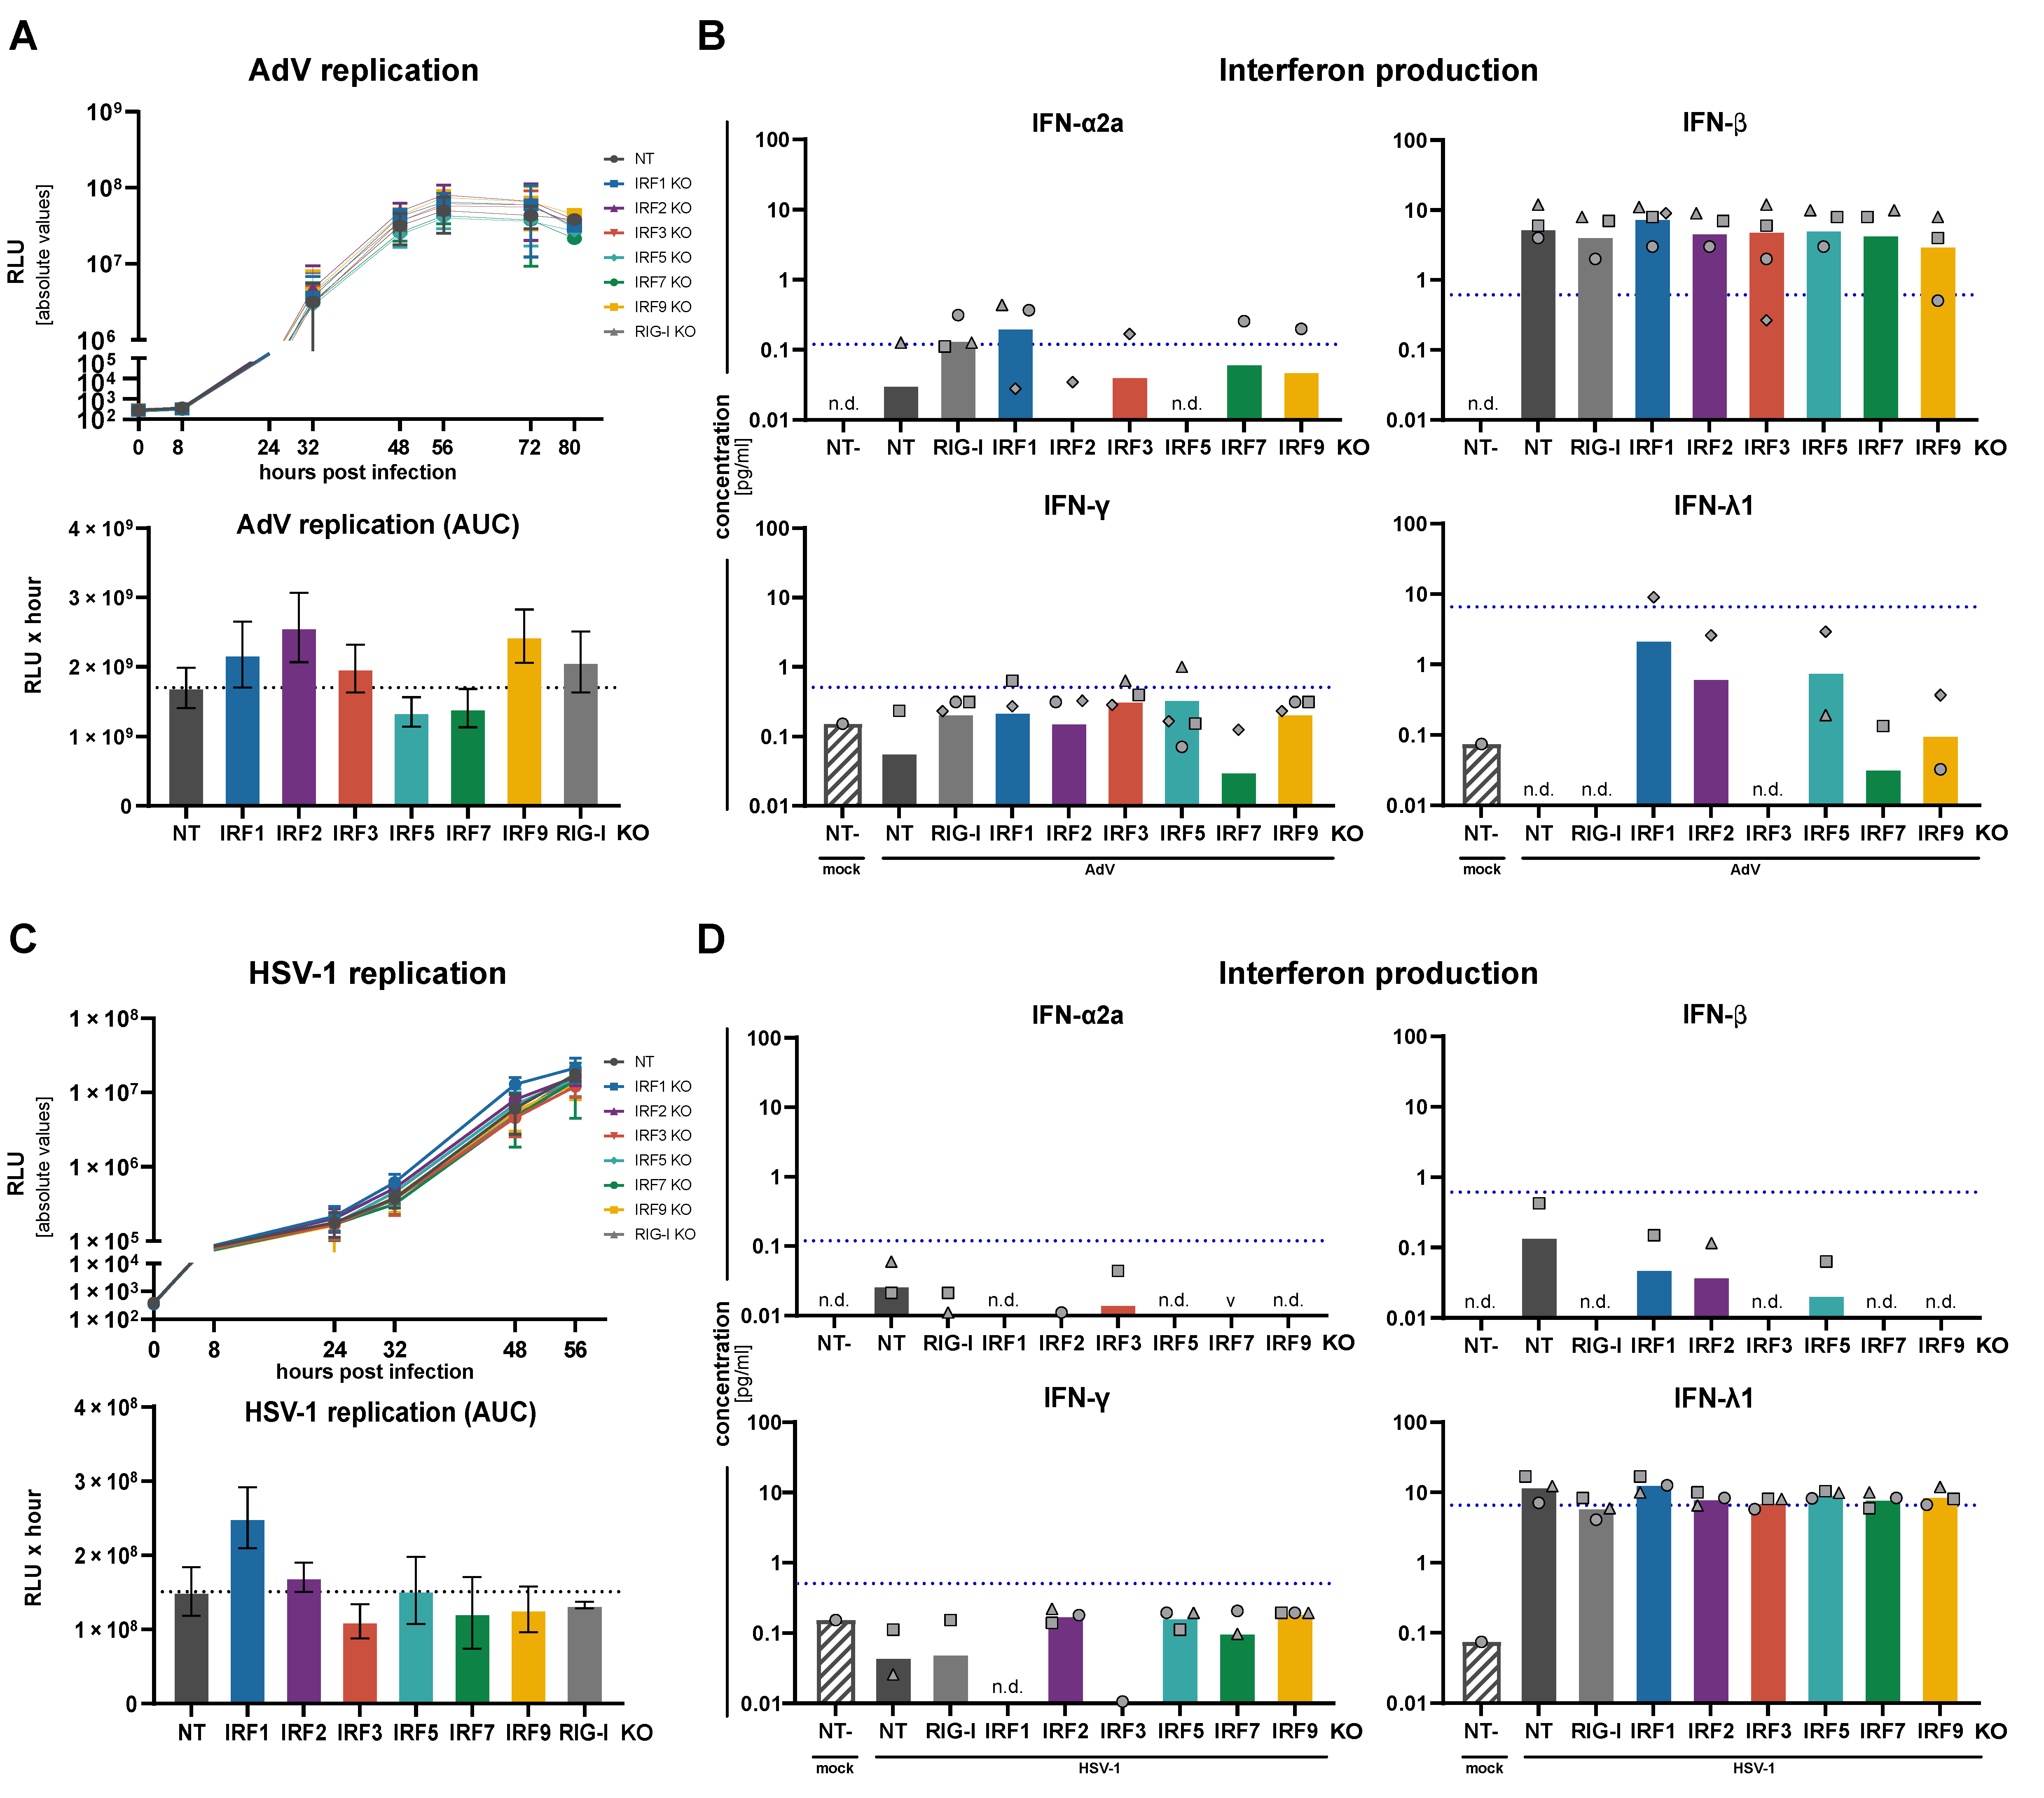
3.4. Replication of RNA and DNA Viruses under IRF KO Conditions
3.5. Impact of Increased Expression of IRF1, IRF5 and IRF7
4. Discussion
Supplementary Materials
Author Contributions
Funding
Institutional Review Board Statement
Informed Consent Statement
Data Availability Statement
Acknowledgments
Conflicts of Interest
References
- Bastard, P.; Rosen, L.B.; Zhang, Q.; Michailidis, E.; Hoffmann, H.H.; Zhang, Y.; Dorgham, K.; Philippot, Q.; Rosain, J.; Beziat, V.; et al. Autoantibodies against type I IFNs in patients with life-threatening COVID-19. Science 2020, 370, eabd4585. [Google Scholar] [CrossRef]
- Zhang, X.; Tan, Y.; Ling, Y.; Lu, G.; Liu, F.; Yi, Z.; Jia, X.; Wu, M.; Shi, B.; Xu, S.; et al. Viral and host factors related to the clinical outcome of COVID-19. Nature 2020, 583, 437–440. [Google Scholar] [CrossRef]
- Loske, J.; Rohmel, J.; Lukassen, S.; Stricker, S.; Magalhaes, V.G.; Liebig, J.; Chua, R.L.; Thurmann, L.; Messingschlager, M.; Seegebarth, A.; et al. Pre-activated antiviral innate immunity in the upper airways controls early SARS-CoV-2 infection in children. Nat. Biotechnol. 2021. [Google Scholar] [CrossRef] [PubMed]
- Schoenemeyer, A.; Barnes, B.J.; Mancl, M.E.; Latz, E.; Goutagny, N.; Pitha, P.M.; Fitzgerald, K.A.; Golenbock, D.T. The interferon regulatory factor, IRF5, is a central mediator of toll-like receptor 7 signaling. J. Biol. Chem. 2005, 280, 17005–17012. [Google Scholar] [CrossRef] [PubMed] [Green Version]
- Heinz, L.X.; Lee, J.; Kapoor, U.; Kartnig, F.; Sedlyarov, V.; Papakostas, K.; Cesar-Razquin, A.; Essletzbichler, P.; Goldmann, U.; Stefanovic, A.; et al. TASL is the SLC15A4-associated adaptor for IRF5 activation by TLR7-9. Nature 2020, 581, 316–322. [Google Scholar] [CrossRef] [PubMed]
- Barnes, B.J.; Moore, P.A.; Pitha, P.M. Virus-specific activation of a novel interferon regulatory factor, IRF-5, results in the induction of distinct interferon alpha genes. J. Biol. Chem. 2001, 276, 23382–23390. [Google Scholar] [CrossRef] [PubMed] [Green Version]
- Yanai, H.; Chen, H.M.; Inuzuka, T.; Kondo, S.; Mak, T.W.; Takaoka, A.; Honda, K.; Taniguchi, T. Role of IFN regulatory factor 5 transcription factor in antiviral immunity and tumor suppression. Proc. Natl. Acad. Sci. USA 2007, 104, 3402–3407. [Google Scholar] [CrossRef] [Green Version]
- Paun, A.; Reinert, J.T.; Jiang, Z.; Medin, C.; Balkhi, M.Y.; Fitzgerald, K.A.; Pitha, P.M. Functional characterization of murine interferon regulatory factor 5 (IRF-5) and its role in the innate antiviral response. J. Biol. Chem. 2008, 283, 14295–14308. [Google Scholar] [CrossRef] [Green Version]
- Lazear, H.M.; Lancaster, A.; Wilkins, C.; Suthar, M.S.; Huang, A.; Vick, S.C.; Clepper, L.; Thackray, L.; Brassil, M.M.; Virgin, H.W.; et al. IRF-3, IRF-5, and IRF-7 coordinately regulate the type I IFN response in myeloid dendritic cells downstream of MAVS signaling. PLoS Pathog. 2013, 9, e1003118. [Google Scholar] [CrossRef]
- Negishi, H.; Taniguchi, T.; Yanai, H. The Interferon (IFN) Class of Cytokines and the IFN Regulatory Factor (IRF) Transcription Factor Family. Cold Spring Harb. Perspect. Biol. 2018, 10, a028423. [Google Scholar] [CrossRef]
- Bluyssen, A.R.; Durbin, J.E.; Levy, D.E. ISGF3 gamma p48, a specificity switch for interferon activated transcription factors. Cytokine Growth Factor Rev. 1996, 7, 11–17. [Google Scholar] [CrossRef]
- Hida, S.; Ogasawara, K.; Sato, K.; Abe, M.; Takayanagi, H.; Yokochi, T.; Sato, T.; Hirose, S.; Shirai, T.; Taki, S.; et al. CD8(+) T cell-mediated skin disease in mice lacking IRF-2, the transcriptional attenuator of interferon-alpha/beta signaling. Immunity 2000, 13, 643–655. [Google Scholar] [CrossRef] [Green Version]
- Decker, T.; Muller, M.; Stockinger, S. The yin and yang of type I interferon activity in bacterial infection. Nat. Rev. Immunol. 2005, 5, 675–687. [Google Scholar] [CrossRef] [PubMed]
- Kok, F.; Rosenblatt, M.; Teusel, M.; Nizharadze, T.; Magalhaes, V.G.; Dachert, C.; Maiwald, T.; Vlasov, A.; Wasch, M.; Tyufekchieva, S.; et al. Disentangling molecular mechanisms regulating sensitization of interferon alpha signal transduction. Mol. Syst. Biol. 2020, 16, e8955. [Google Scholar] [CrossRef]
- Feng, H.; Zhang, Y.B.; Gui, J.F.; Lemon, S.M.; Yamane, D. Interferon regulatory factor 1 (IRF1) and anti-pathogen innate immune responses. PLoS Pathog. 2021, 17, e1009220. [Google Scholar] [CrossRef]
- Kimura, T.; Nakayama, K.; Penninger, J.; Kitagawa, M.; Harada, H.; Matsuyama, T.; Tanaka, N.; Kamijo, R.; Vilcek, J.; Mak, T.W.; et al. Involvement of the IRF-1 transcription factor in antiviral responses to interferons. Science 1994, 264, 1921–1924. [Google Scholar] [CrossRef]
- Forero, A.; Ozarkar, S.; Li, H.; Lee, C.H.; Hemann, E.A.; Nadjsombati, M.S.; Hendricks, M.R.; So, L.; Green, R.; Roy, C.N.; et al. Differential Activation of the Transcription Factor IRF1 Underlies the Distinct Immune Responses Elicited by Type I and Type III Interferons. Immunity 2019, 51, 451–464.e456. [Google Scholar] [CrossRef]
- Harada, H.; Fujita, T.; Miyamoto, M.; Kimura, Y.; Maruyama, M.; Furia, A.; Miyata, T.; Taniguchi, T. Structurally similar but functionally distinct factors, IRF-1 and IRF-2, bind to the same regulatory elements of IFN and IFN-inducible genes. Cell 1989, 58, 729–739. [Google Scholar] [CrossRef]
- Willemsen, J.; Wicht, O.; Wolanski, J.C.; Baur, N.; Bastian, S.; Haas, D.A.; Matula, P.; Knapp, B.; Meyniel-Schicklin, L.; Wang, C.; et al. Phosphorylation-Dependent Feedback Inhibition of RIG-I by DAPK1 Identified by Kinome-wide siRNA Screening. Mol. Cell 2017, 65, 403–415.e408. [Google Scholar] [CrossRef] [PubMed] [Green Version]
- Krischuns, T.; Gunl, F.; Henschel, L.; Binder, M.; Willemsen, J.; Schloer, S.; Rescher, U.; Gerlt, V.; Zimmer, G.; Nordhoff, C.; et al. Phosphorylation of TRIM28 Enhances the Expression of IFN-beta and Proinflammatory Cytokines During HPAIV Infection of Human Lung Epithelial Cells. Front. Immunol. 2018, 9, 2229. [Google Scholar] [CrossRef] [PubMed] [Green Version]
- Urban, C.; Welsch, H.; Heine, K.; Wust, S.; Haas, D.A.; Dachert, C.; Pandey, A.; Pichlmair, A.; Binder, M. Persistent Innate Immune Stimulation Results in IRF3-Mediated but Caspase-Independent Cytostasis. Viruses 2020, 12, 635. [Google Scholar] [CrossRef]
- Cadena, C.; Ahmad, S.; Xavier, A.; Willemsen, J.; Park, S.; Park, J.W.; Oh, S.W.; Fujita, T.; Hou, F.; Binder, M.; et al. Ubiquitin-Dependent and -Independent Roles of E3 Ligase RIPLET in Innate Immunity. Cell 2019, 177, 1187–1200.e1116. [Google Scholar] [CrossRef]
- Heigwer, F.; Kerr, G.; Boutros, M. E-CRISP: Fast CRISPR target site identification. Nat. Methods 2014, 11, 122–123. [Google Scholar] [CrossRef]
- Sanjana, N.E.; Shalem, O.; Zhang, F. Improved vectors and genome-wide libraries for CRISPR screening. Nat. Methods 2014, 11, 783–784. [Google Scholar] [CrossRef] [PubMed] [Green Version]
- Robinson, J.T.; Thorvaldsdottir, H.; Winckler, W.; Guttman, M.; Lander, E.S.; Getz, G.; Mesirov, J.P. Integrative genomics viewer. Nat. Biotechnol. 2011, 29, 24–26. [Google Scholar] [CrossRef] [PubMed] [Green Version]
- The ORFeome Collaboration: A genome-scale human ORF-clone resource. Nat. Methods 2016, 13, 191–192. [CrossRef]
- Katzen, F. Gateway((R)) recombinational cloning: A biological operating system. Expert Opin. Drug Discov. 2007, 2, 571–589. [Google Scholar] [CrossRef] [PubMed]
- Reuther, P.; Gopfert, K.; Dudek, A.H.; Heiner, M.; Herold, S.; Schwemmle, M. Generation of a variety of stable Influenza A reporter viruses by genetic engineering of the NS gene segment. Sci. Rep. 2015, 5, 11346. [Google Scholar] [CrossRef] [Green Version]
- Habjan, M.; Penski, N.; Spiegel, M.; Weber, F. T7 RNA polymerase-dependent and -independent systems for cDNA-based rescue of Rift Valley fever virus. J. Gen. Virol. 2008, 89, 2157–2166. [Google Scholar] [CrossRef]
- Rivera, A.A.; Wang, M.; Suzuki, K.; Uil, T.G.; Krasnykh, V.; Curiel, D.T.; Nettelbeck, D.M. Mode of transgene expression after fusion to early or late viral genes of a conditionally replicating adenovirus via an optimized internal ribosome entry site in vitro and in vivo. Virology 2004, 320, 121–134. [Google Scholar] [CrossRef] [Green Version]
- Devadas, D.; Koithan, T.; Diestel, R.; Prank, U.; Sodeik, B.; Dohner, K. Herpes simplex virus internalization into epithelial cells requires Na+/H+ exchangers and p21-activated kinases but neither clathrin- nor caveolin-mediated endocytosis. J. Virol. 2014, 88, 13378–13395. [Google Scholar] [CrossRef] [Green Version]
- Ye, J.; Coulouris, G.; Zaretskaya, I.; Cutcutache, I.; Rozen, S.; Madden, T.L. Primer-BLAST: A tool to design target-specific primers for polymerase chain reaction. BMC Bioinform. 2012, 13, 134. [Google Scholar] [CrossRef] [PubMed] [Green Version]
- Li, K.; Li, N.L.; Wei, D.; Pfeffer, S.R.; Fan, M.; Pfeffer, L.M. Activation of chemokine and inflammatory cytokine response in hepatitis C virus-infected hepatocytes depends on Toll-like receptor 3 sensing of hepatitis C virus double-stranded RNA intermediates. Hepatology 2012, 55, 666–675. [Google Scholar] [CrossRef] [PubMed]
- Schoggins, J.W.; Rice, C.M. Interferon-stimulated genes and their antiviral effector functions. Curr. Opin. Virol. 2011, 1, 519–525. [Google Scholar] [CrossRef] [PubMed]
- Seifert, L.L.; Si, C.; Saha, D.; Sadic, M.; de Vries, M.; Ballentine, S.; Briley, A.; Wang, G.; Valero-Jimenez, A.M.; Mohamed, A.; et al. The ETS transcription factor ELF1 regulates a broadly antiviral program distinct from the type I interferon response. PLoS Pathog. 2019, 15, e1007634. [Google Scholar] [CrossRef] [PubMed] [Green Version]
- Zhao, J.; Qin, C.; Liu, Y.; Rao, Y.; Feng, P. Herpes Simplex Virus and Pattern Recognition Receptors: An Arms Race. Front. Immunol. 2020, 11, 613799. [Google Scholar] [CrossRef] [PubMed]
- Odendall, C.; Kagan, J.C. The unique regulation and functions of type III interferons in antiviral immunity. Curr. Opin. Virol. 2015, 12, 47–52. [Google Scholar] [CrossRef] [Green Version]
- Odendall, C.; Dixit, E.; Stavru, F.; Bierne, H.; Franz, K.M.; Durbin, A.F.; Boulant, S.; Gehrke, L.; Cossart, P.; Kagan, J.C. Diverse intracellular pathogens activate type III interferon expression from peroxisomes. Nat. Immunol. 2014, 15, 717–726. [Google Scholar] [CrossRef]
- Takaoka, A.; Yanai, H.; Kondo, S.; Duncan, G.; Negishi, H.; Mizutani, T.; Kano, S.; Honda, K.; Ohba, Y.; Mak, T.W.; et al. Integral role of IRF-5 in the gene induction programme activated by Toll-like receptors. Nature 2005, 434, 243–249. [Google Scholar] [CrossRef]
- Yanai, H.; Negishi, H.; Taniguchi, T. The IRF family of transcription factors: Inception, impact and implications in oncogenesis. Oncoimmunology 2012, 1, 1376–1386. [Google Scholar] [CrossRef] [Green Version]
- Mancino, A.; Natoli, G. Specificity and Function of IRF Family Transcription Factors: Insights from Genomics. J. Interferon Cytokine Res. 2016, 36, 462–469. [Google Scholar] [CrossRef]
- Tamura, T.; Yanai, H.; Savitsky, D.; Taniguchi, T. The IRF family transcription factors in immunity and oncogenesis. Annu. Rev. Immunol. 2008, 26, 535–584. [Google Scholar] [CrossRef]
- Hiscott, J. Triggering the innate antiviral response through IRF-3 activation. J. Biol. Chem. 2007, 282, 15325–15329. [Google Scholar] [CrossRef] [Green Version]
- Ourthiague, D.R.; Birnbaum, H.; Ortenlof, N.; Vargas, J.D.; Wollman, R.; Hoffmann, A. Limited specificity of IRF3 and ISGF3 in the transcriptional innate-immune response to double-stranded RNA. J. Leukoc. Biol. 2015, 98, 119–128. [Google Scholar] [CrossRef] [Green Version]
- Stetson, D.B.; Medzhitov, R. Type I interferons in host defense. Immunity 2006, 25, 373–381. [Google Scholar] [CrossRef] [PubMed] [Green Version]
- Platanitis, E.; Demiroz, D.; Schneller, A.; Fischer, K.; Capelle, C.; Hartl, M.; Gossenreiter, T.; Muller, M.; Novatchkova, M.; Decker, T. A molecular switch from STAT2-IRF9 to ISGF3 underlies interferon-induced gene transcription. Nat. Commun. 2019, 10, 2921. [Google Scholar] [CrossRef]
- Yan, Y.; Zheng, L.; Du, Q.; Yan, B.; Geller, D.A. Interferon regulatory factor 1 (IRF-1) and IRF-2 regulate PD-L1 expression in hepatocellular carcinoma (HCC) cells. Cancer Immunol. Immunother. 2020, 69, 1891–1903. [Google Scholar] [CrossRef] [PubMed]
- Schoggins, J.W.; Wilson, S.J.; Panis, M.; Murphy, M.Y.; Jones, C.T.; Bieniasz, P.; Rice, C.M. A diverse range of gene products are effectors of the type I interferon antiviral response. Nature 2011, 472, 481–485. [Google Scholar] [CrossRef] [PubMed]
- Panda, D.; Gjinaj, E.; Bachu, M.; Squire, E.; Novatt, H.; Ozato, K.; Rabin, R.L. IRF1 Maintains Optimal Constitutive Expression of Antiviral Genes and Regulates the Early Antiviral Response. Front. Immunol. 2019, 10, 1019. [Google Scholar] [CrossRef]
- Kuriakose, T.; Zheng, M.; Neale, G.; Kanneganti, T.D. IRF1 Is a Transcriptional Regulator of ZBP1 Promoting NLRP3 Inflammasome Activation and Cell Death during Influenza Virus Infection. J. Immunol. 2018, 200, 1489–1495. [Google Scholar] [CrossRef] [Green Version]
- Chistiakov, D.A.; Myasoedova, V.A.; Revin, V.V.; Orekhov, A.N.; Bobryshev, Y.V. The impact of interferon-regulatory factors to macrophage differentiation and polarization into M1 and M2. Immunobiology 2018, 223, 101–111. [Google Scholar] [CrossRef] [PubMed]
- Kaur, A.; Lee, L.H.; Chow, S.C.; Fang, C.M. IRF5-mediated immune responses and its implications in immunological disorders. Int. Rev. Immunol. 2018, 37, 229–248. [Google Scholar] [CrossRef] [PubMed]
- Hu, G.; Barnes, B.J. IRF-5 is a mediator of the death receptor-induced apoptotic signaling pathway. J. Biol. Chem. 2009, 284, 2767–2777. [Google Scholar] [CrossRef] [PubMed] [Green Version]


| Name | Forward Sequence (5′-3′) |
|---|---|
| NT | gtattactgatattggt |
| IFNAR1 | gaccctagtgctcgtcgccg |
| IFNGR1 | cctggtgctcacccagacgg |
| IFNLR | caccggagtaccagatcatgccac |
| IRF1 | tggtgagaggtggaagcatc |
| IRF2 | gataaactccaacacgatcc |
| IRF3 | cggaaattcctcttccaggt |
| IRF5 | gccagggcttcagccgcacg |
| IRF7 | atcagcagcggctgctatga |
| IRF9 | gagggagtcctggagcacag |
| RELA | gctcaatgatctccacatag |
| RIG-I | tggagctccaggaggaaggc |
| Name | Identifier |
|---|---|
| mouse monoclonal anti-β-Actin | A5441, RRID: AB_476744 |
| rabbit polyclonal anti-Calnexin | ADI-SPA-865-F, RRID: AB_11180747 |
| rabbit monoclonal anti-IRF1 (D5E4) XP | 8478, RRID: AB_10949108 |
| rabbit monoclonal anti-IRF2 [EPR4644(2)] | ab124744, RRID: AB_10974405 |
| rabbit monoclonal anti-IRF3 (D6I4C) XP | 11904, RRID: AB_2722521 |
| rabbit polyclonal anti-IRF5 | HPA046700, RRID: AB_2679761 |
| rabbit polyclonal anti-IRF7 | 4920, RRID: AB_2127551 |
| mouse monoclonal anti-IRF9 Clone 6/ISGF3γ | 610285, RRID: AB_397680 |
| mouse monoclonal anti-RIG-I (Alme-1) | AG-20B-0009, RRID: AB_2490189 |
| mouse monoclonal anti-NFkB p65 (L8F6) | 6956, RRID: AB_10828935 |
| Mouse monoclonal anti-HA (Clone HA-7) | H3663, RRID: AB_262051 |
| Name | Forward Sequence (5′-3′) | Reverse Sequence (5′-3′) |
|---|---|---|
| GAPDH | tcggagtcaacggatttggt | ttcccgttctcagccttgac |
| IFIT1 | gaatagccagatctcagaggagc | ccatttgtactcatggttgctgt |
| IFNB1 | cgccgcattgaccatcta | gacattagccaggaggttctc |
| IRF1 | cctgactccagcactgtcg | tgggtgacacctggaagttg |
| IRF2 | acggtgaacatcatagtttagga | ggggagatctgcagagggta |
| IRF3 | tgggcccccagatctgatta | gcacaaccttgaccatcacg |
| IRF5 | aagatctacgaggtctgctccaat | atcctctgcagctcttcctctt |
| IRF7 | ttggctcctgagagggca | cagcccaggccttgaagatg |
| IRF9 | tcctccagagccagactact | caatccaggctttgcacctg |
| MX1 | accattccaaggaggtgcag | tgcgatgtccacttcggaaa |
| RANTES | gctgtcatcctcattgctactg | tggtgtagaaatactccttgatgtg |
| TNFAIP3 (A20) | tcctcaggctttgtatttgagc | tgtgtatcggtgcatggtttta |
| Common Name | Alternative Name(s) | Systematic Name |
|---|---|---|
| MCP-1 | MCAF, … | CCL2 |
| MIP-1α | -- | CCL3 |
| MIP-1β | -- | CCL4 |
| RANTES | -- | CCL5 |
| Eotaxin | -- | CCL11 |
| MCP-4 | NCC-1, Ckβ10, … | CCL13 |
| TARC | dendrokine, ABCD-2 | CCL17 |
| MDC | DC/β-CK, ABCD-1, … | CCL22 |
| Eotaxin-3 | MIP-4α, IMAC, TSC-1 | CCL26 |
| IL-8 | NAP-1, MDNCF, GCP-1, … | CXCL8 |
| IP-10 | CRG-10, IFI10, … | CXCL10 |
Publisher’s Note: MDPI stays neutral with regard to jurisdictional claims in published maps and institutional affiliations. |
© 2021 by the authors. Licensee MDPI, Basel, Switzerland. This article is an open access article distributed under the terms and conditions of the Creative Commons Attribution (CC BY) license (https://creativecommons.org/licenses/by/4.0/).
Share and Cite
Wüst, S.; Schad, P.; Burkart, S.; Binder, M. Comparative Analysis of Six IRF Family Members in Alveolar Epithelial Cell-Intrinsic Antiviral Responses. Cells 2021, 10, 2600. https://doi.org/10.3390/cells10102600
Wüst S, Schad P, Burkart S, Binder M. Comparative Analysis of Six IRF Family Members in Alveolar Epithelial Cell-Intrinsic Antiviral Responses. Cells. 2021; 10(10):2600. https://doi.org/10.3390/cells10102600
Chicago/Turabian StyleWüst, Sandra, Paulina Schad, Sandy Burkart, and Marco Binder. 2021. "Comparative Analysis of Six IRF Family Members in Alveolar Epithelial Cell-Intrinsic Antiviral Responses" Cells 10, no. 10: 2600. https://doi.org/10.3390/cells10102600
APA StyleWüst, S., Schad, P., Burkart, S., & Binder, M. (2021). Comparative Analysis of Six IRF Family Members in Alveolar Epithelial Cell-Intrinsic Antiviral Responses. Cells, 10(10), 2600. https://doi.org/10.3390/cells10102600