Article

Physiological and Molecular Osmotic Stress Responses in Three Durum Wheat (Triticum Turgidum ssp Durum) Genotypes

1
Laboratory of Genetics and Cereal Breeding, National Institute of Agronomy of Tunisia, Carthage University, LR14 AGR01, 1082 Tunis, Tunisia
2
Department of Biology, University of Naples ‘‘Federico II’’, Via Cinthia, 80126 Napoli, Italy
3
National Institut of Agronomic Research of Tunisia INRAT, Carthage University, Rue Hédi Karray CP, 2049 Ariana, Tunisia
4
High Institute of Agronomy of Chott Mériem, Sousse University, Post Box 47, 4042 Chott Mériem, Sousse, Tunisia
*
Author to whom correspondence should be addressed.
The authors contributed equally to this article.
Agronomy 2019, 9(9), 550; https://doi.org/10.3390/agronomy9090550
Submission received: 23 July 2019 / Revised: 3 September 2019 / Accepted: 10 September 2019 / Published: 13 September 2019

Abstract

:
This study aims to investigate the activities and expression of enzymes of primary metabolism and relate these data with the growth performance of three different durum wheat genotypes (Maali; YT13; and ON66) under osmotic stress. Growth traits—including plant height, dry weight (DW) and relative water content (RWC)—were measured to classify genotypes depending on their tolerance to stress. Several enzymes were investigated: Ascorbate peroxidase (APX), Glutamine Synthetase (GS), Glutamine dehydrogenase (GDH), Glutamate synthase (GOGAT), Glucose 6-phosphate dehydrogenase (G6PDH), and Phosphoenolpyruvate Carboxylase (PEPC). The expression of the cytosolic and plastidic glutamine synthetase (TaGS1 and TaGS2), high affinity nitrate transporters (TaNRT2.3) and Glutamate dehydrogenase (TaGDH) were also detected by qRT-PCR. The results indicated different growth performances among genotypes, indicating Maali and YT13 as tolerant genotypes and ON66 as a drought-susceptible variety. Data showed a decrease in PEPC and increase in APX activities under osmotic stress; a slight decrease in GS activity was observed, together with an increase in G6PDH in all genotypes; GS and NRT2 expressions changed in a similar pattern in the different genotypes. Interestingly, Maali and YT13 showed higher transcript abundance for GDH under stress compared to ON66, suggesting the implication of GDH in protective phenomena upon osmotic stress.

1. Introduction

Drought is considered as the most limiting environmental factor affecting plant growth and productivity; this is particularly true considering the consequences of global warming and climate change. Thus, breeding for drought tolerance is a main objective for plant and cereal breeders.
In the Mediterranean region, durum wheat (Triticum turgidum ssp durum) constitutes the main crop to ensure food [1]. The comprehension of drought tolerance mechanisms in durum wheat, and its ability to cope with abiotic stresses, is of wide interest for researchers. Water scarcity causes stomata closure, which in turn decreases transpiration and limits water loss; these phenomena also inhibit the photosynthetic activity by its direct effect on CO2 uptake, resulting in a significant reduction in biomass and shoot growth [2,3,4]. At the cellular level, water scarcity triggers a set of modifications in biological processes caused by modifications in gene expression [5]. An integrated comprehension of morphological and physiological responses to drought requires a deep knowledge of both biochemical and molecular diversity among different genotypes. Indeed, distinct behaviors were observed in susceptible and tolerant genotypes resulting in changes in biomass production, plant height, and greenness [3,6]; these variations are consequences of many visible responses, such as osmolytes syntheses, enzymatic activities, antioxidant machinery, and specific gene expression [3,7,8,9].
In response to water limitation, plants tend to reduce damages by maintaining an optimum water status; to this aim, a set of compatible solutes are synthesized, namely water-soluble carbohydrates (WSC). These components help cells to maintain their turgor. In this context, it has been shown that tolerant genotypes accumulated more WSC than drought-susceptible ones [10].
Water scarcity affects different enzymatic activities; among them, the nitrogen metabolism machinery plays a pivotal role in nitrogen utilization [3,8,11]. The activity of the enzymes involved in the GS-GOGAT cycle, a key pathway in nitrogen remobilization, was shown to be widely affected by water stress. Glutamine synthetase (GS), with its two isoforms (cytosolic GS1, and plastidic GS2), is a potential indicator of plant nutritional status [12,13]; this enzyme is encoded by a set of genes regulated primarily by nitrogen availability, but also by abiotic stress such as drought [14]. In plants, glutamate dehydrogenase can play a considerable role in nitrogen assimilation process; also, it was shown that GDH is a key enzyme affected by drought as it could represent an alternative route due to its detoxification capability [15].
Furthermore, nitrogen assimilation in plants relies on energy and reductants furnishing to sustain the reactions, and the availability of carbon skeletons to bind amino (and amide) groups [16,17]. In this context, G6PDH is one of the main enzymes involved in reductants furnishing for nitrogen metabolism and assimilation [18,19]; moreover, this enzyme is clearly involved in plant response to abiotic stress such as heat, salinity and drought. It has been shown that G6PDH increases significantly under drought conditions, due to its involvement in the oxidative stress response [17].
PEPC represents a fundamental activity able to refurnish the TCA cycle of newly-synthetized OAA, thus boosting the synthesis of carbon skeletons to sustain amino acid synthesis [20]. Antioxidant enzymes play a key role in abiotic stress response, as they are involved in scavenging reactive oxygen species (ROS). Ascorbate peroxidase (APX) plays a considerable function in plant drought tolerance by detoxifying plants from the accumulation of H2O2 [21].
Due to the high variability and unpredictable season weather conditions, most of these studies, cited above, required in-vitro conditions to investigate changes in enzymatic expression and activities. The use of Polyethylene Glycol 6000 (PEG), a polyether compound with high molecular weight, could be useful because it can be used to adjust the osmotic potential of aqueous solutions. PEG induces osmotic stress and is helpful to investigate the effect of water limitations on plant growth [22]. PEG-exposed wheat, barley and other crops have been used to study the biochemical and molecular responses to drought [6,10,23,24,25,26,27], but these studies focused mainly on the osmotic stress effects on specific traits during the vegetative phase of crop development.
The present work aims to investigate the relationships between genes involved in nitrogen metabolism and growth, and the physiological and enzymatic performance of three durum wheat genotypes showing different responses to osmotic stress at seedling stages. The possibility to utilize these traits as sensors of drought susceptibility/tolerance and selectable markers for improved new varieties will be discussed.

2. Materials and Methods

2.1. Plant Material, Growth Conditions and Measurements

Durum wheat (Triticum turgidum ssp durum) genotypes with different tolerance levels to drought stress were grown in hydroponics under controlled conditions. The genotypes have different origins: YT13 and ON66 were lines provided from the International Center for Agricultural Research in the Dry Areas (ICARDA) (chosen from previous screening works, data not shown); and Maali, a Tunisian-improved genotype well-known as drought tolerant.
Seeds were sterilized in sodium hydrochloride and germinated in Petri dishes for 5 days until the emergence of the first leaf. Then seedlings were transplanted into perforated PVC plates (three seedlings per hole). The plates were placed on plastic tanks containing Yoshida nutritive solution [28]. Two tanks were used: one for the control and the second for the osmotic stress. The experiment was conducted in a controlled growth chamber where growing conditions were: temperature 25/19 °C, photoperiod of 16h light/8h dark, and relative humidity 65%. After 5 days of acclimation, osmotic stress was applied by adding progressively (every 3 days) the polyethylene glycol 6000 (PEG) to the medium; a control group of plants was maintained in standard growth medium (no PEG). The first concentration of the PEG was 6% and reached finally 24% at day 14. Each PEG concentration corresponds to a specific osmotic pressure in the nutritional medium that imposes an osmotic stress in the plants (Supplemental Table S1) [22]. Seven days after the last PEG addition, leaves’ samples were taken and utilized to assess different traits: Relative Water Content (RWC), plant height and fresh and dry shoot weights. Leaf samples were collected, grinded in liquid nitrogen and stored at −80 °C for biochemical and molecular measurements. The statistical design used was a complete randomized design. Three replicates were used for all traits.
The height of plants was measured at sixth leaves stage, fresh weights were recorded, and then samples were dried at 65 °C for 48 hours for the determination of dry weight.

2.2. Relative Water Content (RWC)

Fully-developed leaves were used for the measurements of RWC according to [29]:
RWC = [(FW − DW)/(SW − DW)] × 100
where FW is leaf fresh weight, SW is the saturated weight (weight measured at turgidity) and DW is the dry weight of the same sample.

2.3. Measurement of Water-Soluble Carbohydrates (WSC)

The WSC content was quantified according to Ref. [30]; 100 mg of grinded frozen leaves were used for WSC determination. Total carbohydrates were extracted in ethanol/water 80:20 at 60 °C. The quantification of WSC was carried out using the acid anthrone reagent (0.2%) by reading Abs640nm using a spectrophotometer (GENESYSTM 10S UV-VIS, Thermo Fisher, Waltham, MA, USA). A calibration curve was prepared using glucose as the standard.

2.4. Enzymatic Assays

All enzymatic activities were extracted from 300 mg of leaf tissue in 600 µL of given buffers, clarified by centrifugation (10′ at 10,000× g, 4 °C, Beckman Allegra centrifuge, Brea, CA, USA) and assayed according to references given using a UV/VIS spectrophotometer (Cary 60-Agilent Technologies, Santa Clara, CA, USA), except when otherwise noted.
Ascorbate Peroxidase (APX) activity was extracted in 50 mM KH2PO4, 2% PVPP, 0.1 mM EDTA, and pH 7.6. The reaction mixture contained 30 mM KH2PO4 buffer, 0.1 mM EDTA, 0.5 mM Na-Ascorbate, and 0.06% H2O2 and enzyme rate calculated by monitoring the ascorbate peroxidation at 200 nm [31].
Glucose-6-Phosphate Dehydrogenase (G6PDH) activity was extracted in 50 mM Tris-HCl, 0.5 mM MgCl2, 4 mM EDTA, 10% glycerol, 15 µM NADP+, and 10 μL/30 gr Protease Inhibitor Cocktail (Sigma P9599). The reaction mixture contained 10 to 100 µL of extract in the assay mixture: 50 mM Tris-HCl, 5 mM MgCl2, 0.15 mM NADP+, and 3 mM glucose-6P [32,33].
Phosphoenolpyruvate Carboxylase (PEPC) activity was extracted in 50 mM KH2PO4 pH 8.1, 2% PVPP, 2 mM EDTA, 2.5 mM MgCI2, and 20% (v/v) glycerol. PEPC was detected measuring NADH oxidation in the coupled assay with malic dehydrogenase according to Ref. [20].
Glutamine Synthetase (GS) activity was extracted by homogenizing 100 mg of fresh leaves in 1 mL of buffer [50 mM KH2PO4, pH 7.6, 2 mM EDTA-Na, 2 mM of DTT, and 1% of PVPP]. The reaction was initiated by adding 200 μL of extract to the assay mixture containing 50 mM imidazole, 50 mM L-Glutamine, 2 mM hydroxylamine, 2 mM sodium arsenate, 2 mM MnCl2, and 0.16 mM of ADP in a total volume of 1 mL. After incubation for 10 and 20 minutes, the reaction was stopped by adding 1 mL of stop mix containing 2.42% FeCl3, 1.45% trichloro-acetic acid and 1.82 N HCl. After centrifugation in a benchtop centrifuge at 5000× g, the absorbance was read on the supernatant at 540 nm [34].
Glutamine Dehydrogenase (GDH) activity was extracted as for GS. The enzyme rate was measured in 100 mM KH2PO4 pH 7.6, 200 mM NH4(SO4)2, 0.15 mM NADH, and 2.5 mM Na-oxoglutarate, by reading the absorbance at 340 nm according to Ref. [35].
Glutamate Synthase (GOGAT) activity was extracted as for GS and measured according to Ref. [36] in the following order: [100 mM KH2PO4 pH 7.6, 19 mM α-KGA, 15 mM ammonium acetate, 0.15 mM NADH, and 75 mM L-Glutamine].

2.5. Proteins Determination and Immunoblotting

Proteins were extracted as described in the extraction protocol for activity determination of different enzymes by Coomassie blue method. Immunoblots were obtained by leaf extract to determine the occurrence for HSP70, PEP, GS, and GOGAT using specific antibodies.
Proteins were separated using SDS Gel and then transferred on a nitrocellulose membrane as previously described [17,37]. Filters were incubated with the specific antibodies and reacting polypeptides were revealed by enhanced chemiluminescence using the ECL Prime Kit (Ge Healthcare, Chicago, IL, USA) or (WesternBright Quantum kit—Advansta, San Josè, CA, USA). Images were acquired by BioRad Chemidoc system and detected using Bio-Rad Chemidoc XRS equipped with Image Lab software.

2.6. RNA-Extraction and Real Time Q-RT-PCR

Total RNA was extracted from 100 mg of frozen leaves using TRizol reagent (Life Technologies) following the manufacturer’s instructions, and cDNA was synthesized from 1µg of RNA using the Quantitech® RNA reverse transcription kit (Qiagen, Hilden, Germany). cDNA was diluted and 1 μL was used for qRT-PCR assays, performed using 7500 HT (Applied Biosystems, Foster City, CA, USA) and platinum SYBER Green qPCR SuperMix (Life Technologies, Carlsbad, CA, USA); 40 amplification cycles were repeated for each sample. Actin was the endogenous reference. Quantification of transcript abundance was done using the 2-ΔΔCT as described [38].

2.7. Bioinformatics Analyses

Primer sequences of GS1, GS2, GDH, and NRT2 genes were retrieved in the NCBI database (https://www.ncbi.nlm.nih.gov/). Primers were designed by comparison of the sequences of the Triticum aestivum genes and EST sequences accessed at the National Center for Biotechnology Information Blast page and using Primer 3 software. Wheat actin gene was used as a reference for normalization of expression data.
Sequences and names of primer pairs used for Real time PCR are listed in Supplementary Table S2.

2.8. Statistical Analysis

Data were subjected to factorial ANOVA test analyzed using R software (R × 64 3.5.2). The variance analysis was performed using the AOV procedure of R to assess the effects of osmotic stress, genotype and their interaction on traits. The significance of each factor was explained according to p-values. Significance thresholds are: *, ** and *** significant at p < 0.05, p < 0.01 and p < 0.001 respectively. Means were compared by least significant difference (LSD) test (p < 0.05), using the LSD procedure of R. The treatments with the same letter are not significantly different.

3. Results

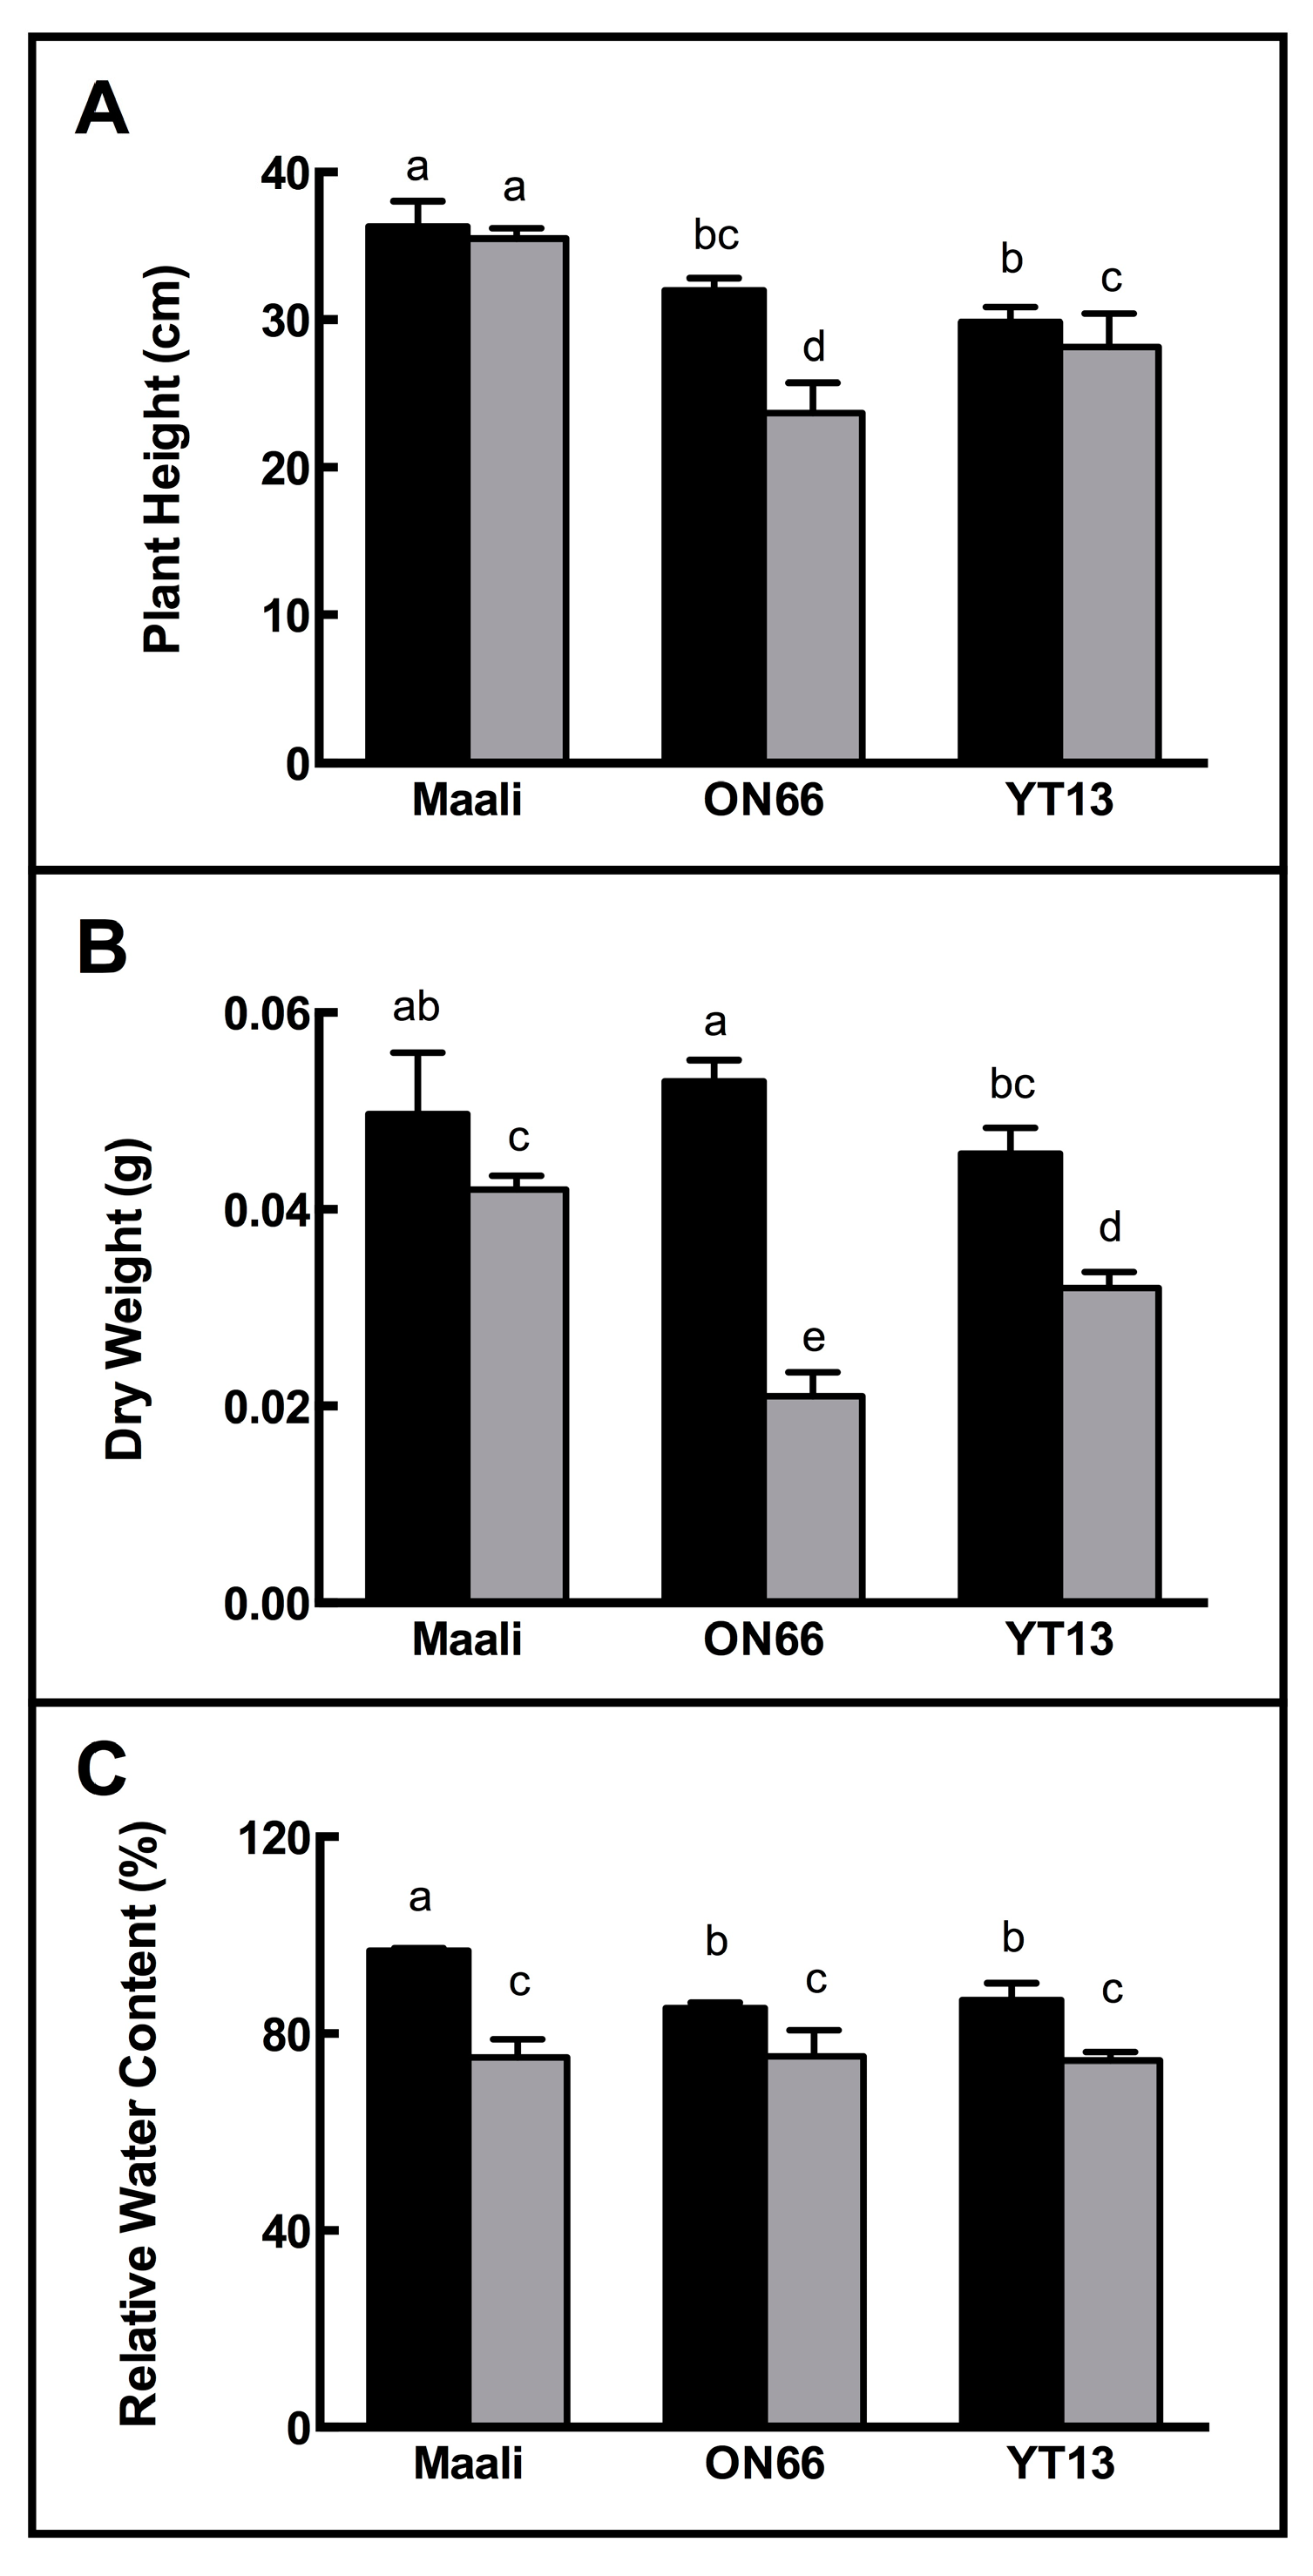
3.1. Impact of Osmotic Stress on Growth, RWC and WSC

The osmotic stress induced by PEG-6000 was evaluated in three durum wheat genotypes. After 24 days of growth, plants show different growth and appearance (Supplemental Figure S1).
As shown in Figure 1, the osmotic stress negatively affected all growth traits and the RWC during seedling stages. Under control conditions, Maali, ON66 and YT13 showed different shoot development and biomass production. Osmotic stress did not significantly affect plant height in Maali, while significant reductions in both YT13 and ON66 were observed, albeit higher in this latter genotype (5.58% and 26%, respectively) (Figure 1A). Similarly, DW decreased by 15% and 30% in Maali and YT13, respectively; the decrease was sharper in ON66 with a reduction rate of 60% (Figure 1B). Accordingly, ON66 was more susceptible to osmotic stress with respect to Maali and YT13, as its growth was more limited by osmotic stress. The RWC was reduced by osmotic stress in all genotypes, more evidently in Maali than ON66 and YT13 (Figure 1C).
A noticeable increase was observed in both WSC (58%) and FW (70%) under osmotic stress (Table 1). ANOVA analysis showed that the interaction (G × T) was significant only for Height (p < 0.01), Dry weight (DW) (p < 0.001) and Relative Water Content (RWC) (p < 0.05). Fresh weight (FW) (p < 0.001) and Water-Soluble Carbohydrates (WSC) (p < 0.05) were significantly affected by treatment.

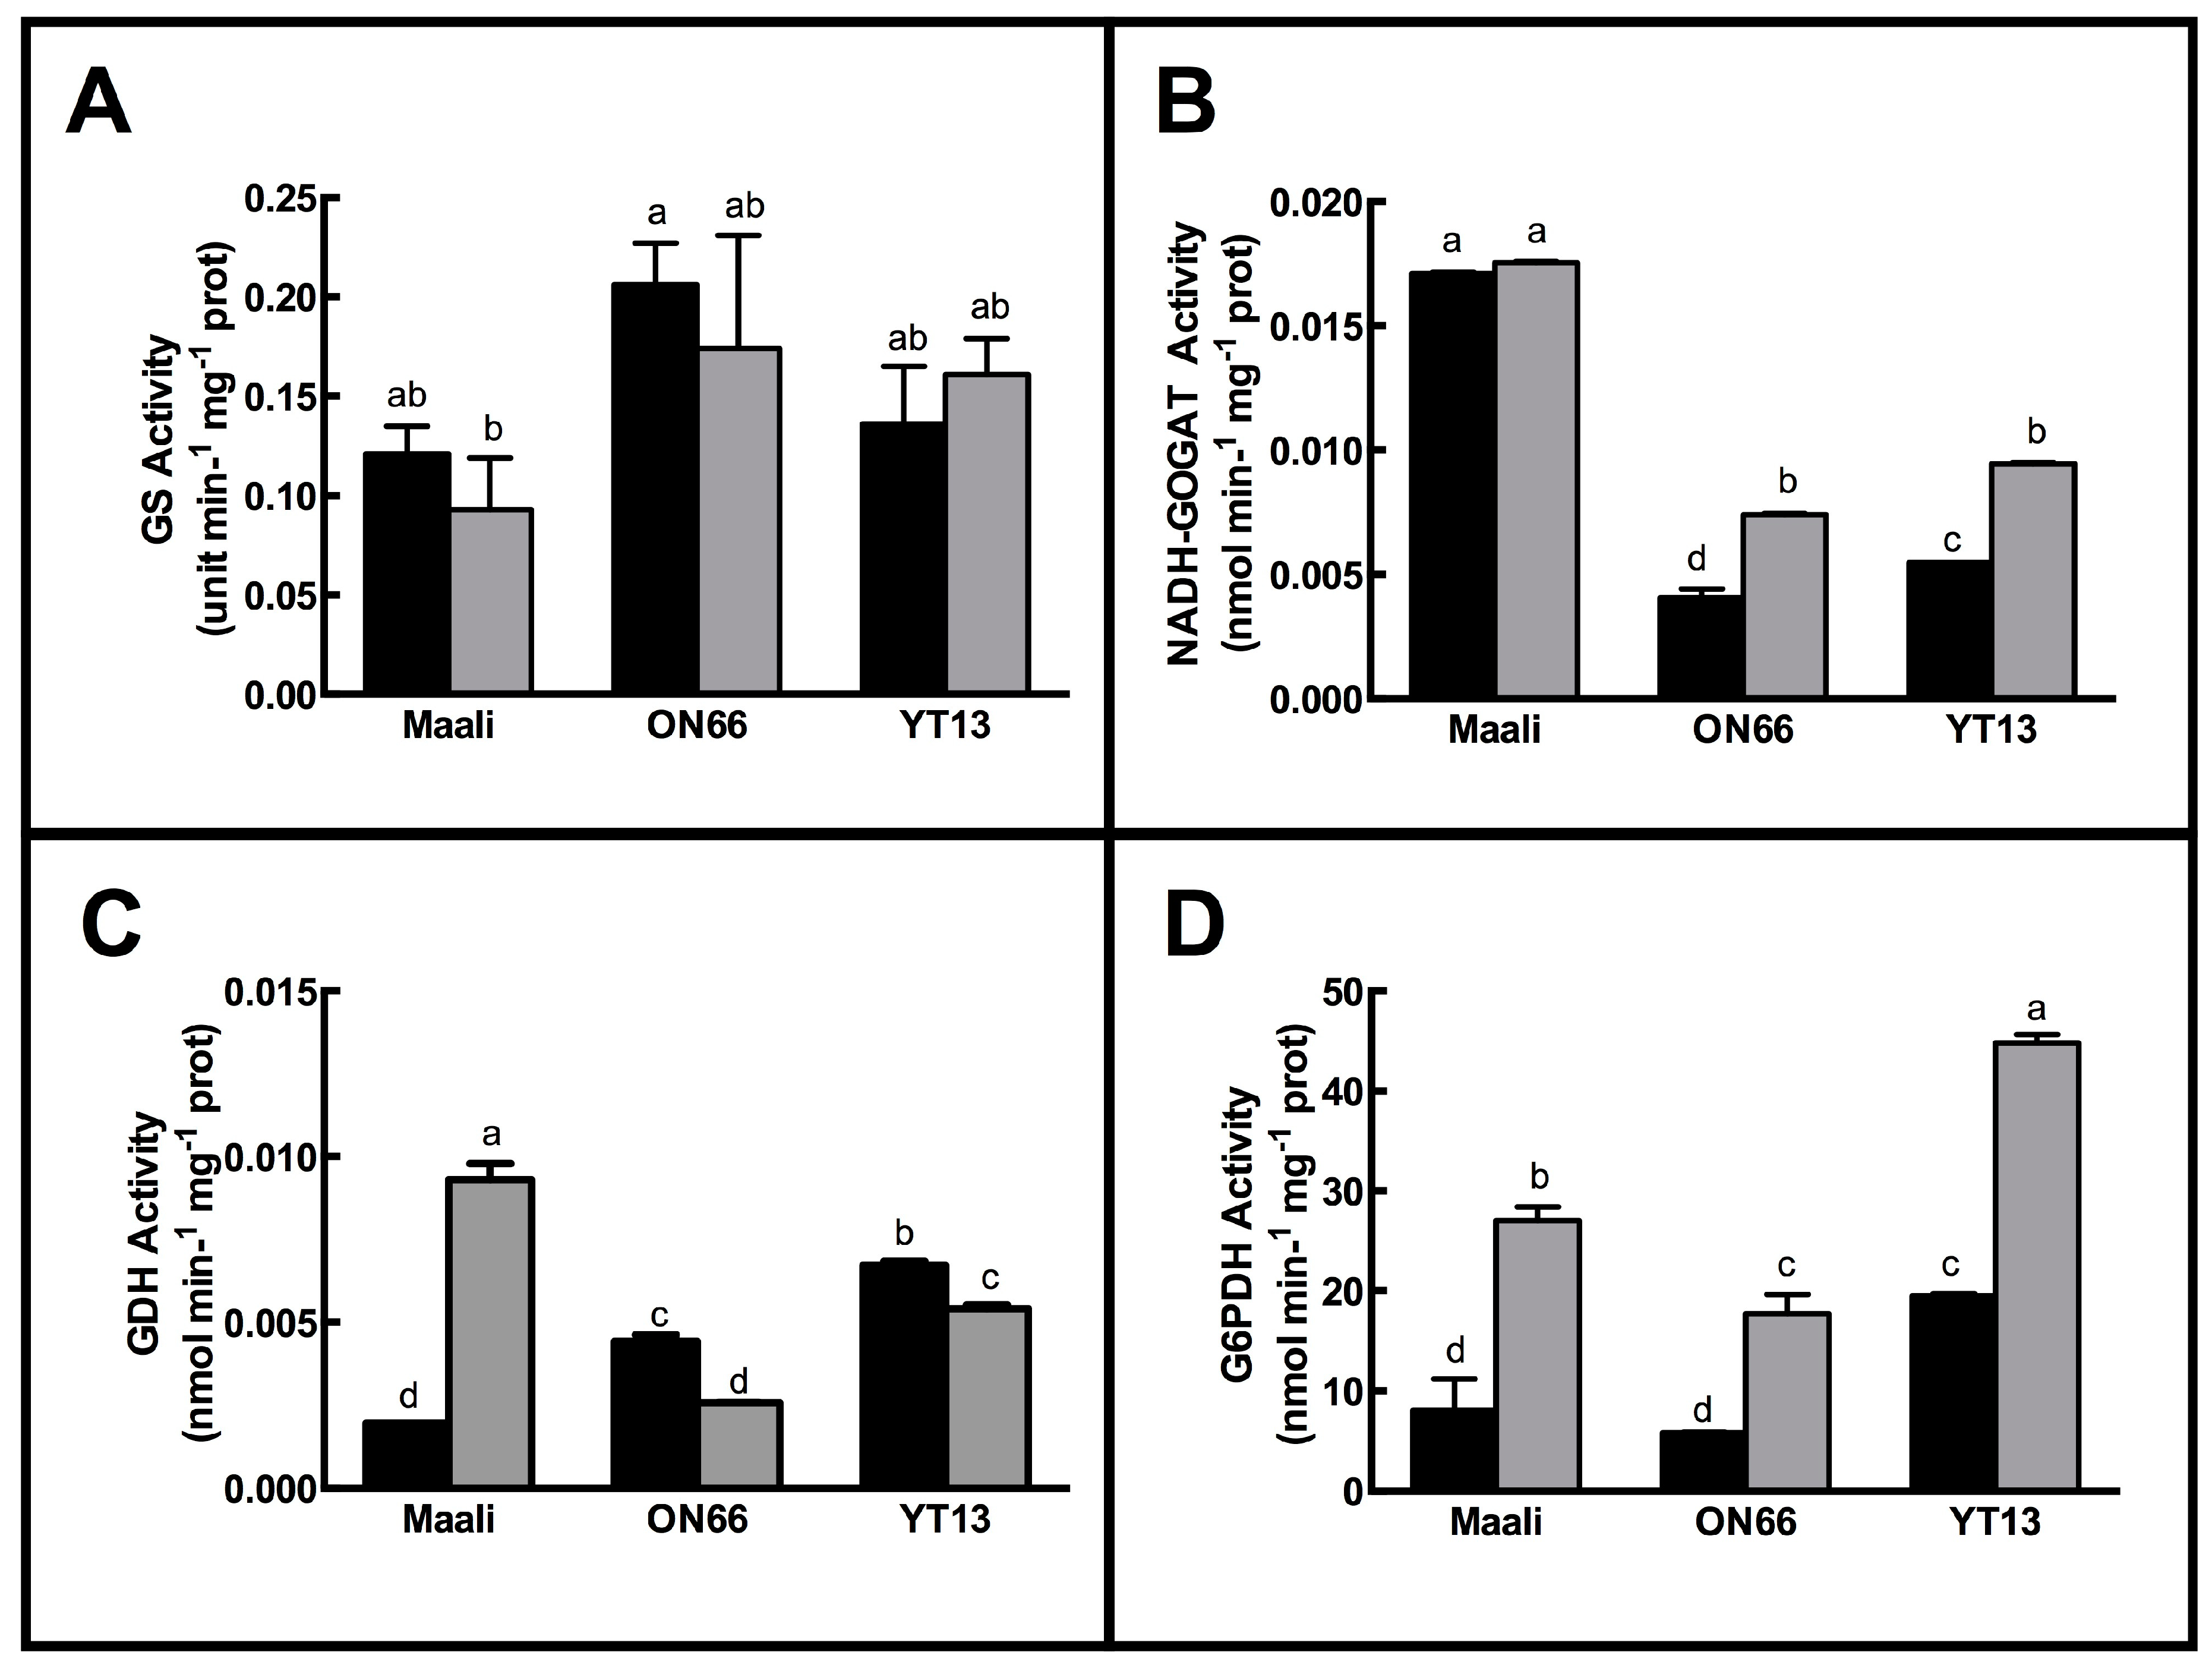
3.2. Impact of Osmotic Stress on Enzymes Involved in Nitrogen Metabolism

In order to define the involvement of nitrogen metabolism and reductant supply in durum wheat under drought, GS, GDH, GOGAT, and G6PDH activities were determined.
According to statistical analysis, the genotype effect was meaningful (p < 0.05) only for GS activity. For other enzymes, the difference between tested genotypes was not statistically significant. The effect of osmotic stress was highly significant (p < 0.001) only for PEP carboxylase activity. The variance was not significant in other enzymes. The interaction of G × T was significant for PEP carboxylase only (p < 0.05) (Table 2).
GS activity was slightly reduced by osmotic stress in Maali (22%) and remained substantially unchanged in YT13 (+15%) and ON66 (10% of reduction) (Figure 2A).
GOGAT activity increased in YT13 (+72%) and ON66 (+82%) under osmotic stress; on the contrary, GOGAT activity in Maali remained substantially unaffected (Figure 2B).
GDH activity was reduced in YT13 (19%) and ON66 (41%), but considerably increased in Maali (three-fold) (Figure 2C).
Interestingly, G6PDH activity increased in all genotypes: over two-fold in Maali and ON66, +30% in YT13 (Figure 2D).

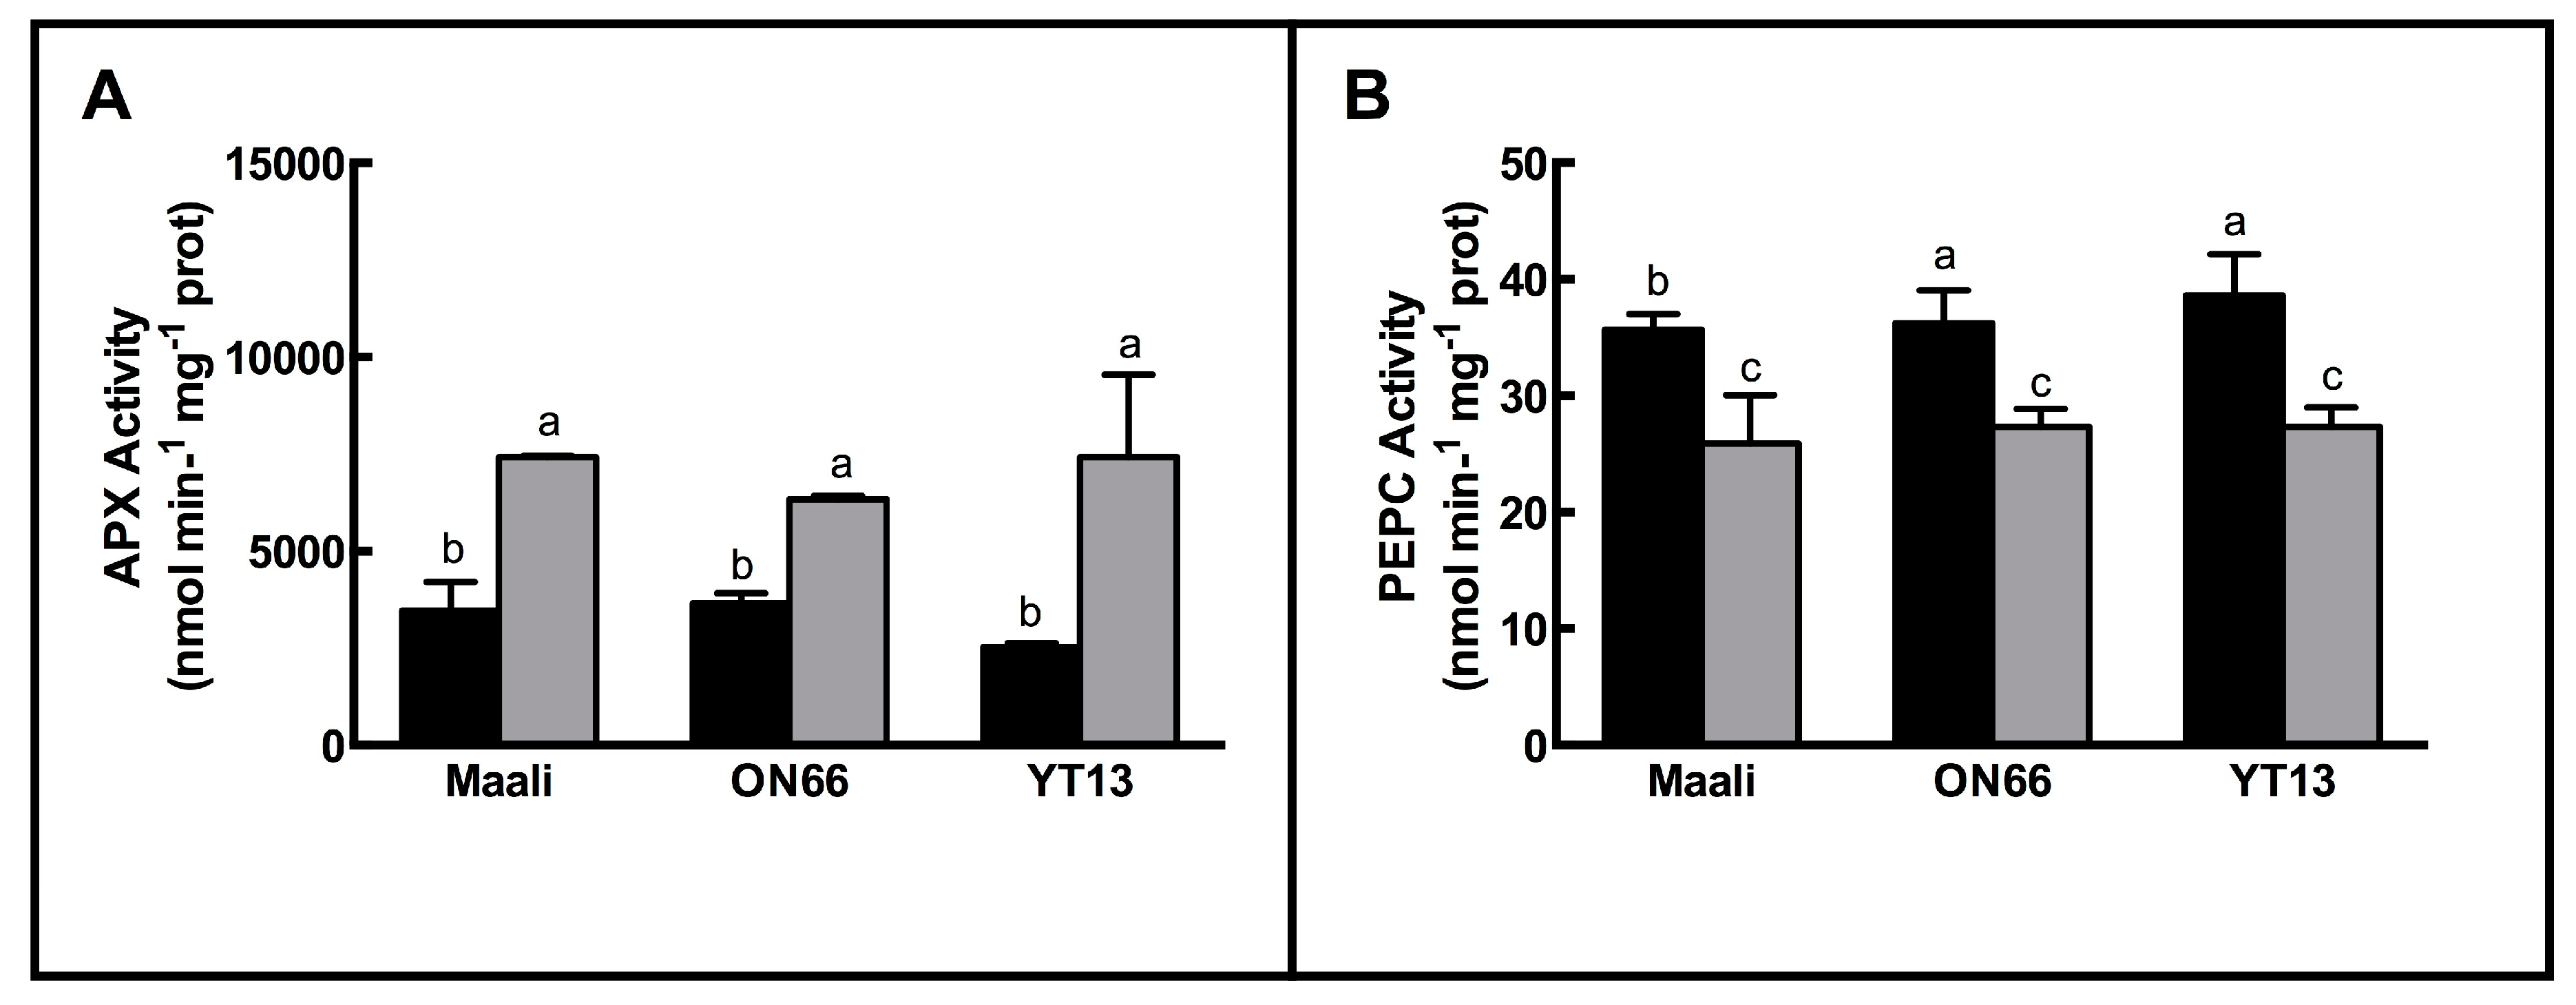
3.3. Changes in Antioxidant Enzymes

The activities of antioxidant enzymes under osmotic stress were measured in durum wheat leaves, and the results are presented in Figure 3. APX activities were induced by osmotic stress in all genotypes; interestingly, Maali (114%) and YT13 (194%) tolerant genotypes showed a higher increment of the constitutive activity; the susceptible genotype (ON66) showed a 73% increase in APX activity under stress (Figure 3A).
In contrast, PEPC activity decreased in all genotypes; the rate of reduction was similar, 27%, 24% and 29% for Maali, ON66 and YT13 respectively (Figure 3B).

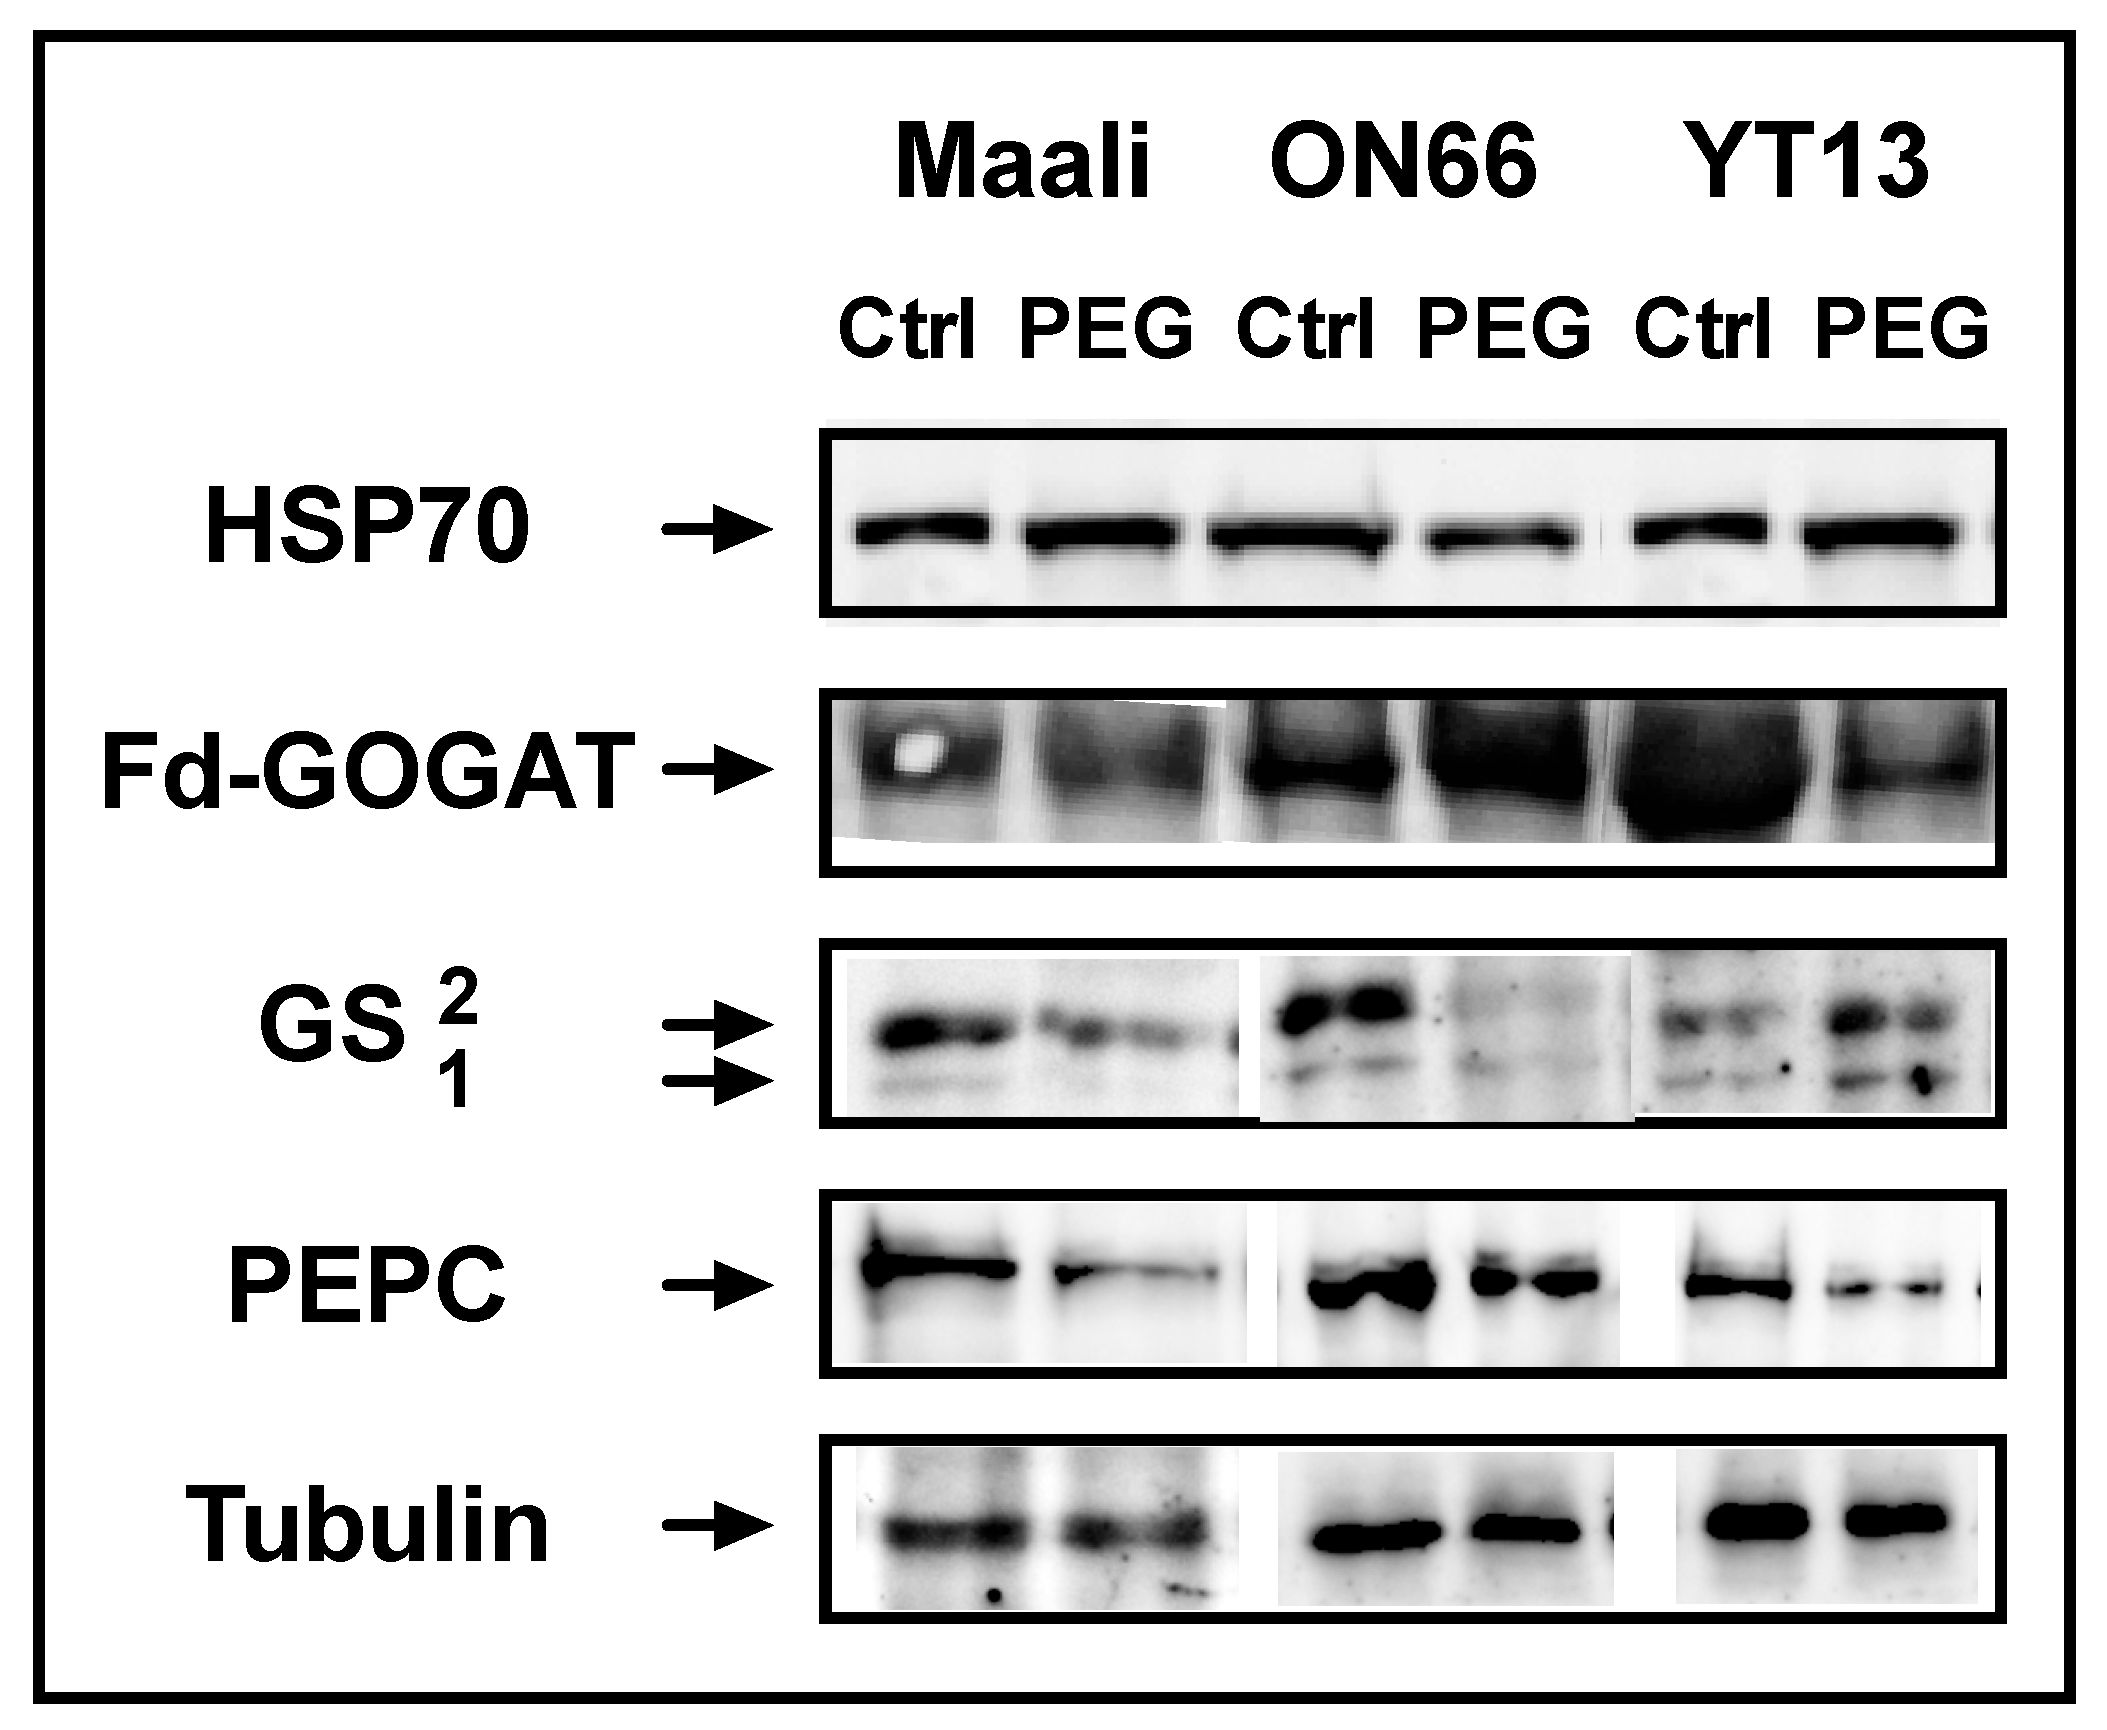
3.4. Immunoblots of HSP70, PEPC, GS and Fd-GOGAT

Immunoblotting analyses using specific antisera against HSP70s, Fd-GOGAT, GS, and PEPC were done in order to define proteins’ occurrence and to compare to the enzymatic activities (Figure 4).
Osmotic stress caused small changes in HSP70 expression in all genotypes. Fd-GOGAT decreased in YT13 and increased in ON66; no major changes were observed in Maali.
Immunoblotting for both GS1 (cytosolic) and GS2 (chloroplastic) isoforms showed a decrease under osmotic stress in the three tested genotypes. Similarly, PEPC protein expression decreased in all genotypes and particularly in Maali and YT13.

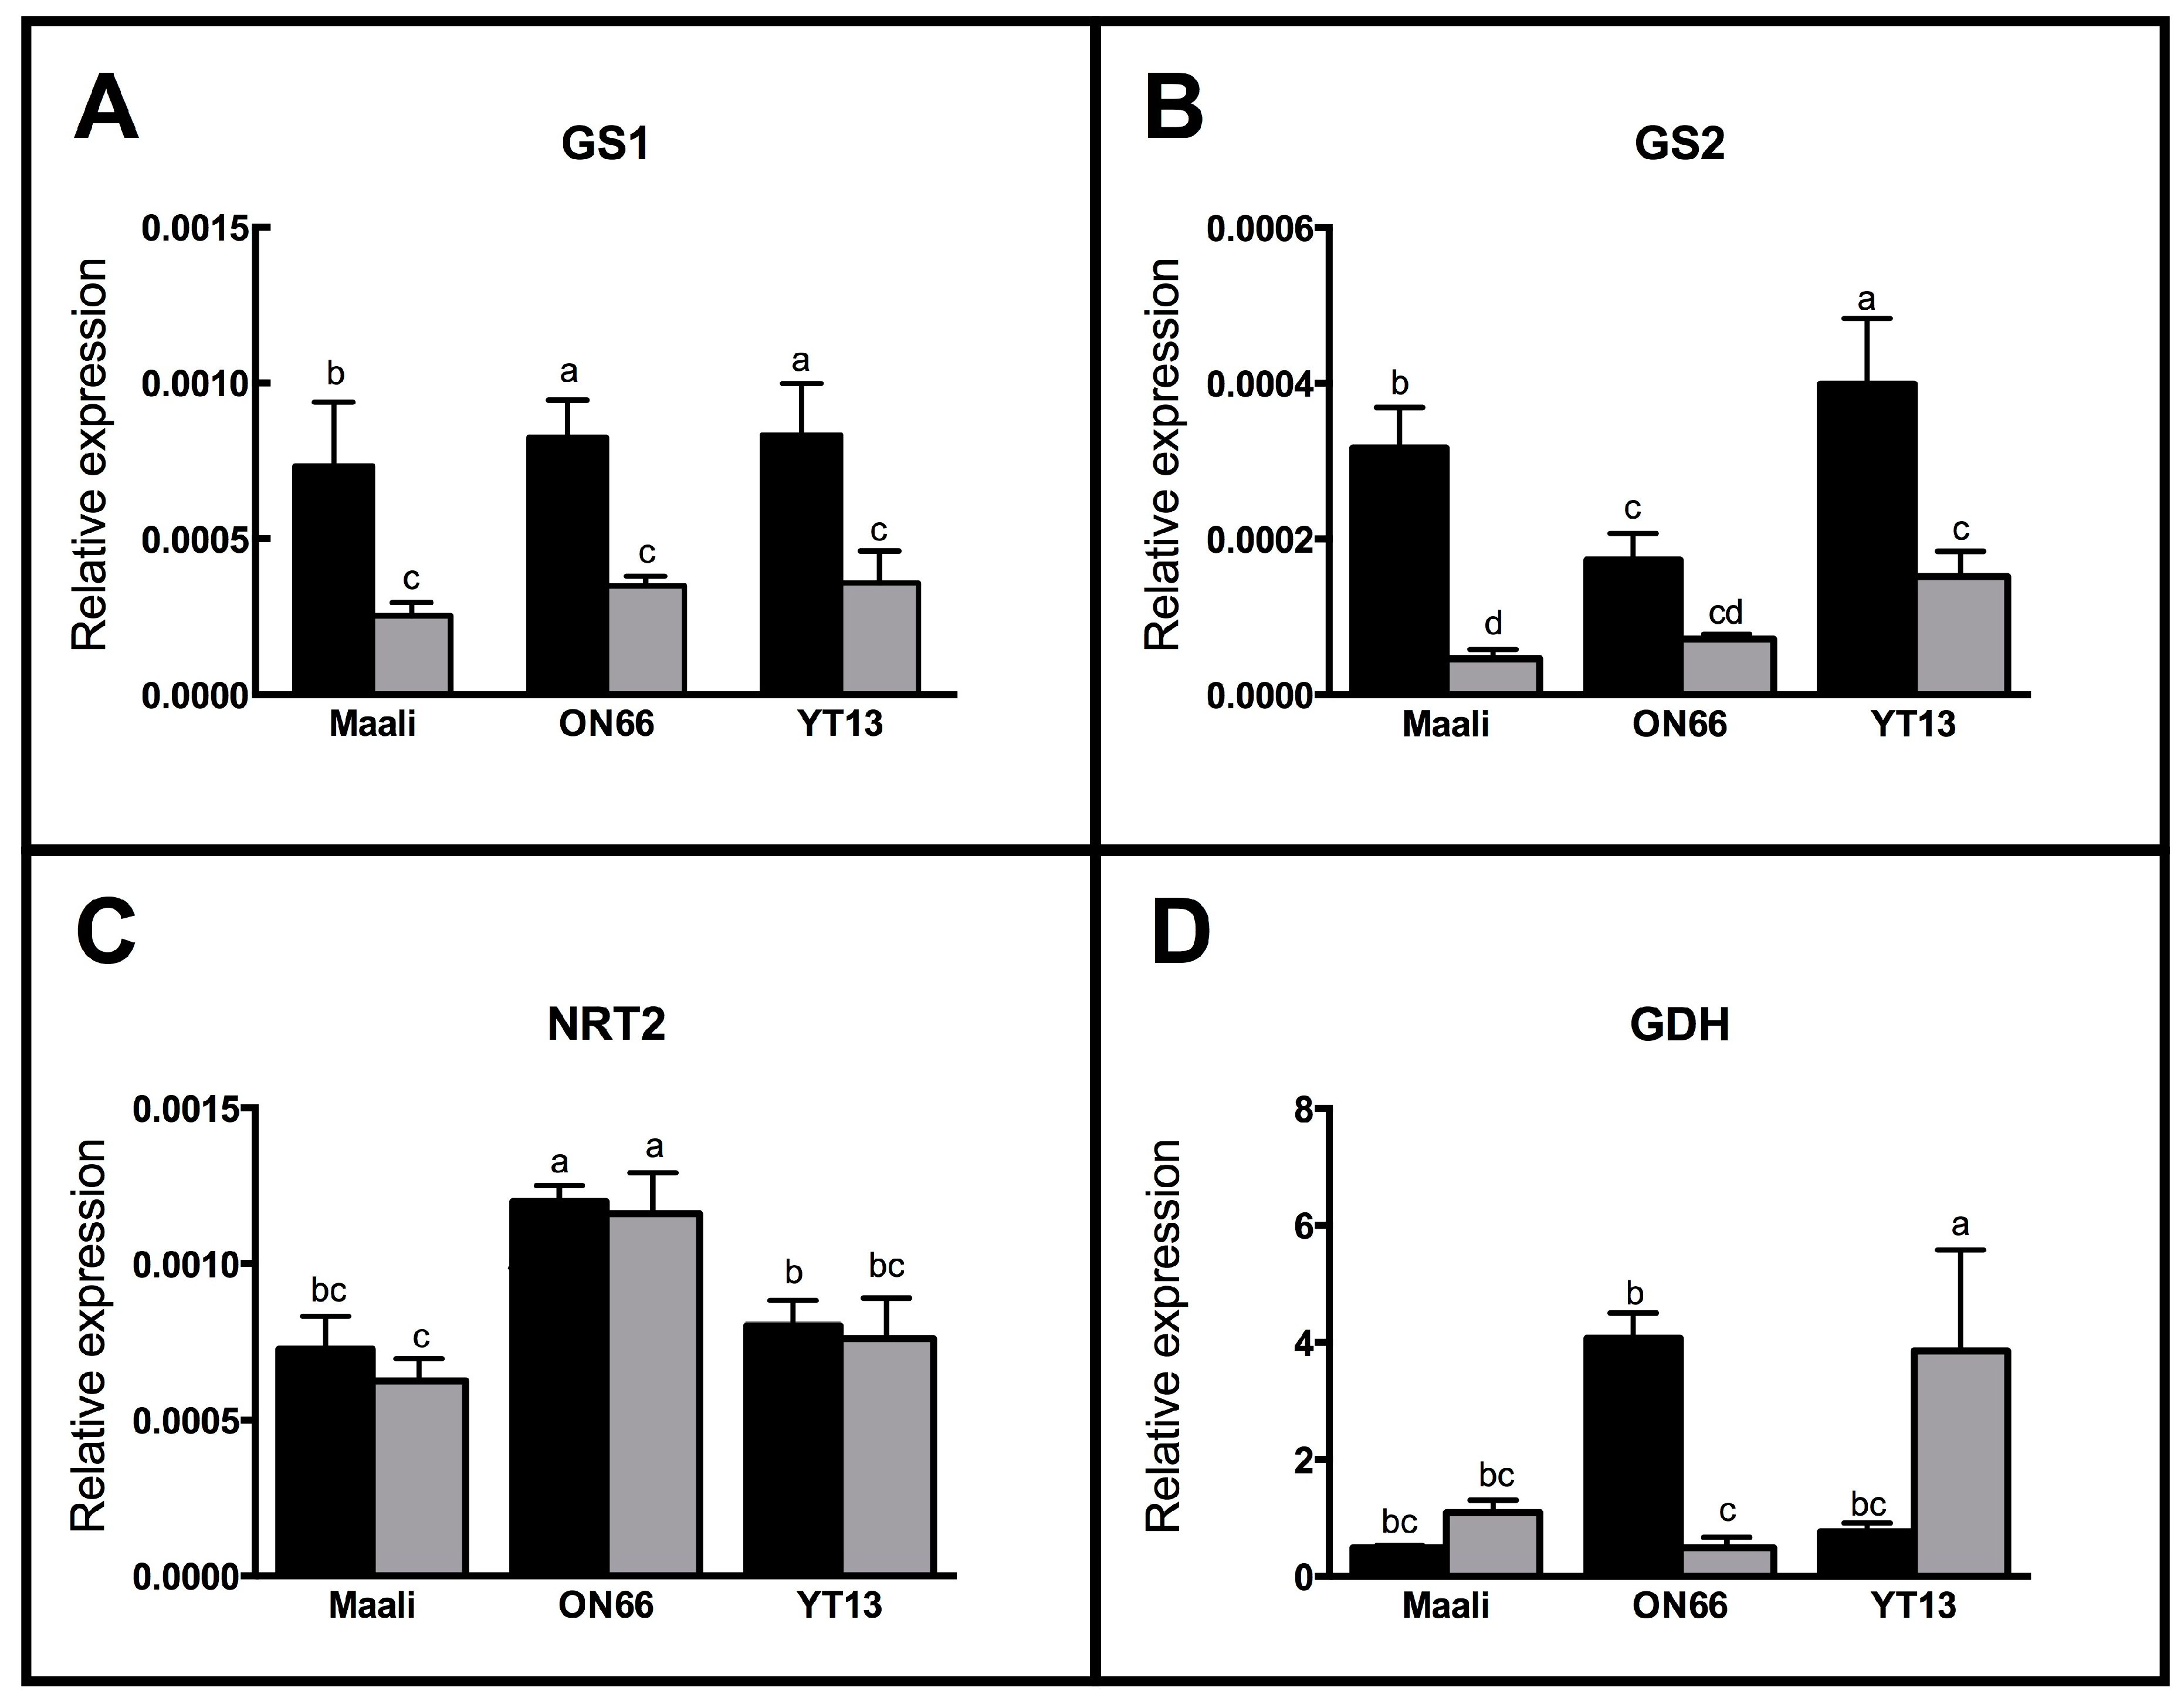
3.5. Differential Gene Expression in Osmotic Stressed Genotypes

Expression of GS1, GS2, GDH, and NRT2 genes were investigated by qRT-PCR analysis. Results showed a significant decrease in GS1 and GS2 expression in all tested genotypes under osmotic stress. GS1 (cytosolic isoform) expression decreased similarly (55–65%) in all genotypes (Figure 5A). GS2 (chloroplastic isoform) decreased by 58 to 85% upon osmotic stress also in all tested genotypes (Figure 5B). NRT2 expression slightly reduced in all genotypes (Figure 5C).
Interestingly, the GDH gene did not show the same expression under stress: in Maali and YT13, the GDH expression showed an increase by 121% and 340% respectively, whereas ON66 showed a strong decrease in GDH expression under osmotic stress (Figure 5D).

4. Discussion

4.1. Differential Growth Performance of Durum Wheat Genotypes under Osmotic Stress

Osmotic stress was associated with differential effects on growth. In order to simulate drought in hydroponics in vitro, we induced osmotic stress by Polyethylene Glycol 6000 (PEG), which has been proven to be effective modus for investigating the effects of drought at different seedling stages, and it is considered a simple and rapid method to discriminate between genotypes within a short period [26].
Growth traits, such as shoot length and biomass, were typically used as selection criteria to select for drought tolerance in wheat [39].
During seedling stages, osmotic stress negatively affected all growth traits and the RWC. It is well known that water deprivation leads to photosynthesis limitation resulting from stomata closure; as a consequence, growth is inhibited, leading to dry biomass and height reduction [40,41].
In this study, durum wheat genotypes grown in hydroponics under osmotic stress showed differential behaviors depending on their differential drought tolerance levels, Maali being the most tolerant, followed by YT13 and ON66 as the most susceptible. The tolerant genotypes (Maali and YT13) were able to maintain growth, metabolism and efficient water use under stress, while ON66 was not.
These results suggest that plant stress response represents a complex and highly dynamic process aimed to maintain a normal performance under unfavorable conditions. Therefore, the apparent effects of water stress can hide consistent changes at the physiological and biochemical level, basically disturbing the relationship between sink and source plant organs.
These drought-responsive mechanisms include gene expression regulation, reactive oxygen species scavenging, carbohydrates metabolism, and nitrogen metabolism [42,43].

4.2. The GS-GOGAT Pathway Is Impacted by the Osmotic Stress

The activity of GS, the abundance of corresponding mRNA and polypeptide contents were monitored in leaves of the three genotypes under osmotic stress. Changes in GS activity and expression (TaGS1 and TaGS2) underline the effect(s) of osmotic stress on nitrogen metabolism, which could be identified as the main reason for biomass reduction [43]. It has been proved that during water deficit, wheat shows a considerable decline of both abundance and activity of GS2 in the youngest leaves [44]. It has recently been shown that GS could be designated as a good metabolic indicator of drought stress tolerance in wheat. Indeed, tolerant wheat genotypes exhibited higher GS activity and higher transcript abundance of both GS isoforms in comparison with susceptible varieties [8]. On the other hand, drought stress led to a severe decrease in the GS enzyme in susceptible wheat cultivars [45]. Our results on TaGS1 and TaGS2 expressions confirmed these data: both genes were down-regulated under stress conditions. The similar changes observed in all genotypes studied suggest that GS could not be discriminating for drought tolerance among different genotypes.
GS activity in the present study remained unchanged in ON66 and YT13 and was slightly reduced in Maali. The GS-GOGAT pathway, implying two key enzymes (GS and GOGAT), is heavily affected by water deprivation [43]. Immunoblottings showed a considerable abundance of GS2 isoform compared with GS1, regardless of the growth conditions (Figure 5D), which is an accordance with previous findings [8]. Correspondingly with transcriptomic results, GS protein abundance decreased under drought. Interestingly, Maali showed higher levels of GS2 under stress in comparison with other genotypes, in spite of a reduced TaGS2 transcript abundance. However, mRNA levels are not always strictly correlated with the protein abundances and functions in cells, due to post-translational modifications [43]. GS2 has been found to be associated with the maintenance of photosynthetic and photorespiratory efficiency [46]; thus, the higher abundance of GS2 isoform in Maali could explain its better growth under osmotic stress.
NADH-GOGAT activity slightly rose in YT13 and ON66 but remained unchanged in Maali. Interestingly, Fd-GOGAT levels followed the same behavior except in YT13.

4.3. Antioxidant Enzymes Activities Increased upon Osmotic Stress

Under drought, photosynthesis limitation induces the accumulation of Reactive Oxygen Species (ROS) which act as signaling molecules activating plant responses to abiotic stress. This starts cell detoxification machinery in order to protect the plant from oxidative damage. Antioxidant enzymes increased considerably under stress conditions [47,48] and were reported to confer drought tolerance to plants. This involves a set of scavenger enzymes such as Ascorbate Peroxidase (APX), Glutathione Peroxidase (GPX), Superoxide Dismutase (SOD), and others [49,50,51].
It has been shown that the over-expression of the APX gene (OsAPX2) in rice resulted in more tolerant plants when compared with wild types under different abiotic stresses [52]. Our findings revealed that APX activity was considerably increased under osmotic stress in all genotypes (Figure 4). Maali, ON15 and YT13 showed similar APX activities, suggesting that all these varieties similarly regulate this activity under stress.
Downstream ROS scavenging system, G6PDH, could represent a major reductants supplier for ROS-detoxifying machinery under stress [16]. In this study, G6PDH activity increased under drought in all three genotypes. An interesting increase in YT13 (Figure 3D), higher than Maali and ON15, suggests the involvement of G6PDH in enhanced stress adaptation observed in YT13.
Other enzymes are affected by abiotic stress; it has been proven that PEPC in C3 plants mainly participates in the NADPH recycling mechanism and carbon metabolism [53]. Differently from APX and G6PDH, PEPC activity and abundance were decreased by osmotic stress [54] at a similar extent in the three genotypes.
It should be underlined that no major difference was observed among different varieties; therefore, the effects of drought on APX, G6PDH and PEPC cannot be clearly related to different stress tolerance in different varieties.

4.4. Differential Biochemical Behaviors of the Three Genotypes GDH Activity and Transcript Abundance

Drought severely affects nitrogen metabolism in plants, and activities of key enzymes may be regulated in order to confer tolerance to abiotic stress. Among these, GDH plays a protective role, acting as an alternative to the GS-GOGAT cycle under stress conditions. GDH catalyzes the assimilation of ammonia into glutamate and de-amination of glutamate to form 2-oxoglutarate and ammonium [35]. The amination detoxifies plants from the high intracellular accumulation of ammonium, whereas de-amination action sustains carbohydrates metabolism [15]. Previous studies have shown that genotypes differentially respond to drought by an enzyme activity decrease [55] or increase [47,56]. Increased GDH activities have been associated with better tolerance to drought in wheat [57]; similarly, GDH over-expression confers drought tolerance in rice [58] and maize [59].
Our findings demonstrated an increase in GDH gene expression in Maali and YT13. The enzyme activity was also subject to a substantial increase in Maali while it decreased in ON66. It is noteworthy that Maali and YT13 resulted as the most tolerant genotypes according to growth response to osmotic stress. Consequently, we suggest that GDH contributes to the drought tolerance of these genotypes, probably through improvement in N-assimilation and consequently a better adaptation of the photosynthetic activity under water deprivation [51]. It is therefore possible to indicate the changes in GDH expression and activity as a biochemical marker for the rapid selection of durum wheat drought-tolerant genotypes.

5. Conclusions

In conclusion, osmotic stress imposed by Polyethylene Glycol 6000 (PEG) was able to limit the growth of durum wheat plants, by leading to a set of changes in genes expressions and enzymatic activities, thus conferring a differential performance among genotypes. This study suggests the involvement of GDH in a protective role toward osmotic stress and indicates this activity as a sensible trait involved in drought resistance in durum wheat.
Therefore, a deeper understanding of tolerance mechanisms implying GDH expression, occurrence, activity and related metabolism such as NH4+ detoxification and proline synthesis is desirable in further studies.

Supplementary Materials

The following are available online at https://www.mdpi.com/2073-4395/9/9/550/s1, Figure S1: Visible effects of osmotic stress in Triticum turgidum ssp durum in hydroponics; Table S1: Osmotic pressures imposed in hydroponics, Table S2: accession numbers and primers for qRT-PCR.

Author Contributions

Conceptualization, S.J., S.A., Y.T. and S.E.; methodology, Z.C., I.Z., F.E.B.A., G.S.; validation and formal analysis, S.J., S.A.G.C.; investigation, S.J., Z.C., I.Z., G.C., G.S., S.L.; data curation, F.E.B.A.; writing—original—review and editing, S.J., S.A., S.L., S.E.; supervision, Y.T., S.E.; funding acquisition, Y.T., S.E.

Funding

This work was supported by grants from the Tunisian Ministry of Agriculture and the Tunisian Ministry of Higher Education, Scientific Research and Information and Communication Technologies.Giorgia Capasso acknowledges Project “Garanzia Giovani” 2018 by Regione Campania, DD566/2014/23599.

Acknowledgments

The authors would like to thank Robert P. Walker, (Sheffield—UK) for the gentle gift of PEPCase antibodies from Amaranthus edulis and A. Marquez (Univ. of Sevilla, Spain) for the generous gift of barley Fd-GOGAT antibodies, respectively.

Conflicts of Interest

The authors declare no conflict of interest.

References

  1. Abis, S. Wheat in the Mediterranean Region: Societies, Trade and Strategies. Econ. Territ. 2012, 1, 218–224. [Google Scholar]
  2. Molnar, I.; Gaspar, L.; Sarvari, E.; Dulai, S.; Hoffmann, B.; Molnar-Lang, M.; Galiba, G. Physiological and morphological responses to water stress in Aegilops biuncialis and Triticum aestivum genotypes with differing tolerance to drought. Funct. Plant Biol. 2004, 31, 1149–1159. [Google Scholar] [CrossRef]
  3. Yousfi, S.; Serret, M.D.; Marquez, A.J.; Voltas, J.; Araus, J.L. Combined use of △13C, △18O and △15N tracks nitrogen metabolism and genotypic adaptation of durum wheat to salinity and water deficit. N. Phytol. 2012, 194, 230–244. [Google Scholar] [CrossRef] [PubMed]
  4. Landi, S.; Hausman, J.F.; Guerriero, G.; Esposito, S. Poaceae vs. Abiotic Stress: Focus on Drought and Salt Stress, Recent Insights and Perspectives. Front. Plant Sci. 2017, 8, 1214. [Google Scholar] [CrossRef] [PubMed]
  5. Rampino, P.; Pataleo, S.; Gerardi, C.; Mita, G.; Perrotta, C. Drought stress response in wheat: Physiological and molecular analysis of resistant and sensitive genotypes. Plant Cell Environ. 2006, 29, 2143–2152. [Google Scholar] [CrossRef] [PubMed]
  6. Nagel, M.; Navakode, S.; Scheibal, V.; Baum, M.; Nachit, M.; Roder, M.S.; Borner, A. The genetic basis of durum wheat germination and seedling growth under osmotic stress. Biol. Plant. 2014, 58, 681–688. [Google Scholar] [CrossRef]
  7. Bajji, M.; Lutts, S.; Kinet, J.M. Water deficit effects on solute contribution to osmotic adjustment as a function of leaf ageing in three durum wheat (Triticum durum Desf.) cultivars performing differently in arid conditions. Plant Sci. 2001, 160, 669–681. [Google Scholar] [CrossRef]
  8. Yousfi, S.; Marquez, A.J.; Betti, M.; Araus, J.L.; Serret, M.D. Gene expression and physiological responses to salinity and water stress of contrasting durum wheat genotypes. J. Integr. Plant Biol. 2016, 58, 48–66. [Google Scholar] [CrossRef]
  9. Saia, S.; Fragasso, M.; De Vita, P.; Beleggia, R. Metabolomics Provides Valuable Insight for the Study of Durum Wheat: A Review. J. Agric. Food Chem. 2019, 67, 3069–3085. [Google Scholar] [CrossRef]
  10. Kerepesi, I.; Galiba, G. Osmotic and Salt Stress-Induced Alteration in Soluble Carbohydrate Content in Wheat Seedlings. Crop Sci. 2000, 40, 482–487. [Google Scholar] [CrossRef]
  11. Munns, R. Comparative physiology of salt and water stress. Plant Cell Environ. 2002, 25, 239–250. [Google Scholar] [CrossRef]
  12. Kichey, T.; Heumez, E.; Pocholle, D.; Pageau, K.; Vanacker, H.; Dubois, F.; Le Gouis, J.; Hirel, B. Combined agronomic and physiological aspects of nitrogen management in wheat highlight a central role for glutamine synthetase. N. Phytol. 2006, 169, 265–278. [Google Scholar] [CrossRef]
  13. Bernard, S.M.; Blom Moller, A.L.; Dionisio, G.; Kichey, T.; Jahn, T.P.; Dubois, F.; Baudo, M.; Lopes, M.S.; Terce-Laforgue, T.; Foyer, C.H.; et al. Gene expression, cellular localisation and function of glutamine synthetase isozymes in wheat (Triticum aestivum L.). Plant Mol. Biol. 2008, 67, 87–105. [Google Scholar] [CrossRef] [PubMed]
  14. Bernard, S.M.; Habash, D.Z. The importance of cytosolic glutamine synthetase in nitrogen assimilation and recycling. N. Phytol. 2009, 182, 608–620. [Google Scholar] [CrossRef]
  15. Goel, P.; Singh, A.K. Abiotic Stresses Downregulate Key Genes Involved in Nitrogen Uptake and Assimilation in Brassica juncea L. PLoS ONE 2015. [Google Scholar] [CrossRef] [PubMed]
  16. Esposito, S. Nitrogen Assimilation, Abiotic Stress and Glucose 6-Phosphate Dehydrogenase: The Full Circle of Reductants. Plants 2016, 5, 24. [Google Scholar] [CrossRef] [PubMed]
  17. Esposito, S.; Guerriero, G.; Vona, V.; Di Martino Rigano, V.; Carfagna, S.; Rigano, C. Glutamate synthase activities and protein changes in relation to nitrogen nutrition in barley: The dependence on different plastidic glucose-6P dehydrogenase isoforms. J. Exp. Bot. 2005, 56, 55–64. [Google Scholar] [CrossRef]
  18. Bowsher, C.G.; Hucklesby, D.P.; Emes, M.J. Nitrite reduction and carbohydrate metabolism in plastids purified from roots of Pisum sativum L. Planta 1989, 177, 359–366. [Google Scholar] [CrossRef] [PubMed]
  19. Esposito, S.; Massaro, G.; Di Martino Rigano, V.; Carfagna, S. Glutamate synthesis in barley roots: The role of the plastidic glucose-6-phosphate dehydrogenase. Planta 2003, 216, 639–647. [Google Scholar]
  20. Esposito, S.; Carillo, P.; Carfagna, S. Ammonium metabolism stimulation of glucose-6P dehydrogenase and phosphoenol-pyruvate carboxylase in young barley roots. J. Plant Physiol. 1998, 153, 61–66. [Google Scholar] [CrossRef]
  21. Fercha, A.; Gherroucha, H. The role of osmoprotectants and antioxidant enzymes in the differential response of durum wheat genotypes to salinity. J. Appl. Bot. Food Qual. 2014, 87, 74–79. [Google Scholar]
  22. Michel, B.E.; Kaufman, M.R. The Osmotic Potential of Polyethylene Glycol 6000. Plant Physiol. 1973, 51, 914–916. [Google Scholar] [CrossRef] [PubMed]
  23. Moayedi, A.A.; Boyce, A.N.; Barakbah, S.S. Study on Osmotic Stress Tolerance in Promising Durum Wheat GenotypesUsing Drought Stress Indices. Res. J. Agric. Biol. Sci. 2009, 5, 603–607. [Google Scholar]
  24. Almansouri, M.; Kinet, J.M.; Lutts, S. Effect of salt and osmotic stresses on germination in durum wheat (Triticum durum Desf.). Plant Soil 2001, 231, 243–254. [Google Scholar] [CrossRef]
  25. Alaei, M.; Zaefizadeh, M.; Khayatnezhad, M.; Alaei, Z.; Alaei, Y. Evaluation of Germination Properties of Different Durum Wheat Genotypes under Osmotic Stress. Middle-East J. Sci. Res. 2010, 6, 642–646. [Google Scholar]
  26. El Siddig, M.A.; Baenziger, S.; Dweikat, I.; El Hussein, A.A. Preliminary screening for water stress tolerance and genetic diversity in wheat (Triticum aestivum L.) cultivars from Sudan. J. Genet. Eng. Biotechnol. 2013, 11, 87–94. [Google Scholar] [CrossRef]
  27. Kacem, N.S.; Delporte, F.; Yordan, Y.; Abdelhamid, D.; Bernard, W. In vitro screening of durum wheat against water-stress mediated through polyethylene glycol. J. Genet. Eng. Biotechnol. 2017, 15, 239–247. [Google Scholar] [CrossRef] [PubMed]
  28. Yoshida, S.; Forno, D.A.; Cock, J.H.; Agomz, K. Laboratory Manual for Physiological Studies of Rice, 3rd ed.; IRRI: Los Baños, Philippines, 1976. [Google Scholar]
  29. Sade, N.; Galkin, E.; Moshelion, M. Measuring Arabidopsis, Tomato and Barley Leaf Relative Water Content (RWC). Bio-Protocol 2015, 5, 1451. [Google Scholar] [CrossRef]
  30. Yemm, E.W.; Willis, A.J. The Estimation of Carbohydrates in Plant Extracts by Anthrone. Biochem. J. 1954, 57, 508–514. [Google Scholar] [CrossRef]
  31. Nakano, Y.; Asada, K. Hydrogen peroxide is scavenged by ascorbate-specific peroxidase in spinach chloroplasts. Plant Cell Physiol. 1981, 22, 867–880. [Google Scholar]
  32. Castiglia, D.; Cardi, M.; Landi, S.; Cafasso, D.; Esposito, S. Expression and characterization of a cytosolic glucose-6-phosphate dehydrogenase isoform from barley (Hordeum vulgare) roots. Prot. Expr. Purif. 2015, 112, 8–14. [Google Scholar] [CrossRef] [PubMed]
  33. Esposito, S.; Carfagna, S.; Massaro, G.; Vona, V.; Di Martino Rigano, V. Glucose-6-phosphate dehydrogenase in barley roots: Kinetic properties and localization of the isoforms. Planta 2001, 212, 627–634. [Google Scholar] [CrossRef] [PubMed]
  34. Deuel, T.F.; Louie, M.; Lerner, A. Glutamine Synthetase from Rat Liver. J. Biol. Chem. 1978, 253, 6111–6118. [Google Scholar] [PubMed]
  35. Groat, R.G.; Vance, C.P. Root Nodule Enzymes of Ammonia Assimilation in Alfalfa (Medicago sativa L.)Developmental patterns and response to applied nitrogen. Plant Physiol. 1981, 67, 1198–1203. [Google Scholar] [CrossRef] [PubMed]
  36. Singh, R.S.D.; Srivastava, H.S. Increase in glutamate synthase (NADH) activity in maize seedlings in response to nitrate and ammonium nitrogen. Physiol. Plant. 1986, 66, 413–416. [Google Scholar] [CrossRef]
  37. Cardi, M.; Zaffagnini, M.; De Lillo, A.; Castiglia, D.; Chibani, K.; Gualberto, J.M.; Rouhier, N.; Jacquot, J.P.; Esposito, S. Plastidic P2 glucose-6P dehydrogenase from poplar is modulated by thioredoxin m-type: Distinct roles of cysteine residues in redox regulation and NADPH inhibition. Plant Sci. 2016, 252, 257–266. [Google Scholar] [CrossRef] [PubMed]
  38. Livak, K.J.; Schmittgen, T.D. Analysis of relative gene expression data using real-time quantitative PCR and the 2-DDCT method. Methods 2001, 25, 402–408. [Google Scholar] [CrossRef]
  39. Munns, R.; James, R.A. Screening methods for salinity tolerance: A case study with tetraploid wheat. Plant Soil 2003, 253, 201–218. [Google Scholar] [CrossRef]
  40. Turkan, I.; Demiral, T. Recent developments in understanding salinity tolerance. Environ. Exp. Bot. 2014, 209, 2–9. [Google Scholar] [CrossRef]
  41. Ghotbi-Ravandi, A.A.; Shahbazi, M.; Shariati, M.; Mulo, P. Effects of Mild and Severe Drought Stress on Photosynthetic Efficiency in Tolerant and Susceptible Barley (Hordeum vulgare L.) Genotypes. J. Crop Sci. 2014, 200, 403–415. [Google Scholar] [CrossRef]
  42. Johnová, P.; Skalák, J.; Saiz-Fernández, I.; Brzobohatý, B. Plant responses to ambient temperature fluctuations and water-limiting conditions: A proteome-wide perspective. Biochimica et Biophysica Acta 2016, 1864, 916–931. [Google Scholar] [CrossRef] [PubMed]
  43. Wang, X.; Cai, X.; Xu, C.; Wang, Q.; Dai, S. Drought-Responsive Mechanisms in Plant Leaves Revealed by Proteomics. Int. J. Mol. Sci. 2016, 17, 1706. [Google Scholar] [CrossRef] [PubMed]
  44. Nagy, Z.; Németh, E.; Guoth, A.; Bona, L.; Wodala, B.; Pecsvaradi, A. Metabolic indicators of drought stress tolerance in wheat: Glutamine synthetase isoenzymes and Rubisco. Plant Physiol. Biochem. 2013, 67, 48–54. [Google Scholar] [CrossRef] [PubMed]
  45. Michaletti, A.; Naghavi, M.R.; Toorchi, M.; Zolla, L.; Rinalducci, S. Metabolomics and proteomics reveal drought-stress responses of leaf tissues from spring-wheat. Sci. Rep. 2018, 8, 5710. [Google Scholar] [CrossRef] [PubMed]
  46. Singh, K.K.; Ghosh, S. Regulation of glutamine synthetase isoforms in two differentially drought-tolerant rice (Oryza sativa L.) cultivars under water deficit conditions. Plant Cell Rep. 2013, 32, 183–193. [Google Scholar] [CrossRef] [PubMed]
  47. Van Oosten, M.; Costa, A.; Punzo, P.; Landi, S.; Ruggiero, A.; Batelli, G.; Grillo, S. Genetics of drought stress tolerance in crop plants. In Drought stress tolerance in Plants; Hossain, M.A., Wani, S.H., Bhattachajee, S., Burrit, D., Phan tran, L., Eds.; Springer: Cham, Switzerland, 2016; Volume 2, pp. 39–70. [Google Scholar] [CrossRef]
  48. Weng, M.; Cui, L.; Liu, F.; Zhang, M.; Shan, L.; Yang, S.; Geng, X. Effects of Drought Stress on Antioxidant Enzymes in seedlings of different wheat genotypes. Pak. J. Bot. 2015, 47, 49–56. [Google Scholar]
  49. Gill, S.S.; Tuteja, N. Reactive oxygen species and antioxidant machinery in abiotic stress tolerance in crop plants. Plant Physiol. Biochem. 2010, 48, 909–930. [Google Scholar] [CrossRef] [PubMed]
  50. You, J.; Chan, Z. ROS regulation during abiotic stress responses in crop plants. Front. Plant Sci. 2015, 6, 1092. [Google Scholar] [CrossRef] [PubMed]
  51. Landi, S.; Nurcato, R.; De Lillo, A.; Lentini, M.; Grillo, S.; Esposito, S. Glucose-6-phosphate dehydrogenase plays a central role in the response of tomato (Solanum lycopersicum) plants to short and long-term drought. Plant Physiol. Biochem. 2016, 105, 79–89. [Google Scholar] [CrossRef]
  52. Zhong, C.; Cao, X.; Hu, J.; Zhu, L.; Zhang, J.; Huang, J.; Jin, Q. Nitrogen metabolism in adaptation of photosynthesis to water stress in rice grown under different nitrogen levels. Front. Plant Sci. 2017, 8, 1079. [Google Scholar] [CrossRef] [PubMed]
  53. Miyao, M.; Fukayama, H. Metabolic consequences of overproduction of phosphoenolpyruvate carboxylase in C3 plants. Arch. Biochem. Biophys. 2003, 414, 197–203. [Google Scholar] [CrossRef]
  54. Bouthour, D.; Kalai, T.; Haouari, C.; Chaffei, C.; Gouia, H.; Corpas, F.J. Differential response of NADP-dehydrogenases and carbon metabolism in leaves and roots of two durum wheat (Triticum durum Desf.) cultivars (Karim and Azizi) with different sensitivities to salt stress. J. Plant Physiol. 2015, 179, 56–63. [Google Scholar] [CrossRef] [PubMed]
  55. Ren, B.; Dong, S.; Zhao, B.; Liu, P.; Zhang, J. Responses of Nitrogen Metabolism, Uptake and Translocation of Maize to Waterlogging at Different Growth Stages. Front. Plant Sci. 2017, 8, 1216. [Google Scholar] [CrossRef] [PubMed]
  56. Kaur, G.; Asthin, B.; Bains, N.S. Modulation of proline metabolism under drought and salt stress conditions in wheat seedling. Indian J. Biochem. Biophys. 2018, 55, 114–124. [Google Scholar]
  57. Lee, T.E. Selecting drought and salt tolerant wheat cultivar. Increasing Wheat Production in Central Asia through Science and International Cooperation. In Proceedings of the First Central Asian Wheat Conference, Almaty, Kazakhstan, 10–13 June 2003; pp. 109–113. [Google Scholar]
  58. Zhou, Y.; Zhang, C.; Lin, J.; Yang, Y.; Peng, Y.; Tang, D.; Zhao, X.; Zhu, Y.; Liu, X. Over-expression of a glutamate dehydrogenase gene, MgGDH, from Magnaporthe grisea confers tolerance to dehydration stress in transgenic rice. Planta 2015, 241, 727–740. [Google Scholar] [CrossRef] [PubMed]
  59. Lightfoot, D.A.; Mungur, R.; Ameziane, R.; Ameziane, R.; Nolste, S.; Long, L.; Bernhard, K.; Colter, A.; Jones, K.; Iqbal, M.J.; et al. Improved drought tolerance of transgenic Zea mays plants that express the glutamate dehydrogenase gene (gdhA) of E. coli. Euphytica 2007, 156, 103–116. [Google Scholar] [CrossRef]
Figure 1. Effects of osmotic stress induced by PEG-6000 on Plant Height (A), Dry weight (DW) (B) and Relative Water Content (RWC) (C) in three durum wheat genotypes. Measurements in control plants are in black bars; activities in stressed plants are in grey bars. Data are the average of at least 3 determinations ± standard error. Letters indicate homogenous data.
Agronomy 09 00550 g001
Figure 2. Changes in the activities of GS (A), GOGAT (B), GDH (C), and G6PDH (D) in durum wheat leaves. Enzymatic rates in control plants are in black bars; activities in stressed plants are in grey bars. Data are the average of at least three determinations ± standard error. Letters indicate homogenous data.
Agronomy 09 00550 g002
Figure 3. Changes in the activities of APX (A) and PEPc (B) in durum wheat leaves. Enzymatic rates in control plants are in black bars; activities in stressed plants are in grey bars. Data are the average of at least three determinations ± standard error. Letters indicate homogenous data.
Agronomy 09 00550 g003
Figure 4. Immunoblotting using antisera for HSP-70, Fd-GOGAT, GS1/GS2 and PEPC, under control (Ctrl) and osmotic stress conditions (PEG) for three durum wheat genotypes. In the last line, antisera for tubulin is shown to check equal loading.
Agronomy 09 00550 g004
Figure 5. Changes in transcript abundance of GS1 (A), GS2 (B), NRT2.3 (C), and GDH (D) in leaves of durum wheat, measured by qRT-PCR. Variations are indicated as fold changes in stressed plants (grey bars) with respect to control (black bars). For each sample, the mRNA level was calculated relatively to the calibrator sample for the same gene. Letters indicate homogenous data. Other details in the text.
Agronomy 09 00550 g005
Table 1. Genotype and treatment effects on Plant Height (Height), Fresh weight (FW), Dry weight (DW), relative water content (RWC), and Water-soluble Carbohydrates (WSC) of durum wheat genotypes grown under osmotic stress. In the lower panel, the ANOVA analysis is given. Legend: G, genotype; T, Treatment, *, **, *** significant at p < 0.05, p < 0.01 and p < 0.001 respectively.
Height(cm)FW (g)DW (g)RWC (%)WSC
(mg g−1 FW)
Genotypes (G)
YT13 27.833 ± 1.930.361 ± 0.180.037 ± 0.00780.260 ± 6.660.305 ± 0.08
ON66 35.916 ± 4.450.418 ± 0.240.045 ± 0.0185.971 ± 6.170.343 ± 0.15
MAALI 30.916 ± 1.360.372 ± 0.180.040 ± 0.00682.296 ± 11.130.286 ± 0.05
Treatment (T)
Control 32.722 ± 2.970.574 ± 0.050.049 ± 0.00589.547 ± 5.570.214 ± 0.11
Osmotic stress 29.111 ± 5.20.17 ± 0.060.031 ± 0.00875.046 ± 3.850.340 ± 0.1
Mean 30.916 ± 4.60.372 ± 0.210.040 ± 0.0182.296 ± 8.70.286 ± 0.12
ANOVA
df
G2114.54 ***0.01050.000131 **61.0 *0.0176
T158.68 **0.7361 ***0.001422 ***946.3 ***0.0605 *
G × T225.35 **0.00700.000241 ***59.4 *0.0269
Error123.600.00290.00001514.40.718
Table 2. Genotype and treatment effects on genes expression (GS1, GS2, GDH, and NRT2) and enzymes activities (PEPC, APX, GS, and G6PDH) of three durum wheat genotypes grown under osmotic stress. In the lower panel, the ANOVA analysis is given. Legend: G, genotype; T, Treatment, *, **, *** significant at p < 0.05, p < 0.01 and p < 0.001 respectively.
GS1GS2GDHNRT2PEPc ActivityAPX ActivityGS ActivityG6PDH
Genotypes
Maali4.50 × 10−41.82 × 10−41.066.99 × 10−42.9612.7 × 1040.0992.21
YT136.63 × 10−42.91 × 10−43.597.82 × 10−43.1452.1 × 1040.1472.74
ON666.11 × 10−41.16 × 10−41.6912.2 × 10−43.2369.7 × 1040.1981.86
Treatments
Control8.13 × 10−43.03 × 10−41.729.26 × 10−43.69122000.1511.95
Osmotic stress3.36 × 10−40.89 × 10−42.568.72 × 10−42.5344100.1442.59
Means5.74 × 10−41.96 × 10−42.098.99 × 10−43.1182800.1482.27
ANOVA (mean square)
Genotype7.4 × 10−8 ***4.7 × 10⁻⁸ ***8.726 *4.6 × 10−7 ***11.66.07 × 1071.2 × 10−2 *77.21
Treatment1.0 × 10−6 ***2.04 × 10⁻⁷ ***3.2591.30 × 10−8599 ***1.80 × 1084.11 × 10−4125.29
G × T1.9 × 10−8 *1.7 × 10−8 *23.571 **1.18 × 10−814.6*5.86 × 1079.32 × 10−45.84
Error4.7 × 10−92.6 × 10−91.6979.90 × 10−93.21.22 × 10815.8 × 10−4144.50

