Article

Adaptability and Stability Comparisons of Inbred and Hybrid Cotton in Yield and Fiber Quality Traits

1
State Key Laboratory of Cotton Biology, Institute of Cotton Research of Chinese Academy of Agricultural Sciences, Anyang 455000, China
2
Cotton Research Station, Ayub Agricultural Research Institute, Faisalabad 38000, Pakistan
3
Zhengzhou Research Base, State Key Laboratory of Cotton Biology, Zhengzhou University, Zhengzhou 450000, China
*
Authors to whom correspondence should be addressed.
Agronomy 2019, 9(9), 516; https://doi.org/10.3390/agronomy9090516
Submission received: 17 July 2019 / Revised: 20 August 2019 / Accepted: 2 September 2019 / Published: 6 September 2019
(This article belongs to the Section Crop Breeding and Genetics)

Abstract

:
Cotton (Gossypium hirsutum L.) is the most important fiber crop worldwide. Characterizing genotype by environment interaction (GEI) is helpful to identify stable genotypes across diverse environments. This study was conducted in six environments to compare the performance and stability of 11 inbred lines and 30 intraspecific hybrids of cotton. Analysis of variance using the additive main effects and multiplicative interaction model revealed that genotype (G), environment (E), and GEI had highly significant effects on yield and fiber quality traits. Mean comparisons among genotypes showed that most hybrids had higher means for yield and fiber quality traits than inbred genotypes. Additionally, a larger portion of the total variability in yield traits was explained by E than G and GEI. However, G and GEI combined contributed more to the total variance in fiber traits than E. The first three interaction principal components explained the majority of GEI in all traits under study. For most traits, the environments were not clustered together, implying contrasting interaction with genotypes. Stability measurements indicated that most hybrids showed more stable performance than inbred lines for all traits. The hybrids SJ48-1 × Z98-15 and L28-2 × A2-10 displayed both better performance and stability in yield and fiber quality traits. Our results show the importance of hybridization for improving cotton yield and fiber quality in a wide range of environments.

1. Introduction

Cotton is a prime fiber crop and plays an important role in improving the economy of a country through industrial drive. Globally, cotton crops are cultivated in more than 80 countries and China is one of the leading cotton producing and consuming countries [1]. Thus, cotton is a substantial source of Chinese income. Breeders are interested in developing genotypes that not only have superior yield but also show better adaptation to multiple environments. Hybrid breeding can be used to obtain more stable and better yields in agronomic crops. Much success has already been achieved through hybrid breeding in rice [2] and maize [3]. The commercialization of hybrid cotton in China started around 1980 [4]. The planting area increased in subsequent years with the development of hybrid Bt cotton [5,6]. Enhanced adaptability of a genotype to different environments promotes wide cultivation by farmers. However, different genotypes respond differently to environmental variations. Altered performance of a genotype for a given trait across different environments is defined as genotype by environment interaction (GEI) [7]. GEI explains that not only the genetic potential of a genotype but also its interaction with environmental factors (climate, soil type, planting methods, and management technology) affects the phenotypic expression of a trait.
Knowledge about the nature and structure of GEI is important to make direct or indirect selections of potential genotypes for crop improvement programs [8]. Indirect selection for a given trait requires repetitive field experiments in different locations and years, and needs suitable statistical methods to measure the performance, adaptability, and stability of genotypes. There are two possible ways to minimize GEI in any crop production system. The first consists of changing from a heterogeneous area to homogeneous sub-regions and aiming to develop a region-specific cultivar [9]. However, this approach is costly and still cannot minimize the GEI to a large extent [10]. Another applicable strategy is the selection of stable cultivars for diverse environments [11]. Successful or stable genotypes show superior performance and stability in yield across different environments [12]. The development of stable genotypes and corresponding management components can only be assessed through GEI research. Genotype stability has a pivotal role and simply means how consistent the yield of a genotype is compared with other genotypes. However, Eberhart and Russell [11] proposed that genotypes with minimal interaction with the environment could be regarded as stable genotypes.
Many studies have reported that GEI has significant effects on yield and quality traits in various crops [13,14,15,16]. Similarly, GEI research has long been of major interest to cotton breeders. Such research ranks genotypes based on their performance in different years and locations [17,18,19]. A GEI study on cotton over seven years found that 84.3% of the total variation in lint yield was caused by the environment (E). In contrast, genotype (G) and GEI accounted for only 7.4% and 8.4% of the total variance, respectively [20]. Another comprehensive study across 36 years involving high-quality regional tests in the USA concluded that E, G, and GEI explained 80%, 7%, and 13% of the total variation in lint yield, respectively [21]. Cotton yield is a quantitative and complex trait controlled by multiple genes that have different responses and interactions with the environment. Many other researchers also concluded that E was a major contributor to the total phenotypic variability of yield traits in cotton [22,23,24]. A study including 82 germplasm lines and cultivars revealed that GEI caused 46% of the phenotypic variation in boll weight, which was larger than for both E and G [23]. Most GEI studies have shown contradictory results for fiber quality traits [20,22]. Some researchers reported that variation in fiber length and strength was mainly affected by G and less by E and GEI [22,25].
Many parametric and non-parametric models have been developed for plant breeding to analyze the responses of genotypes to different environments [26,27,28]. Several researchers have reported that the additive main effects and multiplicative interaction (AMMI) model is effective for investigating GEIs in agronomic crops, e.g., rice [16,29], wheat [13,30], and maize [31]. The AMMI model uses regression analysis, which depends on G and E scores derived from principal component analysis of the GEI matrix to identify covariates of genotypes and environments [32]. Furthermore, it also assists in characterizing environments based on more variables [33]. GEI scores can be visualized through biplots. GEI analysis consequently ranks genotypes as specifically or widely adapted to different environments [30,34]. Adaptability is the ability of a genotype to perform well in given conditions or a definite subset of environments. However, it might be not consistent under different years or conditions. Genotypes with specific adaptation are important for improving regional yields. Many stability models have been proposed by researchers to identify stable genotypes across diverse environments [11,26,35]. Although GEI has been extensively investigated by researchers for different traits in cotton, little is known about GEI in hybrid cotton. In this study, we tested 30 F1 intraspecific upland cotton hybrids and 11 inbred lines in three different locations belonging to three main cotton belts of China. The environmental variables in these locations all differed. Field experiments were performed for two consecutive years. Yield and fiber trait data from the field experiments were used to evaluate GEI and measure stability. The primary objective of this study was to compare the performance, adaptability, and stability of hybrid and inbred cotton lines and select promising genotypes for different traits.

2. Material and Methods

2.1. Plant Materials and Field Experiments

To determine whether hybrids perform better than inbred cotton in different environments, the current study considered 30 intraspecific F1 hybrids and 11 inbred lines. The inbred lines had diverse genetic backgrounds and performed well in the three main cotton belts of China [1]. Table 1 provides a list of all genotypes. The field experiments were conducted at three different research centers of the Institute of Cotton Research of the Chinese Academy of Agricultural Sciences, Anyang, Alar, and Wuwei, in 2016–2017. Anyang (Yellow River cotton belt) is in Henan Province and has a temperate continental climate. Alar (Northwest inland cotton belt) is in Xinjiang Province and has a temperate continental arid climate. Wuwei (Yangtze River cotton belt) is in Anhui Province, with a subtropical climate. The environmental variables and soil type in these locations all differed. The soil texture in Anyang is loam, whereas Alar and Wuwei have sandy and clay soil, respectively. The seasonal average, maximum, and minimum temperatures, total precipitation, and total sunshine hours of each trial can be seen in Table 2. Seeds were sown in late April at each location. All plant material was organized in a randomized complete block design (RCBD) with three replications. The planting densities in Wuwei, Anyang, and Alar were 1.80, 3.75, and 12 plants per m2, respectively. A higher planting density is recommended in Alar because of the arid climate and short frost-free period. The crop was drip-irrigated 8–10 times in Alar throughout the entire growing season. The irrigation application was 6–8 times in Anyang and 4–6 times in Wuwei through the furrow irrigation system. Agronomic practices recommended by the regional authority were applied at each location during the whole growing season [36,37].

2.2. Yield and Fiber Trait Evaluation

In mid-September, the number of bolls was counted for all plants in each line. The number of bolls per plant was obtained by dividing the total number of bolls by the total number of plants. In the last week of October, 50 fully opened bolls were picked randomly from each plot and ginned using a 10-saw laboratory gin. The seed cotton and lint were weighed to calculate the boll weight (g per boll). The seed cotton was harvested by hand, picking twice to avoid environmental damage, and weighed after drying; this weight was converted to seed cotton yield (SCY, kg ha−1). Lint yield was calculated by multiplying the seed cotton yield by the lint percentage. Lint percentage was determined as lint weight/seed cotton weight × 100. Subsamples of lint collected from each plot were used to measure fiber quality traits using a High Volume Instrument (HVI) 900 (Test Center of Cotton Fiber Quality affiliated with the Agriculture Ministry of China, Institute of Cotton Research of Chinese Academy of Agricultural Science, Anyang, Henan, China). Data for the fiber quality traits fiber length (FL, mm; upper half mean length), fiber elongation (FE, %), fiber uniformity (FU, %), fiber strength (FS, cN/tex), and micronaire (MIC, unit) were collected from the above standard lab. For fiber elongation (FE, %), no separate/specific HVI calibration was performed except for calibrating the first test sample with the international standard provided by USTER.

2.3. Statistical Analysis

Simple analysis of variance with the Statistix 8.1 software showed that the trial year had a significant effect on all traits under study (Supplementary Materials, Table S1). Therefore, the combinations of the three locations and two years were considered six distinct environments. All phenotypic data from the six environments and 41 genotypes were subjected to analysis of variance and principal component analysis (PCA) based on singular value decomposition [38] using the AMMI model [32]. The number of significant interaction principal components (IPCs) was determined by considering their contribution to the total GEI and p-value. The mean performance of different genotypes was compared using Tukey’s honest significant difference (HSD) test at p < 0.05 with the Statistix 8.1 software. Stability analysis was conducted with the Eberhart and Russell model [11] and coefficient of variability [35]. The javascript tool Genotype × Environment Analysis with R (GEA-R) [39] was used to perform AMMI model analysis and a visual assessment of all results as described in [34]. The freely available 64-bit version of the R Studio statistical software R Version 3.2.2 [40] was used to perform all statistical analysis.

3. Results

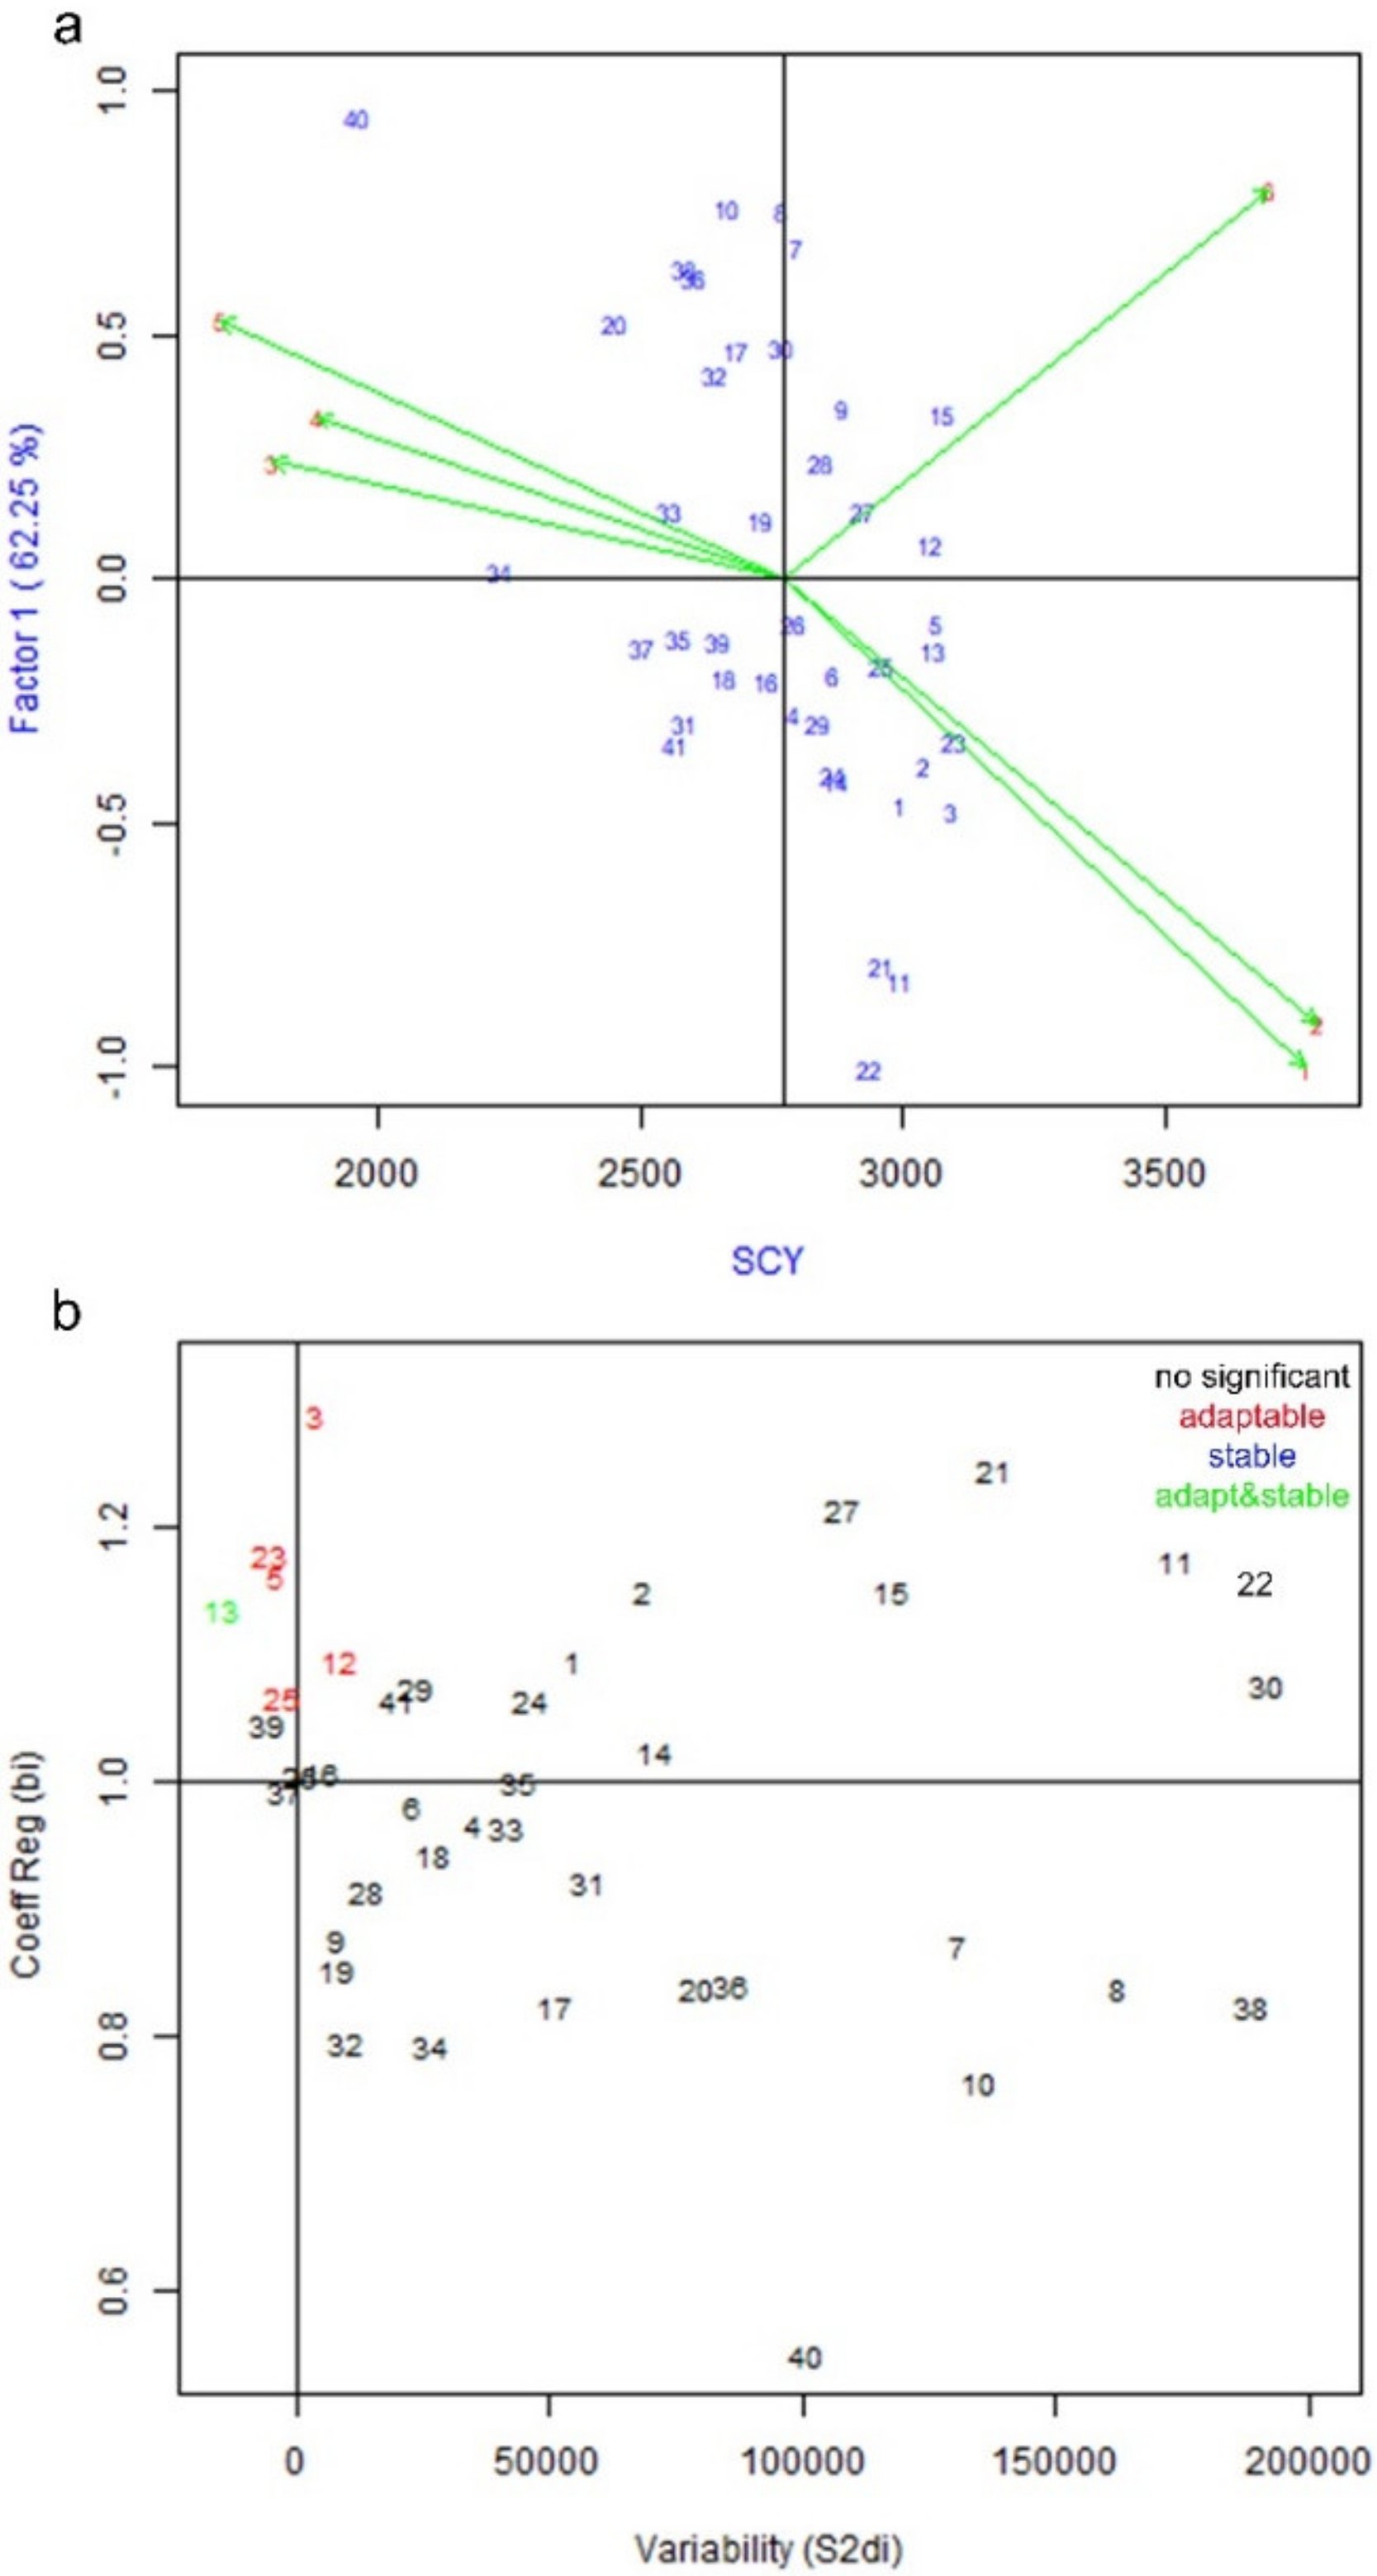
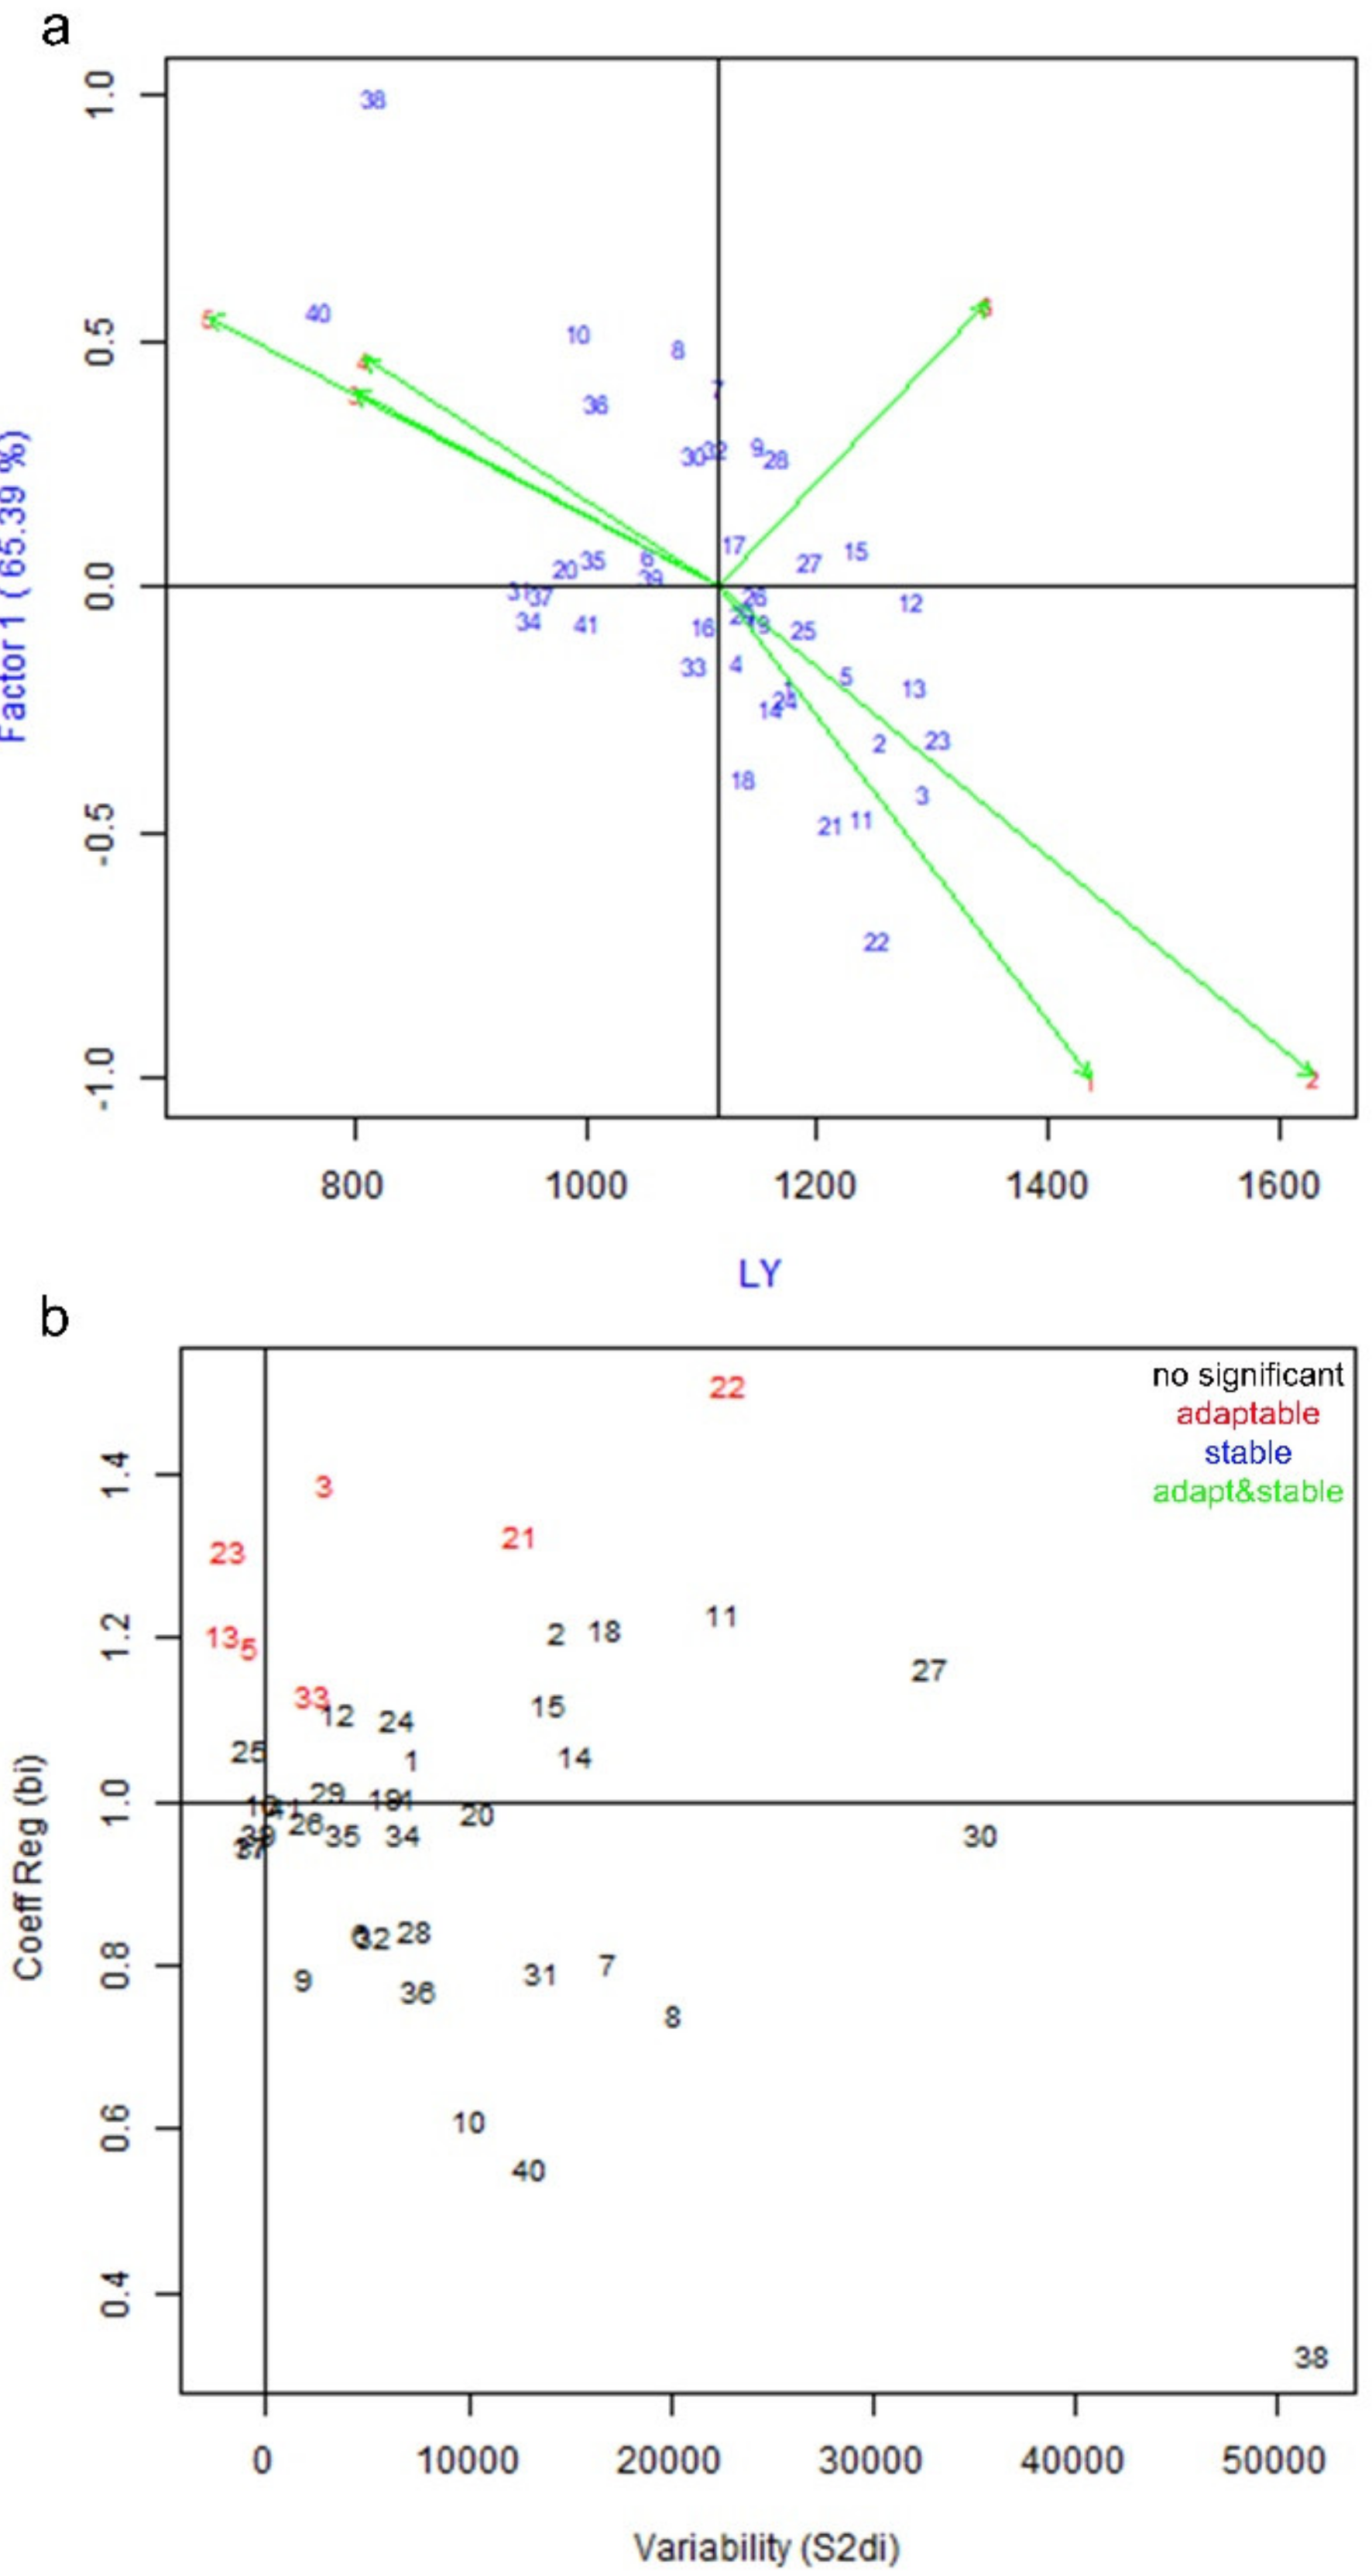
3.1. Genotype by Environment Interaction and Stability Analysis of Yield Parameters

Analysis of variance using the AMMI model for yield parameters is presented in Table 3. The results show that E, G, and G × E had highly significant effects (p < 0.001) on all yield traits. Furthermore, the first three IPCs were highly significant for all yield and contributing traits. E as a main effect explained 97.5% of the total sum of squares of BN, whereas G and G × E explained only 0.9% and 1.5% of the variation, respectively. A mean comparison test of genotypes based on the six environments showed that hybrids K8-1 × RP24-10 and L28-2 × 851-2 had the highest mean (27 bolls per plant) for BN. Conversely, inbred lines 851-2 and Z98-15 had the lowest mean (21 bolls per plant) (Supplementary Materials, Table S2). Furthermore, the first three principal components (IPC1 to IPC3) together described 98.8% of GEI. GEI scores for all traits are represented through biplots. The perpendicular line inside this biplot shows the grand mean. All genotypes clustered together had similar performance and the environments clustered together had similar effects. All genotypes and environments on the left and right sides of this perpendicular line showed lower and higher performances than the grand mean, respectively.
According to the IPC1 scores for BN, the tested locations showed large differences. The Wuwei environments (5, 6) showed higher performance than the grand mean. The opposite was true for the Anyang (1, 2) and Alar (3, 4) environments. Notably, the difference in the recommended planting density was a factor in the large differences between locations (Supplementary Materials, Figure S1a). For example, the high recommended planting density in Alar resulted in less BN compared with the other locations. In this data set with different environments and agronomic practices, it was interesting to find out which genotypes performed the best. The Eberhart and Russell stability analysis for BN revealed that hybrids SJ48-1 × GC-8, L28-2 × A2-10, K8-1 × A2-10, SJ48-1 × A2-10, ZB-1 × DT-8, SJ48-1 × Z98-15, and ZB-1 × RP24-10 had high adaptability to all environments under study (Supplementary Materials, Figure S1b). These hybrids all had a coefficient of regression (bi) between 1.1 and 1.2 and showed negative scores for the coefficient of variability (S2di). The hybrid K8-1 × GC-8 had the characteristics of both adaptability and stability for BN. Based on the coefficient of variance (CV%) results, the hybrids Zhong901-19 × 851-2, Zhong901-19 × A2-10, ZB-1 × 851-2, K8-1 × 851-2, and Zhong901-19 × RP24-10 had good and stable performance relative to the other genotypes (Supplementary Materials, Figure S2).
Table 3 shows that E, G, and G × E explained 81.2%, 9.4%, and 9.4% of the total sum of squares of BW, respectively. Comparisons of the means among genotypes showed that the hybrid SJ48-1 × DT-8 had the highest mean (6.3 g per boll) and inbred line RP24-10 had the lowest mean (5 g per boll) for BW (Supplementary Material, Table S2). Further analysis showed that the first, second, and third IPCs described most of the GEI. The IPC1 scores for this trait showed that the Wuwei environment had lower performance for BW than Anyang and Alar (Figure 1a). The low BW in Wuwei was either related to high precipitation or less sunlight, as higher precipitation and fewer sunshine hours were observed at this location (Table 2). In the stability analysis, the hybrids Zhong901-19 × GC-8, ZB-1 × GC-8, ZB-1 × A2-10, K8-1 × DT-8, L28-2 × Z98-15, and SJ48-1 × Z98-15 had better scores for the coefficient of regression (bi) and coefficient of variability (S2di) (Figure 1b). Thus, these genotypes have the potential for wide adaptation. However, only the hybrid ZB-1 × 851-2 had stable performance across the studied environments. Furthermore, we observed that the hybrids Zhong901-19 × GC-8, L28-2 × GC-8, K8-1 × GC-8, Zhong901-19 × 851-2, L28-2 × 851-2, L28-2 × A2-10, SJ48-1 × A2-10, K8-1 × A2-10, K8-1 × Z98-15, SJ48-1 × RP24-10, and K8-1 × RP24-10 showed less CV% and good performance for BW (Supplementary Materials, Figure S3).
SCY is the final output obtained from the cotton field. Analysis of variance showed that E, G, and G × E described 88%, 5.2%, and 6.6% of the total sum of squares, respectively (Table 3). The highest SCY-producing genotype was the hybrid SJ48-1 × Z98-15, with a mean of 3096 kg/ha, while the inbred line Z98-15 had the lowest performance (1960 kg/ha) (Supplementary Materials, Table S2). Moreover, the first three principal components explained 94.9% of the GEI (Table 3). The results showed that three hybrids (5, 12, and 13) performed the best and had IPC1 scores near zero. Thus, SCY fluctuates less in these genotypes with environmental changes. The Alar and Wuwei environments produced lower SCY values than Anyang (Figure 2a). Low or high seasonal precipitation and fluctuating temperatures during the late stage might be associated with low yield. For instance, high precipitation in Wuwei was recorded during the first year (Table 2). The low minimum temperature, shorter frost-free period, and low precipitation were probably connected with the low yield in Alar. Stability measurement of this trait showed that the hybrids SJ48-1×Z98-15, SJ48-1 × GC-8, K8-1 × GC-8, L28-2 × A2-10, and K8-1 × Z98-15 had the greatest stability across environments (Figure 2b). Furthermore, the hybrid SJ48-1 × A2-10 had the characteristics of both stable performance and adaptability. Based on CV%, the following hybrids had good performance in SCY: ZB-1 × GC-8, Zhong901-19 × 851-2, L28-2 × 851-2, ZB-1 × 851-2, L28-2 × A2-10, ZB-1 × A2-10, K8-1 × Z98-15, Zhong901-19 × RP24-10, and SJ48-1 × RP24-10 (Supplementary Materials, Figure S4).
For LY, E as a main effect contributed to most of the variability. E described 82% of the variation, while G and G × E together accounted for 18% of the variance (Table 3). The hybrid SJ48-1 × Z98-15 had the highest mean (1305 kg/a) for LY, while the inbred line Z98-15 showed the lowest mean (768 kg/ha) (Supplementary Materials, Table S2). The first, second, and third principal components explained 65.4%, 20.6%, and 8.5% of GEI for this trait, respectively (Table 3). The IPC1 scores for the mean LY trait revealed that different genotypes had different interactions across the different environments. However, only hybrid (12) showed high performance and almost zero interaction with the environments. The Alar environments and the first season at Wuwei had low performance compared with Anyang (Figure 3a). This result indicates that the Anyang environment is better for LY than the others. Among all genotypes, the hybrids SJ48-1 × Z98-15, K8-1 × GC-8, SJ48-1 × A2-10, SJ48-1 × GC-8, Zhong901-19 × Z98-15, and L28-2 × Z98-15, and inbred line SJ48-1 had good scores for the coefficients of regression (bi) and variability (S2di) (Figure 3b). Therefore, these genotypes can be considered superior due to their greater adaptability to diverse environments. Stability evaluation based on CV% showed that the hybrids Zhong901-19 × GC-8, ZB-1 × GC-8, ZB-1 × 851-2, L28-2 × A2-10, L28-2 × DT-8, ZB-1 × DT-8, K8-1 × Z98-15, Zhong901-19 × RP24-10, SJ48-1 × RP24-10, and ZB-1 × RP24-10 had good and stable performance for LY (Supplementary Materials, Figure S5).
Analysis of variance for LP revealed that E, G, and G × E described 67.5%, 19.9%, and 12.6% of the total sum of squares, respectively (Table 3). Comparisons of means among genotypes showed that the hybrid L28-2 × Z98-15 had the highest mean (43.1%) for LP and the inbred line A2-10 had the lowest mean (36.4%) (Supplementary Materials, Table S2). Furthermore, IPC1 explained 76.9% of GEI; IPC2 and IPC3 explained 13.9% and 4.1% of GEI, respectively. The results show that hybrid (22) not only had high LP but also had the least interaction with the environment. The Wuwei environments showed lower performance, while the Alar environments and the second season at Anyang were the best performers for this trait (Supplementary Materials, Figure S6a). Low precipitation and plenty of sunshine were possibly linked with the better performance at Alar (Table 2). Further results showed that the inbred line Zhong901-19 had the lowest scores for the coefficient of regression (bi) and coefficient of variability (S2di), while only inbred line GC-8 had stable performance (Supplementary Materials, Figure S6b). The CV% results show that 13 hybrids, including L28-2 × GC-8, SJ48-1 × GC-8, ZB-1 × GC-8, L28-2 × A2-10, SJ48-1 × A2-10, Zhong901-19 × Z98-15, L28-2 × Z98-15, SJ48-1 × Z98-15, ZB-1 × Z98-15, Zhong901-19 × RP24-10, L28-2 × RP24-10, SJ48-1 × RP24-10, and ZB-1 × RP24-10, had good performance for LP. In addition to the hybrids, the inbred lines L28-2, SJ48-1, and ZB-1 had good performance and stability compared with the other inbred lines (Supplementary Materials, Figure S7).

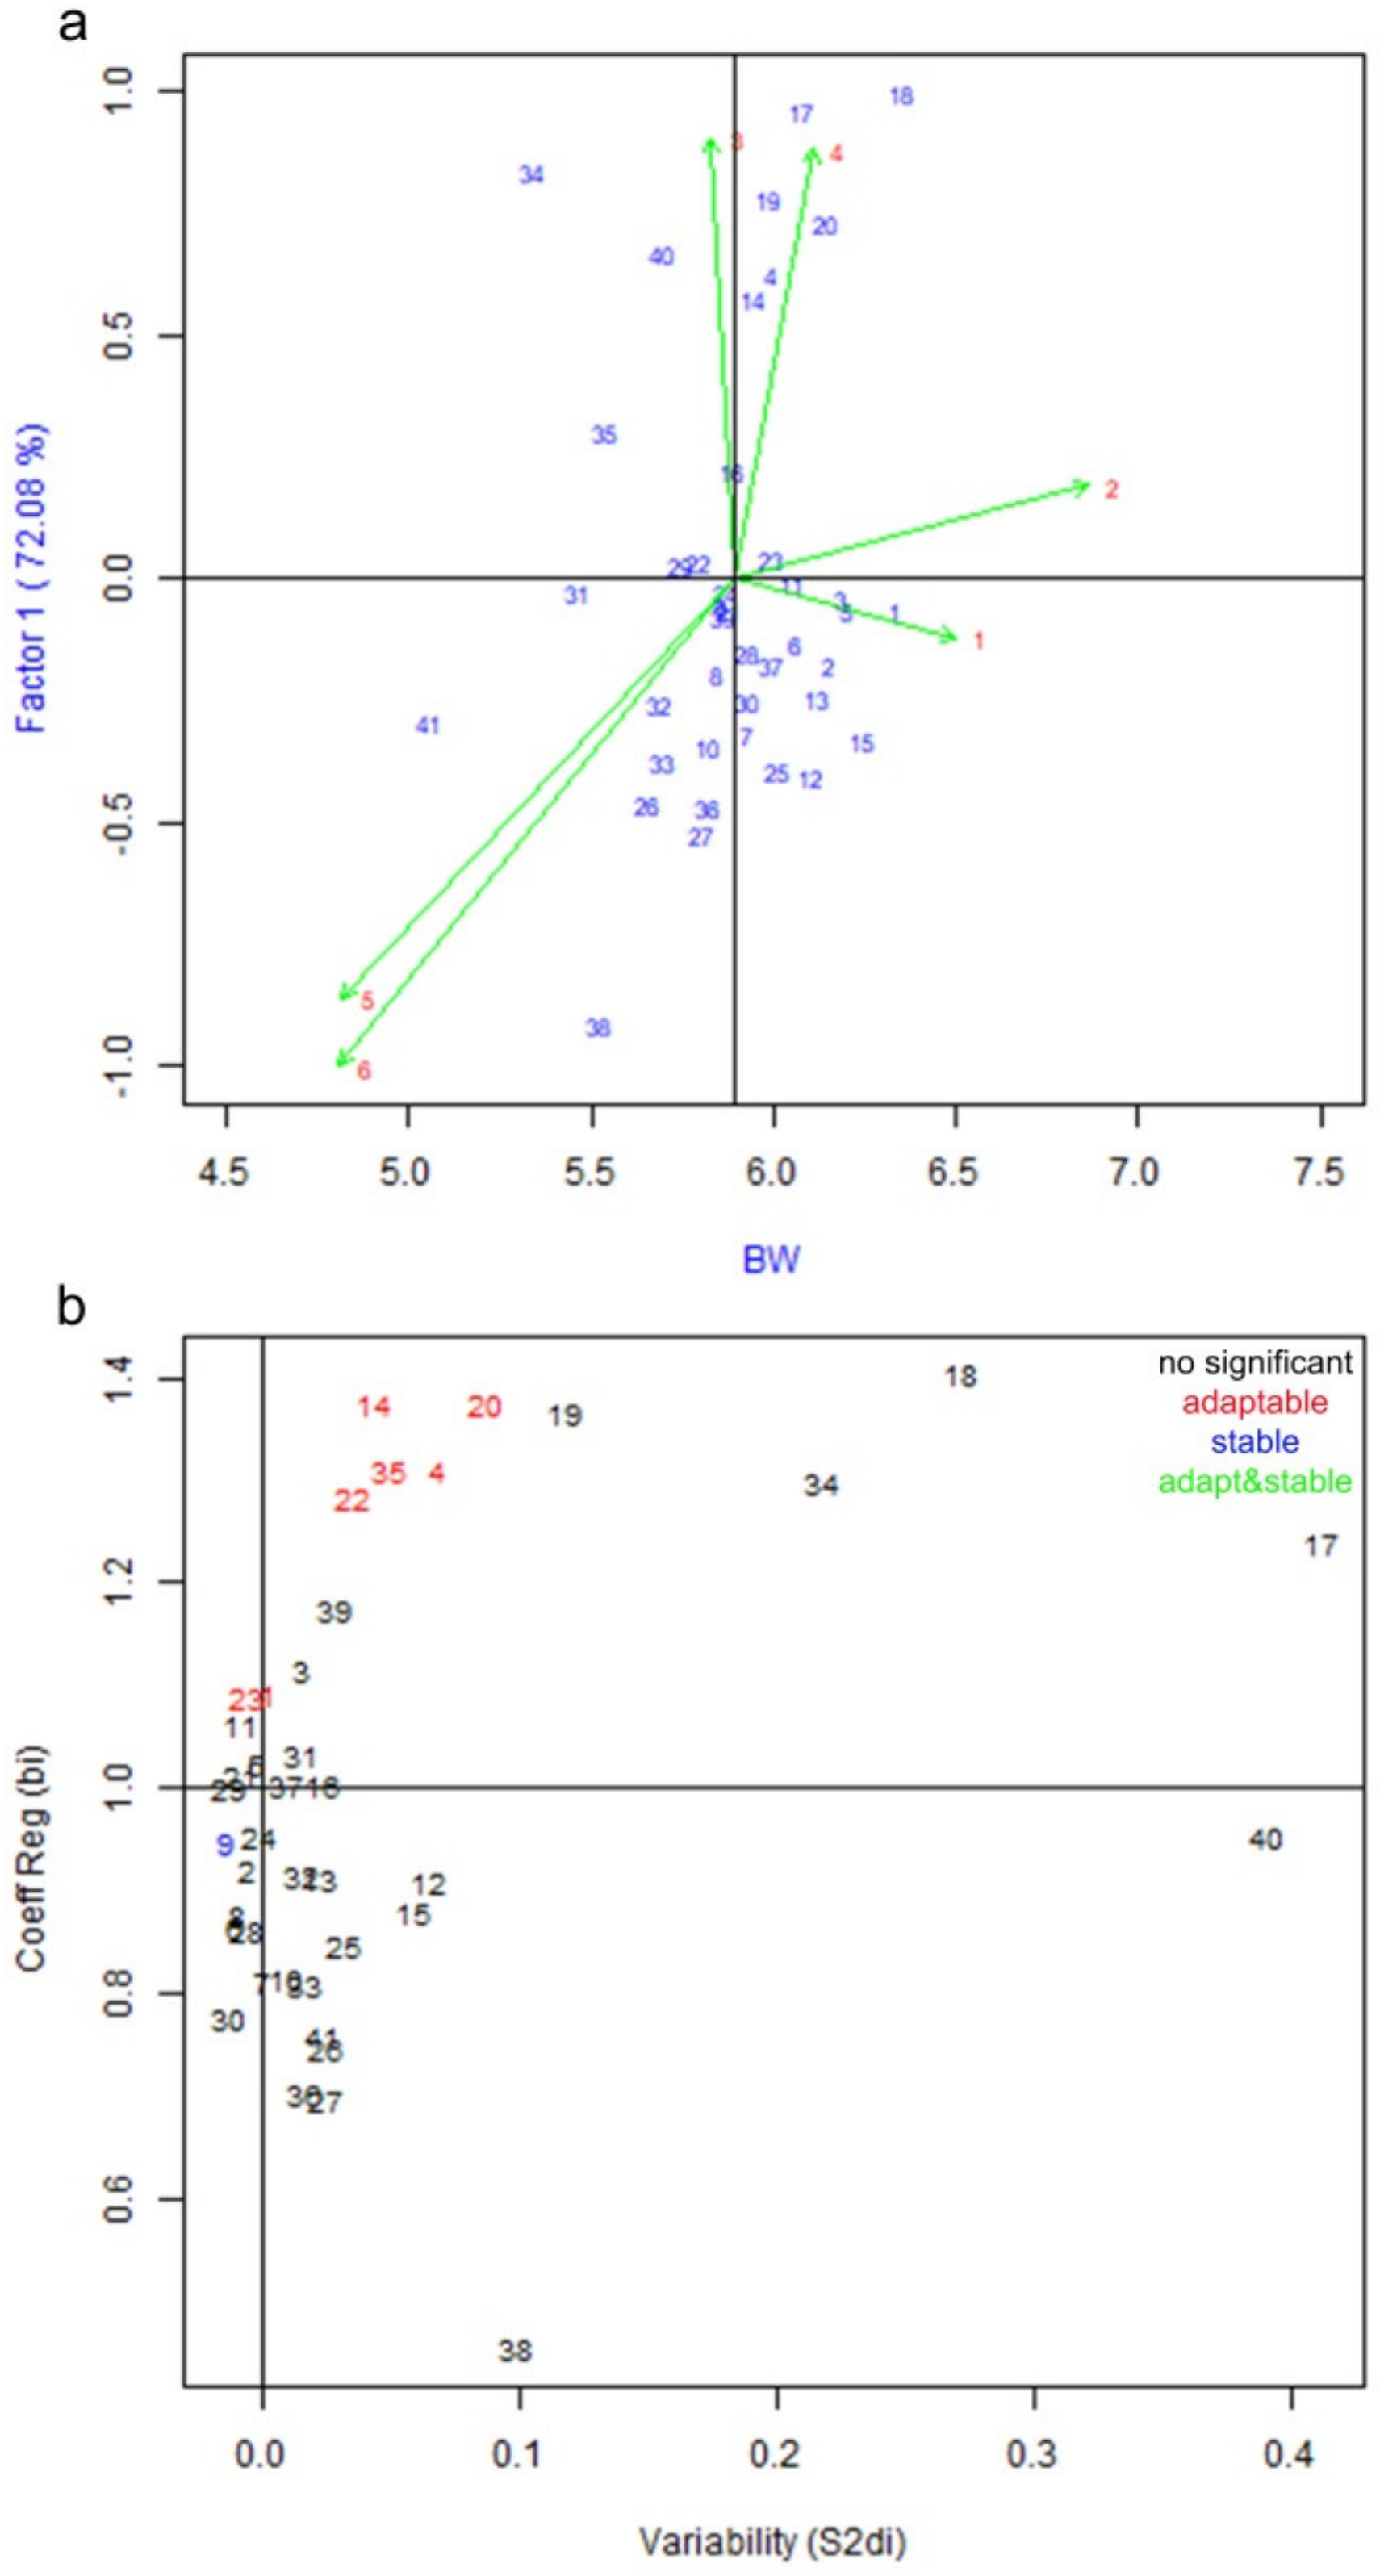
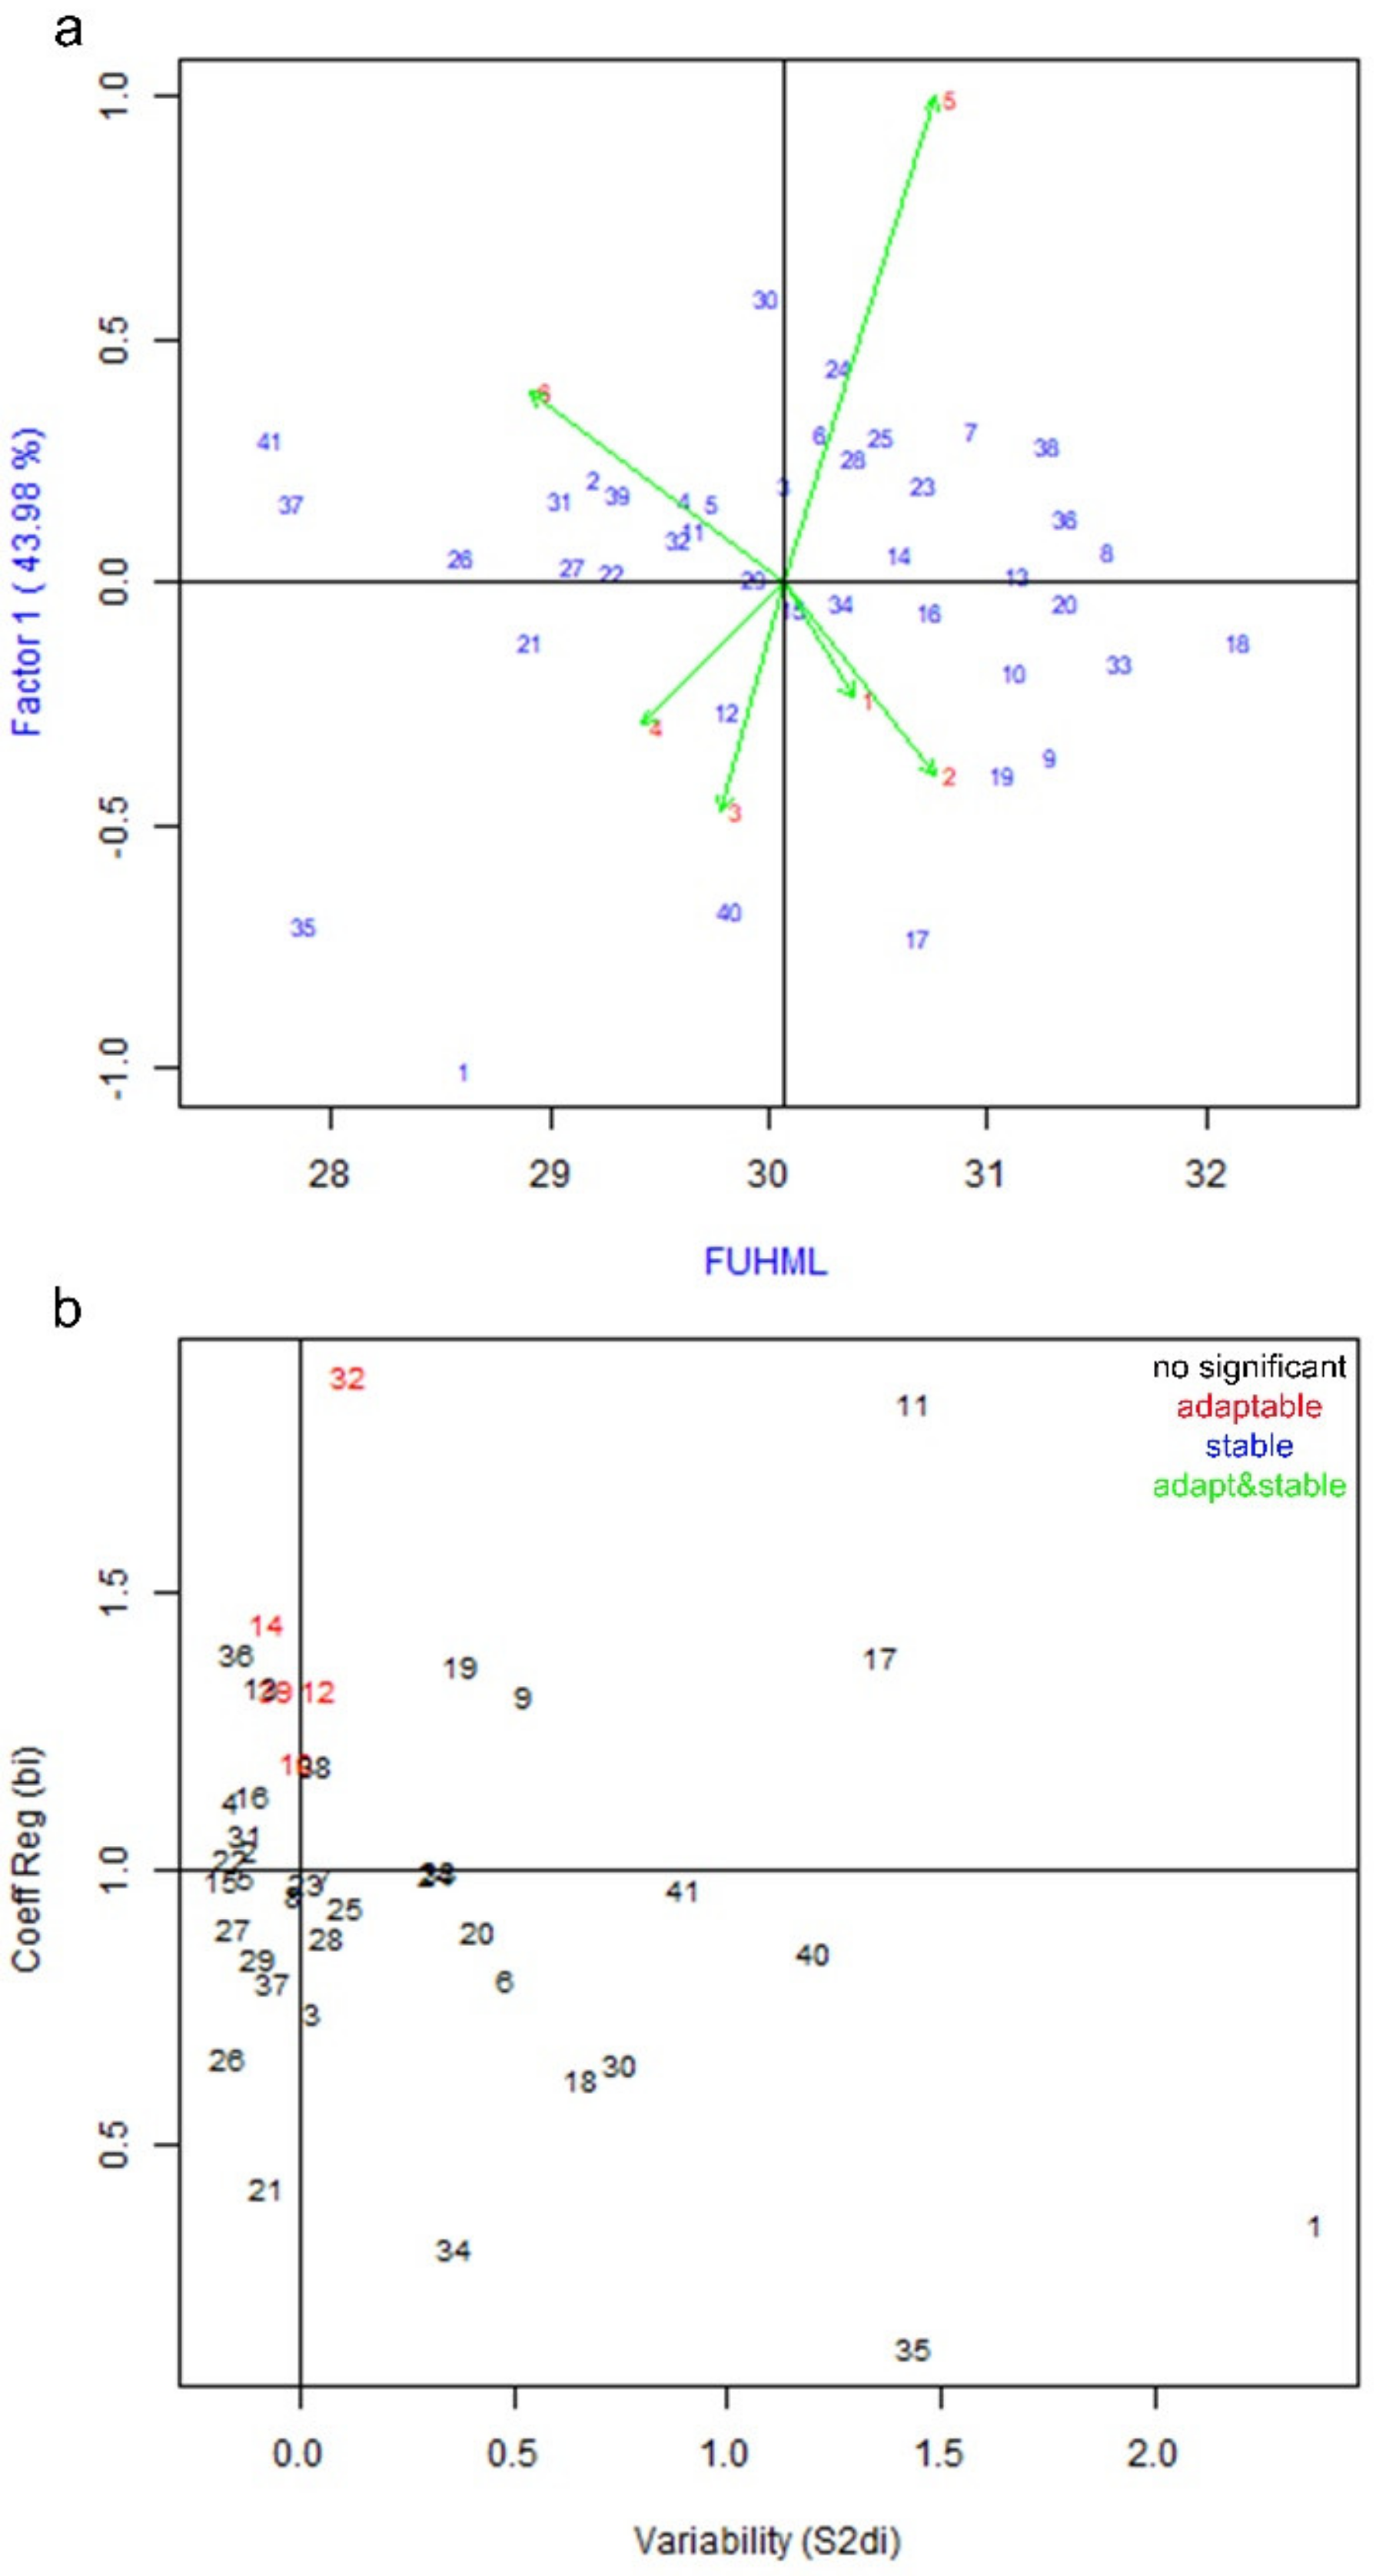
3.2. Genotype by Environment Interaction and Stability Analysis of Fiber Quality Parameters

Analysis of variance using the AMMI model for fiber quality traits is presented in Table 4. E, G, and their interaction showed highly significant effects (p < 0.001) on all fiber quality traits except FE, for which G × E had non-significant effects. Furthermore, the first three IPCs were highly significant for most of the fiber quality parameters. For FUHML, G explained 56% of the total sum of squares, whereas G × E and E described 20.1% and 23.6% of the variation, respectively. Comparisons of mean performance among genotypes across different environments revealed that the hybrid SJ48-1 × DT-8 had the highest performance (32.1 mm) for FUHML. The inbred line RP24-10 performed the worst and had a mean of 27.7 mm (Supplementary Materials, Table S3). The partitioning of GEI showed that the first three principal components explained 44%, 22%, and 16% of GEI, respectively. According to the results, the environments at the Anyang site produced greater fiber length than Alar and Wuwei (Figure 4a). The IPC1 score of Anyang was around −0.5, implying that E at this location had the least interaction with G. These results suggest that changing environments affect FUHML. In the stability analysis, the hybrids K8-1 × 851-2, L28-2 × A2-10, and ZB-1 × A2-10 showed better scores for the coefficient of regression (bi) and coefficient of variability (S2di) (Figure 4b). Thus, these lines were more adaptable to the studied environments relative to the other genotypes. The CV% results revealed that the hybrids Zhong901-19 × 851-2, L28-2 × 851-2, SJ48-1 × 851-2, K8-1 × 851-2, K8-1 × A2-10, Zhong901-19 × DT-8, SJ48-1 × DT-8, K8-1 × DT-8, SJ48-1 × Z98-15, K8-1 × Z98-15, and SJ48-1 × RP24-10 and the inbred lines SJ48-1, ZB-1, and A2-10 had good and stable performance for FUHML (Supplementary Materials, Figure S8).
E and G described 37.3% and 33.2% of the total sum of squares for FE, respectively. However, G × E had a non-significant effect on FE (Table 4). Mean comparisons among genotypes showed that the inbred line SJ48-1 and hybrid SJ48-1 × DT-8 had the highest means (6.85%) and the inbred line RP24-10 had the lowest mean (6.62%) for FE (Supplementary Materials, Table S3). Furthermore, the first two principal components explained a big portion of GEI. The Anyang environments had negative interaction scores compared with those at Alar and Wuwei (Supplementary Materials, Figure S9a). However, the performances of all environments were very similar. Moreover, the range of genotypic interaction with the environments was very narrow. These findings indicate that FE is mostly dependent on the genetic potential of genotypes and not their interaction effects with different environments. The results of stability measurement showed that the hybrid L28-2 × GC-8 was the most stable. The hybrid SJ48-1 × GC-8 and inbred lines SJ48-1 and GC-8 were adaptable to all environments under study (Supplementary Materials, Figure S9a). The hybrids Zhong901-19 × GC-8, L28-2 × GC-8, L28-2 × 851-2, SJ48-1 × 851-2, ZB-1 × A2-10, ZB-1 × DT-8, SJ48-1 × Z98-15, and SJ48-1 × RP24-10, and inbred line ZB-1 showed low CV% values and stable performance for FE (Supplementary Materials, Figure S10).
The results showed that E as a main effect accounted for 45.7% of the variability of FU, whereas G and G × E described 28.2% and 26.1% of the total variance of this trait, respectively (Table 4). Among all genotypes, the hybrid ZB-1 × GC-8 had the highest mean (85.9%) and the inbred line RP24-10 had the lowest mean for FU (82.5%) (Supplementary Materials, Table S3). The first three principal components explained a large portion of GEI. The Anyang environment had negative interaction scores for both years (Supplementary Materials, Figure S11a) and showed better performance than the Alar and Wuwei environments. However, it is difficult to determine which environmental factor led to the difference. Stability analysis for FU revealed that the hybrids Zhong901-19 × RP24-10 and L28-2 × RP24-10 and inbred lines Zhong901-19, L28-2, and DT-8 were the most adaptable (Supplementary Materials, Figure S11b). Only the hybrid Zhong901-19 × 851-2 and inbred line ZB-1 and 851-2 had stable performance, according to their better regression and variability scores. Among all genotypes, the hybrids SJ48-1 × 851-2, ZB-1 × GC-8, L28-2 × A2-10, SJ48-1 × A2-10, ZB-1 × A2-10, Zhong901-19 × DT-8, SJ48-1 × DT-8, ZB-1 × DT-8, K8-1 × DT-8, L28-2 × Z98-15, ZB-1 × Z98-15, K8-1 × Z98-15, and SJ48-1 × RP24-10 and inbred lines ZB-1 and GC-8 showed low CV% for FU (Supplementary Material, Figure S12).
The effect of E accounted for 40.6% of the variance of FS, while G and G × E contributed 45.2% and 14.2% of the total variance, respectively (Table 4). The hybrid ZB-1 × 851-2 showed the highest FS, with a mean of 32.4 cN/tex, whereas the inbred line RP24-10 performed the worst, with a mean of 27.3 cN/tex (Supplementary Materials, Table S3). Further results show that the first three principal components accounted for a large part of GEI. The genotypes in the Alar environment had lower FS values in both years (Figure 5a). The Anyang and Wuwei environments in both seasons were favorable and led to better performance of genotypes. Frost during the full opening stage in Alar might be associated with the low performance of this trait. In the stability test, the hybrids SJ48-1 × GC-8 and K8-1 × GC-8 had the best scores (Figure 5b). Thus, they had more stable performance than all the other genotypes. We found that the hybrids SJ48-1 × 851-2, ZB-1 × 851-2, ZB-1 × A2-10, and K8-1 × DT-8 and inbred lines Zhong901-19, K8-1, 851-2, and DT-8 were adaptable to all studied environments. Based on the CV% results, the hybrids SJ48-1 × GC-8, K8-1 × GC-8, Zhong901-19 × 851-2, K8-1 × 851-2, SJ48-1 × A2-10, SJ48-1 × DT-8, ZB-1 × DT-8, K8-1 × DT-8, SJ48-1 × Z98-15, and K8-1 × Z98-15 and inbred lines SJ48-1, ZB-1, GC-8, A2-10, and Z98-15 had stable and good performance in FS (Supplementary Materials, Figure S13).
Analysis of variance showed that E, G, and G × E explained 47.4%, 27.4%, and 25.2% of the total sum of squares of MIC, respectively (Table 4). Among all genotypes, the hybrid Zhong901-19 × A2-10 and inbred line DT-8 had the highest mean (5.5) for MIC. The inbred line A2-10 showed the lowest mean of 4.6 (Supplementary Materials, Table S3). IPC1, IPC2, and IPC3 explained 59.6%, 16.6%, and 15.1% of GEI, respectively. The biplot of the IPC1 score versus MIC showed that the environments at the Alar site in both years had similar effects, with lower performance than the grand mean (Supplementary Materials, Figure S14a). The first- and second-year environments of Wuwei and Anyang had contrasting interaction scores. This difference might be linked with the distribution of seasonal precipitation. Six hybrids had better scores for the coefficient of regression (bi) and coefficient of variability (S2di) in the stability analysis (Supplementary Materials, Figure S14b). The hybrids Zhong901-19 × Z98-15 and ZB-1 × RP24-10 had the most stable performance and the hybrids L28-2 × GC-8, K8-1 × GC-8, SJ48-1 × A2-10, and L28-2 × Z98-15 were adaptable to all tested environments. The CV% results revealed that the hybrids Zhong901-19 × GC-8, ZB-1 × GC-8, K8-1 × GC-8, Zhong901-19 × A2-10, L28-2 × A2-10, K8-1 × A2-10, Zhong901-19 × DT-8, ZB-1 × DT-8, L28-2 × Z98-15, ZB-1 × Z98-15, L28-2 × RP24-10, SJ48-1 × RP24-10, and K8 1 × RP24-10 and inbred line DT-8 had the lowest variance for MIC (Supplementary Materials, Figure S15).

4. Discussion

Investigating GEI is important for identifying high-yielding and stable genotypes for specific or diverse environments. The current study aimed to compare the performance, adaptability, and stability of inbred and hybrid cotton lines in yield and fiber quality traits. Phenotypic data for the 41 genotypes tested in six environments were analyzed with the AMMI model. The analysis of variance showed that the effects of E, G, and GEI were highly significant for all studied traits. The results further suggested that most of the phenotypic variation of yield traits was explained by E rather than G or GEI. It was observed that more than 80% of the total variance of BN, BW, SCY, LY, and LP was explained by E. In contrast, fiber quality traits had less variation due to E compared with yield traits. These findings were similar to many previously published reports on cotton [20,21,22,23,41,42,43,44], in which the researchers concluded that the majority of the total variance of yield traits was caused by E rather than G or GEI. However, a major portion of the total variance of fiber traits was attributable to G and GEI. Research results in wheat [45], rice [29], maize [46,47], and other crops [34,48] also highlight the importance of E in determining phenotypic variation in yield-contributing traits. In this study, the significant contribution of E to the total variance of all traits reflects the diverse environmental conditions across the testing locations. Moreover, yield traits are quantitative, as they are controlled by multiple genes. Therefore, the larger variation in yield traits is probably due to the various genes interacting with the environment. The major contribution of E to the total variability of cotton yield traits demands more studies to explore the actual causes of GEI.
The results of the mean comparison tests for genotypes reveal that many hybrids had better performance in yield and fiber quality than the inbred lines. Analysis using the AMMI model showed that a large part of GEI was explained by the first three principal components. Further results indicate that the environments at the study locations were not clustered together due to their unpredictable GEI effects. Therefore, they could not be grouped into so-called mega-environments. Mega-environments are homogeneous groups of locations that enable fewer representative environments to be selected for the assessment of genetic potential of genotypes to reduce research costs [49]. However, the identification of mega-environments is not easy. Baxevanos et al. [50] used four different data sets of different years and locations to study GEI in cotton. Their results revealed crossover G × E interactions, but were not appropriate for the identification of mega-environments. Another study of agronomic traits in cotton by Campbell and Jones [22] also reported similar results. Research results in many other crops have also shown similar inconsistency in location grouping, showing the complexity of identifying mega-environments [34,51,52,53]. Failure to classify environments into mega-environments can be resolved by considering several weather, soil, and management statistics at the testing locations [34]. Regardless, for the crossover GEI effects of studied locations, the environment of Anyang was discriminating for most of yield and fiber traits during both years.
Highly unpredictable environment variables require stability testing of the mean performance of genotypes in different environments. Thus, stability measurement is vital to identify high-yielding and stable genotypes. The results of stability analysis in the current study revealed that hybrid genotypes showed better and more stable performance than inbred cotton lines for yield and fiber quality traits. Furthermore, the hybrids were more adaptable to different environments. We found many outstanding hybrids that showed adaptable and stable performances for specific traits or sets of traits. For example, the hybrid SJ48-1 × Z98-15 produced the highest SCY and LY values and showed adaptability in these traits as well as BN and BW. Another hybrid, L28-2 × A2-10, also showed better performance and adaptability than the other lines in traits, like BN, SCY, FUHML, and FS. Two stability measurements were used in this study that were not consistent regarding the identification of stable genotypes. For instance, six hybrids showed higher SCY values and adaptability to the tested environments on the basis of the Eberhart and Russell model. However, based on CV%, nine hybrids had good and stable performance compared with the other genotypes. The reason for this difference may be the calculation methods that stability analysis depends on. Our results agree with previous research findings [54,55,56]. Conceptually, a successful genotype not only produces high yield but also shows stable performance in diverse environments. The hybrids identified in the current study with good and stable performance can be called successful genotypes for the tested locations or regions with similar agro-ecologies.
Recently, cotton and other crops have been facing increased challenges from biotic and abiotic stressors. The consequences of these factors should be kept in mind before selection and release of approved genotypes. In this regard, we believe that hybridization in cotton can be a useful tool to cope with these challenges. Superior offspring in a desired character can be produced by crossing genetically superior and physiologically effective inbred parents. Previously, studies comparing transgenic cultivars and non-transgenic recurrent parents have shown a significant difference between these cultivars in yield and quality traits [24,41,57]. Studies of hybrids of rice [16,58] and maize [59,60] have concluded that hybrid genotypes are not only high-yielding but also show stable performance in different environments. The ultimate objective of the current study was to compare the performance and stability of hybrids and inbred lines of cotton in different environments. The results enable us to understand the actual behavior of genotypes. High-yielding and stable genotypes were identified that can be used to exploit the genetic mechanism of yield vigor of cotton with sophisticated genetic tools. Furthermore, this study also provides valuable GEI statistics for a range of yield and fiber traits. However, further research is required to uncover the elusive aspects of GEI for yield traits of cotton.

5. Conclusions

Using the AMMI model, the current study revealed that the majority of the total variance of yield component traits was explained by E. In contrast, the variability in fiber quality traits was mostly attributable to the effects of G and GEI. Comparison of mean performance among genotypes revealed that hybrids had superior yield and fiber quality to inbred lines. The GEI results showed that the environments at the study locations had contrasting effects on genotype performance. The environment at the Anyang location was favorable for the majority of traits under study. Stability measurements using different approaches revealed that the hybrids had better and more stable performance in diverse environments than the inbred lines. The hybrid SJ48-1 × Z98-15, followed by L28-2 × A2-10, showed the best performance and stability in yield and fiber quality traits. Therefore, these genotypes can be recommended for wider cultivation or for regions with similar agro-climates. Collectively, our results suggest that hybridization in cotton can be useful to obtain high yield and fiber quality in diverse environments. However, further research to identify and quantify the relationship between environmental variables and genotype will help to achieve this goal.

Supplementary Materials

The following are available online at https://www.mdpi.com/2073-4395/9/9/516/s1, Table S1: Analysis of variance with p value for yield and fiber quality traits tested in three locations and two years. Table S2: Comparisons of mean for genotypes across six environments for yield traits. Table S3: Comparisons of mean for genotypes across six environments for fiber quality traits. Figures S1, S6, S9, S11, and S14 shows mean performance and stability of 41 genotypes at six environments for number of bolls per plant, lent percentage, fiber elongation, fiber uniformity and fiber micronaire, respectively. Figures S2–S5, S7, S8, S10, S12, S13, and S15 represents CV% of 41 genotypes at six environments for number of bolls per plant, boll weight, seed cotton yield, lint yield, lent percentage, fiber upper half mean length, fiber elongation, fiber uniformity, fiber strength, and fiber micronaire, respectively.

Author Contributions

C.X. and J.W. designed the experiments. L.G., T.Q., H.T., and H.W. constructed hybrid plant population and field investigations. K.S., X.Z., X.Q., M.Z., J.F. and B.Z. performed data curation. K.S. and M.S.I. performed data analysis. K.S. wrote the manuscript. C.X. and J.W. contributed to the preparation of the final manuscript. All authors read and approved the final manuscript.

Funding

This work was supported by National key Research and Development Program of China (2017YFD0101603).

Acknowledgments

The authors thanks field staff for their assistance in field experiments. We are grateful to Muhammad Yasir for his insightful comments on drafts of this paper. We also thank two reviewers for their valuable suggestions that improved early drafts of this paper.

Conflicts of Interest

The authors declare no conflict of interest.

References

  1. Li, X.; Shahzad, K.; Guo, L.; Qi, T.; Zhang, X.; Wang, H.; Tang, H.; Qiao, X.; Zhang, J.; Wu, J. Using yield quantitative trait locus targeted SSR markers to study the relationship between genetic distance and yield heterosis in upland cotton (Gossypium hirsutum). Plant Breed. 2019, 138, 105–113. [Google Scholar] [CrossRef]
  2. Cheng, S.H.; Zhuang, J.Y.; Fan, Y.Y.; Du, J.H.; Cao, L.Y. Progress in research and development on hybrid rice: A super-domesticate in China. Ann. Bot. 2007, 100, 959–966. [Google Scholar] [CrossRef]
  3. Duvick, D.N. Biotechnology in the 1930s: The development of hybrid maize. Nat. Rev. Genet. 2001, 2, 69. [Google Scholar] [CrossRef]
  4. Zhang, J.; Wu, M.; Yu, J.; Li, X.; Pei, W. Breeding potential of introgression lines developed from interspecific crossing between upland cotton (Gossypium hirsutum) and Gossypium barbadense: Heterosis, combining ability and genetic effects. PLoS ONE 2016, 11, e0143646. [Google Scholar] [CrossRef]
  5. Xing, C.; Jing, S.; Xing, Y. Review and Prospect on Cotton Heterosis Utilization and Study in China. Cotton Sci. 2007, 5, 337–345. [Google Scholar]
  6. Dong, H.; Li, W.; Tang, W.; Zhang, D. Development of hybrid Bt cotton in China–a successful integration of transgenic technology and conventional techniques. Curr. Sci. 2004, 86, 778–782. [Google Scholar]
  7. Kang, M.S. Using genotype-by-environment interaction for crop cultivar development. In Advances in Agronomy; Elsevier: Amsterdam, The Netherlands, 1997; Volume 62, pp. 199–252. [Google Scholar]
  8. Yue, G.; Roozeboom, K.; Schapaugh, W., Jr.; Liang, G. Evaluation of soybean cultivars using parametric and nonparametric stability estimates. Plant Breed. 1997, 116, 271–275. [Google Scholar] [CrossRef]
  9. Scapim, C.A.; Oliveira, V.R.; Cruz, C.D.; Andrade, C.A.d.B.; Vidigal, M.C.G. Yield stability in maize (Zea mays L.) and correlations among the parameters of the Eberhart and Russell, Lin and Binns and Huehn models. Genet. Mol. Biol. 200, 23, 387–393. [Google Scholar] [CrossRef]
  10. Tai, G.C. Genotypic stability analysis and its application to potato regional trials. Crop Sci. 1971, 11, 184–190. [Google Scholar] [CrossRef]
  11. Eberhart, S.T.; Russell, W. Stability parameters for comparing varieties 1. Crop Sci. 1966, 6, 36–40. [Google Scholar] [CrossRef]
  12. Becker, H.; Leon, J. Stability analysis in plant breeding. Plant Breed. 1988, 101, 1–23. [Google Scholar] [CrossRef]
  13. Hristov, N.; Mladenov, N.; Djuric, V.; Kondic-Spika, A.; Marjanovic-Jeromela, A.; Simic, D. Genotype by environment interactions in wheat quality breeding programs in southeast Europe. Euphytica 2010, 174, 315–324. [Google Scholar] [CrossRef]
  14. Hoeck, J.A.; Fehr, W.R.; Murphy, P.A.; Welke, G.A. Influence of genotype and environment on isoflavone contents of soybean. Crop Sci. 2000, 40, 48–51. [Google Scholar] [CrossRef]
  15. Anley, W.; Zeleke, H.; Dessalegn, Y. Genotype × environment interaction of maize (Zea mays L.) across North Western Ethiopia. J. Plant Breed. Crop Sci. 2013, 5, 171–181. [Google Scholar] [CrossRef]
  16. Akter, A.; Hasan, M.J.; Kulsum, M.; Rahman, M.; Paul, A.; Lipi, L.; Akter, S. Genotype× environment interaction and yield stability analysis in hybrid rice (Oryza sativa L.) by AMMI biplot. Bangladesh Rice J. 2015, 19, 83–90. [Google Scholar] [CrossRef]
  17. Miller, P.; Williams, J.; Robinson, H.; Comstock, R. Estimates of Genotypic and Environmental Variances and Covariances in Upland Cotton and Their Implications in Selection 1. Agron. J. 1958, 50, 126–131. [Google Scholar] [CrossRef]
  18. Miller, P.; Robinson, H.; Pope, O. Cotton Variety Testing: Additional Information on Variety × Environment Interactions 1. Crop Sci. 1962, 2, 349–352. [Google Scholar] [CrossRef]
  19. Pope, O.A.; Ware, J.O. Effect of Variety, Location, and Season on Oil, Protein, and Fuzz of Cottonseed and on Fiber Properties of Lint; US Department of Agriculture: Washington, DC, USA, 1945.
  20. Meredith, W., Jr.; Boykin, D.L.; Bourland, F.M.; Caldwell, W.D.; Campbell, B.T.; Gannaway, J.; Glass, K.; Jones, A.P.; May, L.M.; Smith, C. Genotype × environment interactions over seven years for yield, yield components, fiber quality, and gossypol traits in the regional high quality tests. J. Cotton Sci. 2012, 16, 160–169. [Google Scholar]
  21. Meredith, W.R., Jr. Thirty-six years of regional high quality variety tests. In Proceedings of the Beltwide Cotton Conferences, New Orleans, LA, USA, 7–9 January 2003; pp. 2561–2566. [Google Scholar]
  22. Campbell, B.; Jones, M. Assessment of genotype × environment interactions for yield and fiber quality in cotton performance trials. Euphytica 2005, 144, 69–78. [Google Scholar] [CrossRef]
  23. Campbell, B.; Chee, P.; Lubbers, E.; Bowman, D.; Meredith, W.; Johnson, J.; Fraser, D.; Bridges, W.; Jones, D. Dissecting genotype× environment interactions and trait correlations present in the Pee Dee cotton germplasm collection following seventy years of plant breeding. Crop Sci. 2012, 52, 690–699. [Google Scholar] [CrossRef]
  24. Bauer, P.J.; McAlister, D.D., III; Frederick, J.R. A comparison of Bollgard/Glyphosate tolerant cotton cultivars to their conventional parents for open end yarn processing performance. J. Cotton Sci. 2006, 10, 168–179. [Google Scholar]
  25. Kerby, T.; Burgess, J.; Bates, M.; Alberts, D.; Lege, K. Partitioning variety and environment contribution to variation in yield, plant growth, and fiber quality. In Proceedings of the Beltwide Cotton Conferences, San Antonio, TX, USA, 4–8 January 2000; pp. 528–532. [Google Scholar]
  26. Lin, C.-S.; Binns, M.R. A superiority measure of cultivar performance for cultivar× location data. Can. J. Plant Sci. 1988, 68, 193–198. [Google Scholar] [CrossRef]
  27. Kang, M.; Pham, H. Simultaneous selection for high yielding and stable crop genotypes. Agron. J. 1991, 83, 161–165. [Google Scholar] [CrossRef]
  28. Farshadfar, E.; Sabaghpour, S.H.; Zali, H. Comparison of parametric and non-parametric stability statistics for selecting stable chickpea (‘Cicer arietinum’L.) genotypes under diverse environments. Aust. J. Crop Sci. 2012, 6, 54. [Google Scholar]
  29. Kulsum, M.U.; Hasan, M.J.; Akter, A.; Rahman, H.; Biswas, P. Genotype-environment interaction and stability analysis in hybrid rice: An application of additive main effects and multiplicative interaction. Bangladesh J. Bot. 2013, 42, 73–82. [Google Scholar] [CrossRef]
  30. Elbasyoni, I. Performance and stability of commercial wheat cultivars under terminal heat stress. Agronomy 2018, 8, 37. [Google Scholar] [CrossRef]
  31. Crossa, J.; Gauch, H.; Zobel, R.W. Additive main effects and multiplicative interaction analysis of two international maize cultivar trials. Crop Sci. 1990, 30, 493–500. [Google Scholar] [CrossRef]
  32. Zobel, R.W.; Wright, M.J.; Gauch, H.G. Statistical analysis of a yield trial. Agron. J. 1988, 80, 388–393. [Google Scholar] [CrossRef]
  33. Gauch, H.; Zobel, R.W. Identifying mega-environments and targeting genotypes. Crop Sci. 1997, 37, 311–326. [Google Scholar] [CrossRef]
  34. Mohammed, Y.A.; Chen, C.; McPhee, K.; Miller, P.; McVay, K.; Eckhoff, J.; Lamb, P.; Miller, J.; Khan, Q.; Bohannon, B. Yield performance and stability of dry pea and lentil genotypes in semi-arid cereal dominated cropping systems. Field Crop. Res. 2016, 188, 31–40. [Google Scholar] [CrossRef]
  35. Pinthus, M.J. Estimate of genotypic value: A proposed method. Euphytica 1973, 22, 121–123. [Google Scholar] [CrossRef]
  36. Feng, L.; Dai, J.; Tian, L.; Zhang, H.; Li, W.; Dong, H. Review of the technology for high-yielding and efficient cotton cultivation in the northwest inland cotton-growing region of China. Field Crop. Res. 2017, 208, 18–26. [Google Scholar] [CrossRef]
  37. Shuxun, Y. Present situation and development trend of cotton production in China. Eng. Sci. 2013, 4, 9–13. [Google Scholar]
  38. Gollob, H.F. A statistical model which combines features of factor analytic and analysis of variance techniques. Psychometrika 1968, 33, 73–115. [Google Scholar] [CrossRef]
  39. Pacheo, A.; Vargas, M.; Alvarado, G.; Rodriguez, F.; Lopez, M.; Crossa, J.; Burgueno, J. GEA-R (Genotype × Environment Analysis with R for Windows); Version 2.0; International Maize and Wheat Improvment Center: Mexico City, Mexico, 2015. [Google Scholar]
  40. Team, R.C. R: A Language and Environment for Statistical Computing; R Foundation for Statistical Computing: Vienna, Austria, 2013. [Google Scholar]
  41. Blanche, S.B.; Myers, G.O.; Zumba, J.Z.; Caldwell, D.; Hayes, J. Stability comparisons between conventional and near-isogenic transgenic cotton cultivars. J. Cotton Sci. 2006, 10, 59–63. [Google Scholar]
  42. Abou-El-Fittouh, H.; Rawlings, J.O.; Miller, P. Genotype by Environment Interactions in Cotton—Their Nature and Related Environmental Variables 1. Crop Sci. 1969, 9, 377–381. [Google Scholar] [CrossRef]
  43. Zeng, L.; Meredith, J.; Campbell, B.T.; Dever, J.K.; Zhang, J.; Glass, K.M.; Jones, A.S.; Myers, G.O.; Bourland, F.M. Genotype-by-environment interaction effects on lint yield of cotton cultivars across major regions in the US cotton belt. J. Cotton Sci. 2014, 18, 75–84. [Google Scholar]
  44. Laghari, S.; Kandhro, M.M.; Ahmed, H.M.; Sial, M.A.; Shad, M. Genotype X Environment (GxE) interactions in Cotton (Gossypium hirsutum L.) Genotypes. Asian J. Plant Sci. 2003, 2, 480–482. [Google Scholar]
  45. Li, W.; Yan, Z.H.; Wei, Y.M.; Lan, X.J.; Zheng, Y.L. Evaluation of genotype× environment interactions in Chinese spring wheat by the AMMI model, correlation and path analysis. J. Agron. Crop Sci. 2006, 192, 221–227. [Google Scholar] [CrossRef]
  46. Fan, X.-M.; Kang, M.S.; Chen, H.; Zhang, Y.; Tan, J.; Xu, C. Yield stability of maize hybrids evaluated in multi-environment trials in Yunnan, China. Agron. J. 2007, 99, 220–228. [Google Scholar] [CrossRef]
  47. Nzuve, F.; Githiri, S.; Mukunya, D.; Gethi, J. Analysis of genotype x environment interaction for grain yield in maize hybrids. J. Agric. Sci. 2013, 5, 75. [Google Scholar] [CrossRef]
  48. Dwivedi, S.; Nigam, S.; Jambunathan, R.; Sahrawat, K.; Nagabhushanam, G.; Raghunath, K. Effect of genotypes and environments on oil content and oil quality parameters and their correlation in peanut (Arachis hypogaea L.). Peanut Sci. 1993, 20, 84–89. [Google Scholar] [CrossRef]
  49. Gauch, H.G. A simple protocol for AMMI analysis of yield trials. Crop Sci. 2013, 53, 1860–1869. [Google Scholar] [CrossRef]
  50. Baxevanos, D.; Goulas, C.; Tzortzios, S.; Mavromatis, A. Interrelationship among and repeatability of seven stability indices estimated from commercial cotton (Gossypium hirsutum L.) variety evaluation trials in three Mediterranean countries. Euphytica 2008, 161, 371–382. [Google Scholar] [CrossRef]
  51. Yan, W.; Hunt, L.; Sheng, Q.; Szlavnics, Z. Cultivar evaluation and mega-environment investigation based on the GGE biplot. Crop Sci. 2000, 40, 597–605. [Google Scholar] [CrossRef]
  52. Bassi, F.; Sanchez-Garcia, M. Adaptation and Stability Analysis of ICARDA Durum Wheat Elites across 18 Countries. Crop Sci. 2017, 57, 2419–2430. [Google Scholar] [CrossRef]
  53. Bach, S.; Yada, R.Y.; Bizimungu, B.; Sullivan, J.A. Genotype by environment interaction effects on fibre components in potato (Solanum tuberosum L.). Euphytica 2012, 187, 77–86. [Google Scholar] [CrossRef] [Green Version]
  54. Mohamed, N.; Said, A. Stability parameters for comparing bread wheat genotypes under combined heat and drought stress. Egypt. J. Agron. 2014, 36, 123–146. [Google Scholar]
  55. Mosavi, A.A.; Jelodar, N.B.; Kazemitabar, K. Environmental responses and stability analysis for grain yield of some rice genotypes. World Appl. Sci. J. 2013, 21, 105–108. [Google Scholar]
  56. Witcombe, J. Estimates of stability for comparing varieties. Euphytica 1988, 39, 11–18. [Google Scholar] [CrossRef]
  57. Bourland, F.M. Yield and fiber quality of transgenic vs. conventional cotton varieties in the Arkansas cotton variety tests, 1995–2004. In Proceedings of the Beltwide Cotton Conference, New Orleans, LA, USA, 4–7 January 2005; National Cotton Council of America: Memphis, TN, USA, 2005; pp. 1002–1006. [Google Scholar]
  58. Blanche, S.B.; Utomo, H.S.; Wenefrida, I.; Myers, G.O. Genotype× environment interactions of hybrid and varietal rice cultivars for grain yield and milling quality. Crop Sci. 2009, 49, 2011–2018. [Google Scholar] [CrossRef]
  59. Li, Z.; Coffey, L.; Garfin, J.; Miller, N.D.; White, M.R.; Spalding, E.P.; De Leon, N.; Kaeppler, S.M.; Schnable, P.S.; Springer, N.M. Genotype-by-environment interactions affecting heterosis in maize. PLoS ONE 2018, 13, e0191321. [Google Scholar] [CrossRef]
  60. Nyombayire, A.; Derera, J.; Sibiya, J.; Ngaboyisonga, C. Genotype × Environment Interaction and Stability Analysis for Gran Yield of Diallel Cross Maize Hybrids Across Tropical Medium and Highland Ecologies. J. Plant Sci. 2018, 6, 101–106. [Google Scholar]
Figure 1. Mean performance and stability of 41 genotypes at six environments for boll weight (BW). (a) Represents the mean of BW (g per boll) on the X-axis and the first interaction principal component (IPC1) scores of GEI on the Y-axis. Blue and red colored numbers inside the biplot show genotypes and environments, respectively. (b) Shows the stability analysis of BW, coefficient of variability (X-axis) and coefficient of regression (Y-axis). All numbers inside the biplot show genotypes. See Table 1 and Table 2 for code description of genotypes and environments, respectively.
Agronomy 09 00516 g001
Figure 2. Mean performance and stability of 41 genotypes at six environments for seed cotton yield (SCY). (a) Represents the mean of SCY (kg/hec) on the X-axis and the first interaction principal component (IPC1) scores of GEI on the Y-axis. Blue and red colored numbers inside the biplot show genotypes and environments, respectively. (b) Shows stability analysis of SCY, coefficient of variability (X-axis) and coefficient of regression (Y-axis). All numbers inside the biplot show genotypes. See Table 1 and Table 2 for code description of genotypes and environments, respectively.
Agronomy 09 00516 g002
Figure 3. Mean performance and stability of 41genotypes at six environments for lint yield (LY). (a) Represents the mean of LY (kg/hec) on the X-axis and first interaction principal component (IPC1) scores of GEI on the Y-axis. Blue and red colored numbers inside the biplot show genotypes and environments, respectively. (b) Shows stability analysis of LY, coefficient of variability (X-axis) and coefficient of regression (Y-axis). All numbers inside the biplot show genotypes. See Table 1 and Table 2 for code description of genotypes and environments, respectively.
Agronomy 09 00516 g003
Figure 4. Mean performance and stability of 41 genotypes in six environments for fiber upper half mean length (FUHML). (a) Represents the mean of FUHML (mm) on the X-axis and first interaction principal component (IPC1) scores of GEI on the Y-axis. Blue and red colored numbers inside the biplot show genotypes and environments, respectively. (b) Shows stability analysis of FUHML, coefficient of variability (X-axis) and coefficient of regression (Y-axis). All numbers inside the biplot show genotypes. See Table 1 and Table 2 for code description of genotypes and environments, respectively.
Agronomy 09 00516 g004
Figure 5. Mean performance and stability of 41 genotypes in six environments for fiber strength (FS). (a) Represents the mean of FS (cN/tex) on the X-axis and first interaction principal component (IPC1) scores of GEI on the Y-axis. Blue and red colored numbers inside the biplot show genotypes and environments, respectively. (b) Shows stability analysis of FS, coefficient of variability (X-axis) and coefficient of regression (Y-axis). All numbers inside the biplot show genotypes. See Table 1 and Table 2 for code description of genotypes and environments, respectively.
Agronomy 09 00516 g005
Table 1. Name and code of 41 cotton genotypes evaluated in this study.
GenotypesCodesGenotypesCodes
Zhong901-19 × GC-81L28-2 × Z98-1522
L28-2 × GC-82SJ48-1 × Z98-1523
SJ48-1 × GC-83ZB-1 × Z98-1524
ZB-1 × GC-84K8-1 × Z98-1525
K8-1 × GC-85Zhong901-19 × RP24-1026
Zhong901-19 × 851-26L28-2 × RP24-1027
L28-2 × 851-27SJ48-1 × RP24-1028
SJ48-1 × 851-28ZB-1 × RP24-1029
ZB-1 × 851-29K8-1 × RP24-1030
K8-1 × 851-210Zhong901-1931
Zhong901-19 × A2-1011L28-232
L28-2 × A2-1012SJ48-133
SJ48-1 × A2-1013ZB-134
ZB-1 × A2-1014K8-135
K8-1 × A2-1015GC-836
Zhong901-19 × DT-816851-237
L28-2 × DT-817A2-1038
SJ48-1 × DT-818DT-839
ZB-1 × DT-819Z98-1540
K8-1 × DT-820RP24-1041
Zhong901-19 × Z98-1521
Table 2. Description of seasonal environment variables (May to October) of experimental locations.
Trial CodesField LocationsMT (°C)MMT (°C)MmT (°C)TP (mm)TSS (hours)
12016Anyang23.1629.2717.94504.71130.9
22017Anyang23.4929.7618.01290.51201.4
32016Alar2128.9613.9297.41609.2
42017Alar20.4628.9813.0775.91563.1
52016Wuwei24.128.0420.921426.2882.3
62017Wuwei24.3128.3421.02734.8929.4
Here in Table 2, MT: mean of daily temperature; MMT: mean of daily maximum temperature; MmT: mean of daily minimum temperature; TP: total precipitation; TSS: total sunshine.
Table 3. Analysis of variance and partitioning of G × E interaction by AMMI model for yield traits.
SourceDFBNBWSCYLYLP
E5184,544 *** (97.6%)448.7 *** (81.5%)705,895,298 *** (88%)99,554,257 *** (81.9%)5946.1 *** (67.5%)
G401737 *** (0.91%)49.8 *** (9%)41,447,190 *** (5.2%)10,953,851 *** (9%)1754.6 *** (19.9%)
G × E2002810 *** (1.48)54.4 *** (9.8%)54,981,190 *** (6.9%)11,053,169 *** (9.1%)1108.1 *** (12.6%)
IPC1442202 *** (78.4%)39.2 *** (72%)34,223,281 *** (62.2%)7,228,074 *** (65.4)852.6 *** (76.5%)
IPC242335 *** (11.9%)9.3 *** (17%)12,359,426 *** (22.5%)2,305,268 *** (20.9%)154.9 *** (13.9)
IPC340239 *** (8.5%)3.5 ** (6.4%)5,653,926 *** (10.3%)941,370.6 *** (8.5%)45.1 ns (4.1%)
Residual4921211.524.223,658,7853,981,410429.14933
Here in Table 3, BN: number of bolls; BW: boll weight; SCY: seed cotton yield; LY: lint yield; LP: lint percentage; E: environments; G: genotypes; ***, **, *: significant at 0.001, 0.01, and 0.05 probability level, respectively. ns: non-significant.
Table 4. Analysis of variance and partitioning of the G × E interaction by the AMMI model for fiber quality traits.
SourceDFFUHMLFEFUFSMIC
E5353.7 *** (23.6%)2.11 *** (37.3%)639.9 *** (45.7%)1178.6 *** (40.6%)62.1 *** (47.4%)
G40844.3 *** (56.3%)1.87 *** (33.2%)395.8 *** (28.2%)1314.4 *** (45.2%)36 *** (27.5%)
G × E200301.7 *** (20.1%)1.67 ns (29.5%)365.8 *** (26%)412.3 *** (14.2%)32.9 *** (25%)
IPC144132.7 *** (44%)0.78 *** (47%)185.2 *** (50.6%)140.1 *** (34%)19.6 *** (59.6%)
IPC24266 *** (22%)0.48 * (29%)76.1 ** (20.8%116.4 *** (28.2%)5.5 *** (16.6%)
IPC34048 ** (16%)0.17 ns (10%)59.8 * (16.3%)79.7 ns (19.3%)5 *** (15%)
Residual492357.33.94510.40712.823.4
Here in Table 4, FUHML: fiber upper half mean length; FE: fiber elongation; FU: fiber uniformity; FS: fiber strength; MIC: microniare; E: environments; G: genotypes; ***, **, *: significant at 0.001, 0.01, and 0.05 probability levels, respectively. ns: non-significant.

