Article

Planting Density Induced Changes in Cotton Biomass Yield, Fiber Quality, and Phosphorus Distribution under Beta Growth Model

1
Key Laboratory of Plant Genetics and Breeding, College of Agriculture, Guangxi University, Nanning, Guangxi 530005, China
2
Queensland Alliance for Agriculture and Food Innovation, Centre for Plant Science, The University of Queensland, Toowoomba, QLD 4350, Australia
3
Faculty of Science, School of Life and Environmental Sciences, Sydney Institute of Agriculture, Plant Breeding Institute, The University of Sydney, Sydney, NSW 2006, Australia
4
Institute of Nuclear Agricultural Sciences, College of Agriculture and Biotechnology, Zhejiang University, Hangzhou 310058, China
*
Author to whom correspondence should be addressed.
Agronomy 2019, 9(9), 500; https://doi.org/10.3390/agronomy9090500
Submission received: 17 July 2019 / Revised: 27 August 2019 / Accepted: 28 August 2019 / Published: 30 August 2019
(This article belongs to the Section Innovative Cropping Systems)

Abstract

:
High input costs combined with multiple management and material inputs have threatened cotton productivity. We hypothesize that this problem can be addressed by a single fertilization at flowering with late sowing in a moderately populated plant stand. Field experiments were conducted to evaluate the cotton biomass accumulation, phosphorus dynamics, and fiber quality under three planting densities (low, 3 × 10⁴; moderate, 6 × 10⁴; and dense, 9 × 10⁴ ha−1) and two cultivars (Zhongmian-16 and J-4B). High planting density had 6.2 and 12.6% larger stems and fruiting nodes m−2, while low density produced a 37.5 and 59.4% maximum height node ratio. Moderate density produced 26.4–15.5%, 24.7–12.6%, and 10.5–13.6% higher biomass accumulation rate at the peak bloom, boll set, and plant removal stages over low and high density in both years, respectively. J-4B produced a higher reproductive organs biomass yield when compared with Zhongmian-16 in both years. This higher biomass formation was due to both the higher average (0.8 VT kg·ha−1·d−1) and maximum (1.0 VM kg·ha−1·d−1) reproductive organ phosphorus uptake, respectively. Plants with low density had 5.3–18.5%, 9.5–15%, and 7.8–12.8% greater length, strength, and micronaire values over moderate and dense plants, respectively. Conclusively, moderate density with J-4B is a promising option for improved biomass, phosphorus acquisition, and fiber quality under a short season.

1. Introduction

An expanding population requires global efforts to increase crop production, especially those fulfilling food and clothing needs. On the other hand, high input costs coupled with multiple management and material inputs have threatened cotton productivity. To counter the challenges of high production costs without compromising yield, a new planting model (e.g. moderate planting density, one time low nitrogen fertilization at the first flowering stage under late planted cotton) is proposed. The recommended planting densities in China are 22.7 plants m−2 in the northwest [1], 5.3–7.5 plant m−2 in the Yellow River Valley [2], 36 plants m−2 in Xinjiang [3], and 3–9 plants m−2 in the Yangtze River Valley [4,5]. Management strategies such as the application of mepiquat chloride [5], nitrogen [6], water availability [7], planting date, and planting density [8] are factors that induce changes in dry matter formation and affect reproductive organ biomass accumulation.
Biomass distribution in cotton organs during the crop cycle are important determinants of final yield. In the early phases of cotton growth, greater partitioning of foliar tissues enables access to light, which promotes better establishment and provides the basis for fiber quantity and quality later in the season. Similarly, during later growth phases, an increase in the assimilate transport to the reproductive structures ensures better crop yield. Planting density coupled with the cultivar are considered the key drivers for cotton production [8,9]. Due to its indeterminate growth habit, a cotton plant may invest heavily in vegetative biomass under optimum growth conditions. An over-investment of the assimilate into the vegetative or reproductive organs in cotton plants could stimulate the abscission of leaves or fruits, respectively [10,11]. The aboveground biomass of a cotton plant at maturity is often less than the total biomass produced as the plant may shed old leaves and young fruits [8]. Remobilization of biomass to reproductive structure may further reduce the total biomass of vegetative organs during late reproductive growth. Assimilate allocation, and thus the growth rate of a plant organ, is controlled by various environmental and physiological factors [12]. Generally, dry biomass formation and partitioning into organs is measured primarily during certain phenological phases of crops. Beta growth function, in contrast provides an opportunity to estimate biomass production and thus assimilate allocation in the plant organ over a short period of time [13]. Beta growth function consists of three parameters: maximum dry matter, and the time at which the maximum dry matter and maximum growth rate are achieved. These parameters are associated with biomass production under different climatic conditions, and can compute the partitioning index by comparing the organ growth rates. This function is useful for estimating dry matter allocation if loss of the accumulated biomass is negligible [14].
Fiber strength, length, fineness, elasticity, short fiber index, uniformity index, spinning consistency color grade, and reflectance are fiber quality indicators [15]. These characteristics are negatively affected by genetic factors as well as environmental factors and poor management practices during flowering and the boll formation stage [3,16]. In addition, environmental conditions such as low temperature and light can also impact boll development and the fiber quality of cotton crops [17]. Fiber quality is strongly affected by growth environments (e.g., plant density, irrigation, fertilization, weather events) and there is limited understanding of the relationship between cultivars, fiber quality, and planting date [3,18]. Late planted cotton produces superior quality fiber (e.g. increased elongation and low micronaire), but low fiber length and strength [19,20,21].
In cotton production systems, soil phosphorus (P) unavailability is considered a major limiting factor to lint yield formation due to the sustained capacity of leaf photosynthetic characteristics [22]. Despite high P application rates, low solubility, low mobility, and high fixation by the soil matrix limits its availability to the plants [23]. Low effective phosphorus availability in the soil and a shortage of water are important factors that restrict dry matter accumulation and cotton yield improvement [24]. Deficiency in soil phosphorus can decrease biomass accumulation and yield by affecting crop growth, leaf photosynthesis, and chlorophyll fluorescence [25]. Phosphorus can also facilitate crop growth, increase biomass, and greatly improve the ratio of distribution to reproductive organs [26]. Soil P deficiency can restrict cotton branch and leaf growth as well as inhibit photosynthetic activities and the accumulation and distribution of photosynthetic products, which results in a yield penalty [22,25]. Moreover, it can also inhibit photosystem II (PSII) by increasing the initial fluorescence (F0) and decreasing both the maximal fluorescence (Fm) and the maximum quantum efficiency of PSII photochemistry (Fv/Fm), leading to a lower efficiency in energy transfer to PSII reaction centers [25]. In the future, higher energy costs and scarce nutrient resources will result in rising fertilizer prices, which in turn will increase production costs. Hence, it is essential to understand P acquisition and distribution at different developmental stages of cotton in changing the planting density.
Planting densities also influence crop growth and yield by changing the light interception, photosynthetic capacity, nutrient uptake, pattern of plant establishment, and the enzyme activity of assimilate metabolism at different positions of the canopy [2,8,27]. High planting density can increase agronomic nitrogen use efficiency and nitrogen recovery efficiency, but results in poor boll load, delayed late-season leaf senescence, and reduces malondialdehyde [28]. Therefore, the management of planting density can modify options to achieve potential benefits from ecosystem services. Studies regarding cotton growth and lint yield in response to diverse population are common [5,8,29]; however, the effect of planting densities on phosphorus dynamics, biomass partitioning, and fiber quality during key reproductive stages under late planted moderately populated crops with one time low nitrogen fertilization at the first flowering stage remains elusive. This study aimed to explore how growth and nutrient (phosphorus) dynamics influence biomass partitioning and fiber quality at critical reproductive stages in cotton crops under varying planting density.

2. Materials and Methods

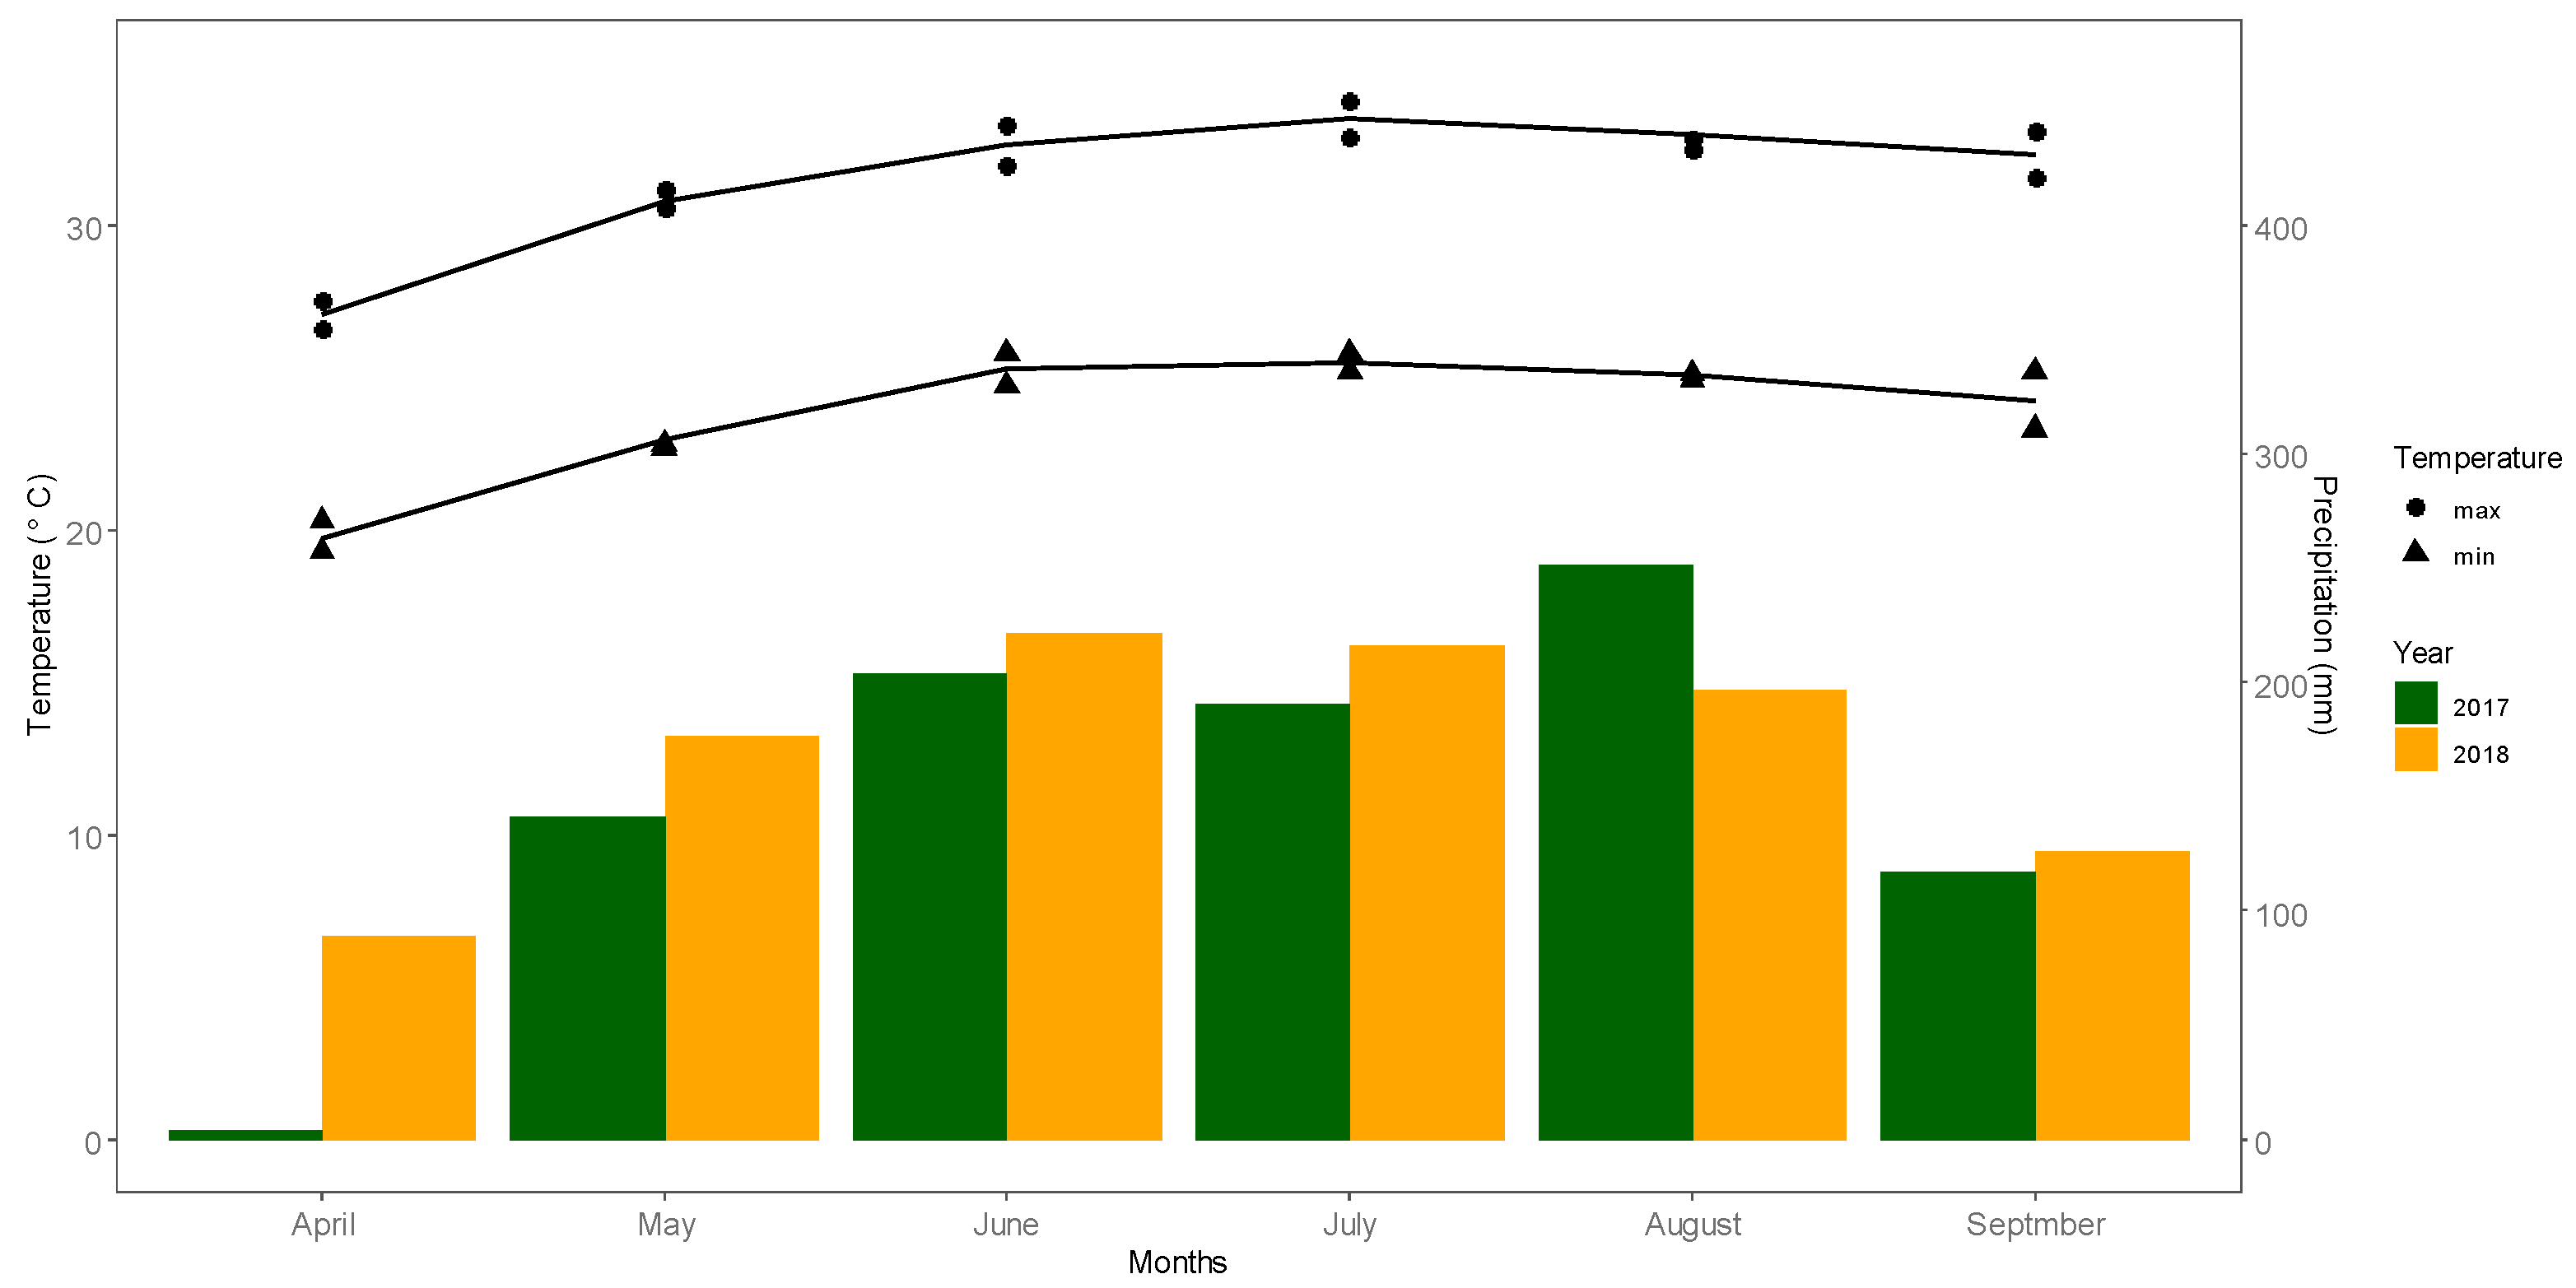
2.1. Summary of Experimental Site and Design

A two-year (2017 and 2018) field experiment was conducted at the experimental farm of Guangxi University, Nanning, China. Zhongmian-16 (Zhongmiansuo-16) and J-4B (Gossypium hirsutum) were used as the plant materials. The soil of the experimental site was clay loam with a pH 6.5, organic matter (23.37 mg kg−1), available nitrogen (53.3 g kg−1), phosphorus (77.6 g kg−1), and potassium (50.5 g kg−1). The experiments were a two-way factorial, split plot arrangement with four replications. The two factors evaluated were three density levels D1, D2, and D3 (3, 6, and 9 plants/m2) with two cultivars (Zhongmian-16 and J-4B). The cultivars were assigned to the main plots and plant densities were assigned to sub-plots. The mean monthly rainfall and air temperature data were also collected (Figure 1).

2.2. Agronomic Management

Experimental plots were prepared by tractor with the required length and width. All plots were covered with plastic film to conserve moisture and suppress weed emergence. After field preparation, seeds were sown on 5 June in both the 2017 and 2018 growing seasons. Each plot was thinned 20 days after emergence to achieve the required planting density. Nitrogen at 190 kg N ha−1, phosphorus at 54 kg P ha−1, and potassium at 180 kg K ha−1 were applied during the first bloom stage in the form of urea (46.3% N), superphosphate (18% P2O5), and potassium chloride (59% K2O) in both years, respectively. Crop management practices were undertaken according to crop demand to ensure that nutrients, light, and water were not limiting in both years. Plant growth regulator (Ethephon) was sprayed to enhance lately formed boll opening and regulate the vegetative growth.

2.3. Data Collection

Cotton biomass and phosphorus rates were determined at five developmental stages (squaring, first bloom, peak bloom, boll opening, and plants) and removed from consecutively selected plants in each treatment from four replicates. In addition, plant growth attributes and fiber quality characteristics were also assessed.

2.4. Cotton Plant Growth Characteristics

Ten plants per treatment were randomly tagged to measure plant growth characteristics. Plant height was determined from the ground level to the top via a specially designed ruler. Node numbers m−2 were counted from ten randomly chosen plants. The height to node ratio was assessed by dividing the plant height by the number of nodes.

2.5. Biomass Partitioning

Five plants were selected at five developmental stages from each treatment of four replicates in both years. These plants were carefully uprooted and the roots washed with clean water. Plants were divided into vegetative and reproductive structures and enveloped separately. Dry weights of these materials were assessed after drying in an electric fan-assisted at 105 °C for 30 min and at 80 °C for 48 h until a constant weight was obtained

2.6. Measurements of Fiber Quality Parameters

Cotton fiber quality traits included: fiber length (Len, mm), fiber strength (FS, cNtex−1), fiber uniformity (FU, %), and micronaire (MI). Fiber length was assessed by the water washing method using a Y-146 cotton fiber photometer (Taicang Electron Apparatus Co. Ltd., Suzhou, China). An Uster High Volume Instrument (HVI) 1000 Classing (Uster Technologies AG, Uster, Switzerland) was used to measure the cotton fiber strength and micronaire of the harvested bolls. Fiber uniformity (%) and elongation (%) was measured by the Supervision, Inspection, and Test Center of Fiber Quality in Anyang, Henan Province.

2.7. Phosphorus Acquisition

Dried plant samples were ground using a Wiley mill and screened through a 0.5 mm sieve. Total phosphorus concentration was assessed using the micro-Kjeldahl method [30]. A 0.5 g sample was digested for about 1 h in concentrated sulfuric acid plus 4 mL of hydrogen peroxide. The solution was cooled down and transferred to a 10 mL tube. Phosphorus content was measured colorimetrically using a spectrophotometer (Shanghai Precision and Scientific Instrument Co. Ltd. Production). The concentration of phosphorus was shown on a dry weight basis. P acquisition was determined as the product of concentration and dry weight. Cotton plant phosphorus acquisition was modeled by a logistic regression model [31] as follows:
Y = K 1 + a e b t
In Equation (1), t (d) indicate the days after emergence (DAE), Y represents phosphorus at time t, K is the maximum phosphorus, and a, b are the constants to be determined.
t 1 = 1 b ln ( 2 + 3 a )
t 2 = 1 b ln ( 2 3 a )
t m = ln a b
V m = bK 4
V t = Y 2 Y 1 t 2 t 1
where Vm (g d−1) is the highest phosphorus acquisition rate and tm (d) is the largest phosphorus acquisition period, which begins at time t1 and ends at t2. Y1 and Y2 are phosphorus at t1 and t2; Vt is the average phosphorus accumulation (i.e., t1–t2). The purpose of this logistic function was to assess the maximum dry matter, maximum phosphorus accumulation, and time to which maximum dry matter and maximum growth rate are achieved.

2.8. Statistical Analysis

Data were analyzed using Statistics 8.1 software to evaluate the planting density and cultivar effects on cotton growth, biomass accumulation, phosphorus acquisition, and fiber quality. Planting densities and cultivars were taken as fixed effects and cropping season as the repetitive measured factor with a fixed effect. Similarly, the interaction was taken as the fixed effects and treatment × replication interaction was taken as the random effect. The mean differences among the treatments were calculated using the least significant difference test at the 5% probability level.

3. Results

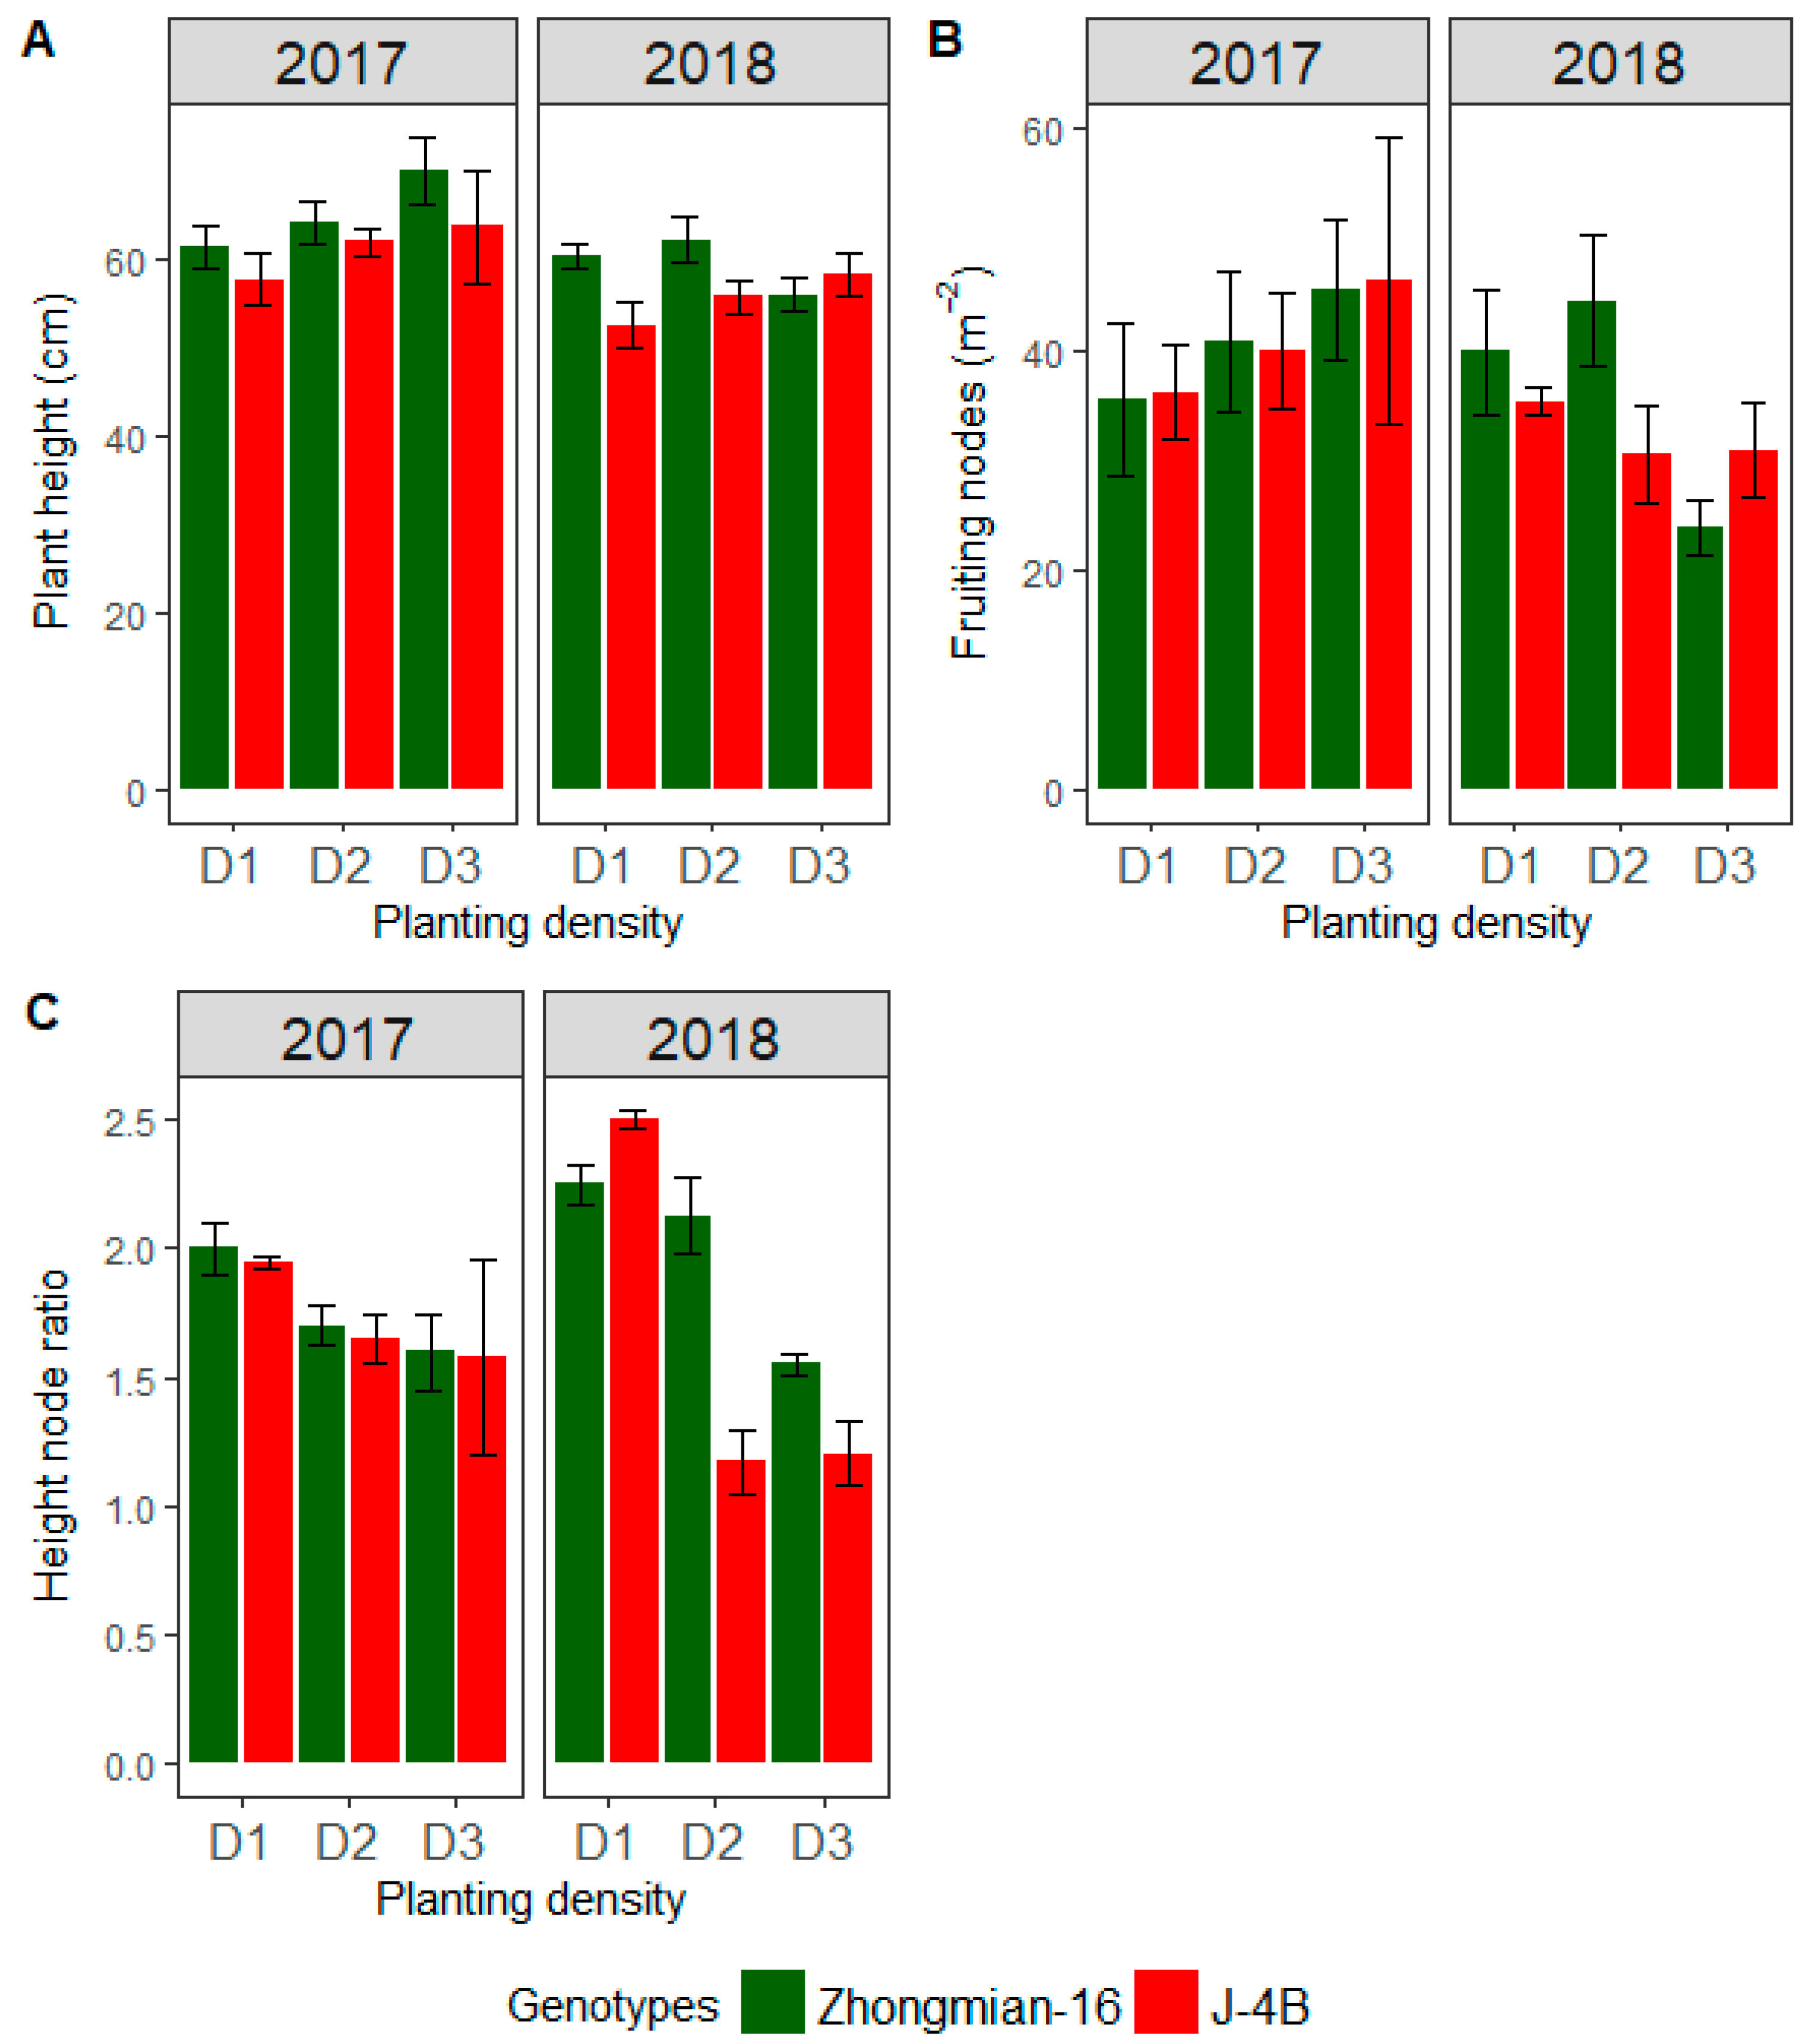
3.1. Cotton Plant Growth Attributes
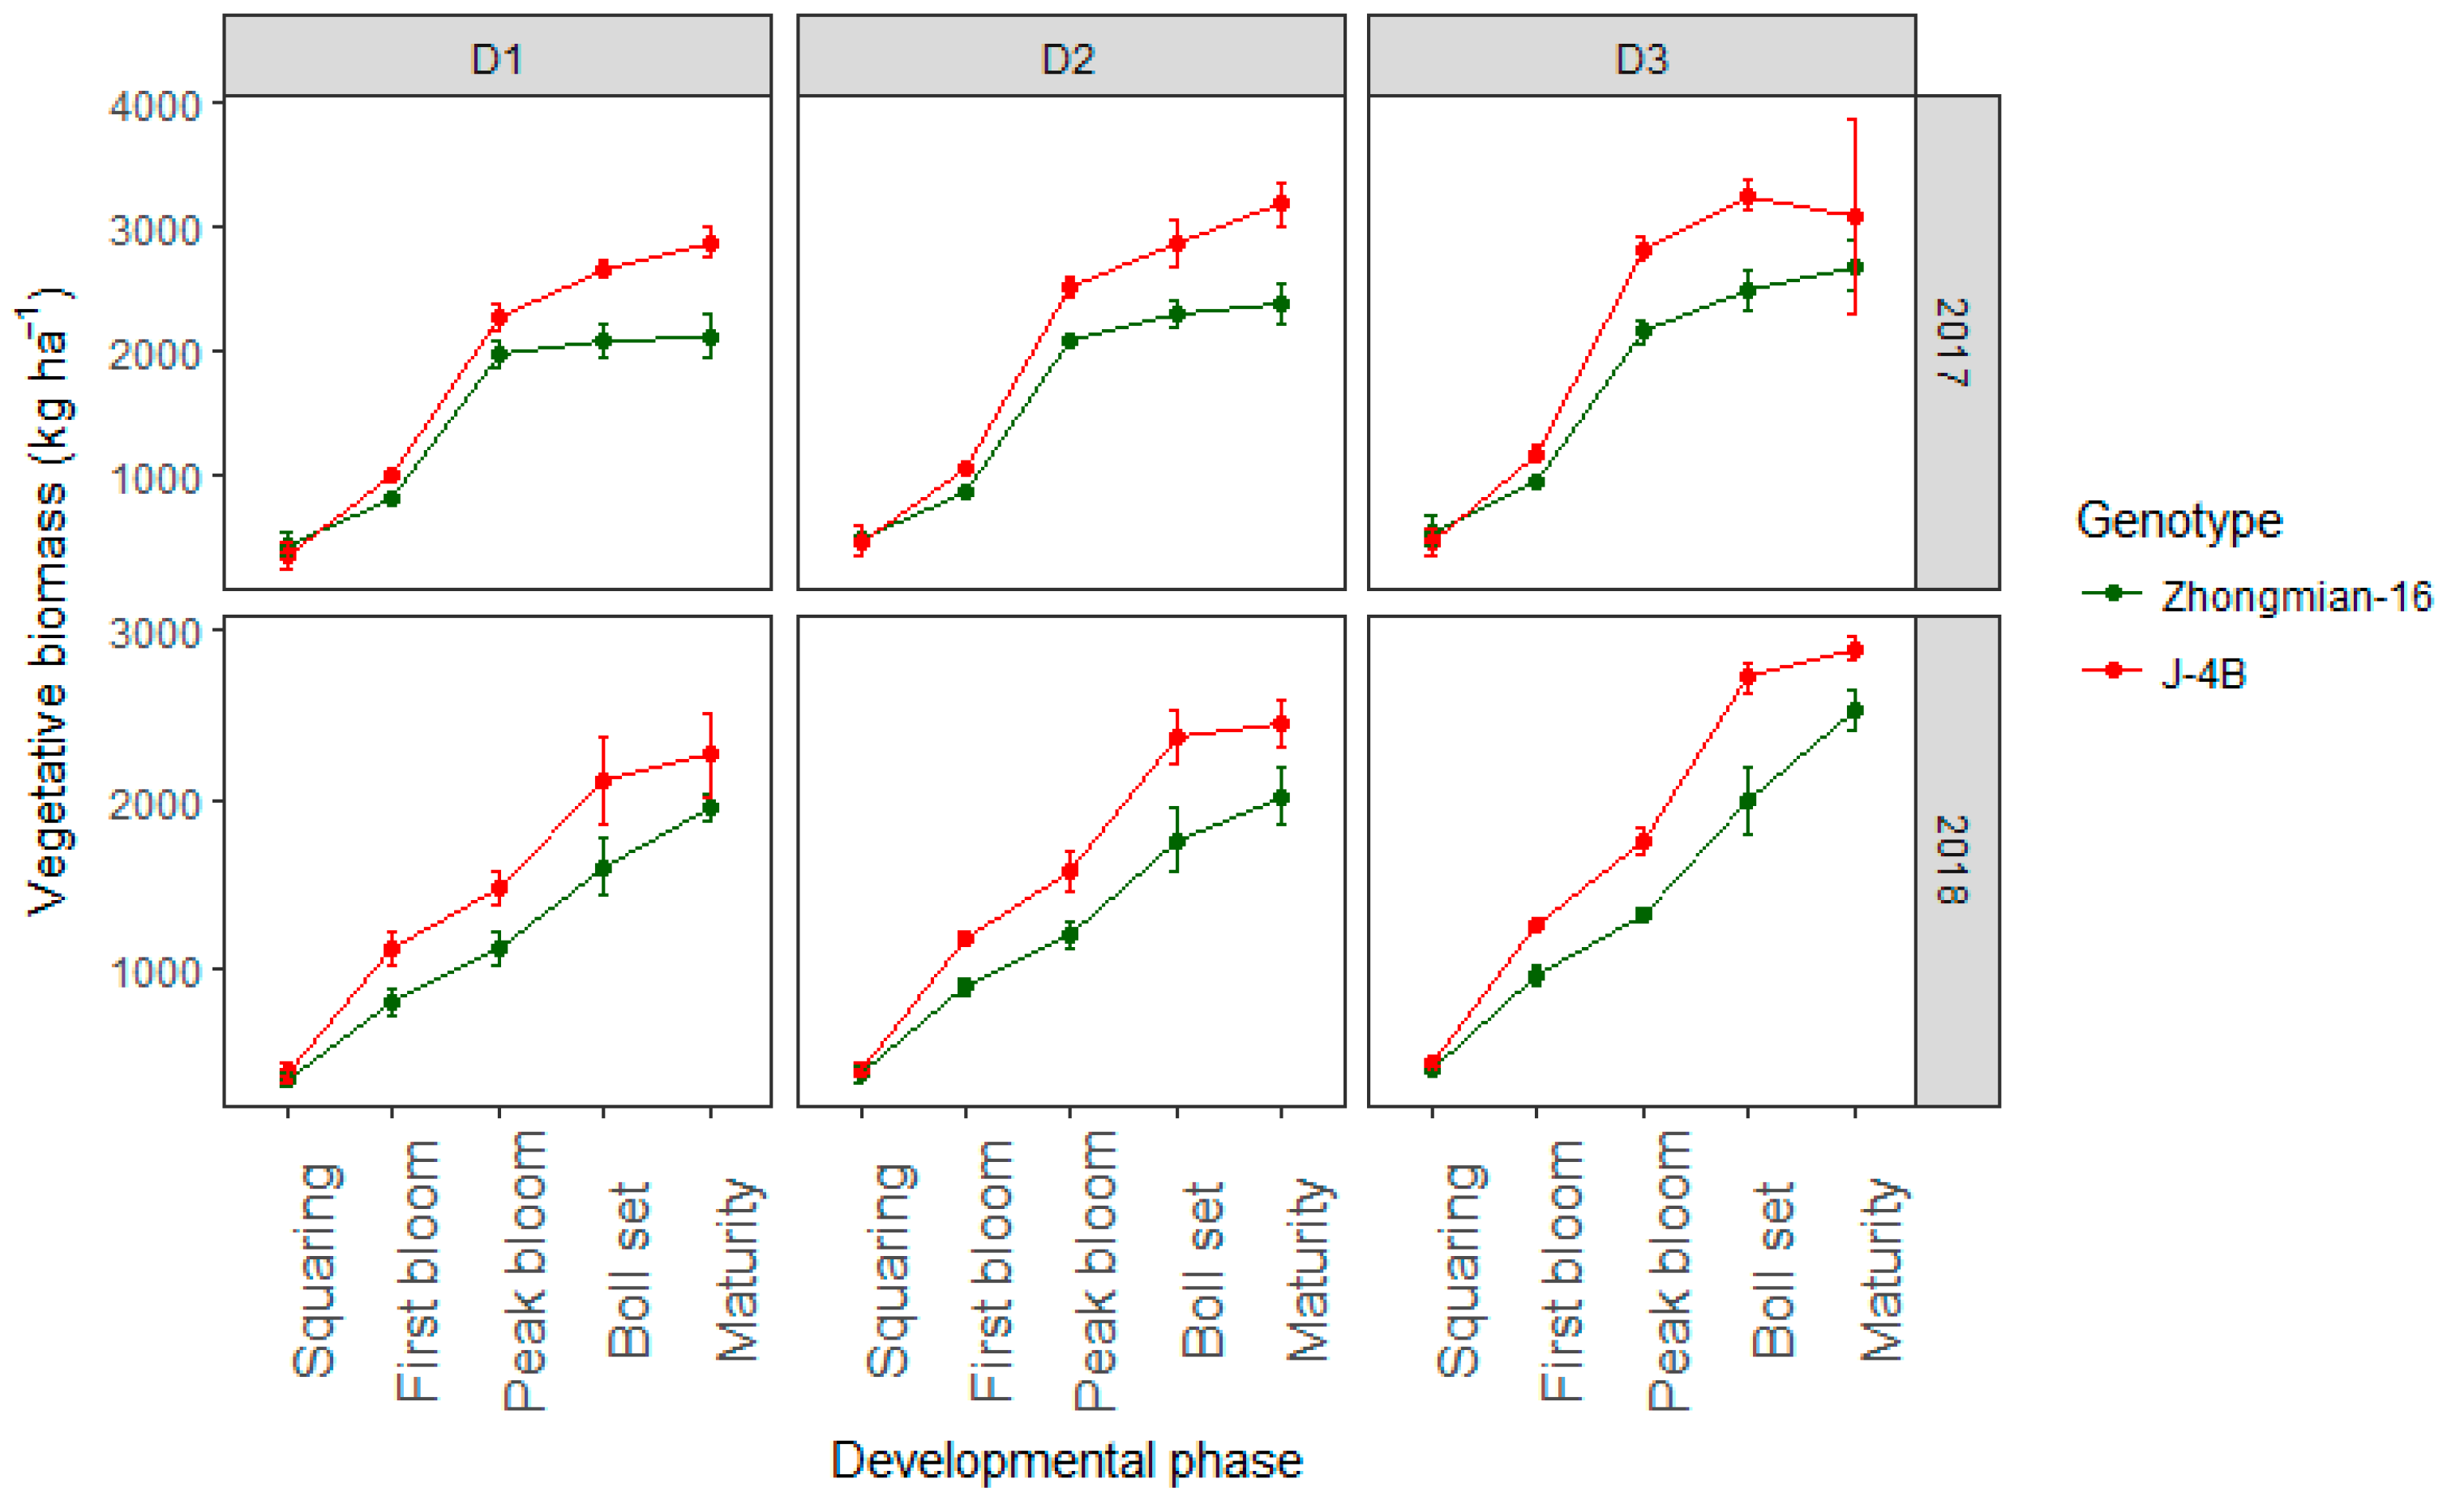
Cotton plant height, fruiting nodes numbers m−2, and height to node ratio were significantly affected by density, cultivar, and year (p < 0.05). In addition, the interaction of density × variety on plant height, fruiting nodes numbers m−2, and height to node ratio were also significant whilst year × density, year × variety, and year × density × variety interactions were nonsignificant (Table 1). Plant height, fruiting nodes density m−2, and height to node ratio were considerably influenced by planting densities and cultivars in both years, respectively (Figure 2A–C). Within the planting densities, densely populated crops produced taller stems (Figure 2A) and a higher number of fruiting nodes m−2 (Figure 2B) than the low and moderate density plants in both years. However, the height to node ratio (Figure 2C) was significantly decreased under high density crops than in low and moderately populated crops in both cropping seasons. Across the cultivars, J-4B had more fruiting nodes (Figure 2E) and height to node ratio (Figure 2F) than the Zhongmian-16 cultivar.

3.2. Biomass Yield

Cotton plant biomass production was significantly affected by planting density, cultivar, and year factor at squaring, first bloom, peak bloom, and plant removal, while the year effect at first bloom and peak bloom stage remained insignificant (p < 0.05, Table 1). In addition, no significant interactions of density × variety, year × density, year × variety, and year × density × variety on the total plant biomass accumulation were observed. Planting densities, cultivar, and year strongly influenced the total plant biomass accumulation rate in both years, however the biomass yield was lower in 2017 over the 2018 growing season (Figure 3). Plant biomass production increased with plant development, although differences existed among the treatments. Plants under high density attained a higher biomass yield during all growth phases when compared with low and moderate crops in both years. In 2017, J-4B had a higher total biomass than Zhongmian-16 only at the squaring stage, although biomass accumulation was significant throughout the crop growth in 2018 (e.g., 29.2%, 28.6%, 13.3%, and 16.2% at first bloom, peak bloom, boll set, and plant removal stage, respectively) (Figure 3).
Vegetative structure biomass yield was significantly affected by planting density, cultivar, and year factor during all reproductive stages. There was no interactive effect of density, variety, and year on the total plant biomass accumulation (Table 1). Planting density, cultivar, and year factor induced significant changes in vegetative organ biomass production at various growth stages (Figure 4). Vegetative organ biomass yield was increased as the plant transitioned from one stage to another, with changes between the treatments during both years. Plants under high density produced more vegetative organ biomass yield over low and moderate density crops in both years. Across the cultivars, J-4B had a 16.6%, 14.3%, 19.5%, and 25.5% higher biomass formation rate at first bloom, peak bloom, boll set, and plant removal stage, respectively, over Zhongmian-16 in 2017 (Figure 4). Similarly, in 2018, J-4B had a 1193, 1629, 2296, and 2537 kg ha−1 higher biomass accumulation at first bloom, peak bloom, boll set, and plant removal stage, respectively.
Reproductive structure biomass yield was substantially affected by planting density, cultivar, and year at various growth phases, but the effect of density and cultivar remained nonsignificant. The interactions of density × variety, year × density, year × variety, and year × density × variety on the total plant biomass accumulation were nonsignificant. The interaction of density × variety was significant at the first bloom stage (Table 1). Planting density, cultivar, and year significantly impacted on the reproductive organ biomass formation (Figure 5). Across both years, the biomass accumulation rate was lower in 2018 when compared with 2017. Cotton plant reproductive biomass was increased with plant development in both years. In both years, no significant changes were observed for reproductive organ biomass accumulation at the squaring and first bloom stage. However, the differences between the treatments were clear at peak bloom, boll set, and the plant removal stage in both years. Moderate density produced a 26.4–15.5%, 24.7–12.6%, and 10.5–13.6% higher biomass accumulation rate at the peak bloom, boll set, and plant removal stage, respectively, over low and high density crops in both years (Figure 5). At the squaring and first bloom stage, the reproductive organ biomass accumulation rate remained unaffected under the changing planting density in both years, respectively. In 2017, J-4B had a 59.8%, 40.5%, 29.5%, and 18.6% higher reproductive organ biomass yield at the first boom, peak bloom, boll set, and plant removal stage, respectively, and a 51.6%, 27.2%, 19.4% greater biomass yield at the first bloom, boll set, and plant removal stage, respectively, over the Zhongmian-16 cultivar in 2018.

3.3. Fiber Quality

Planting densities induced significant changes in the fiber quality parameters in both years (Table 2). Significant interactions of planting density × cultivar on fiber, length, and strength was observed (p < 0.05). The planting year had no significant main or interactive effect on the fiber quality traits. An increment in plant density significantly decreased the fiber length (mm), strength (cN/tex), and micronaire value. Plants under low density had greater length, strength. and micronaire when compared with the high planting density. Planting density had no significant effect on elongation (%) and uniformity index (%) in both years. Across the cultivars, Zhongmian-16 had better fiber strength compared to J-4B; but the fiber length, micronaire elongation (%), and uniformity index remained unaffected in 2017. The interaction between density and cultivar was significant for the fiber length, strength, and micronaire in 2017. Zhongmian-16 under low density produced better length, strength, and micronaire followed by the other counterparts. Under high density plants, the uniformity index increased considerably over low and moderate crops, but the strength and elongation (%) remained unaffected in the 2018 growing season.

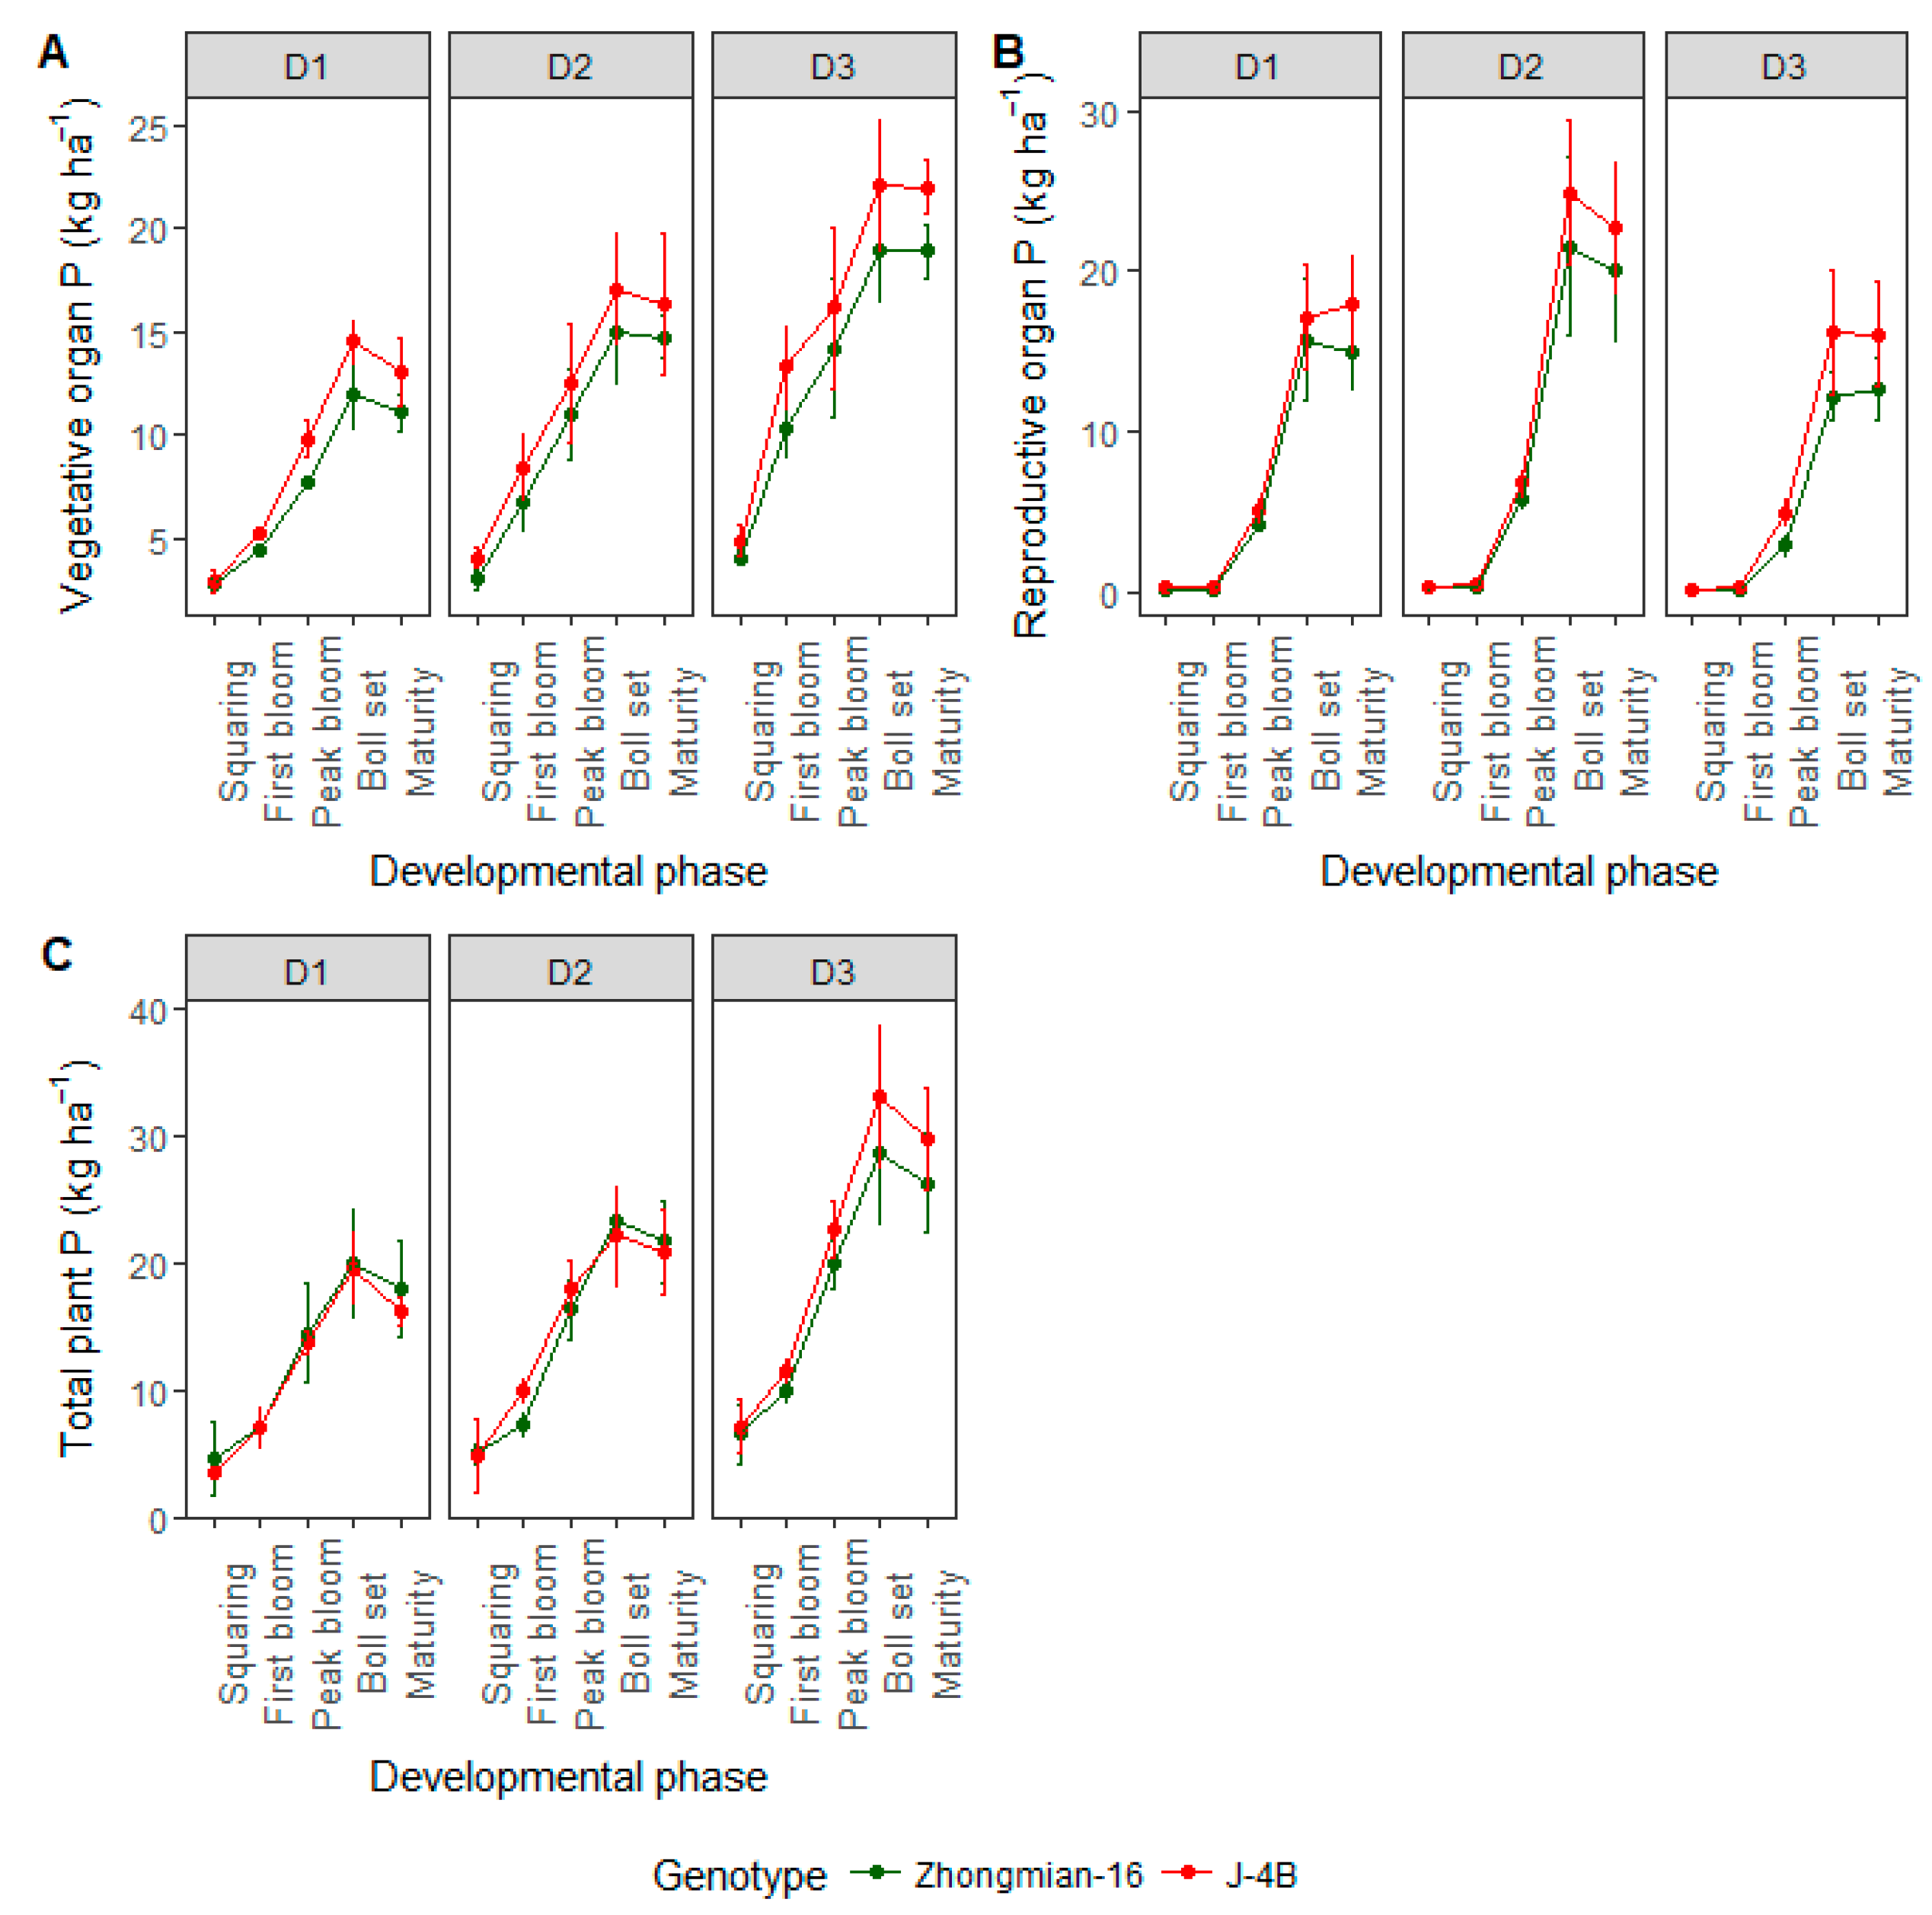
3.4. Phosphorus Accumulation

Both cultivar and planting density considerably influenced cotton plant phosphorus (P) accumulation at different growth stages (Figure 6). Significant changes in P acquisition were noted under different planting densities. Cotton plant total P accumulation rates reached its peak during the boll opening stage, but remained stable at the plant removal stage under densely populated plants compared with moderate and low density. J-4B had a higher P accumulation when compared with the Zhongmian-16 cultivar. With increasing planting density, cotton plant vegetative organ P accumulation was significantly increased, and the P uptake of Zhongmian-16 was lower than that of the J-4B cultivar (Figure 6). The differences among the treatments were larger when the plant transitioned from one stage to another. Similar to total plant P accumulation, high density resulted in greater vegetative P accumulation rates when compared with low and moderate density. Across cultivars, the P accumulated rate for Zhongmian-16 slowed more than that of J-4B over time.
P acquisition in reproductive structures was increased in the early growth stages and then decreased later in the season. The rate of P accumulation remained similar at the squaring and first bloom stage across the treatments. As the plant growth proceeded toward maturity, the differences between the treatments became clearer. Moderate planting density had a higher reproductive organ P uptake at all developmental phases than those of low and high density crops. Between the cultivars, J-4B accumulated more reproductive organ P at the first bloom, peak bloom, boll opening, and plant removal stages over Zhongmian-16.

3.5. Simulation of Phosphorus Uptake

Simulation of phosphorus (p) acquisition with days after emergence was assessed using Equation (1). The determination of the coefficient was significant when p values were <0.005 with changes in the equation coefficients among the treatments (Table 3). Cotton plant p accumulation was calculated using Equations (2) and (4), which show the start and termination day of cotton plant P acquisition under different planting densities and cultivars, as shown in Table 4. Crops under high density conditions had a higher average and maximum P uptake rate followed by moderate and low density crops, respectively. Furthermore, the J-4B cultivar coupled with higher density (D3V2) had a fast P accumulation rate at 78 days after emergence (DAE) and terminated at 98 DAE followed by D2V2 > D2V1 > D1V2 > D1V1, respectively. J-4B with high density showed both a higher average (1.9 VM kg ha−1 d−1), and maximum (2.2 VM kg ha−1 d−1) total plant P accumulation rate when compared with other counterparts (Table 4). Zhongmian-16 with low density resulted in a lower average and maximum rate of P accumulation during the whole crop cycle.
Moreover, planting densities induced changes in the vegetative organ P accumulation progress during the whole growth season. The high vegetative organ P accumulation period for D3V2 treatment was initiated at 57 DAE and terminated at 98 DAE. The J-4B cultivar in combination with high density had both the highest average (0.8 VT kg ha−1 d−1) and maximum (1.0 VM kg ha−1 d−1) P acquisition rate followed by D2V2 > D2V1 > D1V2 > D1V1, respectively.
Similarly, the reproductive organ P accumulation rate was considerably influenced by the changes in planting density (Table 4). High planting density significantly decreased reproductive organ P acquisition when compared with low and high density crops. Reproductive organ P uptake of J-4B at a moderate density began the fast accumulation period at 54 DAE and terminated at 82 DAE with relatively higher average (0.8 VT kg·ha−1·d−1) and maximum (1.0 VM kg·ha−1·d−1) rates compared with the other treatments.

4. Discussion

The main objective of this study was to determine how planting density influenced cotton plant fiber quality, biomass yield, and phosphorus distribution at various developmental stages under moderately populated cotton with the single fertilization of late planted cotton. An efficient biomass production is the prerequisite for cotton lint yield formation. In this study, the biomass accumulation rate was higher in 2017 when compared with the 2018 growing season, which might be due to adverse environmental conditions in 2018 (Figure 1) that negatively influenced all plant performance. High planting density had a higher total and vegetative organ biomass rather than reproductive structure biomass. Moderately populated plants had a significantly higher reproductive organ biomass yield over low and high density crops. Planting density did not influence reproductive organ biomass accumulation during the early growth phases, but the boll filling stage was significantly affected by planting density. The increment in reproductive biomass accumulation may be associated with greater reproductive organ phosphorus acquisition with sustained reproductive organ formation. The tissue nutrient concentration indicates plant nutrient status and is used in the estimation of utilization efficiency in dry matter formation [32]. More potassium uptake can sustain reproductive organ formation under medium crops [8] and nitrogen acquisition can improve the leaf photosynthetic capacity of moderately populated crops [27]. Higher biomass under dense population was the result of more plants per unit area with a larger canopy structure and vegetative growth. These data are consistent with previous research where dense plants result in greater biomass yield [33,34]. Low reproductive organ production in densely populated crops may be associated with low light transmission to the lower parts of plant, which led to reduced temperature and increased relative humidity within the plant canopy, which in turn increased fruit shedding when compared with other treatments; thus both dense and low planting density had decreased reproductive structure production [35]. Between the cultivars, J-4B had higher total and reproductive organ biomass accumulation rates when compared with Zhongmian-16. The increase in biomass formation for J-4B might be due to the higher fruiting node number, which was observed in this study. Second, the variation in biomass formation might be associated with the genetic variability in plant growth.
Soil phosphorus availability plays a crucial role in sustaining plant growth and physiological functioning. However, plant nutrient acquisition varies in the amount and rate with the plant flourishment [36]. In the present study, plants under high density had higher total phosphorus accumulation at various developmental stages. This increment might be associated with the plant competitiveness for available resources, which in turn, increased phosphorus acquisition. Phosphorus deficient crops led to a decline in the phosphorus and nitrogen utilization efficiency of biomass formation, and was mainly attributed with a reduction in the biomass relative to the tissue phosphorus concentration [37]. Phosphorus utility is mainly restricted by phosphorus absorption and accumulation in different organs [22,38]. The assimilate formation and allocation toward plant organs were closely related with phosphorus utility [39]. Higher P accumulation promoted assimilate production [40]. P accumulation can alter leaf nitrogen, which in turn increases assimilated formation and sucrose accumulation in the leaf [40]. Despite a higher rate of nutrient uptake per unit area, plants under high density may have lower nutrient accumulation on a single plant basis [36]. Similarly, densely populated crops favor higher nitrogen accumulation in vegetative structures at early developmental phases, but crops at a moderate density result in more nitrogen in the reproductive organs [41].
Cotton canopy architectural characteristics include the size, shape and orientation of shoots, plants resistance to pests, adaptability, plant density, and cultivar requirements [42]. In this study, the planting density and variety significantly changed the cotton plant morphological characteristics. Generally, densely populated crops produced taller stems and more fruiting branches with a lower height to node ratio than in the low and medium density crops. This could be attributed to the late season boll load rather than early season, which is consistent with the previous findings of [42]. However, these characteristics were negatively affected on an individual plant basis for J-4B, which had more fruiting branches, a greater height to node ratio, and produced smaller plants when compared with Zhongmian-16. The increments in these parameters may be associated with cooler night temperatures that promote fruiting branch initiation and buds and the increase in competitiveness between plants for available resources [29,43]. Plant growth attributes suggest that reducing plant density can be used as an additional management option in conjunction with the use of plant growth regulator to help control plant height.
Cotton fiber is initiated from a single cell on the external epidermis of seeds at anthesis. Fiber quality parameters are strongly influenced by planting density and the cultivar [44], or environmental factors [45]. In the present study, planting density and variety had a significant effect on cotton fiber quality traits. Low or moderately dense plants were the most beneficial and produced longer fiber length, strength, and greater micronaire values when compared with high density. The cotton fiber elongation (%) and uniformity index (%) remained unaffected. The improved fiber attributes might be attributed to greater reproductive structure P acquisition during the flowering stage, which led to a higher source to sink ratio and promoted boll development when compared with high density. Our data are in good agreement with [46], who also reported desirable fiber micronaire and length at low density compared with high density. The lower fiber quality under high density might be due to the lower photosynthetic rate, which resulted in a low carbohydrate supply during fiber formation. Lower plant population levels can reduce fiber length at the canopy level with respect to fruiting position [47]. Conversely, [29] suggested that a longer fiber length and lower uniformity percentage could be achieved under high density crops.

5. Conclusions

In the present study, sowing density and cultivar considerably influenced the growth and physiology of the cotton crop. Moderate density plants resulted in higher reproductive structure biomass accumulation at the peak bloom, boll set, and maturity stage when compared with high density crops. This gain in reproductive organ biomass formation under moderate density was the result of greater phosphorus uptake at different developmental stages. Planting density did not influence reproductive organ biomass accumulation during the early reproductive phase, but the boll filling was significantly affected by planting density. An increment in sowing imposed adverse effects on the fiber quality characteristics. Low or moderate density crops produced a higher fiber quality than high density crops. In conclusion, the J-4B cultivar at moderate density (6 × 10⁴ ha−1) is a good management strategy in terms of improved biomass formation, phosphorus uptake, and fiber quality with once only nitrogen fertilization during the flowering stage under a short growing season in subtropical regions in China.

Author Contributions

A.K. and R.Z. conceived the main idea. A.K. conducted the experiment and wrote the first draft. X.K. and J.Z. helped during experimentation. U.N., D.K.Y.T. and K.A. revised the manuscript and provided useful suggestion. F.M. processed and analyzed the data.

Funding

We are thankful for the financial support by the National Natural Science Foundation of China and China Postdoctoral Science Foundation (Grant nos. 31360348 and 2019M653809XB).

Conflicts of Interest

The authors declare no conflict of interest. The funders had no role in the design of the study; in data collection, analyses, or interpretation of data; in the writing of the manuscript, or in the decision to publish the results.

References

  1. Han, H.Y.; Deng, F.J.; Li, B.C.; Yang, B.Y.; Yang, L.Y.; Lin, H.; Wang, X.T. Effect of plant density on cotton yield and quality in Xinjiang. Jiangsu J. Agric. Sci. 2009, 4, 98–100. [Google Scholar]
  2. Dong, H.Z.; Li, W.J.; Eneji, A.E.; Zhang, D.M. Nitrogen rate and plant density effects on yield and late-season leaf senescence of cotton raised on a saline field. Field Crops Res. 2012, 126, 137–144. [Google Scholar] [CrossRef]
  3. Chen, Z.; Niu, Y.; Zhao, R.; Han, C.; Han, H.; Luo, H. The combination of limited irrigation and high plant density optimizes canopy structure and improves the water use efficiency of cotton. Agric. Water Manag. 2019, 218, 139–148. [Google Scholar] [CrossRef]
  4. Yang, G.Z.; Jiao, L.X.; Chun, N.Y.; Long, Z.X. Effects of Plant Density on Yield and canopy micro environment in hybrid cotton. J. Integr. Agric. 2014, 13, 2154–2163. [Google Scholar] [CrossRef]
  5. Tung, S.A.; Huang, Y.; Hafeez, A.; Ali, S.; Khan, A.; Souliyanonh, B.; Yang, G. Mepiquat chloride effects on cotton yield and biomass accumulation under late sowing and high density. Field Crops Res. 2018, 215, 59–65. [Google Scholar] [CrossRef]
  6. Chen, Z.; Tao, X.; Khan, A.; Tan, D.K.Y.; Luo, H. Biomass accumulation, photosynthetic traits and root development of cotton as affected by irrigation and nitrogen-fertilization. Front. Plant Sci. 2018, 9, 173. [Google Scholar] [CrossRef]
  7. Ali, H.; Afzal, M.N.; Ahmad, S.; Muhammad, D. Effect of cultivars and sowing dates on yield and quality of (Gossypium hirsutum L.). Crop Food Agric. Environ. 2009, 7, 244–247. [Google Scholar]
  8. Khan, A.; Najeeb, U.; Wang, L. Planting density and sowing date strongly influence growth and lint yield of cotton crops. Field Crops Res. 2017, 209, 129–135. [Google Scholar] [CrossRef]
  9. Tariq, M.; Afzal, M.N.; Muhammad, D.; Ahmad, S.; Shahzad, A.N.; Kiran, A.; Wakeel, A. Relationship of tissue potassium content with yield and fiber quality components of Bt cotton as influenced by potassium application methods. Field Crops Res. 2018, 229, 37–43. [Google Scholar] [CrossRef]
  10. Marcelis, L.F.M.; Heuvelink, E.; Hofman-Eijer, L.R.B.; Bakker, J.D.; Xue, L.B. Flower and fruit abortion in sweet pepper in relation to source and sink strength. J. Exp. Bot. 2004, 55, 2261–2268. [Google Scholar] [CrossRef] [Green Version]
  11. Wingler, A.; Purdy, S.; MacLean, J.A.; Pourtau, N. The role of sugars in integrating environmental signals during the regulation of leaf senescence. J. Exp. Bot. 2006, 57, 391–399. [Google Scholar] [CrossRef] [PubMed]
  12. Shah, A.N.; Yang, G.; Tanveer, M.; Iqbal, J. Leaf gas exchange, source—Sink relationship, and growth response of cotton to the interactive effects of nitrogen rate and planting density. Acta Physiol. Plant. 2017, 39, 119. [Google Scholar] [CrossRef]
  13. Yin, X.; Goudriaan, J.; Lantinga, E.A.; Vos, J.; Spiertz, J.H.J. A flexible sigmoid function of determinate growth. Ann. Bot. 2003, 91, 361–371. [Google Scholar] [CrossRef] [PubMed]
  14. Mao, L.; Zhang, L.; Sun, X.; van der Werf, W.; Evers, J.B.; Zhao, X.; Li, Z. Use of the beta growth function to quantitatively characterize the effects of plant density and a growth regulator on growth and biomass partitioning in cotton. Field Crops Res. 2018, 224, 28–36. [Google Scholar] [CrossRef]
  15. Baytar, A.A.; Peynircioğlu, C.; Sezener, V.; Basal, H.; Frary, A.; Frary, A.; Doğanlar, S. Identification of stable QTLs for fiber quality and plant structure in Upland cotton (G. hirsutum L.) under drought stress. Ind. Crops Prod. 2018, 124, 776–786. [Google Scholar] [CrossRef]
  16. Bradow, J.M.; Bauer, P.J.; Hinojosa, O.; Sassenrath-Cole, G. Quantitation of cotton fibre-quality variations arising from boll and plant growth environments. Eur. J. Agron. 1997, 6, 191–204. [Google Scholar] [CrossRef]
  17. Yeates, S.J.; Constable, G.A.; McCumstie, T. Irrigated cotton in the tropical dry season. III: Impact of temperature, cultivar and sowing date on fiber quality. Field Crops Res. 2010, 116, 300–307. [Google Scholar] [CrossRef]
  18. Zhang, D.; Luo, Z.; Liu, S.; Li, W.; Dong, H. Effects of deficit irrigation and plant density on the growth, yield and fiber quality of irrigated cotton. Field Crops Res. 2016, 197, 1–9. [Google Scholar] [CrossRef]
  19. Shu, H.M.; Wang, Y.H.; Zhang, W.J.; Zhou, Z.G. Activity changes of enzymes associated with fiber development and relationship with fiber specific strength in two cotton cultivars. Acta Agron. Sin. 2008, 34, 437–446. [Google Scholar] [CrossRef]
  20. Cao, T.-V.; Oumarou, P.; Gawrysiak, G.; Klassou, C.; Hau, B. Short-season cotton (Gossypium hirsutum) may be a suitable response to late planting in sub-Saharan regions. Field Crops Res. 2011, 120, 9–20. [Google Scholar] [CrossRef]
  21. Liu, J.R.; Meng, Y.L.; Chen, B.L.; Zhou, Z.G.; Ma, Y.N.; Lv, F.J.; Chen, J.; Wang, Y.H. Photosynthetic characteristics of the subtending leaf and the relationships with lint yield and fiber quality in the late-planted cotton. Acta Physiol. Plant. 2015, 37, 1–11. [Google Scholar] [CrossRef]
  22. Wang, J.; Chen, Y.; Wang, P.; Li, Y.S.; Wang, G.; Liu, P.; Khan, A. Leaf gas exchange, phosphorus uptake, growth and yield responses of cotton cultivars to different phosphorus rates. Photosynthetica 2018, 56, 1414–1421. [Google Scholar] [CrossRef]
  23. Wang, J.; Ping, L.; Liu, Z.; Wu, Z.; Li, Y.; Guan, X. Dry matter accumulation and phosphorus efficiency response of cotton cultivars to phosphorus and drought. J. Plant Nutr. 2017, 40, 2349–2357. [Google Scholar]
  24. Luo, H.H.; Merope, T.M.; Zhang, Y.L. Combining gas exchange and chlorophylla lfuorescence measurements to analyze the photosynthetic activity of drip-irrigated cotton under different soil water deifcits. J. Agric. Sci. 2016, 15, 1256–1266. [Google Scholar]
  25. Singh, S.K.; Badgujar, G.B.; Reddy, V.R. Effect of phosphorus nutrition on growth and physiology of cotton under ambient and elevated carbon dioxide. J. Agron. Crop Sci. 2013, 199, 436–448. [Google Scholar] [CrossRef]
  26. Wang, G.; Zheng, C.S.; Li, P.C. Effects of soil olsen-P levels on the dry matter accumulation and carbon and nitrogen metabolism of cotton plant at seedling stage. Cotton Sci. 2016, 6, 609–618. [Google Scholar]
  27. Khan, A.; Wang, L.; Ali, S.; Tung, S.A.; Hafeez, A.; Yang, G. Optimal planting density and sowing date can improve cotton yield by maintaining reproductive organ biomass and enhancing potassium uptake. Field Crops Res. 2017, 214, 164–174. [Google Scholar] [CrossRef]
  28. Luo, Z.; Liu, H.; Li, W.; Zhao, Q.; Dai, J.; Tian, L.; Dong, H. Effects of reduced nitrogen rate on cotton yield and nitrogen use efficiency as mediated by application mode or plant density. Field Crops Res. 2018, 218, 150–157. [Google Scholar] [CrossRef]
  29. Yao, H.; Zhang, Y.; Yi, X.; Zuo, W.; Lei, Z.; Sui, L.; Zhang, W. Characters in light-response curves of canopy photosynthetic use efficiency of light and N in responses to plant density in field-grown cotton. Field Crops Res. 2017, 203, 192–200. [Google Scholar] [CrossRef]
  30. Bremer, J.M.; Mulvaney, C.S. Nitrogen Total. In Methods of Soil Analysis. Part 2: Chemical and Microbiological Properties; American Society of Agronomy Inc.; Soil Science Society of America Inc.: Madison, WI, USA, 1982; pp. 595–624. [Google Scholar]
  31. Yang, G.; Tang, H.; Nie, Y.; Zhang, X. Response of cotton growth, yield, and biomass to nitrogen split application ratio. Eur. J. Agron. 2011, 35, 164–170. [Google Scholar] [CrossRef]
  32. Israel, D.W.; Rufty, T.W. Influence of phosphorus nutrition on phosporus and nitrogen utilization efficiencies and associated physiological responses in soybean. Crop Sci. 1988, 28, 954–960. [Google Scholar] [CrossRef]
  33. Dai, J.; Li, W.; Tang, W.; Zhang, D.; Li, Z.; Lu, H.; Eneji, A.E.; Dong, H. Manipulation of dry matter accumulation and partitioning with plant density in relation to yield stability of cotton under intensive management. Field Crops Res. 2015, 180, 207–215. [Google Scholar] [CrossRef]
  34. Brodrick, R.; Bange, M.P.; Milroy, S.P.; Hammer, G.L. Physiological determinants of high yielding ultra-narrow row cotton: Biomass accumulation and partitioning. Field Crops Res. 2015, 134, 122–129. [Google Scholar] [CrossRef]
  35. Darawsheh, M.K.; Chachalis, D.; Aivalakis, G.; Khah, E.M. Cotton row spacing and plant density cropping systems II. Effects on seed cotton yield, boll components and lint quality. J. Food Agric. Environ. 2009, 7, 262–265. [Google Scholar]
  36. Xue, J.; Li, M.Y.; Ning, S.; Wei-shao, S.; Zhou, Z. Effects of planting density on uptake and utilization of NPK of transgenic cotton. Plant Nutr. Fert. 2013, 19, 179–186. [Google Scholar]
  37. Singh, S.K.; Reddy, V.R. Combined effects of phosphorus nutrition and elevated carbon dioxide concentration on chlorophyll fluorescence, photosynthesis, and nutrient efficiency of cotton. J. Plant Nutr. Soil Sci. 2014, 177, 892–902. [Google Scholar] [CrossRef] [Green Version]
  38. Chen, B.L.; Sheng, J.D.; Jiang, P.A.; Liu, Y.G. Effect of applying different forms and rates of phosphoric fertilizer on phosphorus efficiency and cotton yield. Cotton Sci. 2010, 22, 49–56. [Google Scholar]
  39. Dannowski, M.; Block, A. Fractal geometry and root system structures of heterogeneous plant communities. Plant Soil 2005, 272, 61–76. [Google Scholar] [CrossRef]
  40. Yan, B.; Wu, B.; Gao, Y.; Wu, J.; Niu, J.; Xie, Y.; Zhang, Z. Effects of nitrogen and phosphorus on the regulation of nonstructural carbohydrate accumulation, translocation and the yield formation of oilseed flax. Field Crops Res. 2018, 219, 229–241. [Google Scholar] [CrossRef]
  41. Liu, R.X.; Shi, W.; Xu, L.H.; Yang, C.Q.; Guo, W.Q.; Zhang, P.T. Effects of planting density on dry matter and nitrogen accumulation and distribution of cotton. Jiangsu J. Agric. Sci. 2011, 2, 106–113. [Google Scholar]
  42. Kaggwa-Asiimwe, R.; Andrade-Sanchez, P.; Wang, G. Plant architecture influences growth and yield response of upland cotton to population density. Field Crops Res. 2013, 145, 52–59. [Google Scholar] [CrossRef]
  43. Sawan, Z.M. Plant density; plant growth retardants: Its direct and residual effects on cotton yield and fiber properties. Cogent Biol. 2016, 2, 1234959. [Google Scholar] [CrossRef]
  44. Yao, H.; Zhang, Y.; Yi, X. Plant density alters nitrogen partitioning among photosynthetic components, leaf photosynthetic capacity and photosynthetic nitrogen use efficiency in field-grown cotton. Field Crops Res. 2015, 184, 39–49. [Google Scholar] [CrossRef]
  45. Read, J.J.; Reddy, K.R.; Jenkins, J.N. Yield and fiber quality of upland cotton as influenced by nitrogen and potassium nutrition. Eur. J. Agron. 2006, 24, 282–290. [Google Scholar] [CrossRef]
  46. Jones, M.A.; Wells, R. Fiber yield and quality of cotton grown at two divergent population densities. Crop Sci. 1998, 38, 1190–1195. [Google Scholar] [CrossRef]
  47. Bednarz, C.W.; Nichols, R.L.; Brown, S.M. Plant density modifications of cotton within-boll yield components. Crop Sci. 2006, 46, 2076–2080. [Google Scholar] [CrossRef]
Figure 1. Monthly average maximum and minimum air temperature and rainfall in the 2017 and 2018 growing seasons.
Agronomy 09 00500 g001
Figure 2. Changes in the growth attributes of cotton plant cultivars under changing planting densities in the 2017 and 2018 growing seasons. (AC) indicates plant height, fruiting nodes and height node ratio, respectively. SD (n = 4). V1, Zhongmian-16; V2, J-4B; D1, low; D2, moderate; D3, high density.
Agronomy 09 00500 g002
Figure 3. Changes in cotton plant biomass yield in response to planting density and cultivar in the 2017 and 2018 growing season at different developmental stages SD (n = 4).
Agronomy 09 00500 g003
Figure 4. Changes in cotton plant vegetative organ biomass yield in response to planting density and cultivar in the 2017 and 2018 growing season at different developmental stages SD (n = 4).
Agronomy 09 00500 g004
Figure 5. Changes in cotton plant reproductive organ biomass yield in response to planting density and cultivar in the 2017 and 2018 growing season at different developmental stages SD (n = 4).
Agronomy 09 00500 g005
Figure 6. Changes in cotton plant phosphorus uptake in response to planting density and cultivar in the 2018 growing season at different developmental stages. (AC) indicates vegetative organ, reproductive organ and total plant phosphorus accumulation, respectively. SD (n = 4).
Agronomy 09 00500 g006
Table 1. Summary of means square values (MS) from analysis of variance (ANOVA) for cotton plant growth characteristics and biomass at various growth stages.
Source of VarianceYearDensityVarietyDensity × VarietyYear × DensityYear × VarietyYear × Density × Variety
Total biomass (kg ha−1)
Squaring34,416.6 *16,238 *6620.1 ns4056.5 ns2134.1 ns2396.8 ns1337.5 ns
First bloom279,334 **36,703 *150,047 **6056.5 ns8571 ns80,182 ns25,960 ns
Peak bloom3,677,454 **329,578 *367,679 *41,735 ns110,000 ns286,066 ns86,448 ns
Boll set1,434,828 *2,739,528 **391,809 *138,145 ns541,390 ns286,994 ns163,932 ns
Plant removal1,210,120 *2,619,483 **621,994 *81,055 ns855,670 ns490,292 ns20,179 ns
Vegetative organ biomass (kg ha−1)
Squaring30,180.3 *20,965.9 ns881.3 ns2932.3 ns9923.4 ns2751.0 ns7885.8 ns
First bloom20,184 *45,759 **168,638 **2384 ns3071 ns16,537 ns1437 ns
Peak bloom5,285,010 **174,087 **437,049 **16,561 ns2420 ns6712 ns6392 ns
Boll set2,023,067 **401,322 **694,473 **16,459 ns4089 ns9826 ns2527 ns
Plant removal1,060,410 **597,758 **906,263 **63,456 ns29,126 ns131,645 ns19,288 ns
Reproductive organ biomass (kg ha−1)
Squaring19.7633 **31.9648 **2.7603 ns2.3961 ns11.48 ns6.348 ns4.732 ns
First bloom35.56 ns2538.8 *37,974.5 **4518.2 *11.7 ns1634.7 ns9.941 ns
Peak bloom5283.6 ns237,90.8 *69,389.1 **2500.3 ns5193.5 ns23,665.8 ns7504.7 ns
Boll set510,263 *376,954 *2,620,967 **15,678 ns105,955 ns23,324 ns41,685 ns
Plant removal550,263 *428,504 *924,797 *82,879 ns4546 ns502.0 ns1093 ns
Plant height (cm)145.6 **11.22 **127.9 **4.981 *32.84 ns0.525 ns1.4210 ns
Fruiting nodes number (m−2)1356.2 **32.3 7 ns62.03 *52.45 *1.80 ns0.97 ns19.57 ns
Height to node ratio2.219 **0.42389 **1.021 **3.739 **0.023 ns0.005 ns0.022 ns
ns, non-significant; * Significant at the p < 0.05 level and ** Significant at the p < 0.01) level.
Table 2. Fiber quality attributes in response to planting density and cultivar during the 2017 and 2018 growing seasons.
TreatmentLengthStrengthMicronaireElongationUniformity Index
(mm)(cN/tex)value(%)(%)
Year 2017
Density (D)
D1 (low)30.7a31.9a4.1a6.5a81.8a
D2 (moderate)28.5b29.4b3.4b6.5a82.8a
D3 (high)25.0c27.8c3.1b6.5a82.2a
Variety (V)
V1 (Zhongmian-16)28.2a30.2a3.6a6.5a82.0a
V2 (J-4B)28.0a29.2b3.4a6.5a82.5a
Interaction
D1V132.5a33.9a4.5a6.5ab81.5a
D1V228.9b30.0b3.7b6.4b82.1a
D2V128.3b28.4b3.2bc6.5ab82.4a
D2V228.7b30.4ab3.5bc6.6a83.1a
D3V123.7c28.5b3.0c6.5ab82.1a
D3V226.4b27.1b3.3c6.5ab82.2a
Year 2018
D1 (low)29.2a28.0a3.8a6.5a82.1c
D2 (moderate)28.8a29.1a3.3a6.5a82.7b
D3 (high)25.6b26.7b3.0c6.6a83.5a
V127.7a29.3a3.4a6.5a82.6a
V228.1a27.2b3.4a6.5a82.9a
D1V129.4a29.4ab3.9a6.6ab81.7d
D1V229.1a26.6c3.7a6.4b82.6bc
D2V129.0a31.4a3.2b6.5ab83.2c
D2V228.6ab26.7c3.3a6.4ab82.7cd
D3V124.7c27.1bc3.0b6.5ab83.0b
D3V226.5bc28.2bc3.1b6.6ab83.9a
Source of variance
Y8.218 ns10.17 ns0.100 ns0.004 ns3.300 ns
D207.7 **243.6 **4.361 **0.009 ns2.507 ns
Y*D0.764 ns0.005 ns0.006 ns0.006 ns2.108 ns
V0.054 ns14.31 **0.147 ns0.018 ns4.341 *
Y*V0.160 ns0.034 ns0.003 ns0.001 ns0.380 ns
D*V13.98 **25.79 **0.503 **0.027 ns0.352 ns
Y*D*V0.653 ns0.202 ns0.076 ns0.017 ns1.173 ns
Alphabets within columns followed by the same letter are statistically insignificant at the 0.05 level. ** significant at p < 0.01 and * significant p < 0.05; ns, non-significant.
Table 3. Regression equations of cotton plant phosphorus accumulation at various planting densities on cultivar.
ItemsTreatmentRegression Equationp Value
Cotton plant
D1V1Y = 25.8592/(1 + 5.3998e−0.069361t)0.0067
D1V2Y = 28.8033/(1 + 7.2515e−0.090655t)0.0045
D2V1Y = 33.8419/(1 + 3.6664e−0.044682t)0.0091
D2V2Y = 38.0327/(1 + 5.1905e−0.069398t)0.0044
D3V1Y = 40.0233/(1 + 3.7972e−0.05563t)0.0078
D3V2Y = 49.3420/(1 + 6.4825e−0.095022t)0.0058
Vegetative organs
D1V1Y = 11.0623/(1 + 4.4306e−e0.055937t)0.0065
D1V2Y = 12.7236/(1 + 5.4970e−0.065756t)0.0044
D2V1Y = 16.0106/(1 + 5.2762e−0.068643t)0.0004
D2V2Y = 18.4841/(1 + 4.9136e−0.060650t)0.0045
D3V1Y = 24.2157/(1 + 3.3978e−0.040419t)0.0067
D3V2Y = 28.6854/(1 + 4.1888e−0.050052t)0.0006
Reproductive organs
D1V1Y = 15.5702/(1 + 17.8065e−0.194612t)0.0003
D1V2Y = 17.4225/(1 + 13.5270e−0.137846t)0.0009
D2V1Y = 18.1896/(1 + 40.9772e−0.431232t)0.0024
D2V2Y = 21.1415/(1 + 21.9906e−0.245461t)0.0071
D3V1Y = 12.0661/(1 + 12.9458e−0.128539t)0.0002
D3V2Y = 14.4129/(1 + 19.1064e−0.199205t)0.0003
Table 4. Eigenvalues of cotton phosphorus uptake under different planting densities and cultivar.
TreatmentFast Accumulation PeriodFastest Accumulation Point
t1 DAEt2 DAET dVT kg·ha−1·d−1VM kg·ha−1·d−1at DAE
Cotton plant
D1V155.698.543.00.50.682.1
D1V269.388.819.50.71.076.1
D2V158.996.838.00.91.077.9
D2V244.691.947.31.21.468.3
D3V171.295.023.71.51.689.6
D3V278.098.320.41.92.295.0
Average62.994.831.81.11.381.5
Vegetative organs
D1V155.7102.847.10.10.279.2
D1V263.6103.640.10.30.483.6
D2V159.3102.743.40.40.581.0
D2V257.796.038.40.50.476.9
D3V160.5103.343.60.60.684.1
D3V257.498.541.20.81.083.7
Average59.0101.142.30.40.581.4
Reproductive organs
D1V182.3104.522.20.40.795.9
D1V255.893.838.00.60.674.8
D2V165.594.529.10.60.780.0
D2V254.482.127.70.81.068.2
D3V190.5111.020.50.30.4100.7
D3V288.6107.719.10.50.698.1
Average72.898.926.10.50.786.1
DAE, days after emergence (d); t1, start time; t2, terminated time; and VM, maximum rate of phosphorus uptake; VT, average rate of phosphorus uptake.

