Article

The Use of Different Hot Foam Doses for Weed Control

Department of Agriculture, Food and Environment, University of Pisa, Via del Borghetto 80, 56124 Pisa, Italy
*
Author to whom correspondence should be addressed.
Agronomy 2019, 9(9), 490; https://doi.org/10.3390/agronomy9090490
Submission received: 25 July 2019 / Revised: 23 August 2019 / Accepted: 26 August 2019 / Published: 28 August 2019
(This article belongs to the Special Issue Weed Management & New Approaches)

Abstract

:
Thermal weed control technology plays an important role in managing weeds in synthetic herbicide-free systems, particularly in organic agriculture. The use of hot foam represents an evolution of the hot water weed control thermal method, modified by the addition of biodegradable foaming agents. The aim of this study was to test the weeding effect of different five hot foam doses, in two sites of different weed composition fields [i.e., Festuca arundinacea (Schreb.), Taraxacum officinale (Weber) and Plantago lanceolata (L.)], by evaluating the devitalisation of weeds, their regrowth, the weed dry biomass at the end of the experiment and the temperature of hot foam as affected by different foam doses. The results showed that the effect of the hot foam doses differed with the different infested weed species experiments. In the Festuca arundinacea (Schreb.) infested field, all doses from 3.33 L m−2 to 8.33 L m−2 led to a 100% weed cover devitalisation and a lower weed dry biomass compared to the dose of 1.67 L m−2, whereas the weed regrowth was similar when all doses were applied. In the Taraxacum officinale (Weber) and Plantago lanceolata (L.) infested fields, doses from 5.00 L m−2 to 8.33 L m−2 in site I and from 3.33 L m−2 to 8.33 L m−2 in site II led to 100% of weed cover devitalisation. The highest doses of 6.67 L m−2 and 8.33 L m−2 led to a slower weed regrowth and a lower weed dry biomass compared to the other doses. The time needed for weeds to again cover 50%, after the 100% devitalisation, was, on average, one month when all doses were applied in the Festuca arundinacea (Schreb.) infested field, whereas in the Taraxacum officinale (Weber) and Plantago lanceolata (L.) fields, this delay was estimated only when doses of 6.67 L m−2 and 8.33 L m−2 were used in site I and a dose of 8.33 L m−2 in site II. Thus, in the Festuca arundinacea (Schreb.) field experiments hot foam doses from 3.33 L m−2 to 8.33 L m−2 were effective in controlling weeds, and the use of the lowest dose (i.e., 3.33 L m−2) is recommended. However, for Taraxacum officinale (Weber) and Plantago lanceolata (L.) the highest doses are recommended (i.e., 6.67 L m−2 and 8.33 L m−2), as these led to 100% weed devitalisation, slower regrowth, and lower weed dry biomass than other doses. A delay in the regrowth of weeds by 30 days can lead to the hypothesis that the future application of hot foam as a desiccant in no-till field bands, before the transplant of high-income vegetable crops, will provide a competitive advantage against weeds.

1. Introduction

In Europe there are currently increasing concerns about herbicide resistance and the promotion of new regulations for limiting the dependence on synthetic herbicides, which can be dangerous to human health and the environment, and thus other methods for controlling weeds must be found. Thermal weed control technology plays an important role in managing weeds in synthetic herbicide-free systems, particularly in organic agriculture [1,2,3,4,5,6]. Thermal weed control involves heat being transferred to plant material (leaves, stems, flowers, propagules, etc.) in order to destroy cell structures and cause the denaturation of proteins [1,2]. Several factors influence the heat injury of the plants, including temperature, energy input, exposure period, and weed species [7]. Most thermal methods affect the aboveground portion of the plants, but some weeds (i.e., perennial weeds) may regrow from their belowground components and thus repeated application of thermal control is required [7,8]. Flaming, hot water and steam are the primary heat sources for weed control purposes in agriculture and on hard surfaces in urban areas and have the advantage of not inducing plant resistance [1,3,4,5,6].
Hot foam represents an evolution of the hot water weed control method, modified by the addition of biodegradable foaming agents, and was first patented in 1995 [2,9]. Hot foam weed control is a technique with limited risks to the environment and human health and is applicable for numerous weed species [10]. The foam insulates the weeds from the surrounding air and increases the energy transfer to the plants, thus lowering the dose of hot water required and increasing efficiency [2]. Compared to hot water alone, the addition of foam has the advantages of less water being required, less susceptibility to weather changes, a high application accuracy and speed, more heat transfer time, and a low cost [7,10].
To control above-ground vegetation with hot foam, as for other thermal weed control methods the heat requirement depends on the weed species, their growth stages, their water status and the presence of moisture on the leaf surface [1]. The dose applied is a critical parameter that can determine the efficacy of weed control, and an appropriate dose can increase the overall efficiency [2].
Hot foam has been used to control weeds in cotton fields [8], but the application of this high-energy demand weed control method (due to the high thermal capacity of water [11]) is more realistic in urban area contexts (e.g., on pavements) [12]. The growth of weeds on road pavements is different from that in a field, because the characteristics of the pavements affect the weed growth (i.e., fewer appear on frequently used roads with small joints than in infrequently used pavements with medium or wide joints) [12,13]. In Sweden hot foam was used to control weeds along railways [2].
The aim of this study was to test the weeding effect of five different hot foam doses in two different weed composition fields by evaluating the weed devitalisation, regrowth, and dry biomass at the end of the experiment, and the temperature of hot foam as affected by different foam doses.

2. Material and Methods

2.1. Experimental Set up, Design and Treatment

A two-site experiment was conducted on fields with two different weed compositions at the experimental farm of the University of Pisa (Pisa, Italy) (43°40′33.1″ N 10°18′41.2″ E), for four replicates of the study. In two of the four sites the major weed was Festuca arundinacea (Schreb.), which was 95% present (i.e., it accounted for 95% of the weed population). The more developed plants had five tillers visible [14]. Other weeds randomly present in the plots were Ranunculus ficaria (L.), Veronica persica (L.), Potentilla reptans (L.), and Convolvulus arvensis L., giving an overall total of 5% of the weed population. On the other two sites, the major weeds were Taraxacum officinale (Weber) and Plantago lanceolata (L.), which together made up 95% of the weed population and were 70% and 30% present, respectively. The growth stage of Taraxacum officinale (Weber) was the beginning of flowering (10% of flowers open) [14], and for Plantago lanceolata (L.) the maximum growth stage was 15 true leaves [14]. Other weeds randomly present were Poa annua (L.), Festuca arundinacea (Schreb.), Plantago major (L.) and Picris echioides (L.) giving an overall total of 5% of the weed population. The recognition of weed species and percentages of single species in the total weed population were based on visual estimates. The sites were selected as they had a homogenous distribution of the major weeds described. The soil was loam in all the sites. The sites were uncultivated (i.e., meadows under orchards) and the weeds were managed periodically with mowing before the conduction of the experiments.
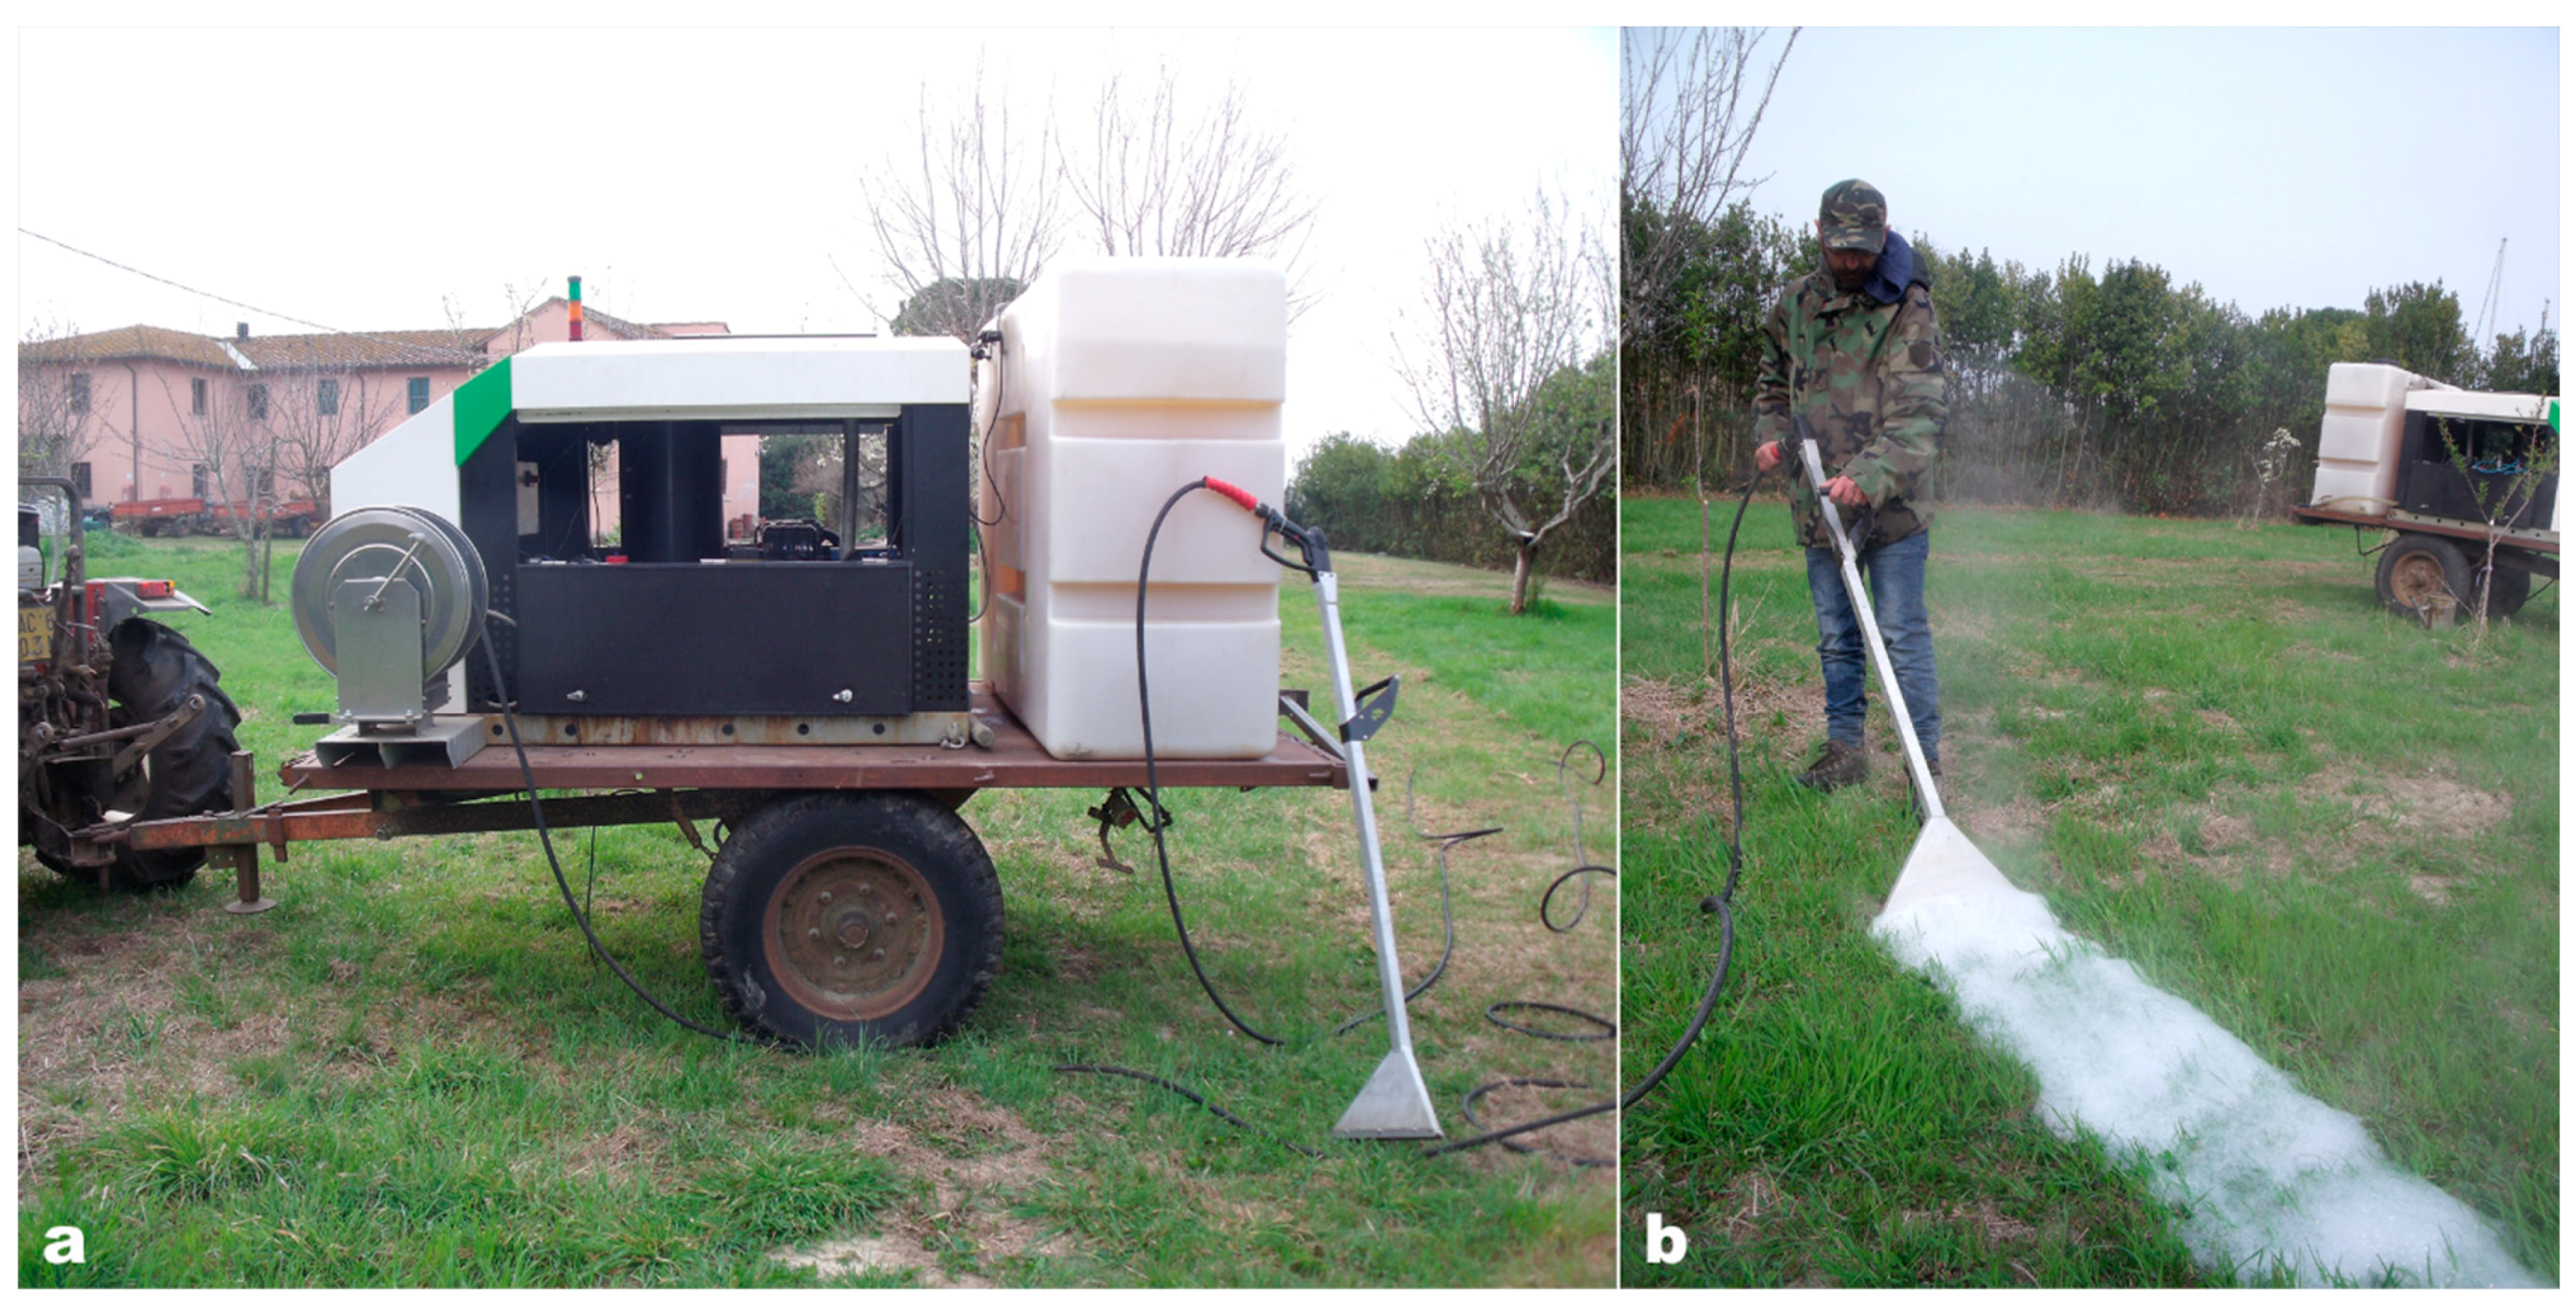
Hot foam was applied by using the Foamstream® MW Series machine built by the company Weedingtech Ltd. (London, UK) (Figure 1) [15]. The solution used (Foamstream V4) was a 100% blend of plant oils and sugar (e.g., alkyl polyglucoside surfactants) [16]. The emission class is equivalent to a Euro 5 [17]. The foam doses were applied manually with a hot foam distribution tool 0.3 m wide, by following notch references in the soil. Plots 2 m long and 0.3 m wide were covered with foam in 5, 10, 15, 20, 25 s, respectively, by positioning the notches every 1 s to be covered. The lance operated at 5 mm from the ground. The foam doses were then calculated by multiplying the machine flow rate (i.e., 0.2 L s-1 of 96% water and 4% Foamstream V4) for the time of application and dividing the resulting volume by the area treated. The hot foam was applied on 2 April 2019. The cumulative rainfall in April was 101 mm and the average temperature was 13 °C.
The experimental design at each site was a randomized block design with three blocks. In each block, 6 foam doses were applied (0, 1.67, 3.33, 5.00, 6.67 and 8.33 L m−2) for a total of 18 plots per site. Weed devitalisation was observed 1, 2, and 3 days after treatments and their regrowth after 7, 16, 25, and 34 days was evaluated. The weed dry biomass was measured 37 days after the treatments were applied and the temperatures of each hot foam dose were recorded at application.

2.2. Data Collection

The temperature of the hot foam for each foam dose was measured with a four-channel digital thermometer (PCE-T 390, PCE Inst., Southampton, UK) equipped with four type K thermocouples and an SD card data logger [18], and was placed in the upper soil layer of the dedicated plots before the foam application with the hot foam distribution tool. One digital thermometer was used in each plot. Temperatures were recorded every second from the peak to the constant temperature (i.e., the environment temperature). Each thermocouple provided a replicate of the measurement.
Measurements of ground covered by the weeds were used to estimate weed devitalisation (i.e., from hot foam application to death of weeds) and weed regrowth (i.e., from weeds death to one month after death). These measurements were estimated from digital images using the IMAGING Crop Response Analyser [19] online software. The digital images were taken from an area of 0.6 m2 (25 cm × 25 cm) at the centre of each plot (with the same geographical coordinates). Photographs of the weed cover for evaluating the devitalisation were taken 1 day before and 1, 2, and 3 days, respectively, after the foam application. Weed cover photographs for the evaluation of the regrowth were also taken 7, 16, 25, and 34 days after the foam application. The distance between the weeds and the camera was constant (i.e., 30 cm from the ground), and high contrast was avoided by using an umbrella. The brightness of the digital images was equalized before analysis. The digital image analysis was as described in Rasmussen et al. [20].
The green weed biomass was collected 37 days after the treatment at the centre of each plot (i.e., 0.6 m2 area) by cutting the weeds at ground level. Cut plants were dried at 105 °C to a constant weight, and then the dry weight was converted into g m−2.

2.3. Statistical Analysis

Data normality was assessed using the Shapiro–Wilk test. Other tests consisted of the Student’s t-test to verify that the mean error was not significantly different from zero, the Breusch-Pagan test for homoscedasticity, and the Durbin-Watson test for autocorrelation.
The weed cover devitalisation did not fit a non-linear regression dose–response model so was modelled in a linear mixed model using the R software [21] extension package ‘lmerTest’ (Tests in Linear Mixed Effects Models) [22]. A logit transformation was conducted. The foam dose, the evaluation date and the site were fixed factors. Fitted correlations among the slopes were assessed in the random factors. The analysis of variance was conducted. The extension package ‘ggplot2′ (elegant graphics for data analysis) [23] was used to plot the graphs.
The weed cover regrowth as affected by foam dose and time (days after termination) was modelled using a four-parameter log-logistic nonlinear regression (Equation (1)) [24]:
Y = c + ( d c ) { 1 + exp [ b ( log X log e ) ] }
where (Y) is the response (percentage weed cover), (c) is the percentage weed cover at the lower limit of the curve, (d) is the percentage weed cover at infinite time, and was assessed to 100%, (b) is the slope of the curve at the inflection point, (X) is the predictor (time in days), and (e) represents the time with 50% of weed cover between the upper and the lower limit of the curve (i.e., at the inflection point).
The decay of the hot foam temperature for each foam dose was modelled using a three-parameter exponential decay nonlinear regression model (Equation (2)) [25]:
Y = c + ( d c ) ( exp ( X e ) )
where (Y) is the response (temperature), c is the temperature for time going to infinity; d is the temperature at time 0 s (e.g., peak temperature); (X) is the predictor (time in seconds), and (e) is the slope of the decay.
The weed dry biomass (collected 37 days after the treatment) in the Festuca arundinacea (Schreb.) infested field experiment was modelled using Equation (2). The weed dry biomass in the Taraxacum officinale (Weber) and Plantago lanceolata (L.) infested field experiment was modelled using the reduced two-parameter exponential decay model (Equation (3)) [25], because the parameter c estimated by using (Equation (2)) was statistically similar to 0.
Y = d ( exp ( X e ) )
where (Y) is the response (weed dry biomass); d is the weed dry biomass at the foam dose of 0 L m−2; (X) is the predictor (foam dose), and (e) is the slope of the decay.
The lack-of-fit test indicated that the models (Equations (1), (2), (3), respectively) were comparable to an ANOVA model using an approximate F test, meaning that the nonlinear regression provided an acceptable description of the data. The ‘drc’ (Dose-Response Curves) R extension [26] was used to fit the nonlinear regression model, to estimate the parameters, the absolute effective times, and to plot the regression curves.
The comparisons between pairs of estimated values were computed by estimating the 95% confidence interval of the difference between the values (Equation (4)):
C I ( difference ) = ( x 1 x 2 ) ± 1.96 ( S E X 1 ) 2 + ( S E X 2 ) 2
where (x1) is the mean of the first value, (x2) is the mean of the second value, (SEx1) is the standard error of (x1), and (SEx2) is the standard error of (x2) [27]. If the resulting 95% confidence interval (CI) of the difference between values did not cross the value 0, the null hypothesis that the compared values were not different was rejected.

3. Results

3.1. Hot Foam Temperature

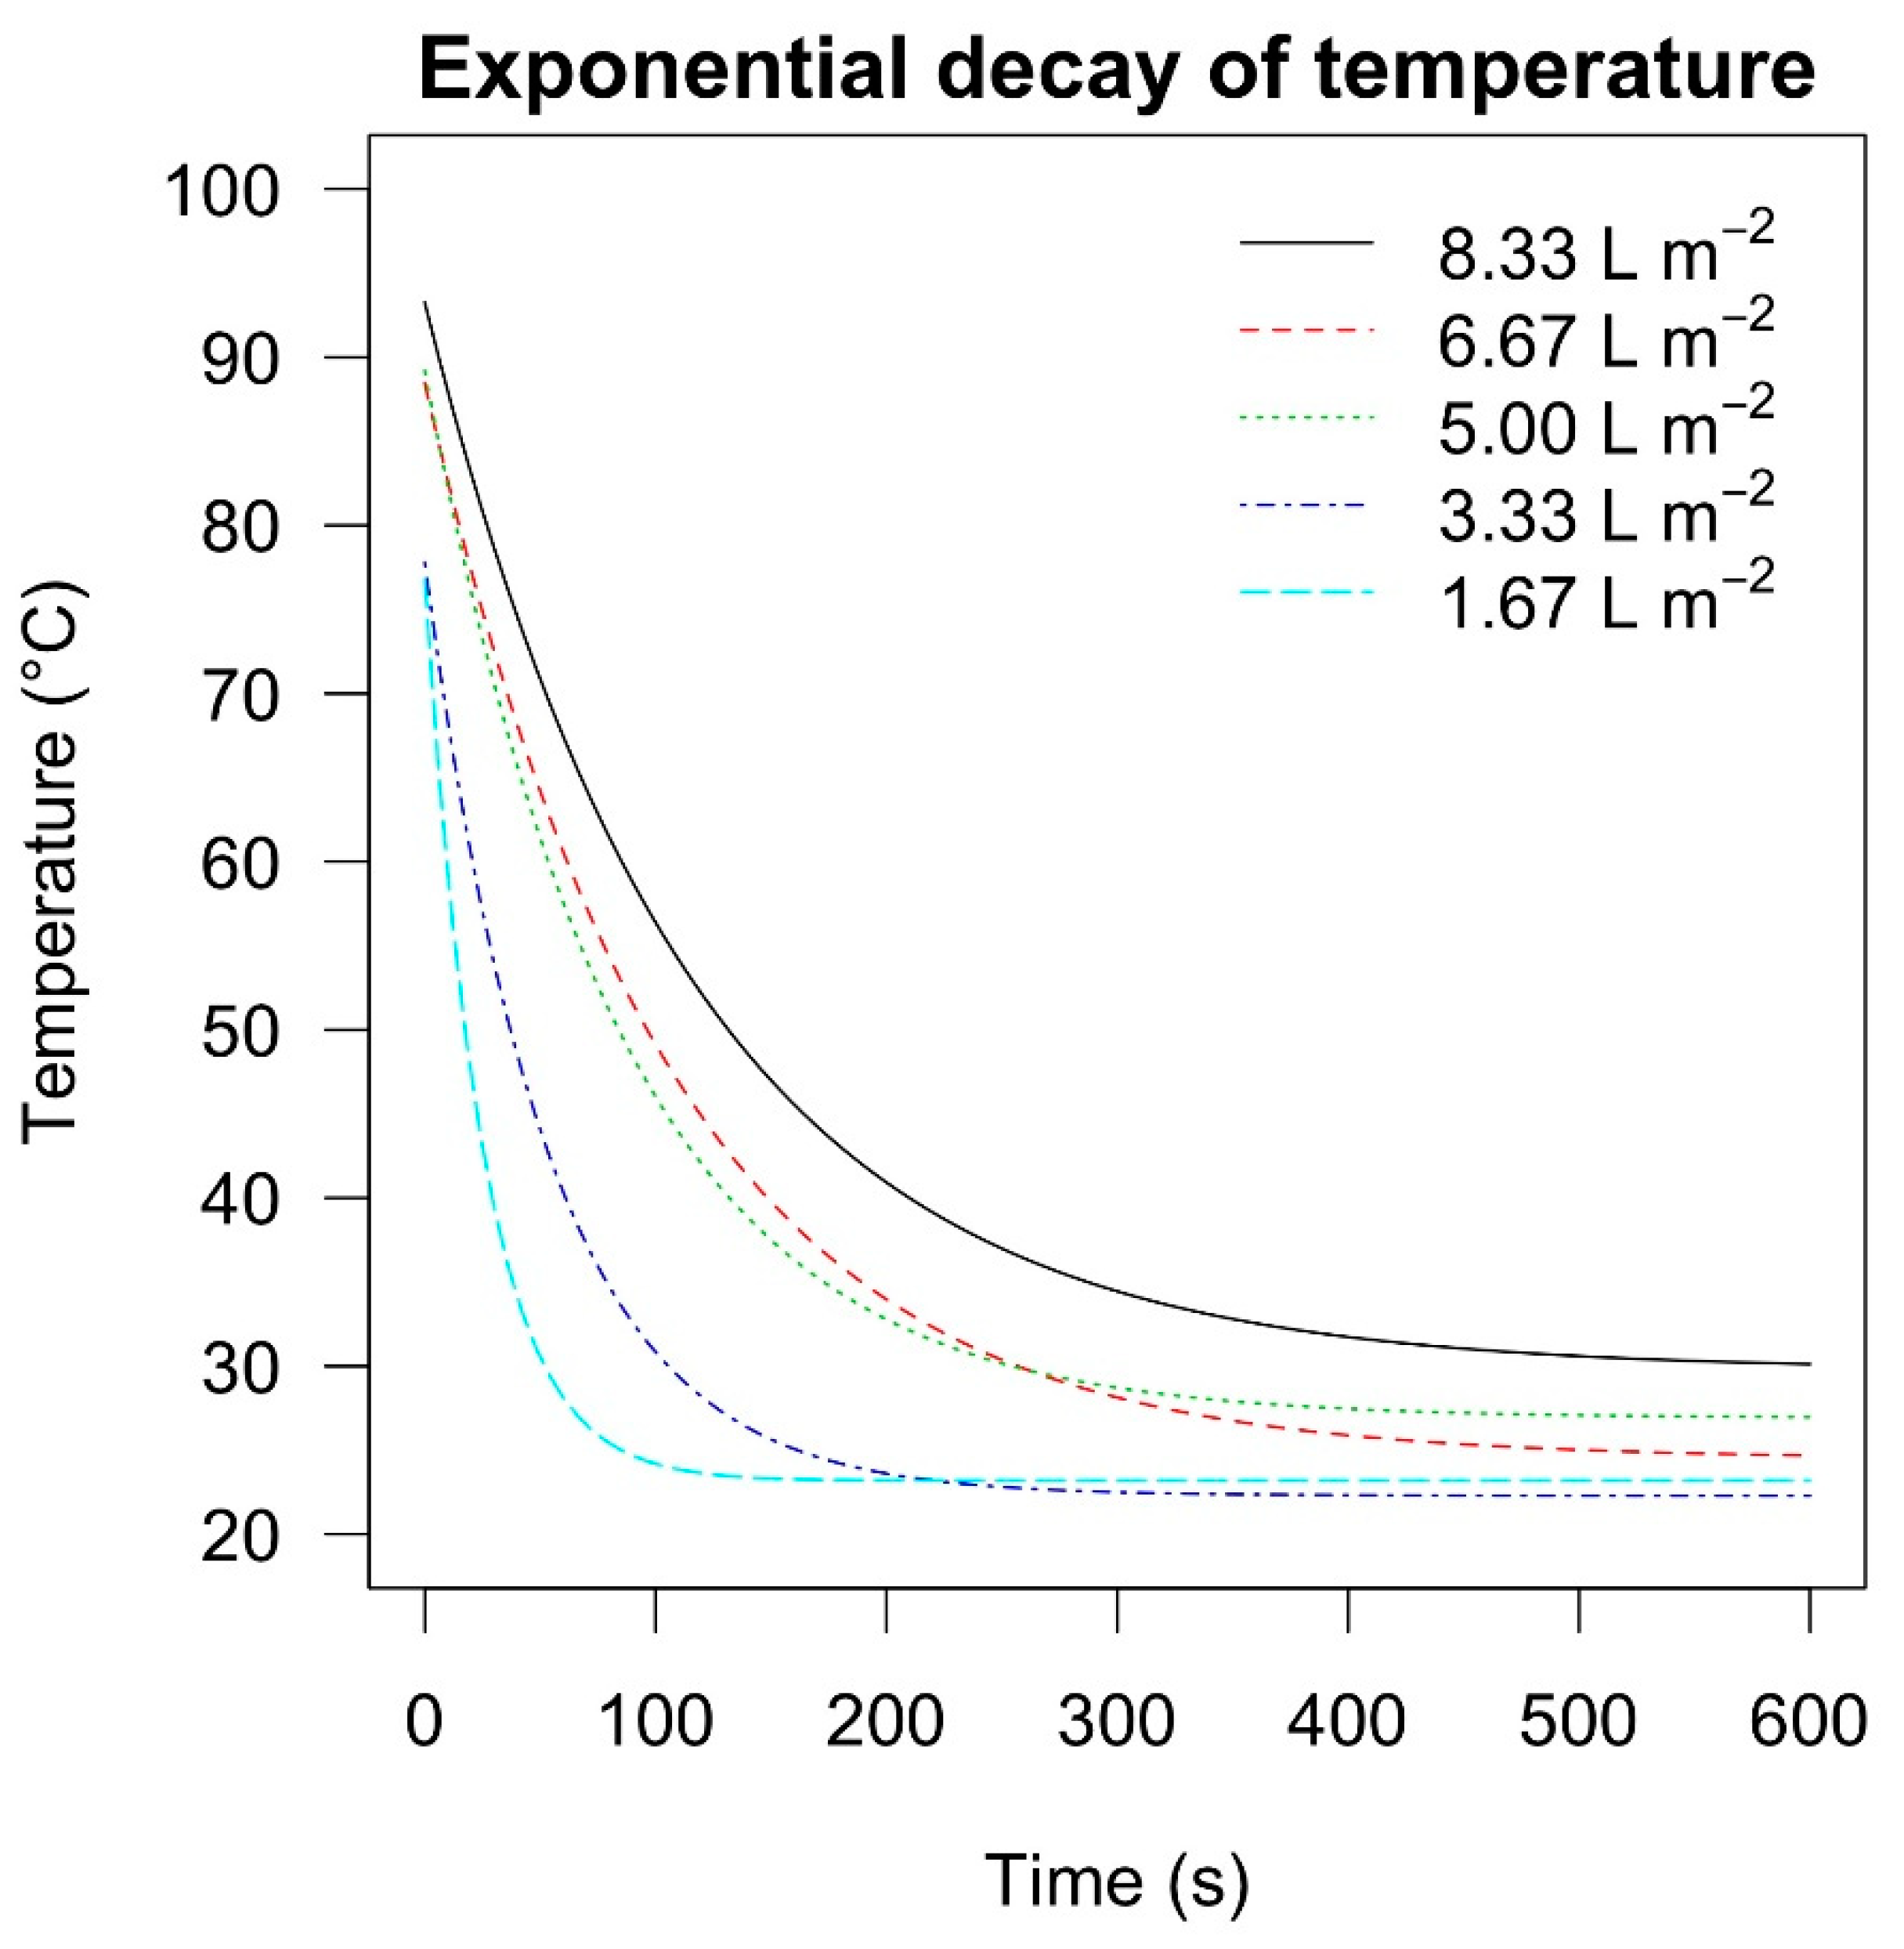
The peak temperatures of the different foam doses and their exponential decay are shown in Figure 2. The parameters of the curves and the time needed for the peaks to reach 70 °C, 60 °C, and 50 °C, respectively, are reported in Table 1. The peak temperatures increased by increasing the foam dose (parameter d, Figure 2), with the 1.67 L m−2 and 3.33 L m−2 doses and the 5.00 L m−2 and 6.67 L m−2 doses resulting in similar peaks, respectively. The peak temperature was the highest with the dose of 8.33 L m−2. The time needed for reaching the temperatures of 70 °C, 60 °C, and 50 °C, respectively, increased significantly with the increase in the foam dose (Table 1).

3.2. Weed Devitalisation

Above-ground weed control was assessed after the application of the hot foam treatments, and was influenced by the foam dose, the evaluation date, the interaction between the two, and the interaction between dose and site in both the Festuca arundinacea (Schreb.) and the Taraxacum officinale (Weber) and Plantago lanceolata (L.) infested field experiments. The p-values resulted from the analysis of variance are reported in Table 2.
The mean values and the standard errors of the weed cover logit transformed one day before and one, two and three days after the treatments in the Festuca arundinacea (Schreb.) infested field experiments are reported in Table 3. The back transformed values and 95% confidence intervals are plotted in Figure 3. The effect of the hot foam was first visible two days after the treatments, and one day after the weed cover was not statistically different from 50% (the original estimate of percentage cover prior to treatment application and in the untreated control) when all foam doses were applied (Table 3, Figure 3).
Two days after the treatments, the foam doses led to a different response in terms of weed control between sites. In site I, all doses from 3.33 L m−2 to 8.33 L m−2 led to a similar 0% weed coverage, whereas the lowest dose (i.e., 1.67 L m−2) led to a significantly higher cover percentage (2% on average with the upper limit at 9%). In site II, the lowest doses (i.e., 1.67 L m−2 and 3.33 L m−2) led to similar weed covers (1–2% on average with the upper limit of the dose being 6% at 1.67 L m2). The weeding effect was 100% (i.e., 0% weed cover) when doses of 5.00, 6.67 L m2 and 8.33 L m2 were used (Table 3, Figure 3).
Three days after the treatments, the effect of the doses was uniform in both sites, with the lowest dose (1.67 L m−2) leading to a significantly higher cover (1% on average with the upper limit at 4% in site I and 3% in site II, respectively), and the other doses resulting in 0% weed cover (Table 3, Figure 3).
The mean values and the standard errors of the weed cover logit transformed one day before and one, two, and three days after the treatments in the Taraxacum officinale (Weber) and Plantago lanceolata (L.) infested field experiments are reported in Table 4. The back transformed values and 95% confidence intervals are plotted in Figure 4. The effect of the hot foam was first visible one day after the treatments, and the highest effect was observable three days after (Table 4, Figure 4).
The foam doses produced different responses in terms of weed control between sites. In site I, one day after the treatments, doses from 1.67 L m−2 to 5.00 L m−2 resulted in the highest upper limits (from 22% to 34%), whereas doses of 6.67 L m−2 and 8.33 L m−2 resulted in upper limits of 14% and 13%, respectively. The weed coverage in the control was 65% on average. Two days after treatment, doses of 1.67 L m−2 and 3.33 L m−2 resulted in a similar level of weed cover (from a lower limit of 5% to an upper limit of 18%). The doses of 5.00 L m−2 and 6.67 L m−2 led to a similar 0.5%–1% weed cover on average, and only the dose of 8.33 L m−2 resulted in 100% weed control (i.e., 0% weed cover). Three days after the treatments the trend was similar, but the upper limits of the doses 1.67 L m−2 and 3.33 L m−2 were lower than two days after treatments (i.e., 6% and 5%, respectively). The other doses resulted in 100% weed control (Table 4, Figure 4).
In site II, one day after the treatments, all doses showed a similar weed cover level (from a lower limit of 7% to an upper limit of 26%). Two days after the treatments, the weed cover was significantly different for all the doses and increased with the foam dose. Three days after treatments, the dose of 1.67 L m−2 led to a significantly higher level of weed cover (5% on average). The other doses led to a weed cover of 0% (Table 4, Figure 4).

3.3. Weed Regrowth

The recorded prevalent weed composition at the start of the experiment in the four field experiments (i.e., Festuca arundinacea (Schreb.), Taraxacum officinale (Weber) and Plantago lanceolata (L.)) did not show any noteworthy shift during regrowth. Thus, the regrowth is that of the prevalent species visual estimated in the sites at the start of the experiments.
The log-logistic regression curves with average points of weed cover percentage, as affected by the foam doses and the evaluation date in the two-site field experiment infested with Festuca arundinacea (Schreb.) are shown in Figure 5. The parameters and standard errors of the regressions and effective times (days) estimated for reaching 10%, 25% and 50% weed cover regrowth, as affected by the different foam doses at different evaluation date, are reported in Table 5.
The time estimated for a weed cover regrowth of 10% was on average 13 days and 12 days in sites I and II, respectively, when a dose of 1.67 L m−2 was used. At 1.67 L m−2, the weed cover never reached 100% devitalisation and started its regrowth from an average weed cover of 1% (parameter c, Table 5). The time for a 10% weed cover regrowth was statistically similar when the doses of 1.67 L m−2 and 3.33 L m−2 were used in both sites. In site I, all doses from 3.33 L m−2 to 8.33 L m−2 reached 10% of weed cover in a similar time, whereas in Site II a significantly highest time of 20 days was estimated when a dose of 8.33 L m−2 was used. In both sites, 25% of weed cover resulted in a similar time with doses of both 1.67 L m−2 and 3.33 L m−2. In site I, doses from 3.33 L m−2 to 8.33 L m−2 led to similar times for the 25% weed cover regrowth, whereas in site II the highest doses (i.e., 6.67 L m−2 8.33 L m−2) showed significantly higher times (i.e., 22–25 days on average) before weeds again covered 25% of the soil. There were no statistical differences between doses needed to reach 50% weed cover, which occurred on average one month after the application of the hot foam at both the sites (Figure 5, Table 5).
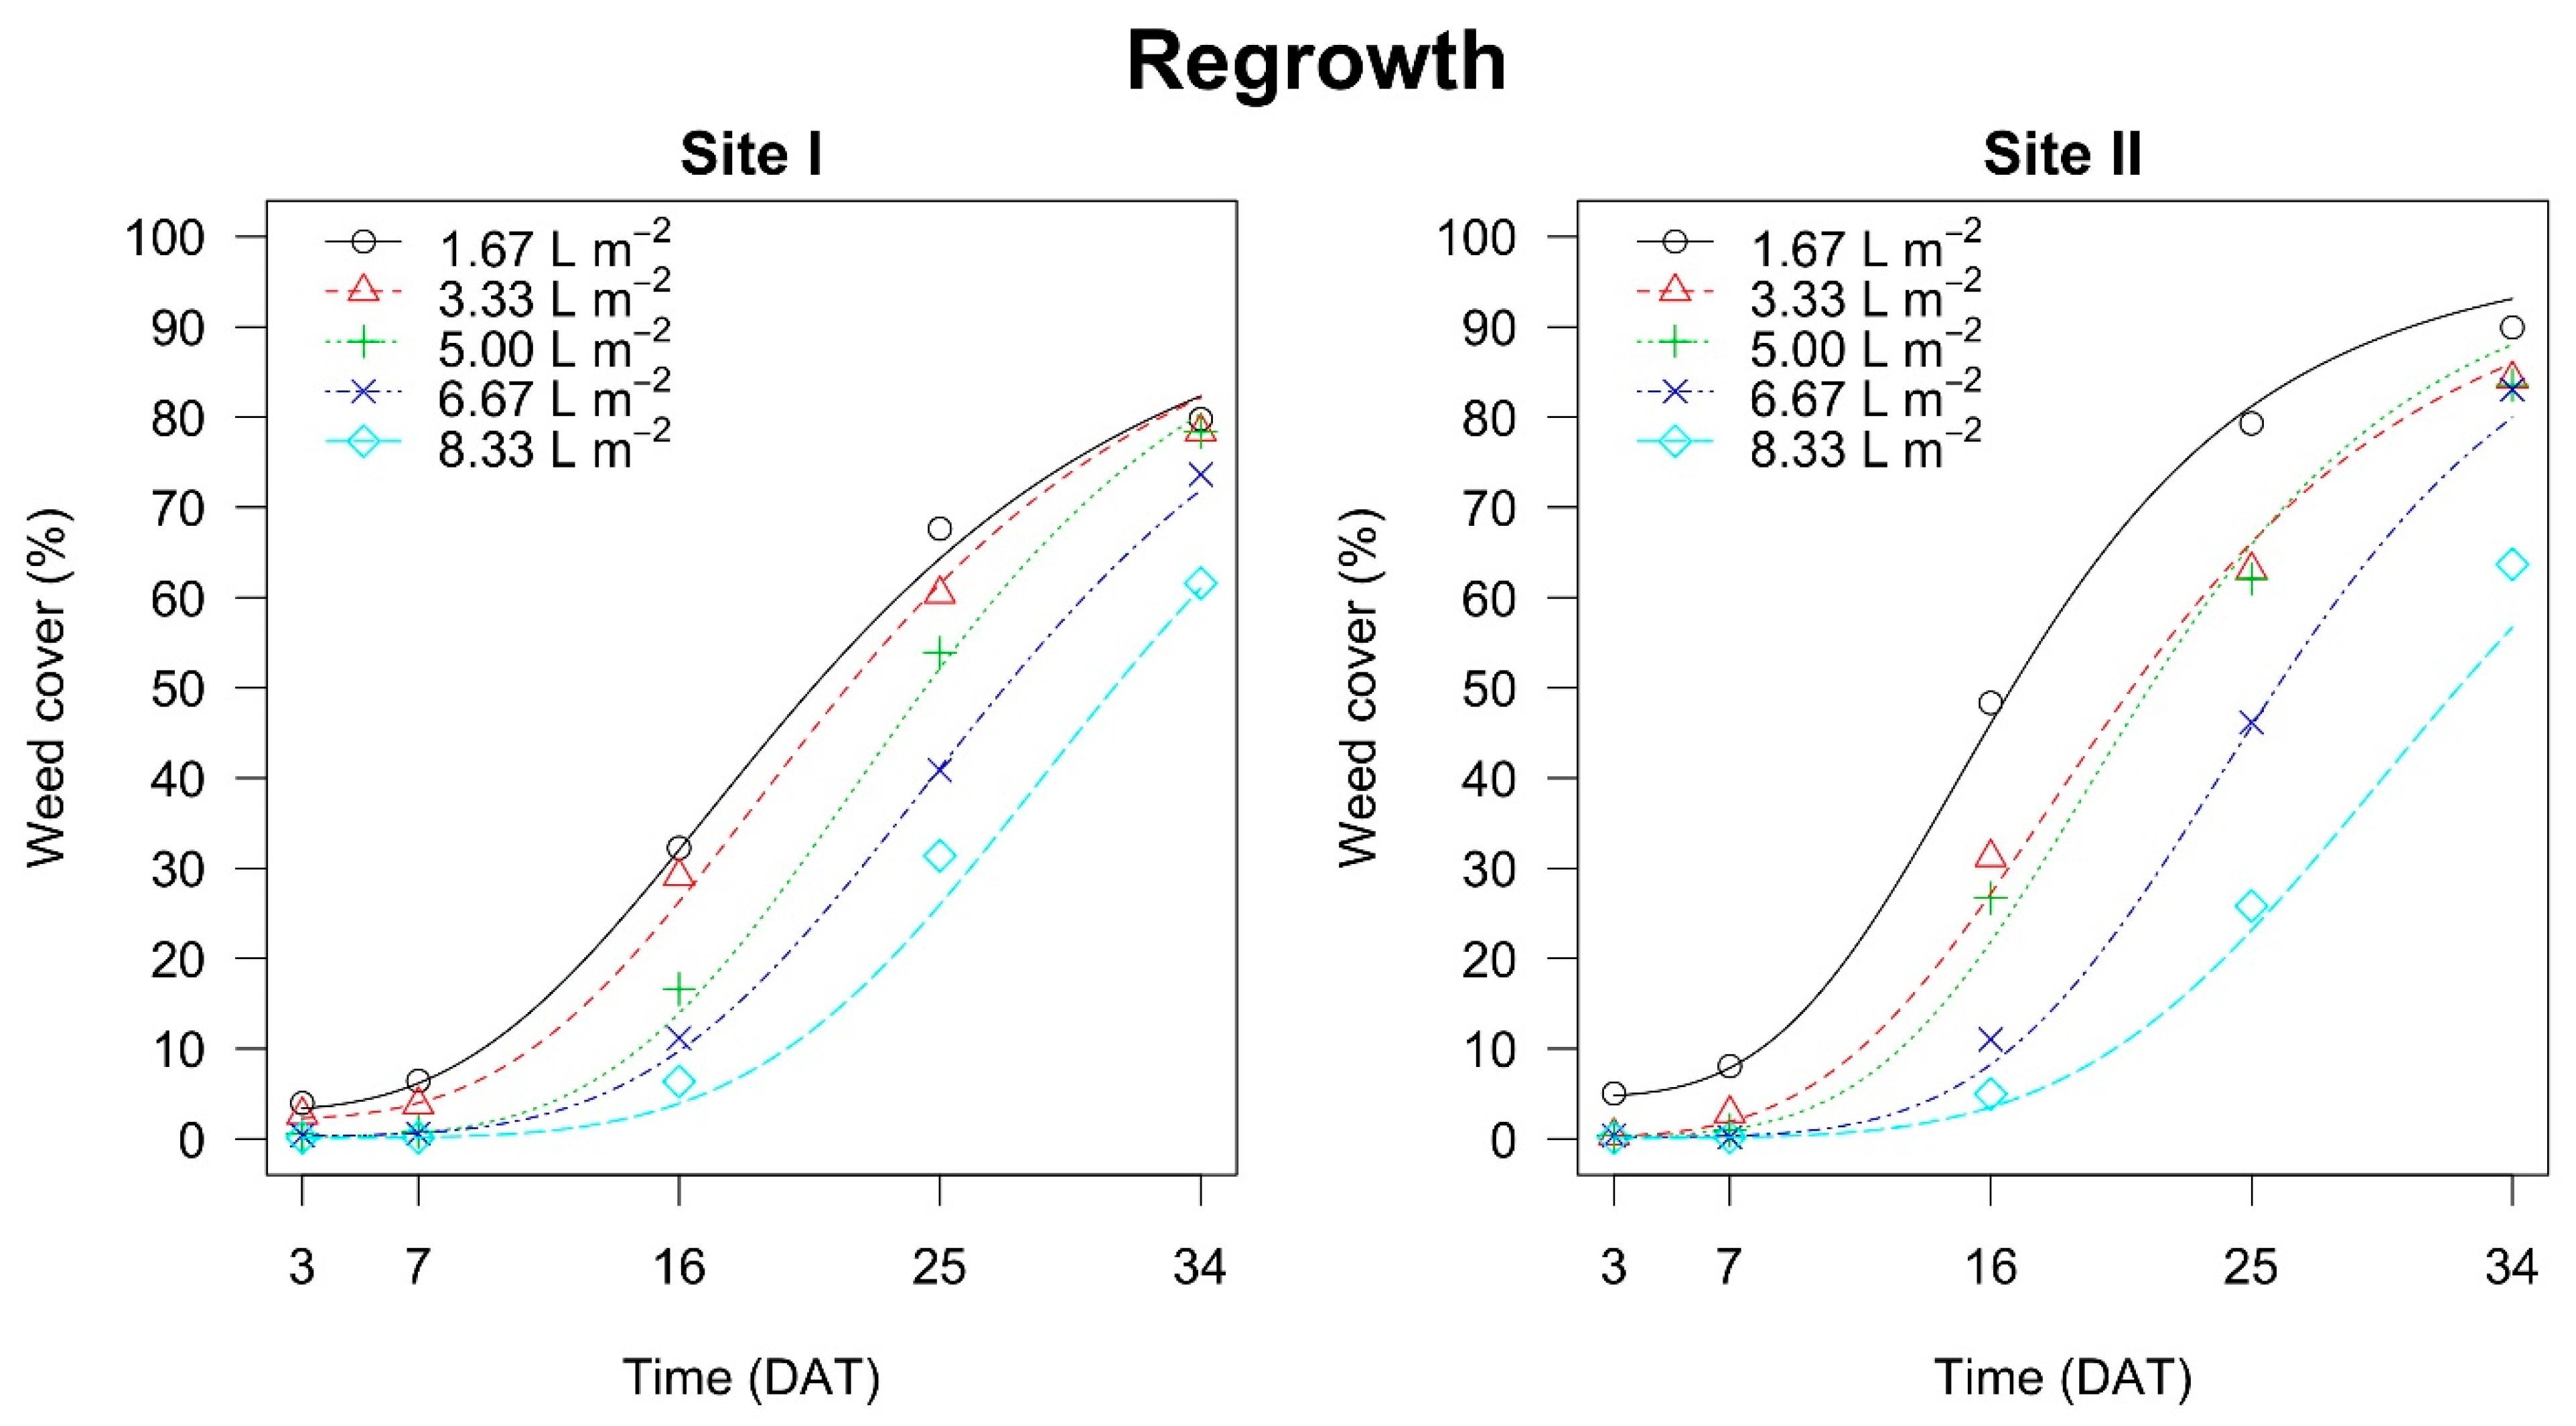
The log-logistic regression curves with average points of weed cover percentage, as affected by the foam doses and the evaluation date in the two-site field experiment infested with Taraxacum officinale (Weber) and Plantago lanceolata (L.), are shown in Figure 6. The parameters and standard errors of the regressions and effective times (days) estimated for reaching the 10%, 25%, and 50% weed cover regrowth as affected by the different foam doses at different evaluation date are reported in Table 6.
In site I, doses of 1.67 L m−2 and 3.33 L m−2 led to similar times estimated for obtaining weed cover regrowth of 10%, 25% and 50%, respectively. These times were significantly lower than those estimated when doses of 5.00 L m−2, 6.67 L m−2 and 8.33 L m−2 were used. The times for reaching 10% (20 days) and 25% (25 days) weed cover were significantly higher when a dose of 8.33 L m−2 was used. A weed cover level of 50% was reached about 10 days earlier when doses of 1.67 L m−2 and 3.33 L m−2 were used than when doses of 6.67 L m−2 and 8.33 L m−2 were used (Figure 6, Table 6).
In site II, the effect of 8.33 L m−2 of hot foam in the weed regrowth process was significantly different and higher than other doses when reaching 10%, 20%, and 50% of weed cover. The doses of 1.67 L m−2 and 3.33 L m−2 were similar only for a weed cover regrowth of 10%, whereas for 25% and 50% weed cover, the dose of 1.67 L m−2 allowed significantly quicker regrowth than the other doses. Doses of 3.33 L m−2 and 5.00 L m−2 led to similar results, whereas when 6.67 L m−2 was used the times needed to reach 10%, 25%, and 50% weed cover were significantly higher than the doses of 1.67 L m−2, 3.33 L m−2 and 5.00 L m−2, but lower than the 8.33 L m−2 dose (Figure 6, Table 6).

3.4. Weed Dry Biomass

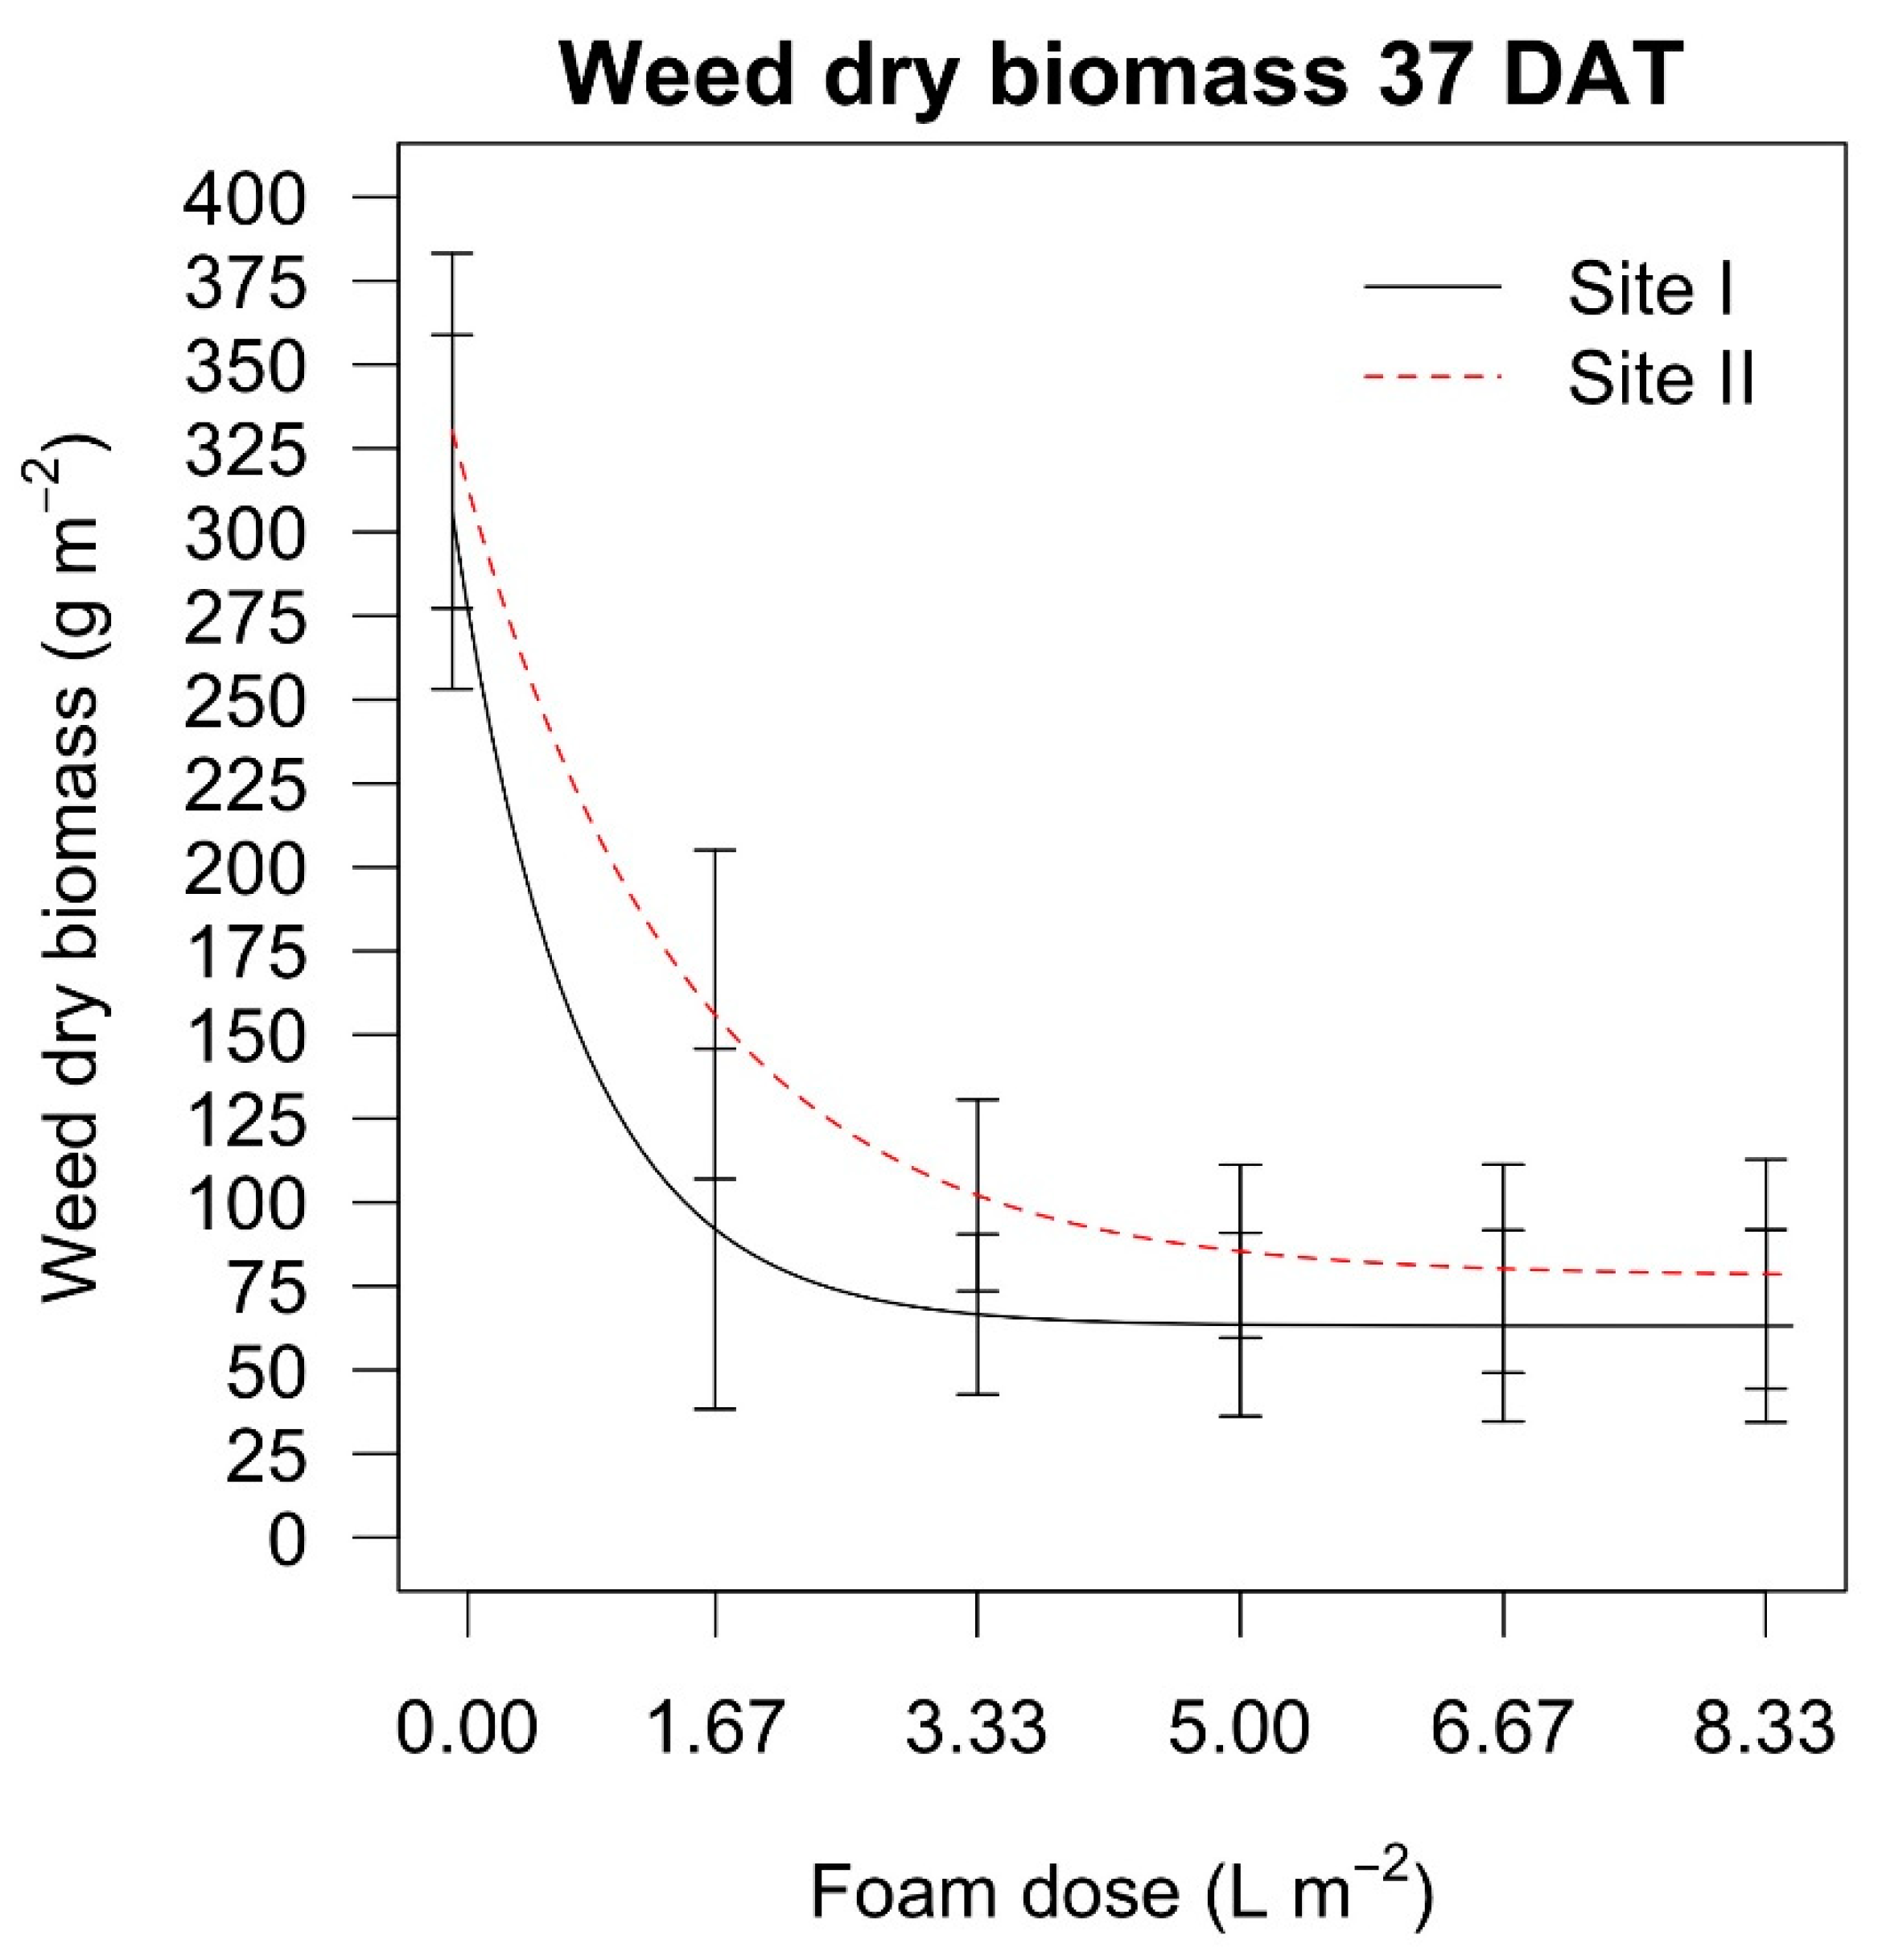
The trend of the weed dry biomass collected 37 days after treatments, as affected by the hot foam dose and the site in the Festuca arundinacea (Schreb.) infested field experiment, is shown in Figure 7. The mean values and standard errors estimated from the exponential decay model are reported in Table 7. In site I, the weed dry biomass of the control was significantly higher than when the hot foam was applied, but all hot foam doses led to similar dry biomass results. In site II, the control was again significantly higher compared to all the hot foam doses, but when the dose of 1.67 L m−2 was applied the dry biomass level was higher compared to doses from 3.33 L m−2 to 8.33 L m−2, which produced similar results.
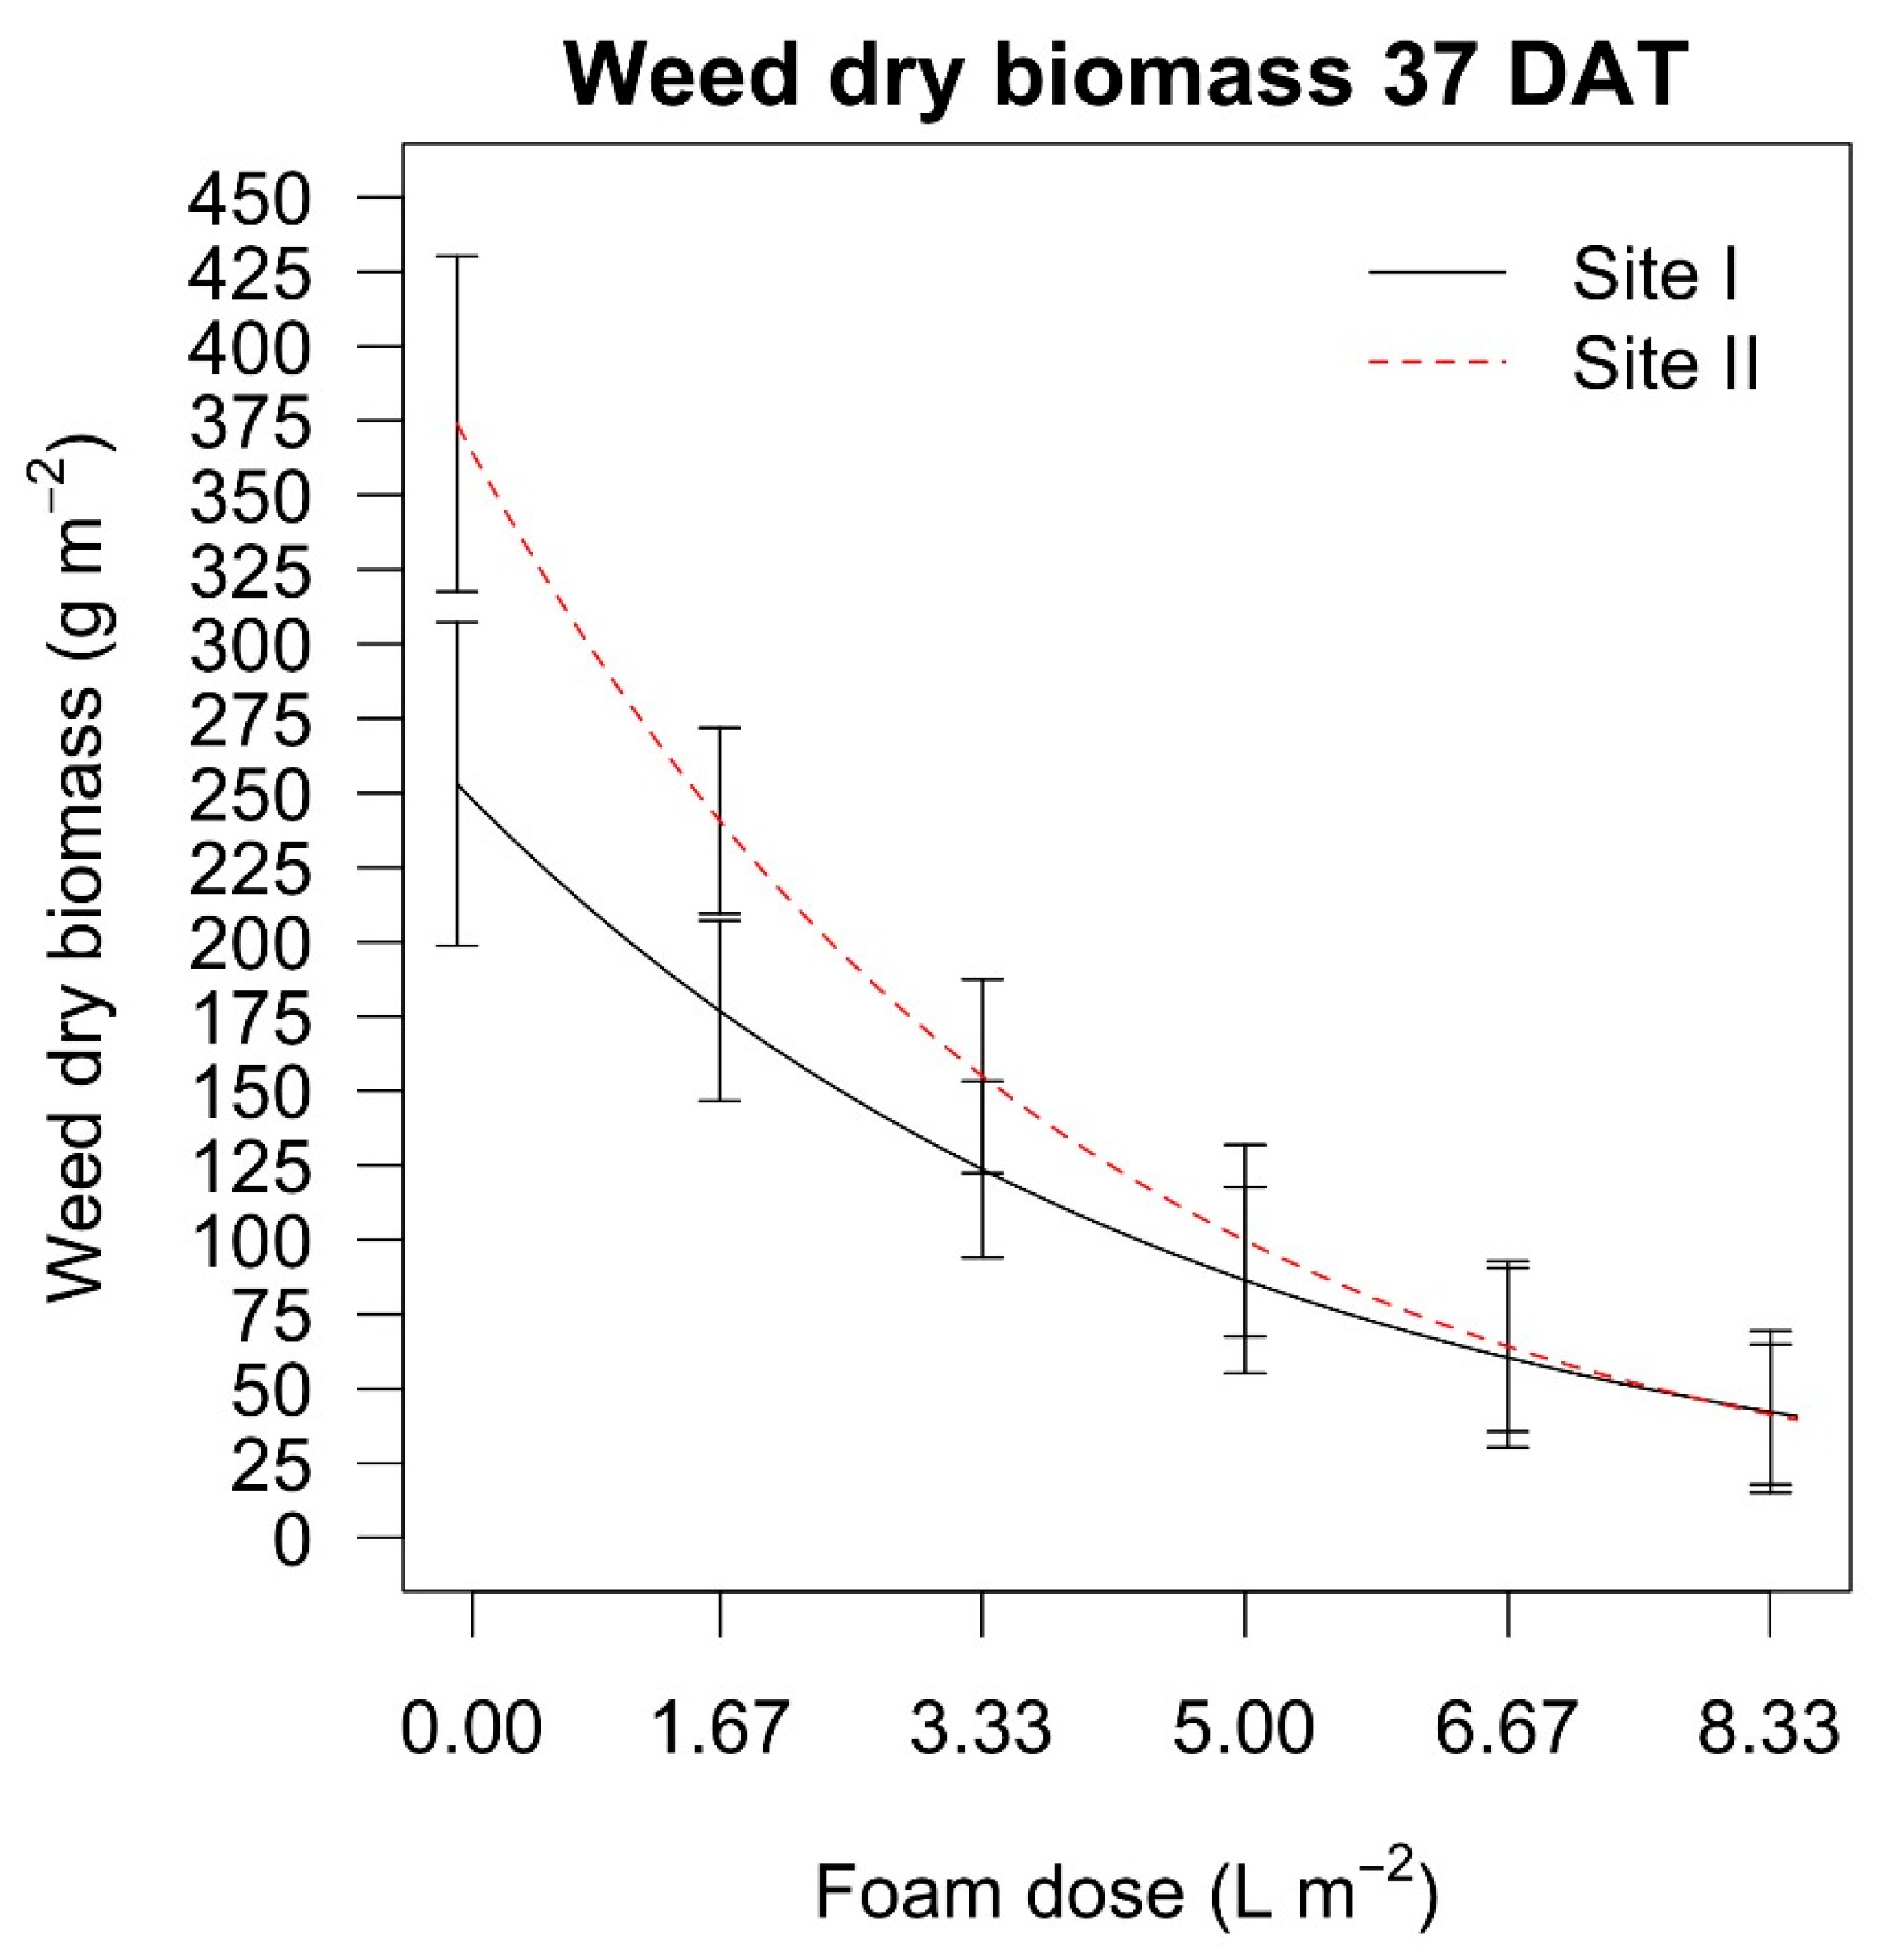
The trend of the weed dry biomass collected 37 days after treatments as affected by the hot foam dose and the site in the Taraxacum officinale (Weber) and Plantago lanceolata (L.) infested field experiment is shown in Figure 8. The mean values and standard errors estimated from the exponential decay model are reported in Table 8. The control showed a significantly higher weed dry biomass in both the sites than with the hot foam doses. In site I, the dry biomass decreased significantly with the increase in foam dose, and the 1.67 L m−2 dose resulted in a significantly higher biomass than the other doses. The doses of 6.67 L m−2 and 8.33 L m−2 led to the lowest dry biomass. Those of 3.33 L m−2 and 5.00 L m−2 resulted in similar levels, as did doses of 5.00 L m−2 and 6.67 L m−2. In site II, the dose of 1.67 L m−2 led to a higher dry biomass than with the other doses. The level of dry biomass with the dose of 3.33 L m−2 was significantly lower with the dose of 1.67 L m−2 but higher than the doses of 5.00 L m−2, 6.67 L m−2 and 8.33 L m−2. The doses of 5.00 L m−2 and 6.67 L m−2 led to similar dry biomass. The lowest biomass was estimated with the doses of 6.67 L m−2 and 8.33 L m−2.

4. Discussion

One day after the hot foam application, the plant structures were not completely denatured, and the green colour persisted in the damaged leaves in all the experiments. Two days after the treatment, some green pigments had not yet brown in both the Festuca arundinacea (Schreb.) and Taraxacum officinale (Weber) and Plantago lanceolata (L.) infested field experiments, although the majority of the leaf structures appeared damaged. The effect of hot foam on weeds was fully visible three days after the application of treatments. The green pigments contained in the damaged weeds took a range from one to three days to turn brown, with a higher number of days at lower foam doses (Table 4 and Table 5). This delay in the desiccation is typical of all thermal weed control applications, such as steam, hot water and flaming, because the heat melts the membrane cuticle of the plant leaves and breaks down the plant cell structures, so the plant is unable to retain moisture and dehydrates within a few hours or days [7]. A desiccation that requires a couple of days is consistent with the range of time observed for desiccation from hot foam.
Three days after the treatments only the 1.67 L m−2 dose did not attain 0% of weed cover for Festuca arundinacea (Schreb.) and in site II for Taraxacum officinale (Weber) and Plantago lanceolata (L.) field experiments. In site I for Taraxacum officinale (Weber) and Plantago lanceolata (L.) the dose of 3.33 L m−2 did not attain 100% weed control (Table 4 and Table 5). Plant response to heat is known to be species-dependent [28]. Weed leaf tissue death requires less heating exposure time when the maximum temperature increases. Both generative and vegetative propagules of most weed species are killed within a temperature range of 60 to 80 °C, and the duration of heating needed to reach mortality is determined by the thermal conductivity (e.g., higher with water than with gasses) and the maximum temperature reached (a high temperature can be effective within seconds) [1]. As temperature increased linearly, the measurements show that the heat-killing time decreases exponentially [29].
The highest maximum peak temperature (93 °C) estimated at the highest foam dose (i.e., 8.33 L m−2) led to 100% weed devitalisation (0% of weed cover), and likewise, doses of 3.33 L m−2, 5.00 L m−2, and 6.67 L m−2 in both sites of the the Festuca arundinacea (Schreb.) and site II of Taraxacum officinale (Weber) and Plantago lanceolata (L.) field experiments, whereas the maximum temperatures estimated at the lowest dose (i.e., 1.67 L m−2) provided a significantly higher level of weed cover percentage. This suggests that the average peak temperature of 77 °C (obtained with the dose of 1.67 L m−2), and the temperatures of 70 °C, 60 °C and 50 °C, reached after 3 s, 9 s and 17 s, respectively, were not enough to completely desiccate these weed species (Table 1). Instead, an average peak temperature of 78 °C, and temperatures of 70 °C, 60 °C, and 50 °C, reached after 8 s, 21 s, and 37 s, respectively, obtained 100% of weed control (Table 1). However, these temperatures did not result in 100% of weed devitalisation in site I with Taraxacum officinale (Weber) and Plantago lanceolata (L.), where the average peak temperature was 89 °C (obtained with the dose of 5.00 L m−2), and temperatures of 70 °C, 60 °C, and 50 °C reached after 31 s, 54 s and 84 s, respectively, were needed to obtain 100% weed control (Table 1).
The analysis of the effect of doses on weed cover regrowth and weed dry biomass at the end of the experiment enabled an evaluation of whether the higher hot foam doses damaged not only the leaves, but also the protected meristems, which are typical of grasses and perennial weeds such as Festuca arundinacea (Schreb.), Taraxacum officinale (Weber), and Plantago lanceolata (L.) [8]. Most weeds with protected meristems will regrow after a single hot water treatment [13], and a delay in the regrowth of the studied weed species may suggest higher injury at the meristem level.
In both the Festuca arundinacea (Schreb.) field experiment sites the effect of the higher hot foam doses only exhibited a significant delay when attaining 10% and 25% weed cover, whereas after about 30 days all doses again attained 50% weed cover. In site II, with the Taraxacum officinale (Weber) and Plantago lanceolata (L.) field, the highest dose (i.e., 8.33 L m−2) significantly delayed the regrowth of weeds (10%, 25% and 50%, respectively), compared to the other doses, probably because the temperatures recorded when this dose was used was more effective in damaging the meristems of these weed species than those at lower doses. In site I, the effect of the highest dose on weed regrowth when reaching 10% and 25% of weed cover was the same as in site II, whereas the time for reaching 50% of weed cover was similar for doses of 6.67 L m−2 and 8.33 L m−2 (Table 6 and Table 7).
When lower hot foam doses where used, regrowth was faster for the Taraxacum officinale (Weber) and Plantago lanceolata (L.) than for the Festuca arundinacea (Schreb.) infested fields (Table 6 and Table 7), probably because the former two have prostrate and large leaves with creeping stems, and if their meristems are less injured by lower temperatures, they may contribute to a higher coverage than a grassy weed [13]. This effect was not observable with the highest doses, where the times of regrowth were similar between species.
The dry weed biomass 37 days after the treatments in the Festuca arundinacea (Schreb.) infested field experiment was higher only in site II when the dose of 1.67 L m−2 was applied, whereas the other doses led to similar biomasses. In the Taraxacum officinale (Weber) and Plantago lanceolata (L.) infested field experiment the effect of the hot foam dose was more marked than for the grassy species, and the dry biomass decreased when increasing the dose (Table 8).
The highest estimated time needed for weeds to regrow and provide 50% soil cover was on average 30 days. This time was estimated for all hot foam doses in the Festuca arundinacea (Schreb.) infested fields, and for the doses of 6.67 L m−2 and 8.33 L m−2 in site I and 8.33 L m−2 in site II in the Taraxacum officinale (Weber) and Plantago lanceolata (L.) infested field. One month for 50% of weed regrowth in an open field study is a long time, considering that the weeds came from a real infested field (not seeded or transplanted in pots before the application of the hot foam), and thus the weeds had developed roots in ideal conditions. A window of 30 days before a weed cover regrowth of 50% is sufficient to guarantee a competitive advantage against weeds for a transplanted plant. Thus, hot foam may have the potential for future use not only in urban areas and railways (where its application is common in north European countries such as Sweden) [2,12], but also as a desiccant for controlling weeds in no-till soil bands before the transplant of high-income vegetable crops.
5. Conclusions

The efficiency of hot foam for controlling weeds depends on the dose used and the weed species treated. A 100% devitalisation of Festuca arundinacea (Schreb.) was obtained at all foam doses except for the lowest (i.e., 1.67 L m−2). The dry biomass was higher when a dose of 1.67 L m−2 was used compared to other doses, and the regrowth was similar between doses. Thus, in the Festuca arundinacea (Schreb.) field experiments hot foam doses from 3.33 L m−2 to 8.33 L m−2 were effective in controlling weeds, and the use of the lowest dose (i.e., 3.33 L m−2) is recommended. However, for Taraxacum officinale (Weber) and Plantago lanceolata (L.) the highest doses are recommended (i.e., 6.67 L m−2 and 8.33 L m−2), as these led to 100% weed devitalisation, slower regrowth and lower weed dry biomass than other doses. With a 30-day delay in the regrowth of weeds, hot foam could be used as desiccant in no-till field bands before the transplant of high-income vegetable crops, to provide a competitive advantage to the crop against weeds. Sensor-based technology and navigation systems could help to reduce the areas where hot foam is actually needed, and it could be applied along the crop rows before the transplant.

Author Contributions

Conceptualization, L.M., C.F., M.S., M.F., M.R. and A.P.; methodology, L.M., C.F., M.S., M.F., M.R. and A.P.; validation, L.M., C.F., M.S., M.F., M.R. and A.P.; investigation, L.M., C.F., M.S., M.F., M.R. and A.P.; resources, L.M., C.F., M.S., M.F., M.R. and A.P.; data collection, L.M., C.F., and M.S.; data analysis, L.M.; writing—original draft preparation, L.M. and C.F.; writing—review and editing, L.M. and C.F.; visualization, L.M., C.F., M.S., M.F., M.R. and A.P.; supervision, L.M., C.F., M.S., M.F., M.R. and A.P.; project administration, L.M., C.F., M.F., and A.P.

Funding

This research received no external funding.

Acknowledgments

This study was self-financed by the Department of Agriculture, Food and Environment of the University of Pisa (Pisa, Italy). The authors would like to thank Cosmin User, Franck Balducchi and Edward Cutler from the Weedingtech Ltd. that provided the hot foam machine and technical support; Lorenzo Greci and Romano Zurrida from the Department of Agriculture, Food and Environment of University of Pisa for their technical support.

Conflicts of Interest

The authors declare no conflicts of interest.

References

  1. Melander, B.; Liebman, M.; Davis, A.S.; Gallandt, E.R.; Bàrberi, P.; Moonen, A.C.; Rasmussen, J.; van der Weide, R.; Vidotto, F. Non-chemical weed management. Thermal weed control. In Weed Research: Expanding Horizons; Hatcher, P.E., Froud-Williams, R.J., Eds.; John Wiley & Sons Ltd.: Hoboken, NJ, USA, 2017; pp. 259–264. [Google Scholar]
  2. Cederlund, H.; Börjesson, E. Hot foam for weed control—Do alkyl polyglucoside surfactants used as foaming agents affect the mobility of organic contaminants in soil? J. Hazard. Mater. 2016, 314, 312–317. [Google Scholar] [CrossRef] [PubMed]
  3. Martelloni, L.; Fontanelli, M.; Frasconi, C.; Raffaelli, M.; Pirchio, M.; Peruzzi, A. A combined flamer-cultivator for weed control during the harvesting season of asparagus green spears. Span. J. Agric. Res. 2017, 15, e0203. [Google Scholar] [CrossRef]
  4. Martelloni, L.; Fontanelli, M.; Frasconi, C.; Raffaelli, M.; Peruzzi, A. Cross-flaming application for intra-row weed control in maize. Appl. Eng. Agric. 2016, 32, 569–578. [Google Scholar]
  5. Raffaelli, M.; Martelloni, L.; Frasconi, C.; Fontanelli, M.; Peruzzi, A. Development of machines for flaming weed control on hard surfaces. Appl. Eng. Agric. 2013, 29, 663–673. [Google Scholar]
  6. Raffaelli, M.; Martelloni, L.; Frasconi, C.; Fontanelli, M.; Carlesi, S.; Peruzzi, A. A prototype band-steaming machine: Design and field application. Biosyst. Eng. 2016, 144, 61–71. [Google Scholar] [CrossRef] [Green Version]
  7. Peerzada, A.M.; Chauhan, B.S. Chapter 2. Thermal Weed Control: History, Mechanisms, and Impacts. In Non-Chemical Weed Control; Jabran, K., Chauhan, B.S., Eds.; Elsevier: London, UK, 2018; pp. 9–31. [Google Scholar]
  8. Kup, F.; Saglam, R. Weed destruction in cotton fields using hot foam method and its comparison to certain other methods. ARPN J. Agric. Biol. Sci. 2014, 9, 301–307. [Google Scholar]
  9. Rajamannan, A.H.J. Method of Using Hot Air Foam to Kill Vegetation and Pests. U.S. Patent No. 5,575,111, 19 November 1996. [Google Scholar]
  10. Wei, D.; Liping, C.; Zhijun, M.; Guangwei, W.; Ruirui, Z. Review of non-chemical weed management for green agriculture. Int. J. Agric. Biol. Eng. 2010, 3, 52–60. [Google Scholar]
  11. De Cauwer, B.; Bogaert, S.; Claerhout, S.; Bulcke, R.; Reheul, D. Efficacy and reduced fuel use for hot water weed control on pavements. Weed Res. 2014, 55, 195–205. [Google Scholar] [CrossRef]
  12. Boonen, E.; Beeldens, A.; Fagot, M.; De Cauwer, B.; Reheulc, D.; Bulcke, R. Preventive Weed Control on Pavements: Reducing the Environmental Impact of Herbicides Part 1: A Field Survey Study. In Proceedings of the 10th International Conference on Concrete Block Paving, Shanghai, China, 24–26 November 2012; pp. 1–14. [Google Scholar]
  13. Melander, B.; Holst, N.; Grundy, A.C.; Kempenaar, C.; Riemens, M.M.; Verschwele, A.; Hansson, D. Weed occurrence on pavements in five North European towns. Weed Res. 2009, 49, 516–525. [Google Scholar] [CrossRef]
  14. Hess, M.; Barralis, G.; Bleiholder, H.; Buhr, L.; Eggers, T.H.; Hack, H.; Stauss, R. Use of the extended BBCH scale-general for the description of the growth stages of mono- and dicotyledonous weed species. Weed Res. 1997, 37, 433–441. [Google Scholar] [CrossRef]
  15. Weedingtech. Foamstream M1200; Weedingtech: London, UK, 2019; Available online: https://www.weedingtech.com/product/foamstream-m1200/ (accessed on 17 July 2019).
  16. Weedingtech. Our Technology; Weedingtech: London, UK, 2019; Available online: https://www.weedingtech.com/why-foamstream/our-technology/ (accessed on 17 July 2019).
  17. Nesbit, M.; Fergusson, M.; Colsa, A.; Ohlendorf, J.; Hayes, C.; Paquel, K.; Schweitzer, J.P. Comparative Study on the Differences between the EU and US Legislation on Emissions in the Automotive Sector; European Parliament: Brussel, Belgium, 2016; Available online: http://www.europarl.europa.eu/RegData/etudes/STUD/2016/587331/IPOL_STU(2016)587331_EN.pdf (accessed on 17 July 2019).
  18. PCE Group. PCE-T390 Digital Thermometer; PCE Group: Southampton, UK, 2019; Available online: https://www.industrial-needs.com/technical-data/digital-thermometer-PCE-T390.html (accessed on 17 July 2019).
  19. IMAGING Crop Response Analyser. Ver. 0.4. 2018. Available online: http://imaging-crops.dk (accessed on 17 July 2019).
  20. Rasmussen, J.; Norremark, M.; Bibby, B.M. Assessment of leaf cover and crop soil cover in weed harrowing research using digital images. Weed Res. 2007, 47, 299–310. [Google Scholar] [CrossRef] [Green Version]
  21. R Core Team. R: A Language and Environment for Statistical Computing; R Foundation for Statistical Computing: Vienna, Austria, 2016; Available online: https://www.R-project.org/ (accessed on 17 July 2019).
  22. Kuznetsova, A.; Brockhoff, P.B.; Christensen, R.H.B. lmerTest: Tests in Linear Mixed Effects Models. R Package Version 2.0−32. 2016. Available online: https://CRAN.R-project.org/package=lmerTest (accessed on 17 July 2019).
  23. Wickham, H. ggplot2: Elegant Graphics for Data Analysis, 3rd ed.; Springer: New York, NY, USA, 2009. [Google Scholar]
  24. Seber, G.A.F.; Wild, C.J. Nonlinear Regression; Wiley & Sons: New York, NY, USA, 1989; p. 330. [Google Scholar]
  25. Organisation for Economic Co-operation and Development (OECD). Current Approaches in the Statistical Analysis of Ecotoxicity Data: A Guidance to Application–Annexes; OECD: Paris, France, 2006; p. 80. [Google Scholar]
  26. Ritz, C.; Baty, F.; Streibig, J.C.; Gerhard, D. Dose-response analysis using R. PLoS ONE 2015, 10, e0146021. [Google Scholar] [CrossRef] [PubMed]
  27. Knezevic, A. Overlapping Confidence Intervals and Statistical Significance. 2008. Available online: https://www.cscu.cornell.edu/news/statnews/stnews73.pdf (accessed on 17 July 2019).
  28. Ascard, J. Effects of flame weeding on weed species at different developmental stages. Weed Res. 1995, 35, 397–411. [Google Scholar] [CrossRef]
  29. Levitt, J. Responses of Plants to Environmental Stresses; Water, Radiation, Salt, and Other Stresses; Academic Press: London, UK, 1980; Volume II, p. 607. [Google Scholar]
Figure 1. Hot foam machine: (a) lateral view of the machine with the 1000 L water container, the 300 mm wide manual foam hot foam distribution tool, and the covered part containing the foam container, the boiler, the programmable logic controller, the pump and the diesel generator set; (b) hot foam distribution tool and example of a hot foam layer.
Agronomy 09 00490 g001
Figure 2. Exponential decay curves of temperature as affected by the foam dose (0, 1.67, 3.33, 5.00, 6.67, and 8.33 L m−2) and by the passage of time. The parameters of the non-linear regression are reported in Table 1.
Agronomy 09 00490 g002
Figure 3. Devitalisation (i.e., from hot foam application to death of weeds) bar graph of back transformed means (Table 3) and the 95% confidence interval of weed cover percentage as affected by the foam dose (0, 1.67, 3.33, 5.00, 6.67, 8.33 L m−2), the site and the evaluation date in the Festuca arundinacea (Schreb.) infested field experiment; 1 DBT, 1 DAT, 2 DAT and 3 DAT: one day before and one, two and three days after the treatment, respectively.
Agronomy 09 00490 g003
Figure 4. Devitalisation (i.e., from hot foam application to death of weeds) bar graph of back transformed means (Table 4) and the 95% confidence interval of weed cover percentage as affected by the foam dose (0, 1.67, 3.33, 5.00, 6.67, 8.33 L m−2), the site and the evaluation date in the Taraxacum officinale (Weber) and Plantago lanceolata (L.) infested field experiment; 1 DBT, 1 DAT, 2 DAT and 3 DAT: one day before and one, two and three days after the treatment, respectively.
Agronomy 09 00490 g004
Figure 5. Log-logistic regression curves with average points of weed cover percentage as affected by the foam dose (0, 1.67, 3.33, 5.00, 6.67, and 8.33 L m−2, respectively) and the evaluation date in the two-site field experiment infested with Festuca arundinacea (Schreb.). DAT: days after the treatment. The parameters of the non-linear regression curves (Equation (1)) are reported in Table 5. Regrowth was from weeds death (i.e., three days after hot foam application) to one month after death.
Agronomy 09 00490 g005
Figure 6. Log-logistic regression curves with average points of weed cover percentage as affected by the foam dose (0, 1.67, 3.33, 5.00, 6.67 and 8.33 L m−2, respectively) and the evaluation date in the two-site field experiment infested with Taraxacum officinale (Weber) and Plantago lanceolata (L.). DAT: days after the treatment. The parameters of the non-linear regression curves (Equation (1)) are reported in Table 6. Regrowth was from weeds death (i.e., three days after hot foam application) to one month after death.
Agronomy 09 00490 g006
Figure 7. Exponential decay curves with 95% confidence interval bars of weed dry biomass collected 37 days after the treatment (37 DAT) as affected by the foam dose (0, 1.67, 3.33, 5.00, 6.67 and 8.33 L m−2, respectively) and the site in the Festuca arundinacea (Schreb.) infested field experiment. The parameters and standard errors of the non-linear regression curves (Equation (2)) are: c = 63.13 (±14.09) and 77.89 (±17.79) for Site I and II, respectively; d = 305.98 (±25.88) and 330.24 (±25.94) for Site I and II, respectively; e = 0.80 (±0.33) and 1.42 (±0.50) for Site I and II, respectively.
Agronomy 09 00490 g007
Figure 8. Exponential decay curves with 95% confidence interval bars of weed dry biomass collected 37 days after the treatment (37 DAT) as affected by the foam dose (0, 1.67, 3.33, 5.00, 6.67 and 8.33 L m−2, respectively) and the site in the Taraxacum officinale (Weber) and Plantago lanceolata (L.) infested field experiment. The parameters and standard errors of the non-linear regression curves (Equation (3)) are: d = 253.02 (±26.659) and 373.88 (±27.614) for Site I and II, respectively; e = 4.66 (±0.957) and 3.78 (±0.543) for Site I and II, respectively.
Agronomy 09 00490 g008
Table 1. Parameters of the exponential decay model (Equation (2)) and effective times (s) estimated for reaching the temperatures of 70 °C, 60 °C, and 50 °C (ET70, ET60, and ET50, respectively) as affected by the different foam doses and the passage of time. The non-linear regression curves are plotted in Figure 2.
Foam Dose (L m−2)Parameters (±SE)Effective times (s) (±SE)
cdeET70ET60ET50
1.6723.18 (0.114)76.80 (0.900)25.19 (0.703)3.42 (0.095)9.47 (0.264)17.45 (0.487)
3.3322.30 (0.076)77.79 (0.582)53.41 (0.922)8.08 (0.139)20.64 (0.356)37.10 (0.640)
5.0026.91 (0.079)89.21 (0.454)84.65 (1.049)31.20 (0.387)53.56 (0.664)84.02 (1.041)
6.6724.48 (0.076)88.47 (0.406)104.80 (1.144)35.70 (0.390)61.69 (0.674)96.34 (1.052)
8.3329.78 (0.094)93.27 (0.392)114.97 (1.297)52.47 (0.592)85.33 (0.962)131.52 (1.483)
c is the temperature for time going to infinity; d is the temperature at time 0 s (e.g., peak temperature); e is the steepness of the decay; SE is the standard error.
Table 2. Weed cover devitalisation (i.e., from hot foam application to death of weeds) Type III analysis of variance with Satterthwaite’s method resulting from the linear mixed model where the foam dose (0, 1.67, 3.33, 5.00, 6.67, 8.33 L m−2), the evaluation date (one day before and one, two and three days after the treatment) and the site (I and II) were used as fixed factors in the Festuca arundinacea (Schreb.) and Taraxacum officinale (Weber) and Plantago lanceolata (L.) infested field experiments. Significant p-values are italicized.
F. arundinacea (Schreb.) Fields T. officinale (Weber) and P. lanceolata (L.) Fields
p-Valuep-Value
Dose<0.001<0.001
Date<0.001<0.001
Site0.7060.569
Dose:Date<0.001<0.001
Dose:Site0.0430.001
Date:Site0.9820.379
Dose:Date:Site0.7360.002
Table 3. Least squares means and standard error s (SE) of weed cover percentage logit transformed as affected by the foam dose, the site, and the evaluation date (one day before and one, two and three days after treatments) in the Festuca arundinacea (Schreb.) infested field experiment.
Foam Dose (L m−2)Logit [Weed Cover (%)] (±SE)
Site I
1 DBT1 DAT2 DAT3 DAT
0.000.02 (0.521) *0.05 (0.494) *0.12 (0.488) *0.17 (0.486) *
1.670.02 (0.540) *−0.93 (0.496) *−3.91 (0.558)−4.66 (0.547)
3.33−0.14 (0.484) *−0.78 (0.496) *−6.30 (0.558)−7.75 (0.547)
5.000.21 (0.496) *−0.79 (0.525) *−6.77 (0.614)−6.97 (0.598)
6.670.18 (0.553) *−0.63 (0.604) *−6.43 (0.719)−7.33 (0.701)
8.330.31 (0.489) *−0.87 (0.511) *−5.59 (0.588)−6.36 (0.575)
Site II
0.00−0.32 (0.636) *−0.09 (0.580) *−0.07 (0.505) *0.05 (0.514) *
1.67−0.15 (0.486) *−0.64 (0.497) *−3.94 (0.565)−4.56 (0.549)
3.330.34 (0.526) *−0.60 (0.497) *−5.28 (0.486)−6.34 (0.485)
5.000.40 (0.494) *−0.76 (0.483) *−6.01 (0.509)−6.56 (0.501)
6.670.12 (0.485) *−0.71 (0.503) *−5.51 (0.575)−6.54 (0.562)
8.330.61 (0.506) *−0.90 (0.487) *−7.35 (0.496)−7.77 (0.492)
* These values are not statistically different from 0, meaning that the weed cover percentage is not statistically different from 50%; 1 DBT, 1 DAT, 2 DAT and 3 DAT: one day before and one, two and three days after the treatments, respectively.
Table 4. Least squares means and standard errors (SE) of weed cover percentage logit transformed as affected by the foam dose, the site and the evaluation date (one day before and one, two and three days after treatments) in the Taraxacum officinale (Weber) and Plantago lanceolata (L.) infested field experiment.
Foam Dose (L m−2)Logit [Weed Cover (%)] (±SE)
Site I
1 DBT1 DAT2 DAT3 DAT
0.000.62 (0.253)0.63 (0.259)0.64 (0.284)0.64 (0.286)
1.670.54 (0.262)−1.22 (0.270)−2.22 (0.321)−3.42 (0.328)
3.330.57 (0.250)−1.74 (0.253)−2.42 (0.293)−3.67 (0.307)
5.000.41 (0.373) *−1.62 (0.387)−5.31 (0.468)−6.11 (0.469)
6.670.51 (0.284) *−2.47 (0.294)−4.55 (0.355)−5.53 (0.359)
8.330.57 (0.254)−2.39 (0.260)−6.44 (0.300)−6.70 (0.308)
Site II
0.000.52 (0.290) *0.53 (0.287) *0.55 (0.249)0.55 (0.258)
1.670.60 (0.261)−1.55 (0.259)−2.14 (0.252)−2.96 (0.267)
3.330.38 (0.282) *−1.75 (0.275)−3.39 (0.253)−5.70 (0.275)
5.000.44 (0.274) *−2.05 (0.283)−4.42 (0.341)−5.60 (0.346)
6.670.61 (0.251)−1.96 (0.252)−5.31 (0.264)−5.83 (0.274)
8.330.58 (0.274)−1.83 (0.270)−6.74 (0.249)−6.91 (0.264)
* These values are not statistically different from 0, meaning that the weed cover percentage is not statistically different from 50%; 1 DBT, 1 DAT, 2 DAT and 3 DAT: one day before and one, two and three days after the treatment, respectively.
Table 5. Parameters and standard errors (SE) of the log-logistic regression model (Equation (1)) and effective times (days) estimated for reaching 10%, 25%, and 50% weed cover regrowth (ET10, ET25, and ET50, respectively) as affected by the different foam doses at different dates of data collection in the two-site field experiment infested with Festuca arundinacea (Schreb.). The non-linear regression curves are plotted in Figure 5. Regrowth was from weeds death (i.e., three days after hot foam application) to one month after death.
Foam Dose (L m−2)Parameters (±SE)Effective Times (days) (±SE)
Site I
bceET10ET25ET50
1.67−2.83 (0.660)1.03 (0.775)29.82 (3.040)13.21 (1.919)19.93 (1.631)29.60 (2.985)
3.33−3.81 (0.597)0.13 (0.132)30.60 (2.392)17.12 (1.140)22.89 (1.294)30.57 (2.388)
5.00−3.74 (0.637)0.22 (0.179)32.16 (2.667)17.77 (1.235)23.92 (1.376)32.12 (2.660)
6.67−4.03 (0.656)0.11 (0.1129)32.19 (2.504)18.61 (1.150)24.48 (1.328)32.18 (2.500)
8.33−4.13 (0.638)0.07 (0.0749)33.58 (2.599)19.69 (1.112)25.72 (1.383)33.57 (2.597)
Site II
bceET10ET25ET50
1.67−2.93 (0.5811.30 (0.757)27.21 (2.342)12.26 (1.59718.37 (1.408)26.97 (2.294)
3.33−3.37 (0.496)0.21 (0.194)29.39 (2.264)15.23 (1.097)21.17 (1.202)29.36 (2.258)
5.00−3.73 (0.507)0.13 (0.122)29.41 (2.090)16.27 (0.993)21.88 (1.152)29.38 (2.086)
6.67−3.67 (0.468)0.05 (0.070)30.02 (2.143)16.47 (0.959)22.24 (1.171)30.01 (2.141)
8.33−5.18 (0.716)0.10 (0.070)31.16 (1.826)20.35 (0.884)25.18 (1.067)31.15 (1.824)
b is the slope of the curve at the inflection point; c is the weed cover (%) at three days after the treatment; e is the time (days) corresponding to 50% weed cover between the upper and the lower limits of the curve (at the inflection point).
Table 6. Parameters and standard errors (SE) of the log-logistic regression model (Equation (1)) and effective times (days) estimated for reaching 10%, 25% and 50% weed cover regrowth (ET10, ET25, and ET50, respectively) as affected by the different foam doses at different evaluation date in the two-site field experiment infested with Taraxacum officinale (Weber) and Plantago lanceolata (L.). The non-linear regression curves are plotted in Figure 6. Regrowth was from weeds death (i.e., three days after hot foam application) to one month after death.
Foam Dose (L m−2)Parameters (±SE)Effective Times (days) (±SE)
Site I
bceET10ET25ET50
1.67−3.12 (0.724)3.16 (1.387)21.04 (1.924)9.22 (1.656)14.18 (1.465)20.61 (1.850)
3.33−3.47 (0.711)2.21 (0.907)22.08 (1.887)10.92 (1.368)15.67 (1.233)21.79 (1.834)
5.00−4.30 (0.657)0.25 (0.177)24.53 (1.685)14.63 (0.943)18.96 (1.018)24.50 (1.680)
6.67−4.24 (0.657)0.34 (0.206)27.27 (1.846)16.11 (1.041)20.98 (1.093)27.23 (1.838)
8.33−4.87 (0.715)0.11 (0.083)31.02 (1.924)19.72 (0.970)24.74 (1.115)31.01 (1.922)
Site II
bceET10ET25ET50
1.67−3.74 (0.9814.66 (1.681)17.18 (1.605)8.07 (1.564)12.12 (1.343)16.73 (1.535)
3.33−3.72 (0.559)0.25 (0.238)20.91 (1.647)11.50 (0.881)15.52 (0.984)20.88 (1.643)
5.00−4.35 (0.688)0.31 (0.212)21.51 (1.572)12.89 (0.863)16.67 (0.953)21.48 (1.567)
6.67−5.06 (0.723)0.21 (0.127)25.88 (1.545)16.70 (0.881)20.80 (0.974)25.86 (1.542)
8.33−4.79 (0.722)0.10 (0.081)32.15 (2.009)20.28 (1.012)25.54 (1.140)32.14 (2.007)
b is the slope of the function at the inflection point; c is the weed cover (%) at three days after the treatment; e is the time (days) corresponding to 50% weed cover between the upper and the lower limits of the curve (at the inflection point).
Table 7. Mean values and standard errors (SE) estimated from the exponential decay model (Equation (3)) of the weed dry biomass as affected by the different foam doses (0, 1.67, 3.33, 5.00, 6.67 and 8.33 L m−2, respectively) and the site at 37 days after the treatment in the Festuca arundinacea (Schreb.) infested field experiment. The non-linear regression curves are plotted in Figure 7.
Mean Values (±SE)
Site ISite II
0.00305.98 (25.88)330.24 (25.94)
1.6791.93 (26.27)155.84 (24.01)
3.3366.56 (11.71)102.14 (14.00)
5.0063.54 (13.41)85.38 (12.64)
6.6763.17 (13.98)80.20 (15.22)
8.3363.13 (14.08)78.61 (16.74)
Table 8. Mean values and standard errors (SE) estimated from the exponential decay model (Equation (3)) of the weed dry biomass as affected by the different foam doses (0, 1.67, 3.33, 5.00, 6.67 and 8.33 L m−2, respectively) and the site at 37 days after the treatment in the Taraxacum officinale (Weber) and Plantago lanceolata (L.) infested field experiment. The non-linear regression curves are plotted in Figure 8.
Foam Dose (L m−2)Mean Values (±SE)
Site ISite II
0.00253.02 (26.659)373.88 (27.614)
1.67176.76 (14.856)240.50 (15.298)
3.33123.75 (14.552)155.11 (15.954)
5.0086.45 (15.337)99.77 (15.817)
6.6760.39 (14.793)64.18 (14.016)
8.3342.28 (13.312)41.39 (11.56)