Article

Optimizing ddRADseq in Non-Model Species: A Case Study in Eucalyptus dunnii Maiden

by
Natalia Cristina Aguirre
1,*,†,
Carla Valeria Filippi
1,†,
Giusi Zaina
2,
Juan Gabriel Rivas
1,
Cintia Vanesa Acuña
1,
Pamela Victoria Villalba
1,
Martín Nahuel García
1,
Sergio González
1,
Máximo Rivarola
1,
María Carolina Martínez
1,
Andrea Fabiana Puebla
1,
Michele Morgante
2,
Horacio Esteban Hopp
1,3,
Norma Beatriz Paniego
1,† and
Susana Noemí Marcucci Poltri
1,†
1
Instituto de Agrobiotecnología y Biología Molecular—IABiMo—INTA-CONICET, Instituto de Biotecnología, Centro de Investigaciones en Ciencias Agronómicas y Veterinarias, Instituto Nacional de Tecnología Agropecuaria, Dr. Nicolás Repetto y de los Reseros S/N, Hurlingham B1686IGC, Argentina
2
Department of Agricultural, Food, Environmental and Animal Sciences, University of Udine, 33100 Udine, Italy
3
Laboratorio de Agrobiotecnología, FBMC, Facultad de Ciencias Exactas y Naturales, Universidad de Buenos Aires, Ciudad Universitaria, Buenos Aires C1428EHA, Argentina
*
Author to whom correspondence should be addressed.
These authors contributed equally to this work.
Agronomy 2019, 9(9), 484; https://doi.org/10.3390/agronomy9090484
Submission received: 30 June 2019 / Revised: 12 August 2019 / Accepted: 13 August 2019 / Published: 27 August 2019

Abstract

:
Restriction site-associated DNA sequencing (RADseq) and its derived protocols, such as double digest RADseq (ddRADseq), offer a flexible and highly cost-effective strategy for efficient plant genome sampling. This has become one of the most popular genotyping approaches for breeding, conservation, and evolution studies in model and non-model plant species. However, universal protocols do not always adapt well to non-model species. Herein, this study reports the development of an optimized and detailed ddRADseq protocol in Eucalyptus dunnii, a non-model species, which combines different aspects of published methodologies. The initial protocol was established using only two samples by selecting the best combination of enzymes and through optimal size selection and simplifying lab procedures. Both single nucleotide polymorphisms (SNPs) and simple sequence repeats (SSRs) were determined with high accuracy after applying stringent bioinformatics settings and quality filters, with and without a reference genome. To scale it up to 24 samples, we added barcoded adapters. We also applied automatic size selection, and therefore obtained an optimal number of loci, the expected SNP locus density, and genome-wide distribution. Reliability and cross-sequencing platform compatibility were verified through dissimilarity coefficients of 0.05 between replicates. To our knowledge, this optimized ddRADseq protocol will allow users to go from the DNA sample to genotyping data in a highly accessible and reproducible way.

1. Introduction

Efficient plant genome sampling, with sufficient and informative genetic markers, plays a key role in breeding, conservation, and evolution studies. In recent decades, researchers have developed different types of useful molecular markers, although nowadays SNPs have become the markers of choice. This selection is based on their high abundance in genomes, stability, co-dominance, and automation of the genotyping process [1].
SNP arrays are high-throughput and cost-effective tools, with the extra advantage of generating relatively reduced amount of missing data. These features make them one of the most popular genotyping tools for major crops and forest tree species. However, the development of a novel SNP array is costly, making them unaffordable for non-commercial plant species. Restriction site-associated DNA sequencing (RADseq) [2], genotyping by sequencing (GBS) [3], and their derived protocols (reviewed in [4] and [5]) are techniques that have recently emerged as promising genomic approaches for SNP discovery at a genome-wide scale. They are based on reduced representation sequencing of multiplexed samples, do not require a reference genome or previous polymorphism knowledge, and combine marker discovery and genotyping in a one-step process. Thus, they provide a rapid, high-throughput, and cost-effective strategy for carrying out multiple genome-wide analyses for several non-model species and germplasm sets.
These approaches involve digesting the DNA with restriction enzymes and then sequencing a specific size-selected range of generated fragments. Aiming to ameliorate some of the weaknesses of the original RADseq, specifically with regard to the dependence of the length of the generated fragments on random shearing effects [5,6], researchers have developed many derived methodologies, including 2b-RADseq [7], ezRADseq [8] and ddRADseq [9]. Double-digest restriction site-associated DNA sequencing, or ddRADseq, uses two different restriction enzymes to cut the DNA: one rare cutter (i.e., an enzyme with a large recognition site) and a frequent cutter. Only the fragments falling between both restriction sites and within a specific size range are sequenced [6]. This reduces the depth of sequencing needed to reach optimal coverage, as well as the percentage of missing data, in comparison with RADseq.
The original ddRADseq protocol was built and trained based on animal data, and it has been widely applied in SNP marker development and genotyping for several species in this kingdom. Applications of this technology to plants have been reported [10,11,12,13,14], especially in forest and fruit trees (reviewed in [15]), and were specifically improved [16,17]. However, most researchers still use universal default protocols that carry some limitations. Because of the diversity and complexity of plant genomes, the different steps of the ddRADseq protocol require revision to achieve better results in non-model plant species. The steps that would need revision include the selection of the pair of restriction enzymes, the determination of the optimum size range, the suitability and performance of the sequencing platform, the sequence depth, and the variant calling strategy. Moreover, because this could involve testing steps, the development of an optimized protocol for setting up the methodology in a small number of plant samples is mandatory, mainly for labs with low budgets.
A collateral application of this Next Generation Sequencing (NGS) technique in plants is the cost-effective discovery of other genetic variants like polymorphic SSR loci [18,19]. SSRs have numerous uses, including linkage map development, quantitative trait locus (QTL) mapping, marker-assisted selection, cultivar or clone fingerprinting, and population structure and genetic diversity studies, among others [20].
For Eucalyptus, several genotyping platforms, such as the recent SNP array EUChip60K [21], have been developed [22,23]. However, some species, such as the important forest species Eucalyptus dunnii Maiden (hereafter E. dunnii) are less represented in this case.
The present study involves the development of an optimized and lower-cost ddRADseq protocol in E. dunnii through the setting up of a small number of samples. This optimized protocol may be easily applied to any plant species. Additionally, this study presents the scaling up of the first protocol to a second one, which allows its application to a larger number of samples. To our knowledge, to date this is the most comprehensive and detailed ddRADseq report allowing users to optimize the protocol from the DNA sample to the molecular marker data in an easy and accessible way.

2. Materials and Methods

2.1. Plant Material and DNA Extraction

A ddRADseq derived protocol was optimized and applied on two samples of E. dunnii (A and B), and subsequently scaled up to another 24 samples (1 to 24). The samples belong to the INTA Eucalyptus breeding program (Supplementary Table S1). Fresh young leaves were collected, dried in a freeze dryer (Labconco Corporation, Kansas City, MO, USA) and conserved in silica gel until DNA extraction. Genomic DNA (gDNA) was extracted from the lyophilized leaves following the CTAB method described by Hoisington et al. [24] with modifications for E. dunnii species as described in Marcucci et al. [25]. Their quality was verified by Nanodrop (Thermo Fisher Scientific, Waltham, MA, USA) and agarose gel electrophoresis analysis. DNA was quantified using a Qubit 2.0 fluorometer (Thermo Fisher Scientific).

2.2. Evaluation of Enzymes and Size Selection Range

Several in silico digestions of E. grandis v2.0 reference genome (available on Phytozome https://phytozome.jgi.doe.gov/pz/portal.html, [26]) were performed to assess both the optimal set of restriction enzymes for the E. dunnii genome and the number of DNA fragments to be recovered by different size selections [9,15]. Simulations were performed with SimRAD package [27]. The evaluated restriction enzyme combinations PstI-MspI and SphI-MboI were selected based on the studies of Peterson et al. [16] and Scaglione et al. [28], respectively. In addition, different size selections were evaluated to achieve between 1e4 to 5e4 fragments in an optimal size selection window of 50 to 100 base pairs (bp), as suggested by Peterson et al. [9], or even of 150 bp. The average insert size was set from 295 to 420 bp, which led to a final library size range between 350 and 600 bp. This size range is suitable for bridge amplification in Illumina platforms and allows minimum overlapping of Paired End (PE) Run reads of 150 bp or longer.
The insilico.digest routine was applied for both enzyme combinations and the adapt.select routine was used to simulate the amplification of the fragments with both enzyme cutting site endings. Finally, size.select was used to select different subpopulations of fragments per digestion. For double digestion, the considered means were of 320, 370, 420 bp, with two window widths simulating manual (agarose gel electrophoresis, 100 or 150 bp) and automatic selection (by SAGE ELF, 70 or 140 bp, for one or two elution wells). Subsequently, in vitro E. dunnii gDNA digestions were run by using reaction conditions described elsewhere [28]. The profile of the obtained fragments was visualized in agarose gel (Figure 3 of the Supplementary File S1) and capillary electrophoresis in a 5200 Fragment Analyzer System (Advanced Analytical Technologies, Inc., Santa Clara, CA, USA) using the DNA high sensitivity kit (Agilent Technologies, Santa Clara, CA, USA). Supplementary File S2 contains the SimRAD command lines used for the simulation.

2.3. Protocol 1 (P1): Optimized ddRADseq

Digestion: For samples A and B, 150 ng of each gDNA was completely digested using SphI-HF and MboI (2.4 U per enzyme, New England Biolabs (NEB), Ipswich, MA, USA), and incubated at 37 °C for 90 min. The reaction was inactivated at 65 °C for 20 min and purified with 1.5 volumes (×) of Ampure XP bead (Beckman Coulter, Brea, CA, USA) [28]. At this point, the complete digestion of gDNA was assessed by electrophoresis in a Fragment Analyzer System (Advanced Analytical Technologies, Inc.). A homogeneous distributed fragment population shorter than about 3 kb was expected.
Ligation: The common adapters (double-stranded oligonucleotides) published by Peterson et al. [16] were used (Supplementary Table S2). Specifically, Adapter 2 (A2) had a “Y” form for the specific amplification of fragments with different cut site endings. Adapter 1 (A1) and A2 were modified by changing their sticky ends for SphI and MboI, respectively. The final ligation was done using 2 pmol and 5 pmol of A1 and A2, respectively, and 2.4 Weiss units of T4 DNA ligase (Invitrogen, Carlsbad, CA, USA). This final selection was based on the following tests: A1 and A2: 2 and 5 pmol similar to Scaglione et al.’s protocol [28], 2 pmol of both adapters, as reported by Elshire et al. [3], and 0.1 and 15 pmol, as reported by Peterson et al. [16]. The reaction was incubated for 1 h at 23 °C, followed by an additional incubation for 1 h at 20 °C; finally, the reaction was inactivated for 20 min at 65 °C [28]. A1 × Ampure XP bead purification per sample was done before performing PCR (Polymerase Chain Reaction).
PCR: The dual-indexed primers designed by Lange et al. [29] (Supplementary Table S2) were used for the reactions. The oligonucleotides have a portion for sequencing on the Illumina platforms plus an index (8 bp), which allows the identification of each library. NEB Phusion High-Fidelity DNA polymerase was used with the following cycling parameters [28]: 3 min of initial denaturation (95 °C), 10 cycles of amplification (30 s at 95 °C, 30 s at 60 °C, 45 s at 72 °C), and 2 min of a final extension (72 °C). A1.2× Ampure XP bead purification per PCR was subsequently performed.
Pooling: After adding the indexed primers by PCR, the obtained libraries were pooled based on concentration (according to Qubit 2.0 fluorometer analysis) and concentrated in a SpeedVac (Eppendorf, Hamburg, Germany).
Size Selection: A manual size selection was applied (a range between 450 and 550 bp, which corresponds to DNA fragment size of interest between 310 and 410 bp) in low-melting 1.5% agarose gel electrophoresis (Bio-Rad Laboratories, Hercules, CA, USA). Finally, the selected fragments were purified from the gel with QIAquick Gel Extraction kit (Qiagen N.V., Hilden, Germany) [28].
Sequencing: The final libraries were quantified by Qubit 2.0 fluorometer (HS dsDNA kit, Thermo Fisher Scientific) and their quality was checked on a Fragment Analyzer system (DNA High Sensitivity kit, Agilent). A PE sequencing run (2× 151 bp) was performed on MiSeq (Illumina Inc., San Diego, CA, USA) for both samples (Figure 1).
Supplementary File S1 displays an extended version of P1.

2.4. Protocol 2 (P2): Optimized ddRADseq (Scaling Up to 24 Samples)

The Optimized ddRADseq P1 was subsequently scaled up by using the 24-plex P2 (samples 1 to 24, Supplementary Table S1). First at all, P2 was set up in 23 samples and consisted of P1 with some modifications as follows.
Ligation: 24 variable-length (4 to 9 bp) barcodes designed by Poland et al. [30] were added, in order to avoid low sequence quality of the first bases due to the restriction site [3,17] (Supplementary Table S2).
Pooling: Ligations were mixed by equal DNA quantity in a 23-plex pool, then concentrated and finally cleaned by one 1× Ampure XP bead purification per pool.
PCR: A PCR was performed per pool of libraries (a pair of indexes identifying each pool).
Sequencing: The libraries were sequenced on a very low depth PE (2× 250 bp) run of a MiSeq instrument (Illumina Inc.).
Finally, the P2 was customized to the definitive protocol (Figure 1). This led to the construction of new libraries from the gDNA of the same 23 samples plus an additional sample (24-plex), as detailed below.
Ligation: each reaction was done with 160 U of ligase (NEB Cohesive End Ligation).
Pooling: the ligations were 24-plex pooled, based on the concentration of each digestion quantified by Picogreen (Sigma-Aldrich) in a FluorStar Optima Fluorometer (BMG Labtech, Ortenberg, Germany).
Size selection: an automatic size selection run was performed in a 2% agarose cassette in the SAGE ELF (Sage Science, Inc., Beverly, MA, USA) and the fragments of 450 bp on average (between 415 and 485 bp) were collected from one well. Subsequently, an extra step of 0.8× Ampure XP bead purification was performed to ensure the elimination of the fragments below 300 bp.
Sequencing: as a final step, the pool was sequenced PE (2× 75 bp) on a NextSeq 500 sequencer (Illumina Inc.).
Supplementary File S3 presents an extended version of P2. Figure S1 of Supplementary Tables displays a schematic view of the library construction.

2.5. ddRADseq Data Analyses

The sequencing quality of each sample was checked using FastqC [31].
Although many bioinformatics software and R packages (R-3.5.2, R core team, Vienna, Austria) can handle this kind of reduced representation sequencing data, Stacks [32,33] (v1.48, University of Oregon, Eugene, OR, USA) is one of the software packages that performs equally well when working with or without a reference genome. This software was developed mainly for organisms without reference genomes and high-depth RAD sequencing. Additionally, Stacks is between the pipelines, with high accuracy for SNPs calling on this kind of data [34,35].
Herein, data obtained using both protocols were analyzed with different components of the software Stacks v1.48 [32,33], including cleaning raw reads, defining the ddRADseq loci and determining the SNPs. Samples A and B were used to compare the efficiency between de novo and with reference analyses for the species, as well as to assess the utility of P1. In the case of P2, on the other hand, samples 1 to 24 (run on NextSeq 500) were analyzed with reference. Additionally, libraries of the samples that were sequenced twice (MiSeq and NextSeq) were analyzed (both repetitions together) to evaluate the performance of the Illumina platforms.
First, by using the process_radtag.pl component, reads were removed if they presented uncalled bases, low Phred score (lower than 10), absence of enzyme recognition sites, and presence of adapter sequence. Additionally, A and B samples were trimmed to 145 bp, because of quality drop in the last bases according to mean average inspection using FastqC [31]. Otherwise, the raw data of samples 1 to 24 were demultiplexed and truncated to 66 bp after removing up to 9 bp of barcode sequences. For downstream analyses, paired and unpaired clean reads were considered.
Subsequently, the denovo_map.pl pipeline was used to search loci and SNPs de novo (only for P1), whereas ref_map.pl .pl was selected to assess SNPs after mapping cleaned reads to the E. grandis reference genome with Bowtie2 (default parameters) [36]. In all of the analyses, a minimum of three reads was used to define an allele (or stack) within an individual (-m 3). Particularly for de novo analysis, three mismatches between alleles were allowed to construct a locus within an individual (- M 3) and three mismatches were allowed between loci to build the catalog (-n 3).
After running each pipeline, the rxstacks program was applied to filter out putative sequencing errors of genotype and haplotype calls and, subsequently, the components cstacks and sstacks were rerun. Thus, the bounded SNP model was applied, and loci with log-likelihoods higher than (minus) -10 were kept. Furthermore, a proportion of individuals with confounded loci up to 0.05 were admitted, and excess haplotypes from individual loci were pruned according to their prevalence in the population.
Finally, the pipeline Populations was run with different filter combinations, resulting in three VCF (variant call format) files for the SNPs and ddRADseq polymorphic loci. For samples A and B, the basic data matrix (Total markers) was obtained. A second matrix without missing data was built (Shared markers). For the third matrix, allele data from samples 1 to 24 derived from P2 were filtered by a minimum allele frequency (MAF) of 0.05, and presentation of a locus by a minimum of 80% of individuals in order to be considered. Supplementary File S2 presents all the command lines used to run Stacks (with and without the reference genome).

2.6. SSR Identification

SSRs for samples A and B were identified using the software MIcroSAtellite (Institute of Plant Genetics and Crop Plant Research, Gatersleben, Germany) identification tool, also known as MISA [37], as in Qin et al.’s study [38]. The fasta_sample option of the Population module (Stacks v1.48) was used to obtain the sequences of the two haplotypes of each sample for each locus in FASTA format. Then, according to the same criterion used by Torales et al. [19], SSRs with a minimum of five repeats for dinucleotide, four repeats for trinucleotide, and three repeats for tetra, penta and hexanucleotide motives were searched. The polymorphic SSRs were also analyzed. Supplementary File S2 displays all the command lines used to run MISA.

2.7. Evaluation of Robustness—Sequencing Platform Comparison

The robustness of the protocol was evaluated by comparing MiSeq and NextSeq data sets from 46 libraries (23 MiSeq and 23 NextSeq). The VCF file was filtered by missing data and MAF lower than 20% and 0.05 respectively (Populations pipeline of Stacks v1.48). A dissimilarity matrix between all the samples was calculated directly from the filtered VCF using the R package SNPrelate [39]. The dendrogram was plotted using the R package ggplot2 [40].

3. Results

3.1. Evaluation of Enzymes and Size Selection Range

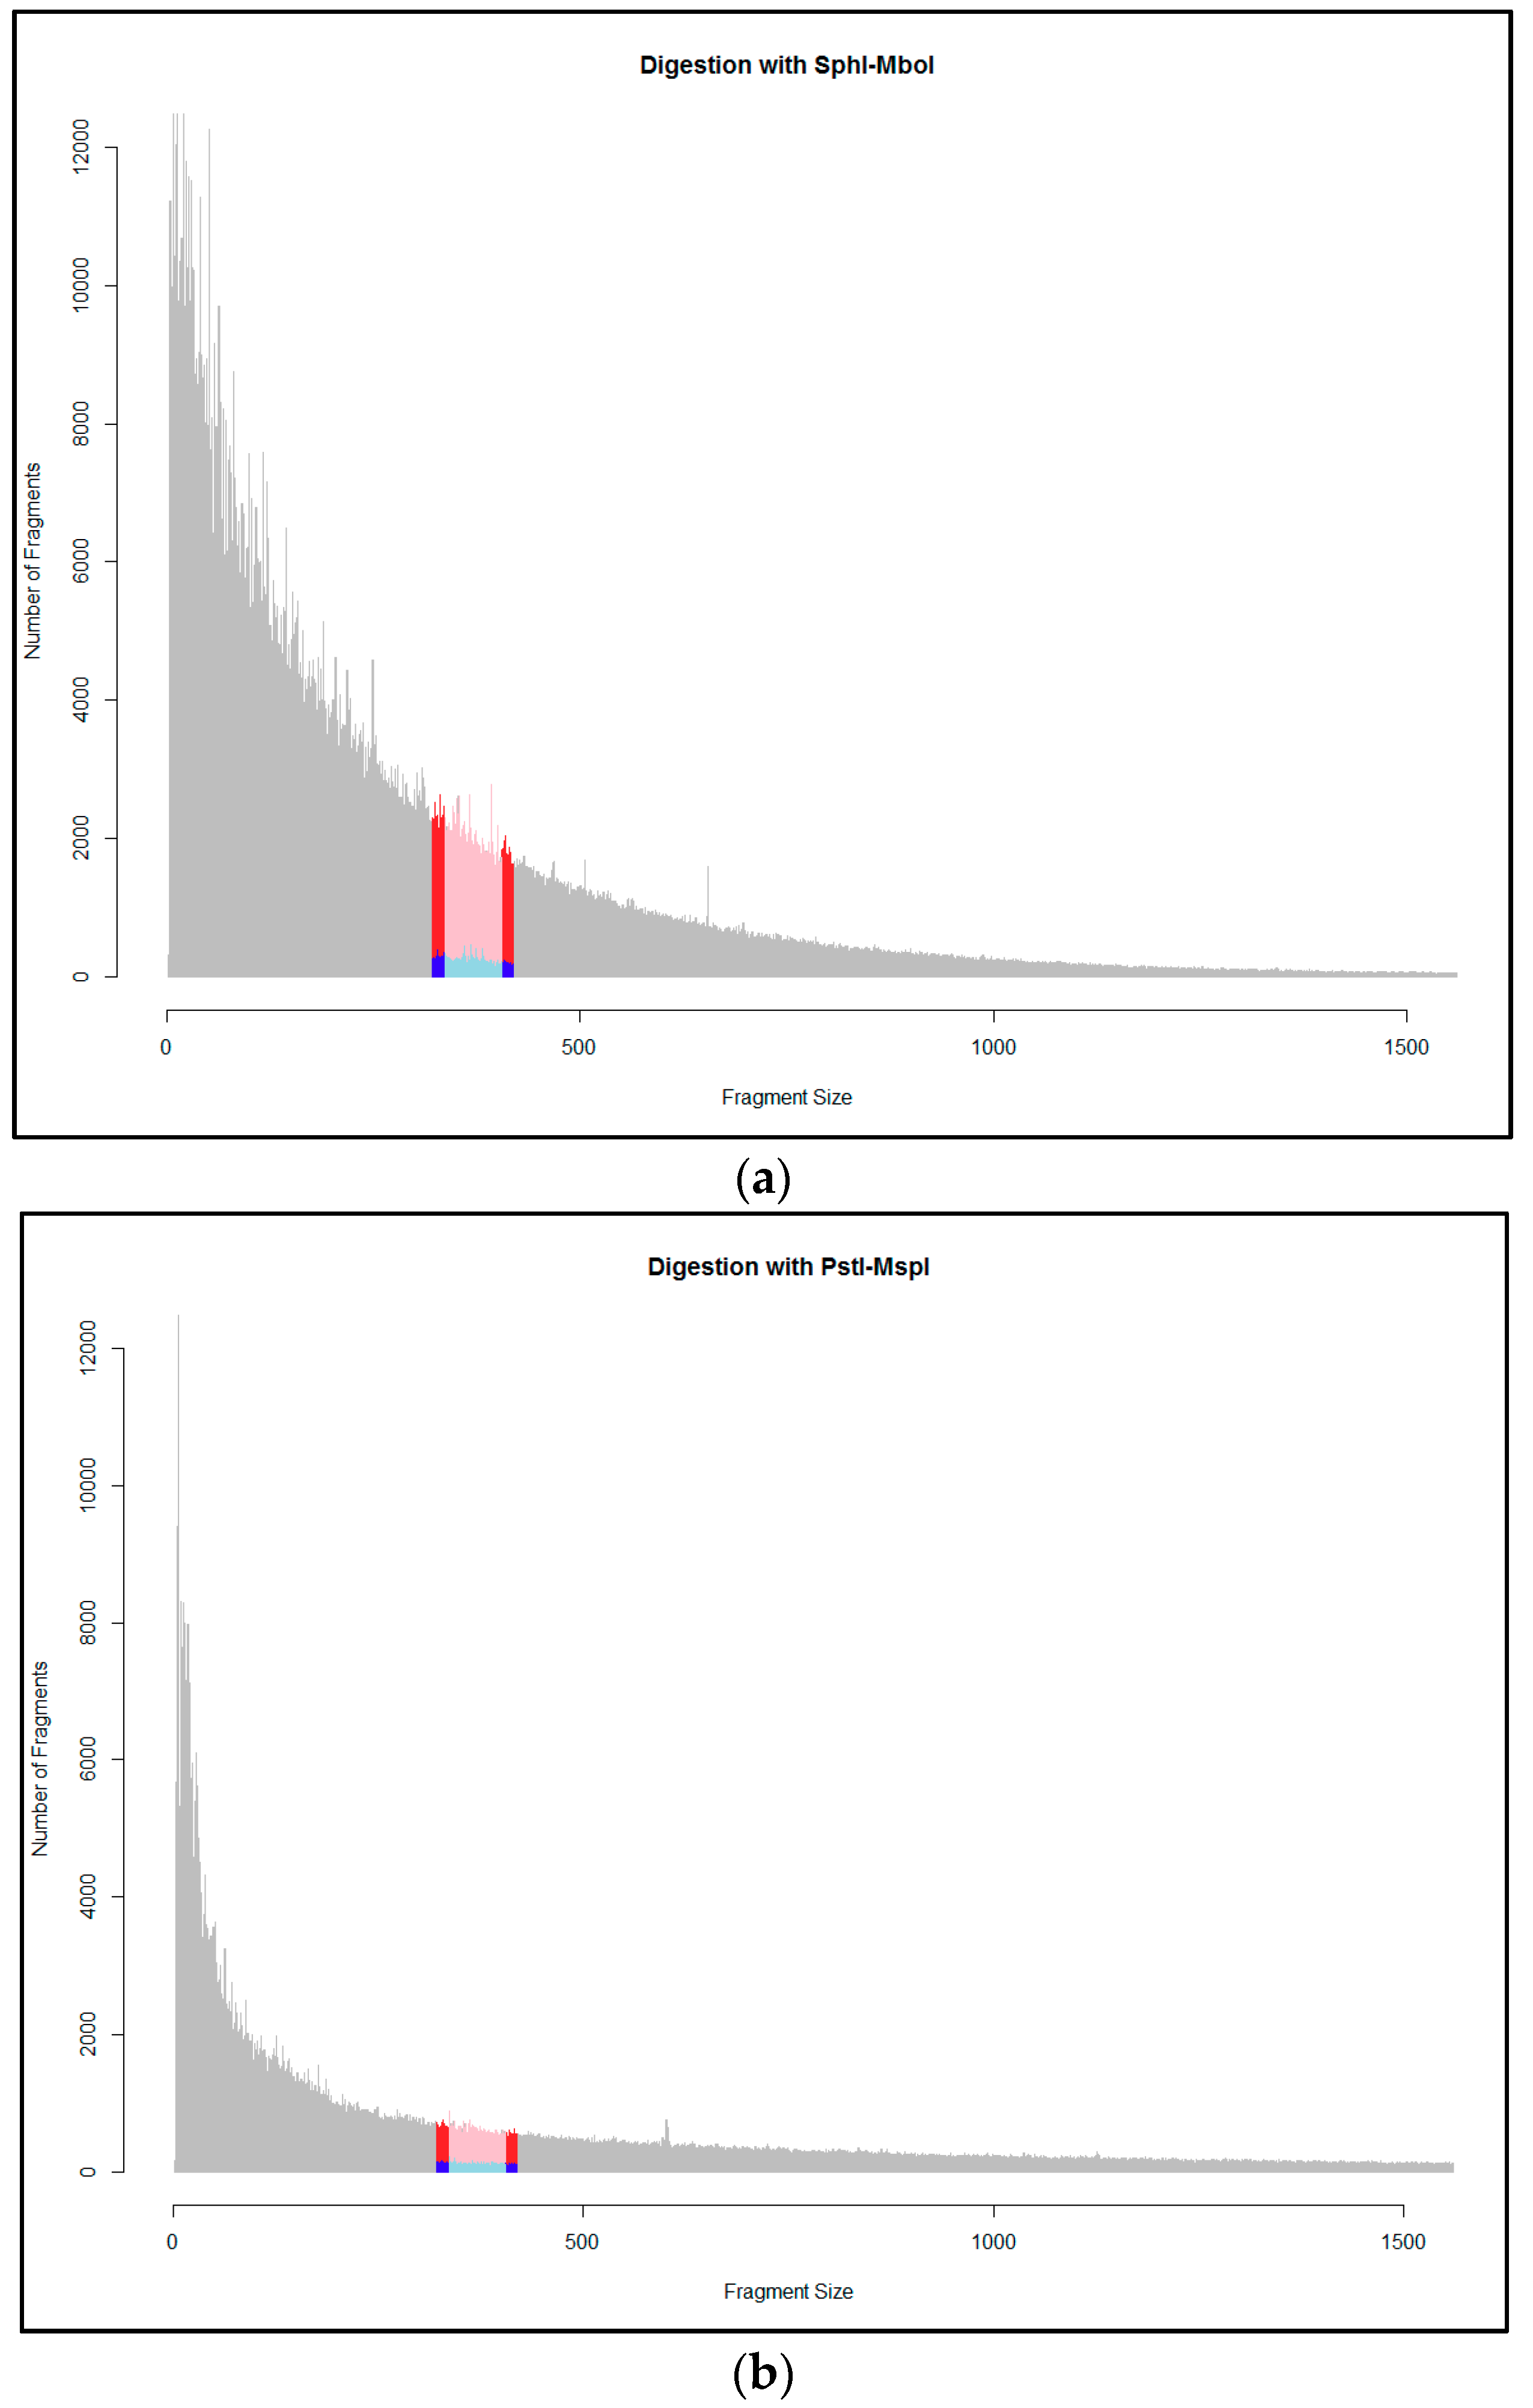
According to the in silico simulations of genome E. grandis v2.0 digestion, the enzyme pair SphI-MboI generated 2,499,866 fragments (Figure 2a, grey area), of which 248,275 have both enzyme cutting site endings (type AB and BA fragments, data not shown). The enzyme pair PstI-MspI produced almost half (1,090,783) of the fragments of SphI-MboI (Figure 2b, grey area) and 174,771 of these fragments contain the expected pair of ends (AB+BA).
Table 1 displays the predicted AB+BA fragments generated for both enzyme combinations of different size selection ranges (270 to 420 bp, in manual size selection; 285 to 415 bp in automated size selection).
We selected the SphI-MboI enzyme combination for Eucalyptus, because of the larger number of fragments in the thin window widths (100 and 70 bp). Specifically, we selected an average DNA fragment population size of 370 bp. This size gave the minimum overlapping between 150 bp PE reads (P1) in sequenced libraries. For this average fragment size, 24,508 AB+BA fragments fell within the range of 320 to 420 bp for the manual size selection in P1 (actually, the library fragment size was 450 to 550 bp, including adapters and primers, Figure 2a, blue + light blue areas). On the other hand, the automatic selection retrieved 17,317 AB+BA fragments in the range between 335 and 405 bp in P2 (Figure 2a, light blue area). For PE sequencing, this is 24,508 × 2 = 49,036 predicted sequenced ddRADseq loci for manual size selection and 17,317 × 2 = 34,634 predicted sequenced ddRADseq loci for automated size selection (70 bp range, due to the restriction of the equipment).
The enzyme pair PstI-MspI retrieved 12,026 AB+BA DNA fragments between a manual size selection window of 100 bp (between 320 and 420 bp; Figure 2b, blue + light blue areas), whereas it gave 8359 between an automatic size selection window of 70 bp (between 335 and 405 bp; Figure 2b, light blue area). Again, for PE sequencing, this was 12,026 × 2 = 24,052 predicted sequenced ddRADseq loci for manual size selection and 8359 × 2 = 16,718 predicted sequenced ddRADseq loci for automated size selection.
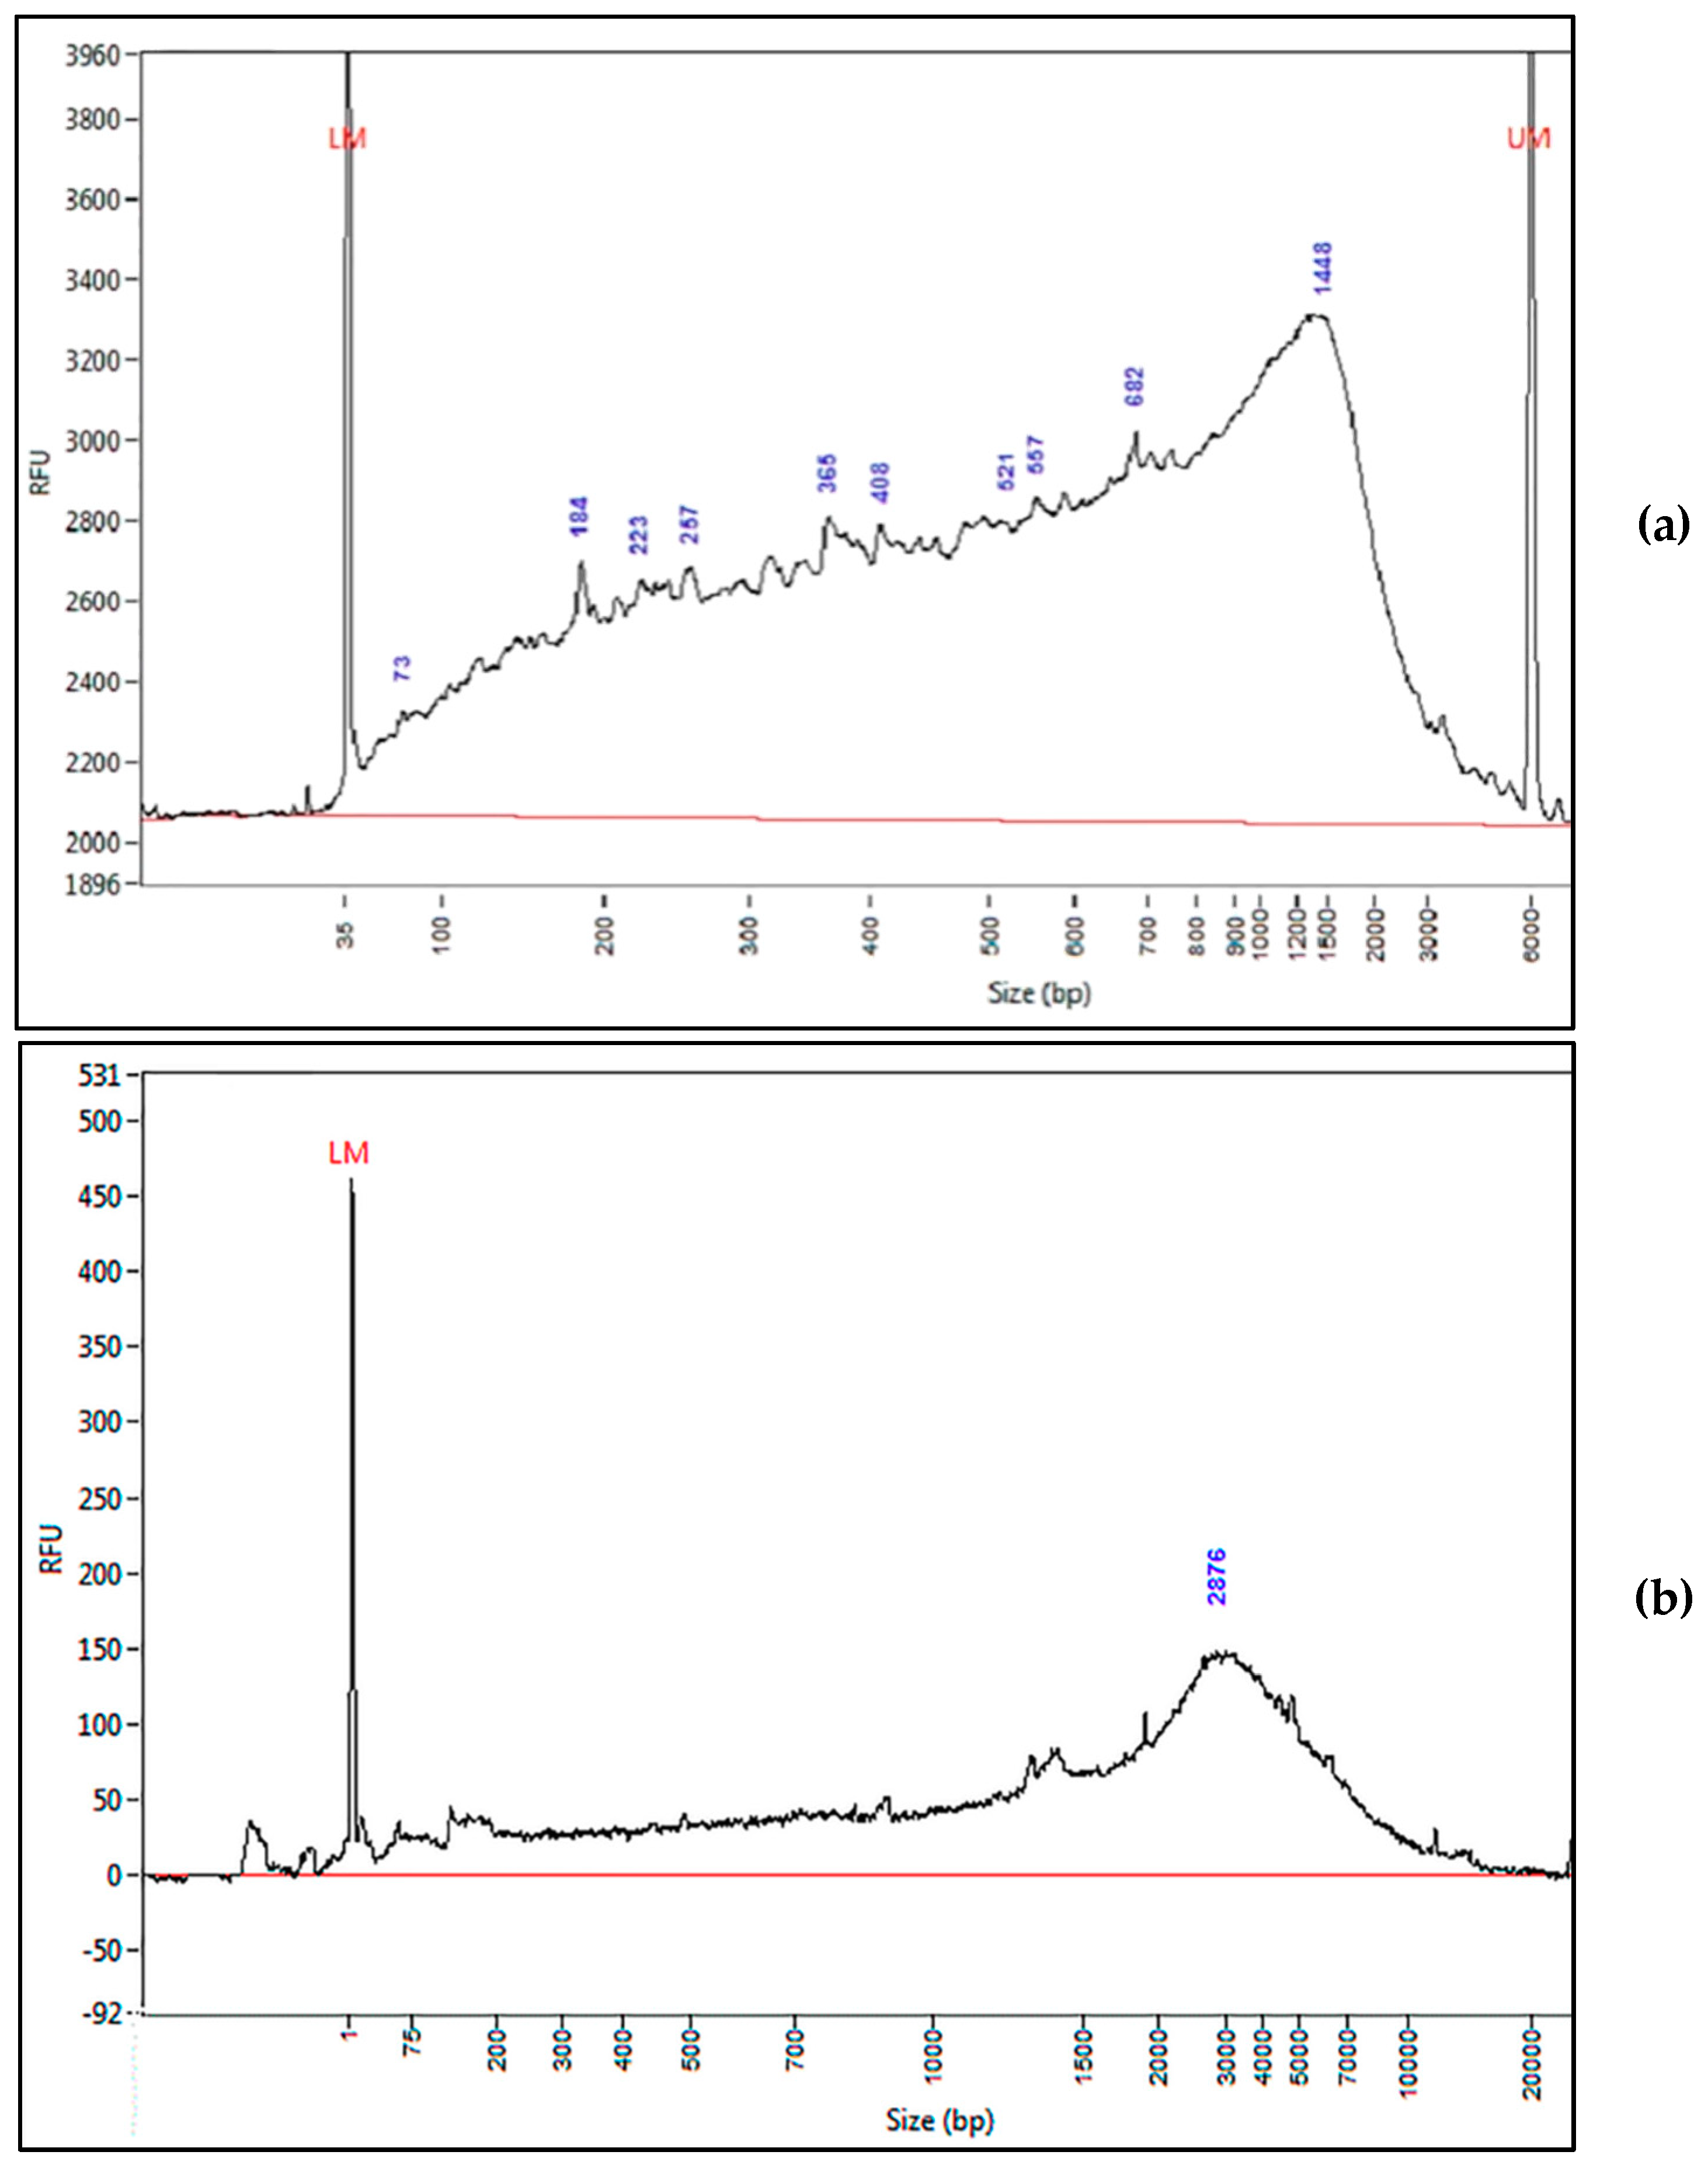
Moreover, in vitro digestion analyses showed that the SphI-MboI enzyme combination displays a more homogeneous pattern (Figure 3a). In accordance with the results from the in silico simulations, these enzymes gave higher frequencies of lower-sized fragments within the range of selection than those obtained with the PstI-MspI combination (Figure 3b).
Other enzymes and size selection combinations yielded a similar number of predicted fragments. For example, the PstI-MspI enzyme combination with an average fragment size selection of 345 bp and a window width of 150 bp retrieved 18,826 predicted fragments. However, our size selection equipment (SAGE ELF) at a window width of 70 bp retrieved several DNA fragment subpopulations of different ranges at the same time, and consequently a size selection with a width of 150 bp can only be done by collecting two elution wells or by manual selection.

3.2. Protocol 1: Analysis in Samples A and B

From the MiSeq sequencing, we obtained 1,984,145 and 2,294,900 PE reads of 151 bp for samples A and B, respectively. The overall read quality, according to FastqC visualization [31], was high enough for further analysis. Filtering by quality with the process_radtag.pl allowed us to obtain samples that retained more than 96% of the reads, with a mean of 2,066,064.5 reads.
The use of Bowtie2 [36] with the default parameters as the aligner allowed us to map approximately 82% of the reads against the E. grandis reference genome. The ref_map.pl pipeline of Stacks identified a total of 77,885 ddRADseq loci for sample A and 71,395 ddRADseq loci for sample B. These results showed a mean depth coverage of 24.16× and were used to build a catalogue. Then, a subsequent filtering by quality (with the rxstacks module) retained 41,834 ddRADseq loci. This result is at the expected order of magnitude according to in silico simulation (49,016 = 2 loci on 24,508 fragments using PE sequencing). Within these ddRADseq loci, 9299 were polymorphic (i.e., they had at least one SNP) and held 19,525 SNPs (a mean of 2.1 SNPs per locus) and 4246 SSRs. Moreover, both samples shared 7346 of these ddRADseq loci with 15,792 SNPs (Table 2). Additionally, sample A and B shared 420 SSRs with different motifs of repetition and 16 of these SSRs were polymorphic (Table 2, Supplementary Table S1).
An analysis using the denovo_map.pl routine implemented in Stacks [33] allowed us to obtain a higher number of ddRADseq loci (approximately the double: 156,013 and 135,501 for sample A and B, respectively) and polymorphic markers than the with reference analysis. In this case, the definitive catalog contained 125,432 loci. Within these de novo ddRADseq loci, 18,951 were polymorphic, and held 33,313 SNPs in all (a mean of 1.8 SNPs per haplotype), as well as 1366 SSRs. Finally, the samples shared 14,423 loci, 25,778 SNPs and 55 polymorphic SSRs (Table 2; Supplementary Table S3).
Dinucleotides (AG/GA> AT/TA> TC/CT) were the most frequent motifs observed in both cases (SSRs discovered by with reference (16 SSRs) or de novo (55 SSRs) analysis), followed by tetra and trinucleotides (approximate 15:5:1 respectively). At least 30 SSRs were polymorphic in a heterozygous state (20 without reference analysis). According to the with reference analysis, polymorphic SSRs were distributed in all chromosomes, except for chromosome 3 and 9 (Supplementary Table S3).

3.3. Protocol 2: Analysis in 24 Samples (Scaling-Up)

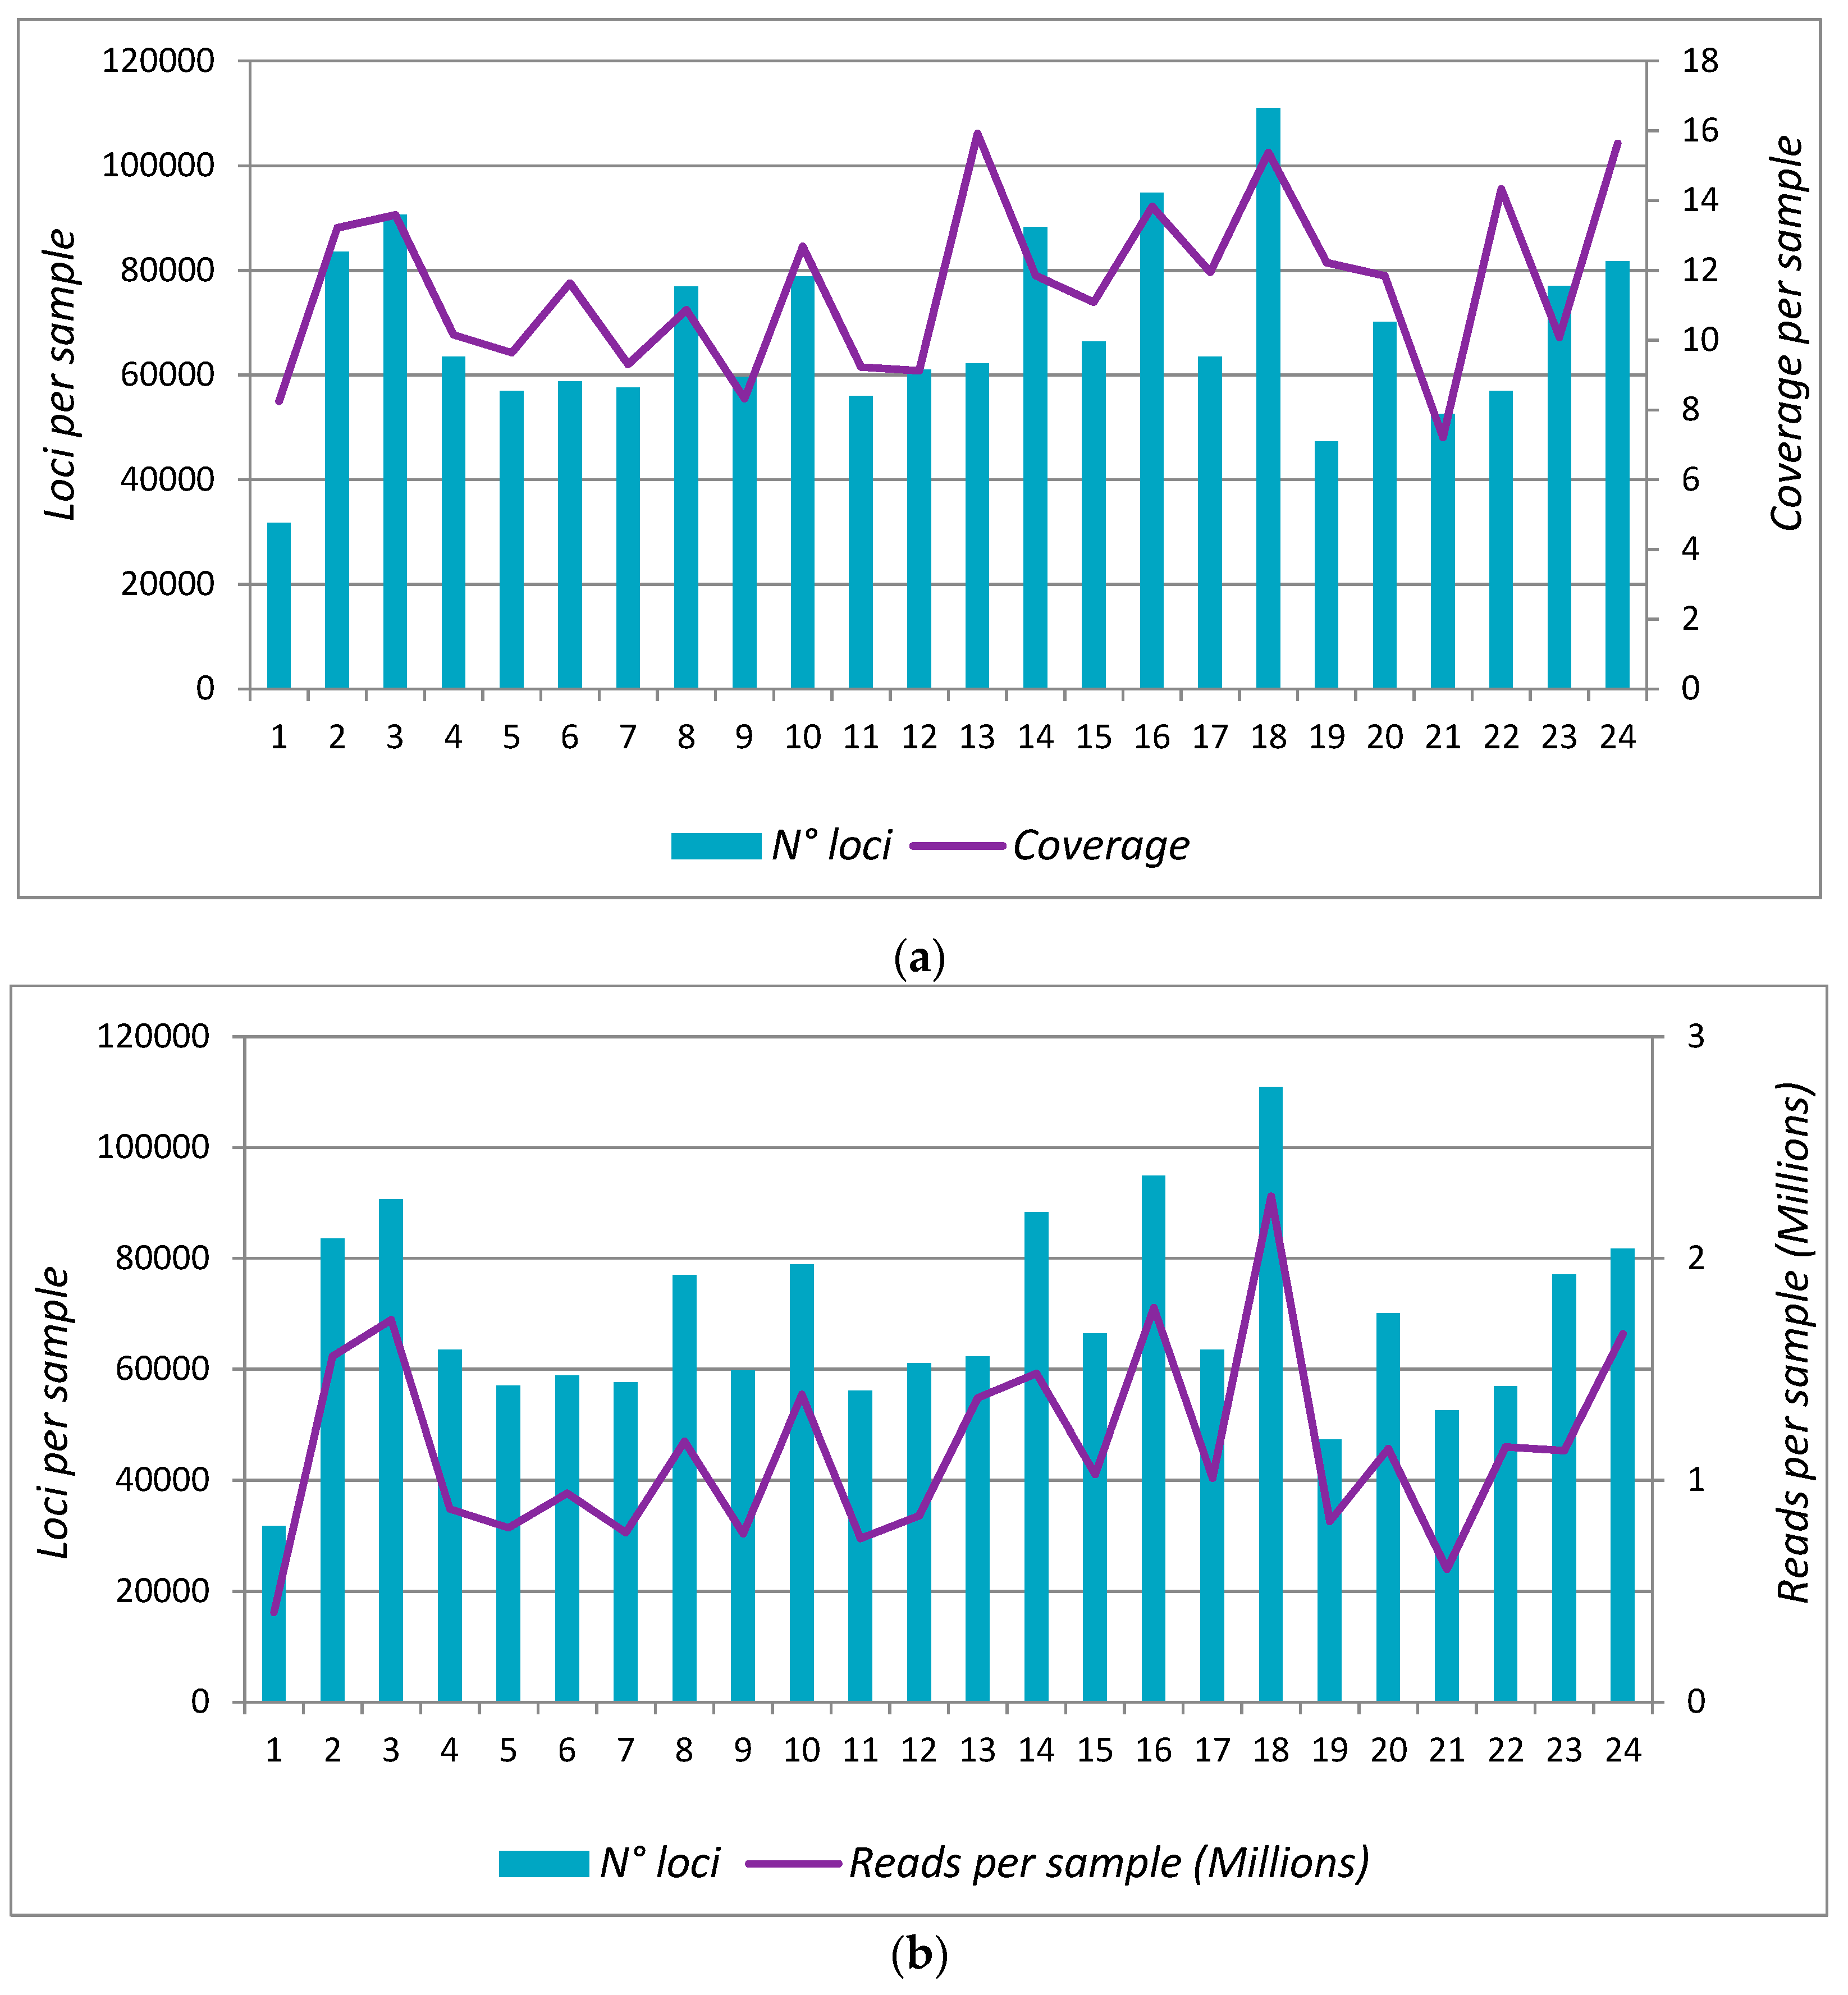
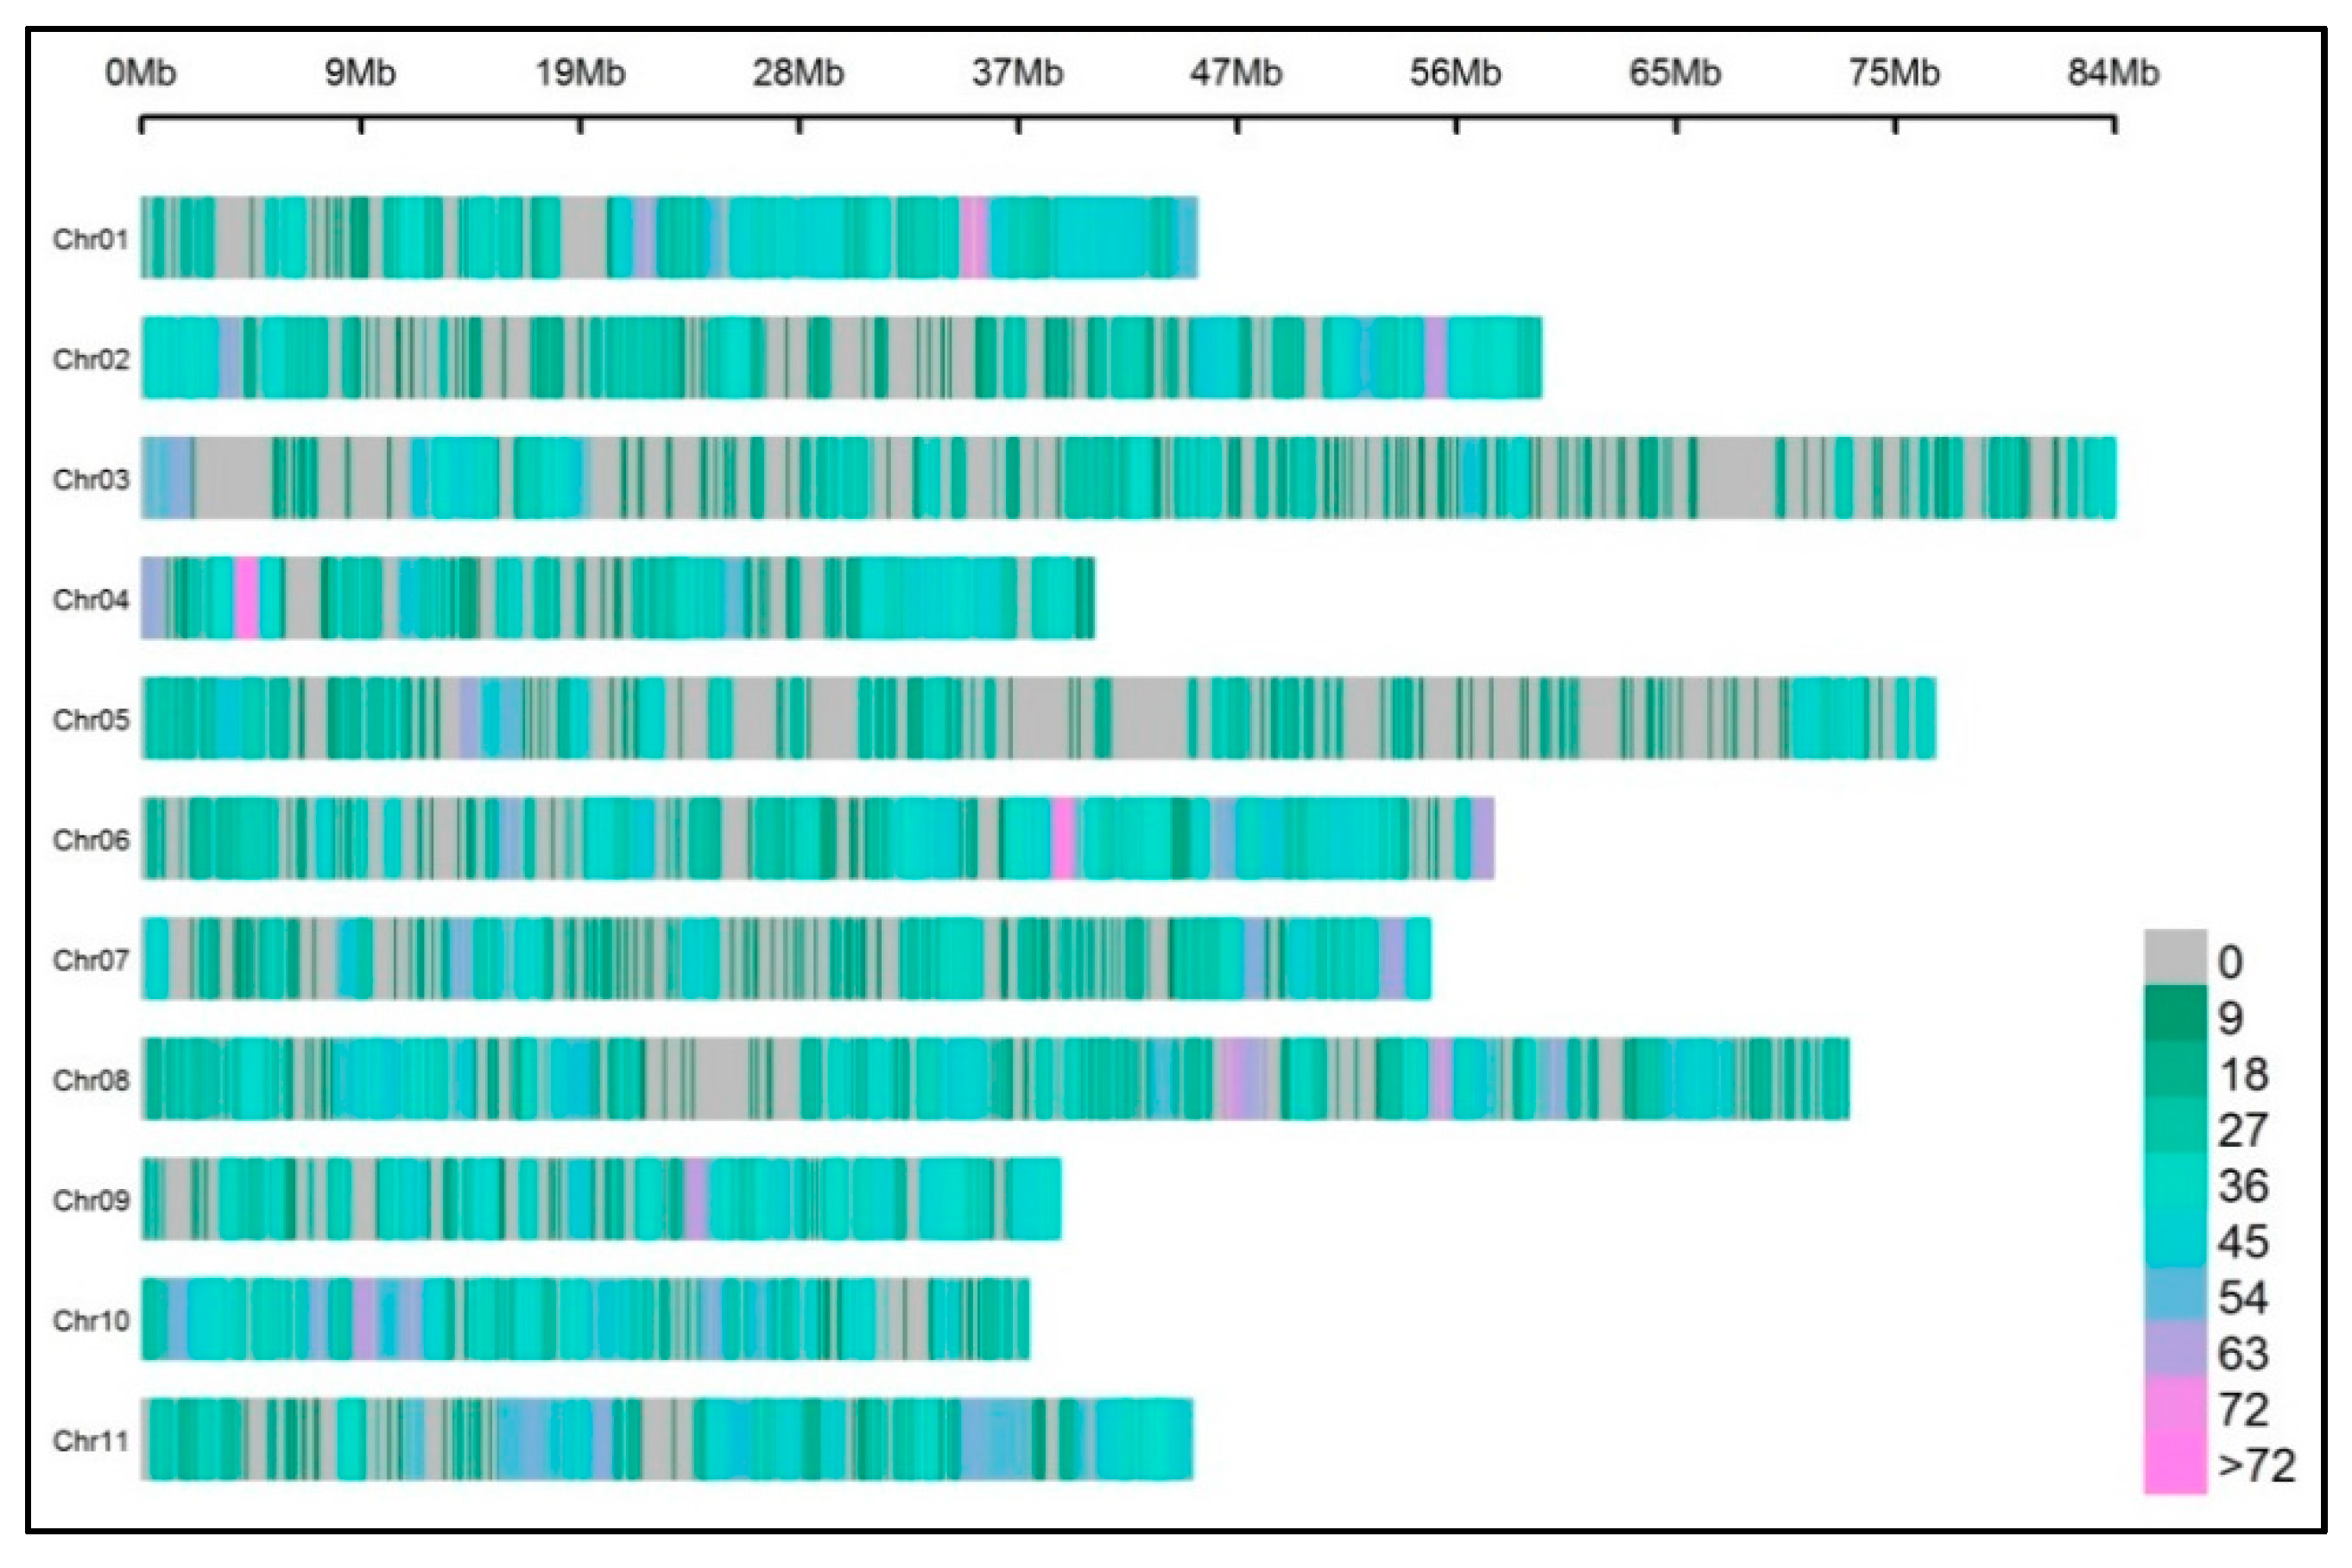
The demultiplexing of the 24-plex pool sequenced on NextSeq platform retrieved 27,400,302 good quality PE reads, with a mean of 1,141,679.25 PE reads per sample. This number varied from 404,702 for sample 1 to 2,280,731 for sample 18, with a standard deviation of 440,542.6 and a variant coefficient (VC) of 0.39 (Figure 4a; Supplementary Table S1). Of these reads, a mean of 82.39% was successfully mapped against the E. grandis genome. The mean ddRADseq loci number per sample was 68,622. This result doubles the expected value according to our in silico prediction (34,634). This loci number also varied between 31,733 and 110,951 per sample, and six samples showed more than 80,000 loci (Figure 4). This loci number variation per sample shows a higher correlation with the number of reads per samples (r2: 0.8742) than with the mean coverage per sample (r2: 0.3654). The overall depth of coverage was 11.56 × (sd: 2.44, Supplementary Table S1). We identified 138,624 SNPs in 62,487 polymorphic loci. After applying filters of MAF 0.05 and 20% of missing data, we obtained 16,371 SNPs distributed in 9,466 ddRADseq loci, with a mean of 1.73 SNPs per locus. Of these SNPs, 15,950 were located through all the 11 chromosomes of the E. grandis genome (Figure 5), whereas the rest were located in the scaffolds, and thus were discarded from further analysis.

3.4. Evaluation of Robustness—Sequencing Platform Comparison

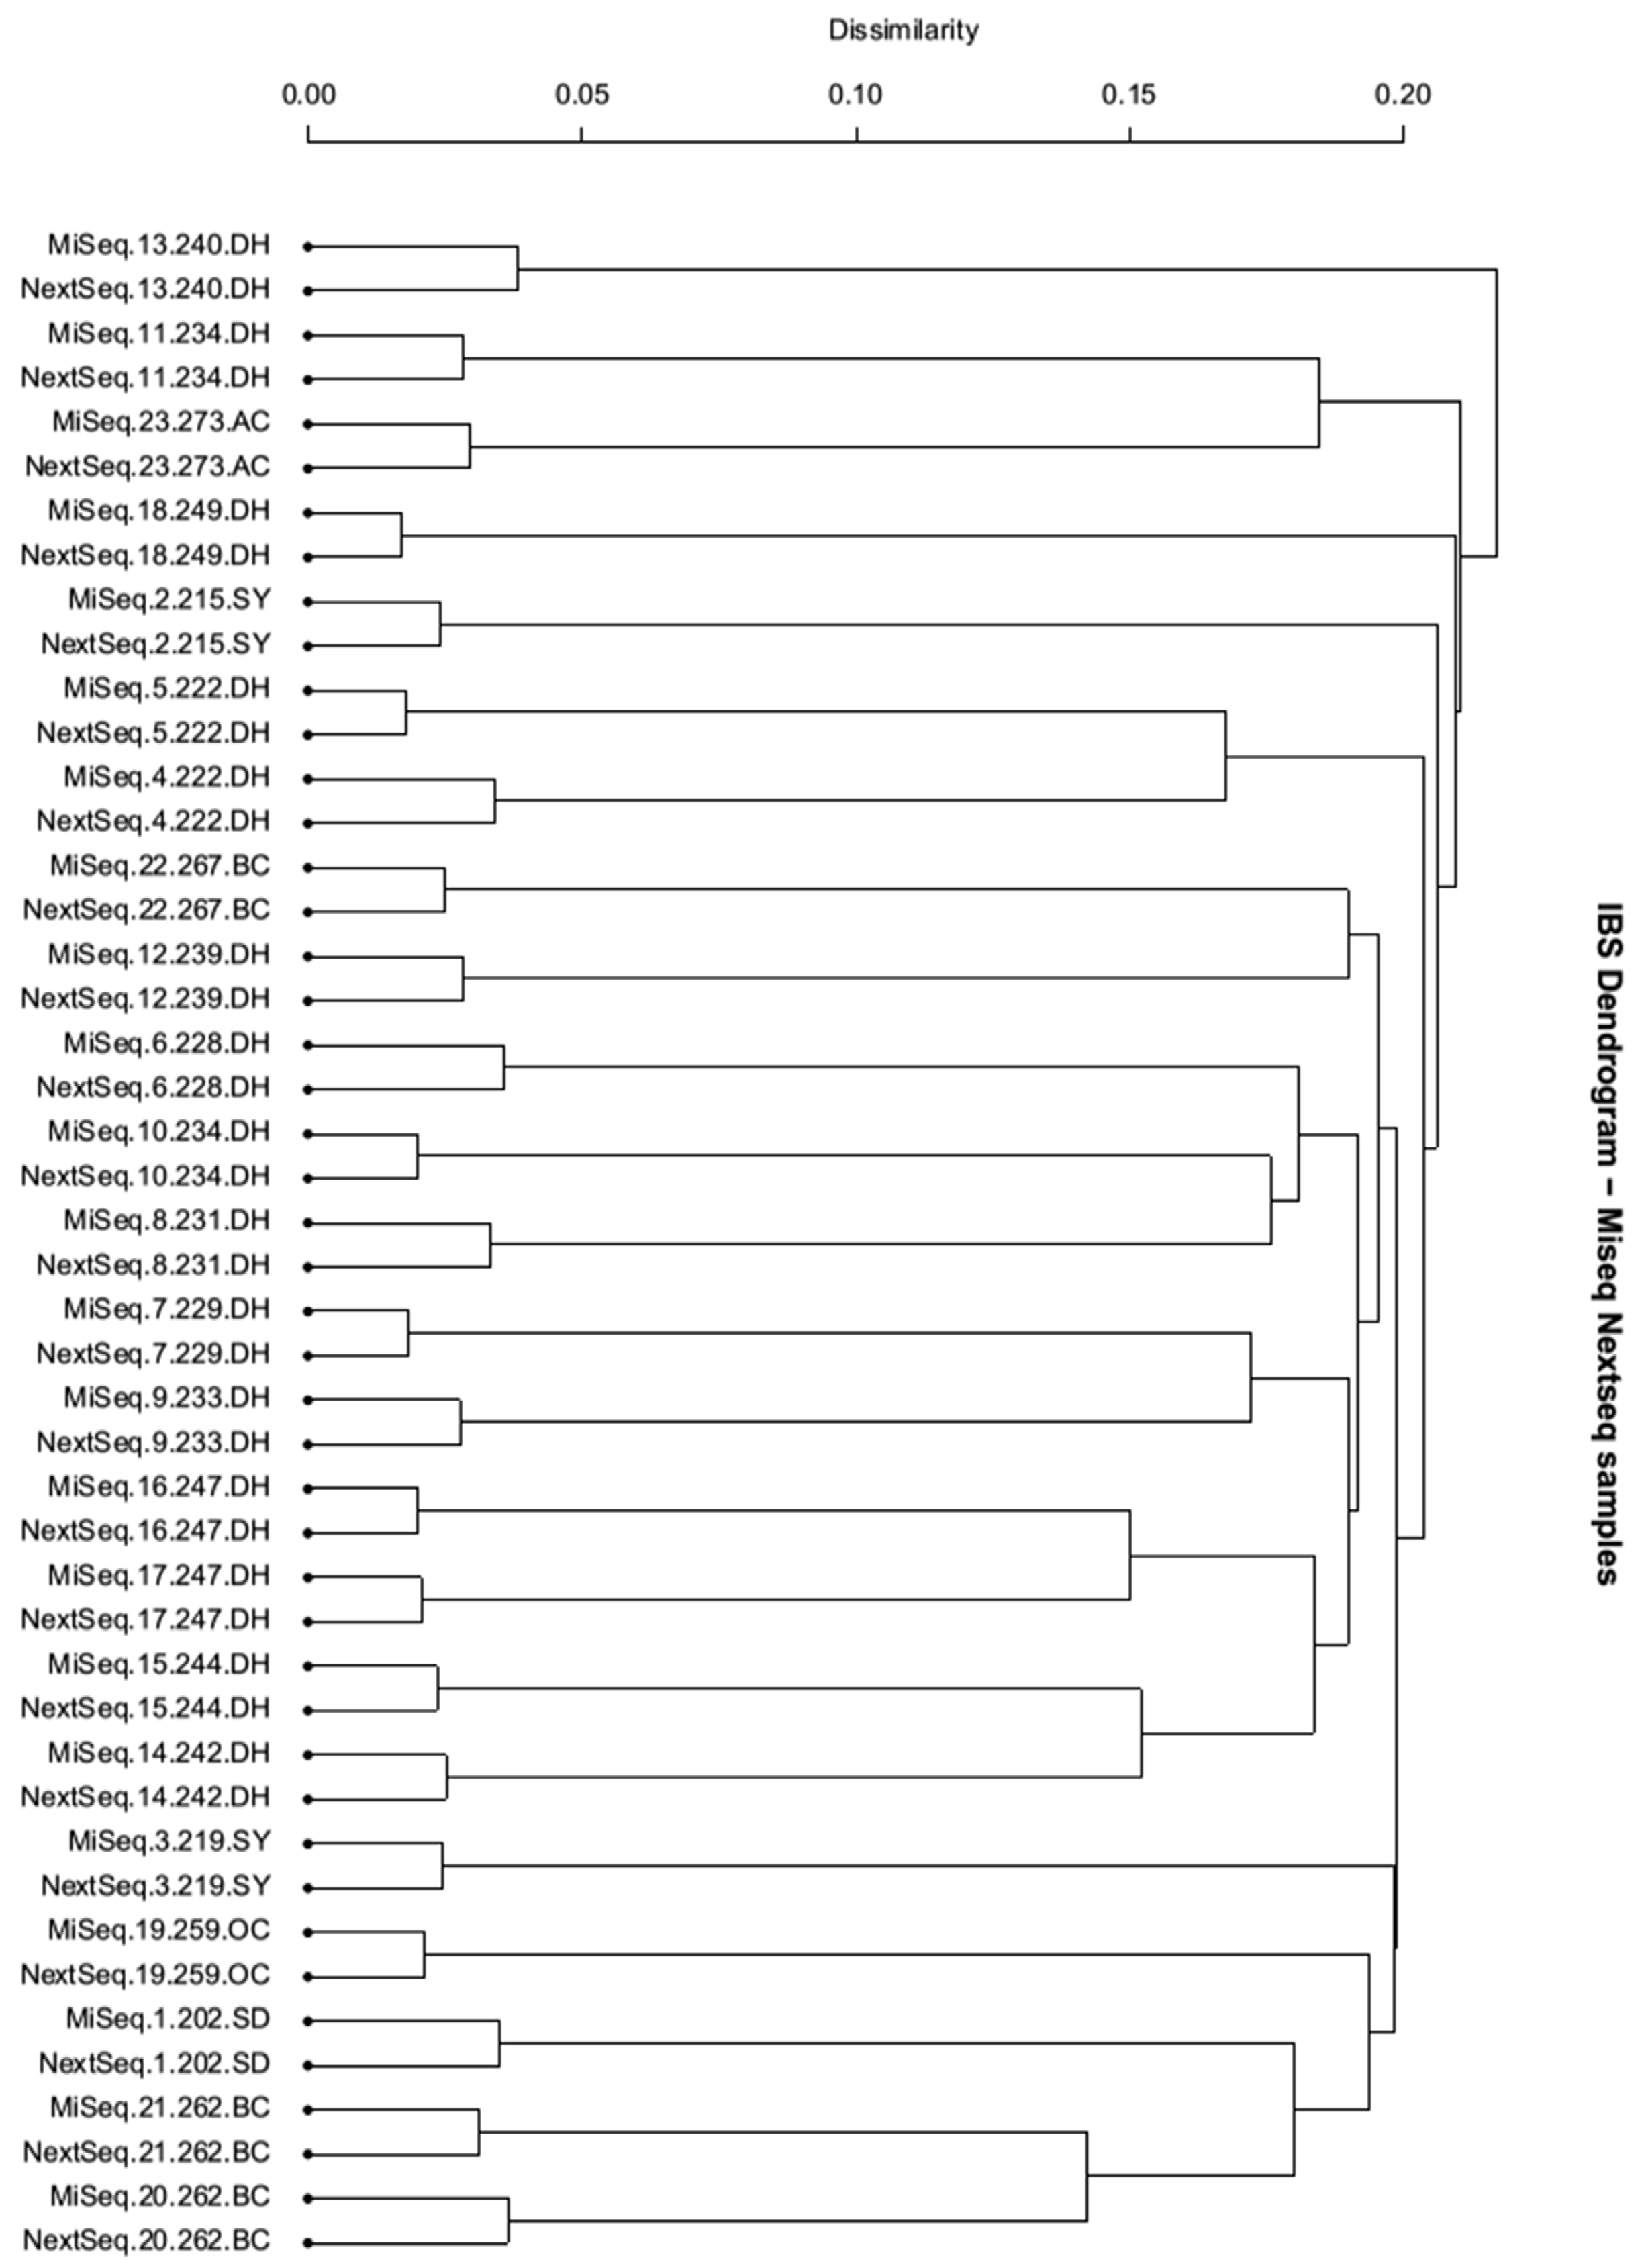
The 23-plex pool of libraries was sequenced using MiSeq (Illumina Inc.) in low coverage (4.49×, with a range between 3.94 and 5.32×). From the overall number of 138,403 PE reads that were obtained per sample, 85% mapped successfully against the E. grandis reference genome. Subsequently, the 46 samples (23 replicates) of both pools sequenced in different platforms (NextSeq and MiSeq) gave 158,996 unfiltered SNPs in 294,212 loci with a mean of 16,807.63 loci per sample. However, after filtering them by quality with the rxstacks correction module, MAF lower than 0.05, and 20% missing data, a total of 1051 SNPs in 702 ddRADseq loci were kept. This final SNP matrix was used to construct a dendrogram (Figure 6). All replicates clustered together, with a dissimilarity coefficient lower than 0.05. This dissimilarity can be explained by the 20% missing data (mostly in MiSeq data, because of the low sequencing coverage), the expected error rate of sequencing and the differences between sequencing technologies. In addition, half-sibs (i.e., family samples 222, 247, 262) had the lowest dissimilarity coefficients (below 0.17), in accordance with the expected close relationships within families.

4. Discussion

Restriction-site associated DNA sequencing methodologies are becoming the most popular strategies in genomic data generation for a variety of applications related to crop and tree species breeding and genetics [15]. Nevertheless, for the Eucalyptus genus, the use of RADseq-derived methods is scarce. To date, the easy access to the commercial SNP array (EUChip60K) has led researchers to use it in the analysis of the genus [41,42,43,44], rather than RADseq-derived methods. Some species are poorly or less frequently represented in this chip than E. grandis (which is represented for its economic importance), and for this reason, the population allele frequencies and genetic relationships between individuals can be affected [45,46,47]. RADseq and GBS-based methodologies have the potential to avoid this type of bias [30], but the experience in Eucalyptus reported to date is not encouraging. Indeed, Duran et al. [41] applied GBS on 500 E. globulus individuals and only obtained 2597 polymorphic SNPs between them. The low number of markers suggests that the protocol should be improved for this genus in order to get enough whole genome coverage markers to perform population-level studies, such as genome-wide association mapping and genomic selection, among others. In addition, there are technical inconveniences associated with GBS and its derived protocols, since these can only enrich populations of sequenced DNA fragments that are below ~350 bp. Moreover, these protocols also result in high levels of missing data (reviewed in [48] and [49]). RADseq, on the other hand, involves more steps and equipment, as well as higher quantities of initial gDNA, and shows high read depth variation.
This study describes the optimization of a ddRADseq derived protocol for E. dunnii genotyping. Unlike these last methods, ddRADseq uses two enzymes and reduces the subset of sampled fragments, which allows higher reproducibility, greater loci coverage, larger fragment sizes and more effective SNPs [9,49]. Although allele dropout increases in comparison with RADseq [5], all the mentioned characteristics make ddRADseq genotyping a putatively more appropriate strategy.
With this in mind, we developed a modified protocol for achieving an optimized low-cost ddRADseq (P1) for plant species. This protocol was set up with a small sample (only two individuals), and thereafter was scaled up to perform on larger population analyses (P2).
Like in Peterson et al.’s protocol [16], the ligation step in P1 involves universal adapters, and PCR is performed before pooling the samples. Thus, the size selection turns out to be the last step of the protocol. The development of the P1 involved the analysis of different enzyme combinations and three concentrations and proportions of the adapters. Additionally, instead of the 6 bp-length Index Illumina primers, we used 16 forward primers and 96 reverse primers with an 8 bp-length index, which were designed by Lange et al. [29]. This change allowed higher multiplexing of samples, not only for library construction, but also for sequencing (up to 1536 samples). Moreover, we changed automatic size selection for manual size selection by agarose gel. All these modifications allowed P1 to be easily applicable on a very low number of E. dunnii samples and with minimal cost. Thus, this strategy may be extrapolated to other plant species, becoming an attractive tool for low-budget labs.
Despite its potential utility for setting up a ddRADseq protocol in any plant species, P1 involved the management of each sample independently until almost the end of the protocol, precluding its use with a large number of samples. In this regard, we propose P2 as a scale-up of P1. The addition of 24 adapters with barcodes in the ligation step allowed the pooling of samples and the application of size selection before PCR, as reported in ddRADseq [9]. Moreover, the use of different barcode lengths (4 to 9 bp, Poland et al. [27]) allowed us to avoid sequencing phasing error at the beginning of reads, as reported in GBS and MiddRADseq [3,17], but not considered in the original ddRADseq [9]. For this scaled-up P2, we also proposed the use of automatic size selection, which would decrease the possibility of cross-contamination and increase the precision and consistency when applying the protocol for more than one pool of samples [5], as reported in the original ddRADseq [9].
The first and maybe most critical step in every RADseq method is obtaining good quality, quantity and integrity of DNA material. Even ddRADseq has this high quality gDNA requirement [49]. Thus, gDNA extraction has to be done with a method that ensures gDNA integrity, and this integrity must be checked (e.g., by using a Nanodrop®-type spectrophotometer). gDNA needs to be quantified through a sensitive method such as Qubit® (Thermofisher). For instance, if gDNA is degraded, or if the quantity is insufficient, the results may retrieve higher VC between the read numbers obtained for each sample. With the CTAB DNA extraction protocol, we were able to reach the required gDNA integrity and quantity (See Supplementary File S1) [50]. However, high concentrations of good quality gDNA are not always easy to achieve in all species. In this regard, the initial amount of gDNA needed for the protocol is something to be considered. Whereas some ddRADseq-derived protocols rely on a high amount of starting material (e.g., 1000 ng [51]), our protocol requires minimal quantities (only 150 ng). The VC obtained for our samples (0.39) is lower, but at the same order of magnitude, than the ones reported for other ddRADseq approaches (e.g., 0.42, [28], 0.47, [51]). Moreover, the obtained VC is clearly influenced by the E. dunnii-1.202.SD sample, which has the lowest number of sequenced reads, and thus the lowest amount of genotyped markers.
Regarding the criteria for enzyme selection, some authors have proposed selecting enzymes for a specific species based only on in silico prediction, whereas others have suggested using universal enzymes (e.g., after doing an in silico evaluation of many enzymes). For example, Yang et al. [17] reported the use of the single universal pair AvaII-MspI for all angiosperms, which include Eucalyptus. Based on our results, the evaluation of enzyme combinations (one frequent and one rare cutter) through both in silico and in vitro methods is an essential step in optimizing ddRADseq in new species (e.g., [52]). Owing to the absence of a reference genome for E. dunnii, we used the reference genome of a species of the same genus (E. grandis) for in silico prediction instead. Nevertheless, if the species under study lacks a reference genome (or a species that may be taken as reference because of its close proximity), the in silico prediction can also be done based on other information such as GC content and genome size [27].
In this study, the combination SphI-MboI showed a homogeneous digestion profile with a high number of fragments in the size selection range evaluated by both in silico and in vitro digestions, in comparison with PstI-MspI. Therefore, we selected SphI-MboI for the subsequent steps.
Another critical step to be adjusted is the size selection range window. First, according to previous studies (i.e., [28,51]), if the size selection for a RADseq-derived protocol is done in gel, and with a 100 bp ladder, the use of multiple ranges of 50 bp or 100 bp is advisable in order to minimize hand excision errors. That is why we evaluated (in silico) windows of 100 bp or 150 bp in a range between 220 and 470 bp for insert DNA fragments of interest within a range of 350 to 600 bp, when manual size selection was performed in P1. This inconvenience does not occur when using automatic size selection equipment. However, the amplitude of the range is delimited by the capacity of the equipment used in this study (i.e., in Sage ELF 2%, the range of each size selected correctly is around 70 bp, sagescience.com). This last window size is comparable to the “wide” size selection (72 bp) applied in the original ddRADseq protocol [9].
On the other hand, final library fragment sizes should not be too small (i.e., < 200 bp) to avoid overlapping of the PE sequences, which should result in SNPs overestimation when doing de novo and with reference analyses. This is because Stacks v1.48 considers PE reads as independent loci (i.e., the software does not perform contig assembly in overlapping reads, [32]). Neither should the fragments be too long (i.e., >800 bp), because long fragments retrieve lower base quality in Illumina PE sequencing [53].
In comparison with MiddRADseq [17], we also used in silico prediction to evaluate the size selection. However, while those researchers used a window size of 300 bp (400–700 bp), we selected a narrower window of 70 or 100 bp (in the range of 320–420 bp in the manual selection and a mean of 370 bp for the automated selection). In a recent publication, Kess et al. [51] reported the use of a 300-bp window size. The use of thinner ranges avoids potential PCR amplification bias that would increase when using fragments with different lengths, while declining data quantity and quality [54,55]. Moreover, fewer reads per sample are needed to reach an optimal mean coverage per locus.
In terms of the number of ddRADseq loci generated with P1, we obtained 50% more loci per sample than the predicted loci (74,640 mean loci obtained per sample and 49,016 expected loci). Moreover, after filtering the catalog by rxstacks, we obtained a better correlation, with only 15% fewer loci than the predicted loci (41,834 ddRADseq loci). On the other hand, by using P2, we obtained a mean of 68,622.38 ddRADseq loci per sample. This result doubles the expected in silico prediction (34,634.00). According to Scaglione et al. [28], this phenomenon may be due to the stochastic possibility of each individual to yield loci that are out of the target [32]. In fact, ddRADseq loci present variability between samples, showing a higher correlation with the number of reads per samples (r2: 0.8742) than with the mean coverage per sample (r2: 0.3654). Moreover, the differences in genome sizes between the species and in the genome structures should also be considered. Indeed, only around 82% of the reads of E. dunnii were successfully mapped against the E. grandis reference genome.
With regard to the size selection methodology, we used both manual and automatic size selection. For P1, we applied the manual excision in agarose electrophoresis gels to reach a low-cost methodology, as in Scaglione et al. [28] and MiddRADseq [17], whereas for P2 we used the SAGE ELF device. In most publications, researchers use Pippin-prep as the automatic method of choice (e.g., [9]). However, we used SAGE ELF. We selected this method because it is easier to set up and gives tighter and higher DNA recovery in comparison with BluePippin [56]. As expected, the implementation of the manual size section (P1) method compared to the automatic one (P2) showed that the automatic method resulted in few recovered loci (74,640 vs. 68,622 loci). The lower number of loci is due to the restricted size range used in P2.
Another critical point for the set-up is the optimal concentration of adapters. In this work, we tested different concentrations (data not shown), and finally chose similar concentrations to those reported in Scaglione et al. [28]. Some protocols assess different adapter concentrations by titration [3,9]. Nevertheless, this procedure is not required for species with genomes below 20 Gb, such as Eucalyptus [17]. An excess of adapters can be used for proper ligation with DNA fragments, as in our protocols. Moreover, we used a Y-adapter form for the common restriction site. This generates ddRADseq libraries where Adapter 1 and Adapter 2 are on opposite ends of every amplified fragment. This type of library construction can reduce complexity [9,16,17,30]. Our P1 only requires a pair of adapters per set of enzymes, thus avoiding a substantial investment of funds at the beginning of the assay.
The P2 includes adapters with barcodes, as in the original ddRADseq and MiddRADseq protocols [9,17]. This addition simplifies downstream steps. For instance, many samples can be pooled in the same library, thus reducing the number of simultaneous reactions to just one. In addition, we specifically used 24 barcodes of different length designed for two-enzyme GBS protocol [30], as proposed in the original GBS protocol [3], and as performed in MiddRADseq [17], but not in the original ddRADseq [9]. The use of barcodes with different length avoids phasing error (low sequence quality). This error occurs when all the bases at the beginning of reads are the same in all clusters (Illumina sequencing) because of the restriction site. In P1, we solved this problem by using at least 5% of PhiX, as described in Peterson et al.’s protocol [16], or by mixing the ddRADseq libraries in the same sequencing run with other types of libraries with greater nucleotide variability in the first bases.
In the PCR step, an extra level of multiplexing can be achieved by using forward and reverse indexes that allow the inclusion of more libraries in the same sequencing lane. This is one of the main singularities of our protocols. In both protocols, we used the dual indexes developed by Lange et al. [29] within the PCR primers forward (16) and reverse (96). These combinatorial indexes allowed us to multiplex almost 1536 samples/libraries in the same lane. In this sense, our protocols are not limited by the number of Illumina Indexes, as in other ddRADseq methods [9,16,17]. Lower throughput sequencers (e.g., MiSeq, Illumina Inc.) may not support pooling such large numbers of libraries. By contrast, the use of higher throughput sequencers usually requires the capability of multiplexing to reduce budgets. With P2, we would be able to multiplex up to 36,864 samples (24 barcodes × 1536 primers). For example, we would be able to run them in low depth on a NovaSeq sequencer, which gives a maximum number of reads of 20 billion (for a dual S4 flow cell run on the NovaSeq 6000 System, Illumina Inc.).
Due to the absence of a reference genome for E. dunnii, we decided to work with Stacks [32] on both strategies, de novo and with reference analyses (called ref_map.pl and denovo_map.pl, respectively, in the software), to compare the obtained results in P1. Thus, we were able to apply both analyses to identify SNPs and SSRs with high accuracy after applying stringent bioinformatics settings and quality filters (Supplementary File S2). As expected, the de novo analysis retrieved more ddRADseq loci and markers, as all the reads were considered for marker identification, than with reference analysis, which only considered the reads that mapped against the reference genome (82% of the reads).
Both protocols achieved an optimal coverage (10–20× [5]), and consequently these can be efficiently used for a confident de novo loci calling. However, this strategy requires more stringent criteria and parameters when defining the loci, because of the larger number of false positives obtained using this method [57]. Thus, for further evaluation, we worked with the SNPs called using the E. grandis reference. Using the information of samples A and B generated with P1, we identified 7346 SNPs shared between the two samples. When applying P2 on 24 E. dunnii individuals, and after discarding the markers with high percentage of missing data, we identified and physically mapped 15,950 SNPs. These markers showed homogeneous distribution in the chromosomes. Even though a higher number of SNPs (138,624) was identified using P2 data. Based on our previous experience with imputation strategies for ddRADseq data [58], we applied a 20% missing data cut-off before performing further analysis.
We identified a mean of 1.95 SNPs within 145 bp between individuals A and B of E. dunnii with P1 (1 SNP each 74 bp) and 1.73 SNPs within 66 bp through 24 individuals with P2 (1 SNP each 38 bp). The difference between P1 and P2 also relies on the different number of samples tested between protocols (two individuals vs. 24, respectively). This causes P2 to yield higher polymorphism frequencies (or SNPs locus density). Even though there is no reported information for E. dunnii, these frequencies are in the same range than those observed for other species from the Eucalyptus genus. Indeed, Hendre et al. [59] reported 1 SNP per 65 pb in introns and per 108 pb in exons in E. camaldulensis, whereas Külheim et al. [60] detected 1 SNP in every 33 bp, 31 bp, 16 bp and 17 bp for E. nitens, E. globulus, E. camaldulensis and E. loxophleba, respectively.
The cross-platform compatibility of the obtained SNPs and the robustness in the ddRADseq derived SNPs calling are critical, but these issues have been studied less. Only one report [61] describes the assessment of the performance of Hiseq and NextSeq for ddRADseq-derived identification of SNPs in the butterfly genus. In our study, we sequenced the same 23 samples with both MiSeq and NextSeq sequencing platforms. As expected, the 23-sample NextSeq library (P2) recovered more loci than the 23-sample MiSeq library, with an overall higher mean read depth per locus and less missing data. This is attributed to the lower sequenced depth used in MiSeq data vs. NextSeq (4.49× vs. 11.56×, respectively). Both sequencing platforms achieve a high quality of data, according to FastqC report. More than 96% of the generated reads passed the Stacks quality filters and were kept for subsequent analysis. The low dissimilarity coefficient values between replicates (0.05) confirmed high reliability, despite the differences between the libraries’ constructions and sequencing platforms.
P1 may be used in the first steps when applying a GBS/ddRADseq methodology in a laboratory. Its low cost relies mainly on the use of universal adapters for each enzyme, such as those used by Peterson et al. [16], the use of primers with 1536 combinatorial dual-index and the performing of a final size selection by agarose gel electrophoresis. Moreover, depending on the research focus, the generated sequences for a small number of samples (at least two) could be enough to obtain new marker information. It is interesting to notice that, whereas the cost per SNP genotyped in an array or an NGS derived technique falls when the number of interrogated SNPs rises, not all genomic studies relies on genotyping of a high number of markers. Because of the cost balance, many population studies, mainly related to conservation and evolution, give priority to raising the number of individuals sampled, rather than to adding more markers. A good example of this is the use of sequences for species-specific SSR identification, and even more so, for polymorphic SSRs and the heterozygous state of an individual. RADseq methods involve NGS, and the reads can consequently be used to design primers. These SSRs could then be used for population fingerprinting by using another genotyping strategy like fluorescent capillary electrophoresis. By using with reference genome analysis, we successfully identified SSRs (420 putative SSRs and 16 polymorphic in almost all chromosomes) using MISA [37] based on P1 data (sample A and B). A more comprehensive analysis of SSR identification using ddRADseq data can be found in a previous publication [38].
In summary, after setting an initial protocol P1 for the species of interest, P2 can be used for scaling up. The incorporation of adapters with custom-designed barcodes compatible with the enzyme restriction sites can make the method faster. This incorporation allowed us to pool 24 samples in the same library. This early barcoding simplified the following steps in the protocol. As with the original ddRADseq protocol, the approach described here can be used with a range of different restriction enzymes to produce a higher or lower complexity reduction of the genome being assayed.

5. Conclusions

The combined or individual use of our two protocols (P1 for setting up in a low number of samples and P2 for scaling up the number of samples) presented here show the pros of similar reported protocols but diminishes the drawbacks. Furthermore, the advantages of RADseq-derived methods, such as de novo marker discovery and removal of ascertainment bias in new germplasm, may make the ddRADseq technology one of the most promising genotyping approaches in the future.

Supplementary Materials

The following are available online at https://www.mdpi.com/2073-4395/9/9/484/s1, Supplementary Materials: Supplementary_File_S1_Protocol1_Aguirre_et_al_2019.docx: Protocol 1: Optimized ddRADseq (setting it up in new species with a low number of samples). Supplementary_File_S2_Command_lines_Aguirre_et_al_2019.docx: Command lines for performing in silico digestion of the reference genome and for ddRADseq data analysis. Supplementary_File_S3_Protocol2_Aguirre_et_al_2019.docx: Protocol 2: Optimized ddRADseq (scaling up to a higher number of samples). Supplementary_Tables_Aguirre_et_al_2019.xlsx: Table S1. General information of the two Eucalyptus dunnii individuals used in Protocol 1 and the 24 E. dunnii individuals used in Protocol 2. ddRADsequencing results (number of generated reads, % of reads mapping against the E. grandis reference genome), mean coverage per sample. Results of the analysis achieved using Stacks (Catchen et al. 2013). Table S2. List and sequences of the universal adapters, barcoded adapters and sequencing primers used in the optimized ddRADseq Protocols 1 and 2. Table S3. Polymorphic SSR identified in two E. dunnii ddRADseq data, considering with and without reference genome analysis. Figure S1. Schematic representation of the Final Library construction for both Protocol 1 and 2.

Author Contributions

Conceptualization, N.C.A., C.V.F., G.Z., M.C.M., H.E.H., N.B.P. and S.N.M.P.; methodology, N.C.A., C.V.F., G.Z., J.G.R., C.V.A., P.V.V. M.N.G. and M.C.M.; software and data analysis, N.C.A., C.V.F., G.Z., S.G. and M.R.; validation, N.C.A., C.V.F., G.Z., J.G.R., C.V.A., P.V.V., and M.N.G.; formal analysis, N.C.A., C.V.F., G.Z., A.F.P., and N.B.P.; investigation, N.C.A., C.V.F., G.Z., J.G.R., C.V.A., P.V.V., M.N.G., S.G., M.R., M.C.M., A.F.P., N.B.P. and S.N.M.P.; resources, M.M., H.E.H., N.B.P. and S.N.M.P.; data curation, N.C.A., C.V.F., G.Z., S.G., and M.R.; writing—original draft preparation, N.C.A., C.V.F., M.C.M., H.E.H., N.B.P. and S.N.M.P.; writing—review and editing, N.C.A., C.V.F., G.Z., M.C.M., M.M., H.E.H., N.B.P. and S.N.M.P.; visualization, N.C.A., C.V.F., G.Z., J.G.R., C.V.A., P.V.V., M.N.G., S.G., M.R., M.C.M., A.F.P., M.M., H.E.H., N.B.P. and S.N.M.P. supervision, M.C.M., A.F.P., G.Z., N.B.P. and S.N.M.P. project administration, A.F.P., N.B.P. and S.N.M.P.; funding acquisition, M.C.M., M.M., H.E.H., N.B.P. and S.N.M.P.

Funding

This research was funded by the INTA PNBIO-1131042, Marie Curie International Research Staff Exchange Scheme under grant agreement [612583-DEANN], PICT 2014-0795 Project.

Acknowledgments

Special thanks to Juan A. Lópz, Martín A. Marcó, Javier Obershelp for selecting and collecting the plant material and Julieta M. Aguirre for designing Figure 1 and Julia Sabio y García for English corrections. Sequencing services using MiSeq (Illumina Inc.) were performed at INTA, Consorcio Argentino de Tecnología Genómica (CATG) funded by grant MinCyT PPL 2011 004 Genómica. This work used computational resources from BioCAD–Instituto de Biotecnología CICVyA, INTA, Consorcio Argentino de Tecnología Genómica, MinCyT PPL 2011 004; AECID PCI_ARG109, D/024562/09. We would like to thank the editor and reviewers for careful reading, and constructive suggestions.

Conflicts of Interest

The authors declare no conflict of interest.

References

  1. Torkamaneh, D.; Boyle, B.; Belzile, F. Efficient Genome wide genotyping strategies and data integration in crop plants. Theor. Appl. Genet. 2018, 131, 499. [Google Scholar] [CrossRef] [PubMed]
  2. Baird, N.A.; Etter, P.D.; Atwood, T.S.; Currey, M.C.; Shiver, A.L.; Lewis, Z.A.; Selker, E.U.; Cresko, W.A.; Johnson, E.A. Rapid SNP discovery and genetic mapping using sequenced RAD markers. PLoS ONE 2008, 3, e3376. [Google Scholar] [CrossRef] [PubMed]
  3. Elshire, R.J.; Glaubitz, J.C.; Sun, Q.; Poland, J.A.; Kawamoto, K.; Buckler, E.S.; Mitchell, S.E. A robust, simple genotyping-by-sequencing (GBS) approach for high diversity species. PLoS ONE 2011, 6, e19379. [Google Scholar] [CrossRef] [PubMed]
  4. Davey, J.W.; Hohenlohe, P.A.; Etter, P.D.; Boone, J.Q.; Catchen, J.M.; Blaxter, M.L. Genome-wide genetic marker discovery and genotyping using next-generation sequencing. Nat. Rev. Genet. 2011, 12, 499–510. [Google Scholar] [CrossRef] [PubMed]
  5. Andrews, K.R.; Good, J.M.; Miller, M.R.; Luikart, G.; Hohenlohe, P.A. Harnessing the power of RADseq for ecological and evolutionary genomics. Nat. Rev. Genet. 2016, 17, 81–92. [Google Scholar] [CrossRef] [PubMed] [Green Version]
  6. Timm, H.; Weigand, H.; Weiss, M.; Leese, F.; Rahmann, S. DDRAGE: A data set generator to evaluate ddRADseq analysis software. Mol. Ecol. Resour. 2018, 18, 681–690. [Google Scholar] [CrossRef]
  7. Wang, S.; Meyer, E.; Mckay, J.K.; Matz, M.V. 2b-RAD: A simple and flexible method for genome-wide genotyping. Nat. Methods 2012, 9, 808–810. [Google Scholar] [CrossRef]
  8. Toonen, R.J.; Puritz, J.B.; Forsman, Z.H.; Whitney, J.L.; Fernandez-Silva, I.; Andrews, K.R.; Bird, C.E. ezRAD: A simplified method for genomic genotyping in non-model organisms. PeerJ 2013, 1, e203. [Google Scholar] [CrossRef]
  9. Peterson, B.K.; Weber, J.N.; Kay, E.H.; Fisher, H.S.; Hoekstra, H.E. Double digest RADseq: An inexpensive method for de novo SNP discovery and genotyping in model and non-model species. PLoS ONE 2012, 7, e37135. [Google Scholar] [CrossRef]
  10. Nazareno, A.G.; Bemmels, J.B.; Dick, C.W.; Lohmann, L.G. Minimun sample sizes for population genomics: An empirical study from an Amazonian plant species. Mol. Ecol. Resour. 2017, 17, 1136–1147. [Google Scholar] [CrossRef] [PubMed]
  11. Pyne, R.; Honig, J.; Vaiciunas, J.; Koroch, A.; Wyenandt, C.; Bonos, S.; Simon, J. A first linkage map and downy mildew resistance QTL discovery for sweet basil (Ocimum basilicum) facilitated by double digestion restriction site associated DNA sequencing (ddRADseq). PLoS ONE 2017, 12, e0184319. [Google Scholar] [CrossRef] [PubMed]
  12. Roy, S.C.; Moitra, K.; De Sarker, D. Assessment of genetic diversity among four orchids based on ddRAD sequencing data for conservation purposes. Physiol. Mol. Biol. Plants 2017, 23, 169–183. [Google Scholar] [CrossRef] [PubMed]
  13. Vargas, O.M.; Ortiz, E.M.; Simpson, B.B. Conflicting phylogenomic signals reveal a pattern of reticulate evolution in a recent high-Andean diversification (Asteraceae: Astereae: Diplostephium). New Phytol. 2017, 214, 1736–1750. [Google Scholar] [CrossRef] [PubMed]
  14. Zhou, X.; Xia, Y.; Ren, X.; Chen, Y.; Huang, L.; Huang, S.; Liao, B.; Lei, Y.; Yan, L.; Jiang, H. Construction of SNP-based genetic linkage map in cultivated peanut basedon large scale marker development using next-generation double-digest restriction associated DNA sequencing (ddRADseq). BMC Genom. 2014, 15, 351. [Google Scholar] [CrossRef] [PubMed]
  15. Parchman, T.L.; Jahner, J.P.; Uckele, K.A.; Galland, L.M.; Eckert, A.J. RADseq approaches and applications for forest tree genetics. Tree Genet. Genomes 2018, 14. [Google Scholar] [CrossRef]
  16. Peterson, G.W.; Dong, Y.; Horbach, C.; Fu, Y.B. Genotyping-by-sequencing for plant genetic diversity analysis: A lab guide for SNP genotyping. Diversity 2014, 6, 665–680. [Google Scholar] [CrossRef]
  17. Yang, G.Q.; Chen, Y.M.; Wang, J.P.; Guo, C.; Zhao, L.; Wang, X.Y.; Guo, Y.; Li, L.; Li, D.Z.; Guo, Z.H. Development of a universal and simplified ddRAD library preparation approach for SNP discovery and genotyping in angiosperm plants. Plant Methods 2016, 12, 1–17. [Google Scholar] [CrossRef] [PubMed] [Green Version]
  18. Barchi, L.; Lanteri, S.; Portis, E.; Acquadro, A.; Valè, G.; Toppino, L.; Rotino, G.L. Identification of SNP and SSR markers in eggplant using RAD tag sequencing. BMC Genom. 2011, 12, 304. [Google Scholar] [CrossRef]
  19. Torales, S.L.; Rivarola, M.; Gonzalez, S.; Inza, M.V.; Pomponio, M.F.; Fernández, P.; Acuña, C.V.; Zelener, N.; Fornés, L.; Hopp, H.E.; et al. De novo transcriptome sequencing and SSR markers development for Cedrela balansae C.DC., a native tree species of northwest Argentina. PLoS ONE 2018, 13, e0203768. [Google Scholar] [CrossRef]
  20. Hodel, R.G.J.; Segovia-Salcedo, M.C.; Landis, J.B.; Crowl, A.A.; Sun, M.; Liu, X.; Gitzendanner, M.A.; Douglas, N.A.; Germain-Aubrey, C.C.; Chen, S.; et al. The report of my death was an exaggeration: A review for researchers using microsatellites in the 21st century. Appl. Plant Sci. 2016, 4, 1600025. [Google Scholar] [CrossRef]
  21. Silva-Junior, O.B.; Faria, D.A.; Grattapaglia, D. A flexible multi-species genome-wide 60K SNP chip developed from pooled resequencing of 240 Eucalyptus tree genomes across 12 species. New Phytol. 2015, 206, 1527–1540. [Google Scholar] [CrossRef] [PubMed]
  22. Sansaloni, C.P.; Petroli, C.D.; Carling, J.; Hudson, C.J.; Steane, D.A.; Myburg, A.A.; Grattapaglia, D.; Vaillancourt, R.E.; Kilian, A. A high-density Diversity Arrays Technology (DArT) microarray for genome-wide genotyping in Eucalyptus. Plant Methods 2010, 6, 1–11. [Google Scholar] [CrossRef] [PubMed]
  23. Grattapaglia, D.; de Alencar, S.; Pappas, G. Genome-wide genotyping and SNP discovery by ultra-deep Restriction-Associated DNA (RAD) tag sequencing of pooled samples of E. grandis and E. globulus. BMC Proc. 2011, 5 (Suppl. 7), P45. [Google Scholar] [CrossRef]
  24. Hoisington, D.; Khairallah, M.; González-de-león, D. Laboratory Protocols: CIMMYT Applied Molecular Genetics Laboratory, 2nd ed.; CIMMYT: México, DF, Mexico, 1994. [Google Scholar]
  25. Marcucci Poltri, S.N.; Zelener, N.; Rodriguez Traverso, J.; Gelid, P.; Hopp, H.E. Selection of a seed orchard of Eucalyptus dunnii based on genetic diversity criteria calculated using molecular markers. Tree Physiol. 2003, 23, 625–632. [Google Scholar] [CrossRef] [PubMed]
  26. Myburg, A.A.; Grattapaglia, D.; Tuskan, G.A.; Hellsten, U.; Hayes, R.D.; Grimwood, J.; Jenkins, J.; Lindquist, E.; Tice, H.; Bauer, D. The genome of Eucalyptus grandis. Nature 2014, 510, 356–362. [Google Scholar] [CrossRef] [PubMed] [Green Version]
  27. Lepais, O.; Weir, J.T. SimRAD: An R package for simulation-based prediction of the number of loci expected in RADseq and similar genotyping by sequencing approach. Mol. Ecol. Resour. 2014. [Google Scholar] [CrossRef] [PubMed]
  28. Scaglione, D.; Fornasiero, A.; Pinto, C.; Cattonaro, F.; Spadotto, A.; Infante, R.; Meneses, C.; Messina, R.; Lain, O.; Cipriani, G.; et al. A RAD-based linkage map of kiwifruit (Actinidia chinensis Pl.) as a tool to improve the genome assembly and to scan the genomic region of the gender determinant for the marker-assisted breeding. Tree Genet. Genomes 2015, 11. [Google Scholar] [CrossRef]
  29. Lange, V.; Böhme, I.; Hofmann, J.; Lang, K.; Sauter, J.; Schöne, B.; Paul, P.; Albrecht, V.; Andreas, J.M.; Baier, D.M. Cost-efficient high-throughput HLA typing by MiSeq amplicon sequencing. BMC Genom. 2014, 15. [Google Scholar] [CrossRef] [PubMed]
  30. Poland, J.A.; Brown, P.J.; Sorrells, M.E.; Jannink, J.L. Development of high-density genetic maps for barley and wheat using a novel two-enzyme genotyping-by-sequencing approach. PLoS ONE 2012, 7, e32253. [Google Scholar] [CrossRef]
  31. Andrews, S. FASTQC: A Quality Control Tool for High Throuput Sequencing Data. 2010. Available online: http://www.bioinformatics.babraham.ac.uk/projects/fastqc/ (accessed on 19 November 2015).
  32. Catchen, J.; Hohenlohe, P.A.; Bassham, S.; Amores, A.; Cresko, W.A. Stacks: An analysis tool set for population genomics. Mol. Ecol. 2013, 22, 3124–3140. [Google Scholar] [CrossRef] [PubMed]
  33. Catchen, J.M.; Amores, A.; Hohenlohe, P.; Cresko, W.; Postlethwait, J.H. Stacks: Building and Genotyping Loci De Novo From Short-Read Sequences. G3 (Bethesda) 2011, 1, 171–182. [Google Scholar] [CrossRef] [PubMed]
  34. Torkamaneh, D.; Laroche, J.; Belzile, F. Genome-Wide SNP Calling from Genotyping by Sequencing (GBS) Data: A Comparison of Seven Pipelines and Two Sequencing Technologies. PLoS ONE 2016, 11, e0161333. [Google Scholar] [CrossRef] [PubMed]
  35. Wickland, D.; Battu, G.; Hudson, K.A.; Diers, B.W.; Hudson, M.E. A comparison of genotyping-by-sequencing analysis methods on low-coverage crop datasets shows advantages of a new workflow, GB-eaSy. BMC Bioinform. 2017, 18, 586. [Google Scholar] [CrossRef] [PubMed]
  36. Langmead, B.; Salzberg, S. Fast gapped-read alignment with Bowtie 2. Nat. Methods 2012, 9, 357–359. [Google Scholar] [CrossRef] [PubMed] [Green Version]
  37. Thiel, T.; Michalek, W.; Varshney, R.; Graner, A. Exploiting EST databases for the development and characterization of gene-derived SSR-markers in barley (Hordeum vulgare L.). Theor. Appl. Genet. 2003, 106, 411–422. [Google Scholar] [CrossRef]
  38. Qin, H.; Yang, G.; Provan, J.; Liu, J.; Gao, L. Using MiddRADseq data to develop polymorphic microsatellite markers for an endangered yew species. Plant Divers. 2017, 39, 294–299. [Google Scholar] [CrossRef]
  39. Zheng, X.; Levine, D.; Shen, J.; Gogarten, S.M.; Laurie, C.; Weir, B.S. A High-performance Computing Toolset for Relatedness and Principal Component Analysis of SNP Data. Bioinformatics 2012. [Google Scholar] [CrossRef]
  40. Wickham, H. ggplot2: Elegant Graphics for Data Analysis; Springer: New York, NY, USA, 2016. [Google Scholar]
  41. Durán, R.; Zapata-Valenzuela, J.; Balocchi, C.; Valenzuela, S. Efficiency of EUChip60K pipeline in fingerprinting clonal population of Eucalyptus globulus. Trees 2018, 32, 663. [Google Scholar] [CrossRef]
  42. Cappa, E.P.; de Lima, B.M.; da Silva-Junior, O.B.; Garcia, C.C.; Mansfield, S.D.; Grattapaglia, D. Improving genomic prediction of growth and wood traits in Eucalyptus using phenotypes from non-genotyped trees by single-step GBLUP. Plant Sci. 2019. [Google Scholar] [CrossRef]
  43. Müller, B.S.F.; de Almeida Filho, J.E.; Lima, B.M.; Garcia, C.C.; Missiaggia, A.; Aguiar, A.M.; Takahashi, E.; Kirst, M.; Gezan, S.A.; Silva-Junior, O.B.; et al. Independent and Joint-GWAS for growth traits in Eucalyptus by assembling genome-wide data for 3373 individuals across four breeding populations. New Phytol. 2019, 221, 818–833. [Google Scholar] [CrossRef]
  44. Suontama, M.; Klápště, J.; Telfer, E.; Graham, N.; Stovold, T.; Low, C.; McKinley, R.; Dungey, H. Efficiency of genomic prediction across two Eucalyptus nitens seed orchards with different selection histories. Heredity 2019, 122, 370–379. [Google Scholar] [CrossRef]
  45. Albrechtsen, A.; Nielsen, F.C.; Nielsen, R. Ascertainment biases in SNP chips affect measures of population divergence. Mol. Biol. Evol. 2010, 27, 2534–2547. [Google Scholar] [CrossRef]
  46. Bajgain, P.; Rouse, M.N.; Anderson, J.A. Comparing genotyping-by-sequencing and single nucleotide polymorphism chip genotyping for quantitative trait loci mapping in wheat. Crop Sci. 2016, 56, 232–248. [Google Scholar] [CrossRef]
  47. Li, B.; Kimmel, M. Factors influencing ascertainment bias of microsatellite allele sizes: Impact on estimates of mutation rates. Genetics 2013, 195, 563–572. [Google Scholar] [CrossRef]
  48. Poland, J.A.; Rife, T.W. Genotyping-by-Sequencing for Plant Breeding and Genetics. Plant Genome 2012, 5, 92–102. [Google Scholar] [CrossRef]
  49. Scheben, A.; Batley, J.; Edwards, D. Genotyping-by-sequencing approaches to characterize crop genomes: choosing the right tool for the right application. Plant Biotech. J. 2017, 15, 149–161. [Google Scholar] [CrossRef] [Green Version]
  50. Inglis, P.W.; Pappas, M.C.R.; Resende, L.V.; Grattapaglia, D. Fast and inexpensive protocols for consistent extraction of high quality DNA and RNA from challenging plant and fungal samples for high-throughput SNP genotyping and sequencing applications. PLoS ONE 2018, 13, e0206085. [Google Scholar] [CrossRef]
  51. Kess, T.; Gross, J.; Harper, F.; Boulding, E.G. Low-cost ddRAD method of SNP discovery and genotyping applied to the periwinkleLittorina saxatilis. J. Molluscan Stud. 2016, 82, 104–109. [Google Scholar] [CrossRef]
  52. Wang, Y.; Cao, X.; Zhao, Y.; Fei, J.; Hu, X.; Li, N. Optimized double-digest genotyping by sequencing (ddGBS) method with high-density SNP markers and high genotyping accuracy for chickens. PLoS ONE 2017, 12, e0179073. [Google Scholar] [CrossRef]
  53. Tan, G.; Opitz, L.; Schlapbach, R.; Rehrauer, H. Long fragments achieve lower base quality in Illumina paired-end sequencing. Sci. Rep. 2019, 9, 2856. [Google Scholar] [CrossRef]
  54. DaCosta, J.M.; Sorenson, M.D. Amplification biases and consistent recovery of loci in a double-digest RAD-seq protocol. PLoS ONE 2014, 9, e106713. [Google Scholar] [CrossRef]
  55. Quail, M.A.; Kozarewa, I.; Smith, F.; Scally, A.; Stephens, P.J.; Durbin, R.; Swerdlow, H.; Turner, D.J. A large genome center’s improvements to the Illumina sequencing system. Nat. Methods 2008, 5, 1005–1010. [Google Scholar] [CrossRef]
  56. Heavens, D.; Garcia Accinelli, G.; Clavijo, B.; Clark, M.D. A method to simultaneously construct up to 12 differently sized Illumina Nextera long mate pair libraries with reduced DNA input, time, and cost. BioTechniques 2015, 59, 42–45. [Google Scholar] [CrossRef] [Green Version]
  57. Rochette, N.C.; Catchen, J.M. Deriving genotypes from RAD-seq short-read data using Stacks. Nat. Protoc. 2017, 12, 2640–2659. [Google Scholar] [CrossRef]
  58. Merino, G. Imputación de Genotipos Faltantes en Datos de Secuencación Masiva. Master’s Thesis, Facultada de Ciencias Agrarias, Universidad Nacional de Córdoba, Córdoba, Argentina, 2018. [Google Scholar]
  59. Hendre, P.S.; Kamalakannan, R.; Rajkumar, R.; Varghese, M. High-throughput targeted SNP discovery using Next Generation Sequencing (NGS) in few selected candidate genes in Eucalyptus camaldulensis. BMC Proc. 2011, 5, O17. [Google Scholar] [CrossRef]
  60. Külheim, C.; Hui Yeoh, S.; Maintz, J.; Foley, W.; Moran, G. Comparative SNP diversity among four Eucalyptus species for genes from secondary metabolite biosynthetic pathways. BMC Genom. 2009, 10, 452. [Google Scholar] [CrossRef]
  61. Campbell, E.O.; Davis, C.S.; Dupuis, J.R.; Muirhead, K.; Sperling, F.A.H. Cross-platform compatibility of de novo-aligned SNPs in a nonmodel butterfly genus. Mol. Ecol. Resour. 2017, 17, e84–e93. [Google Scholar] [CrossRef]
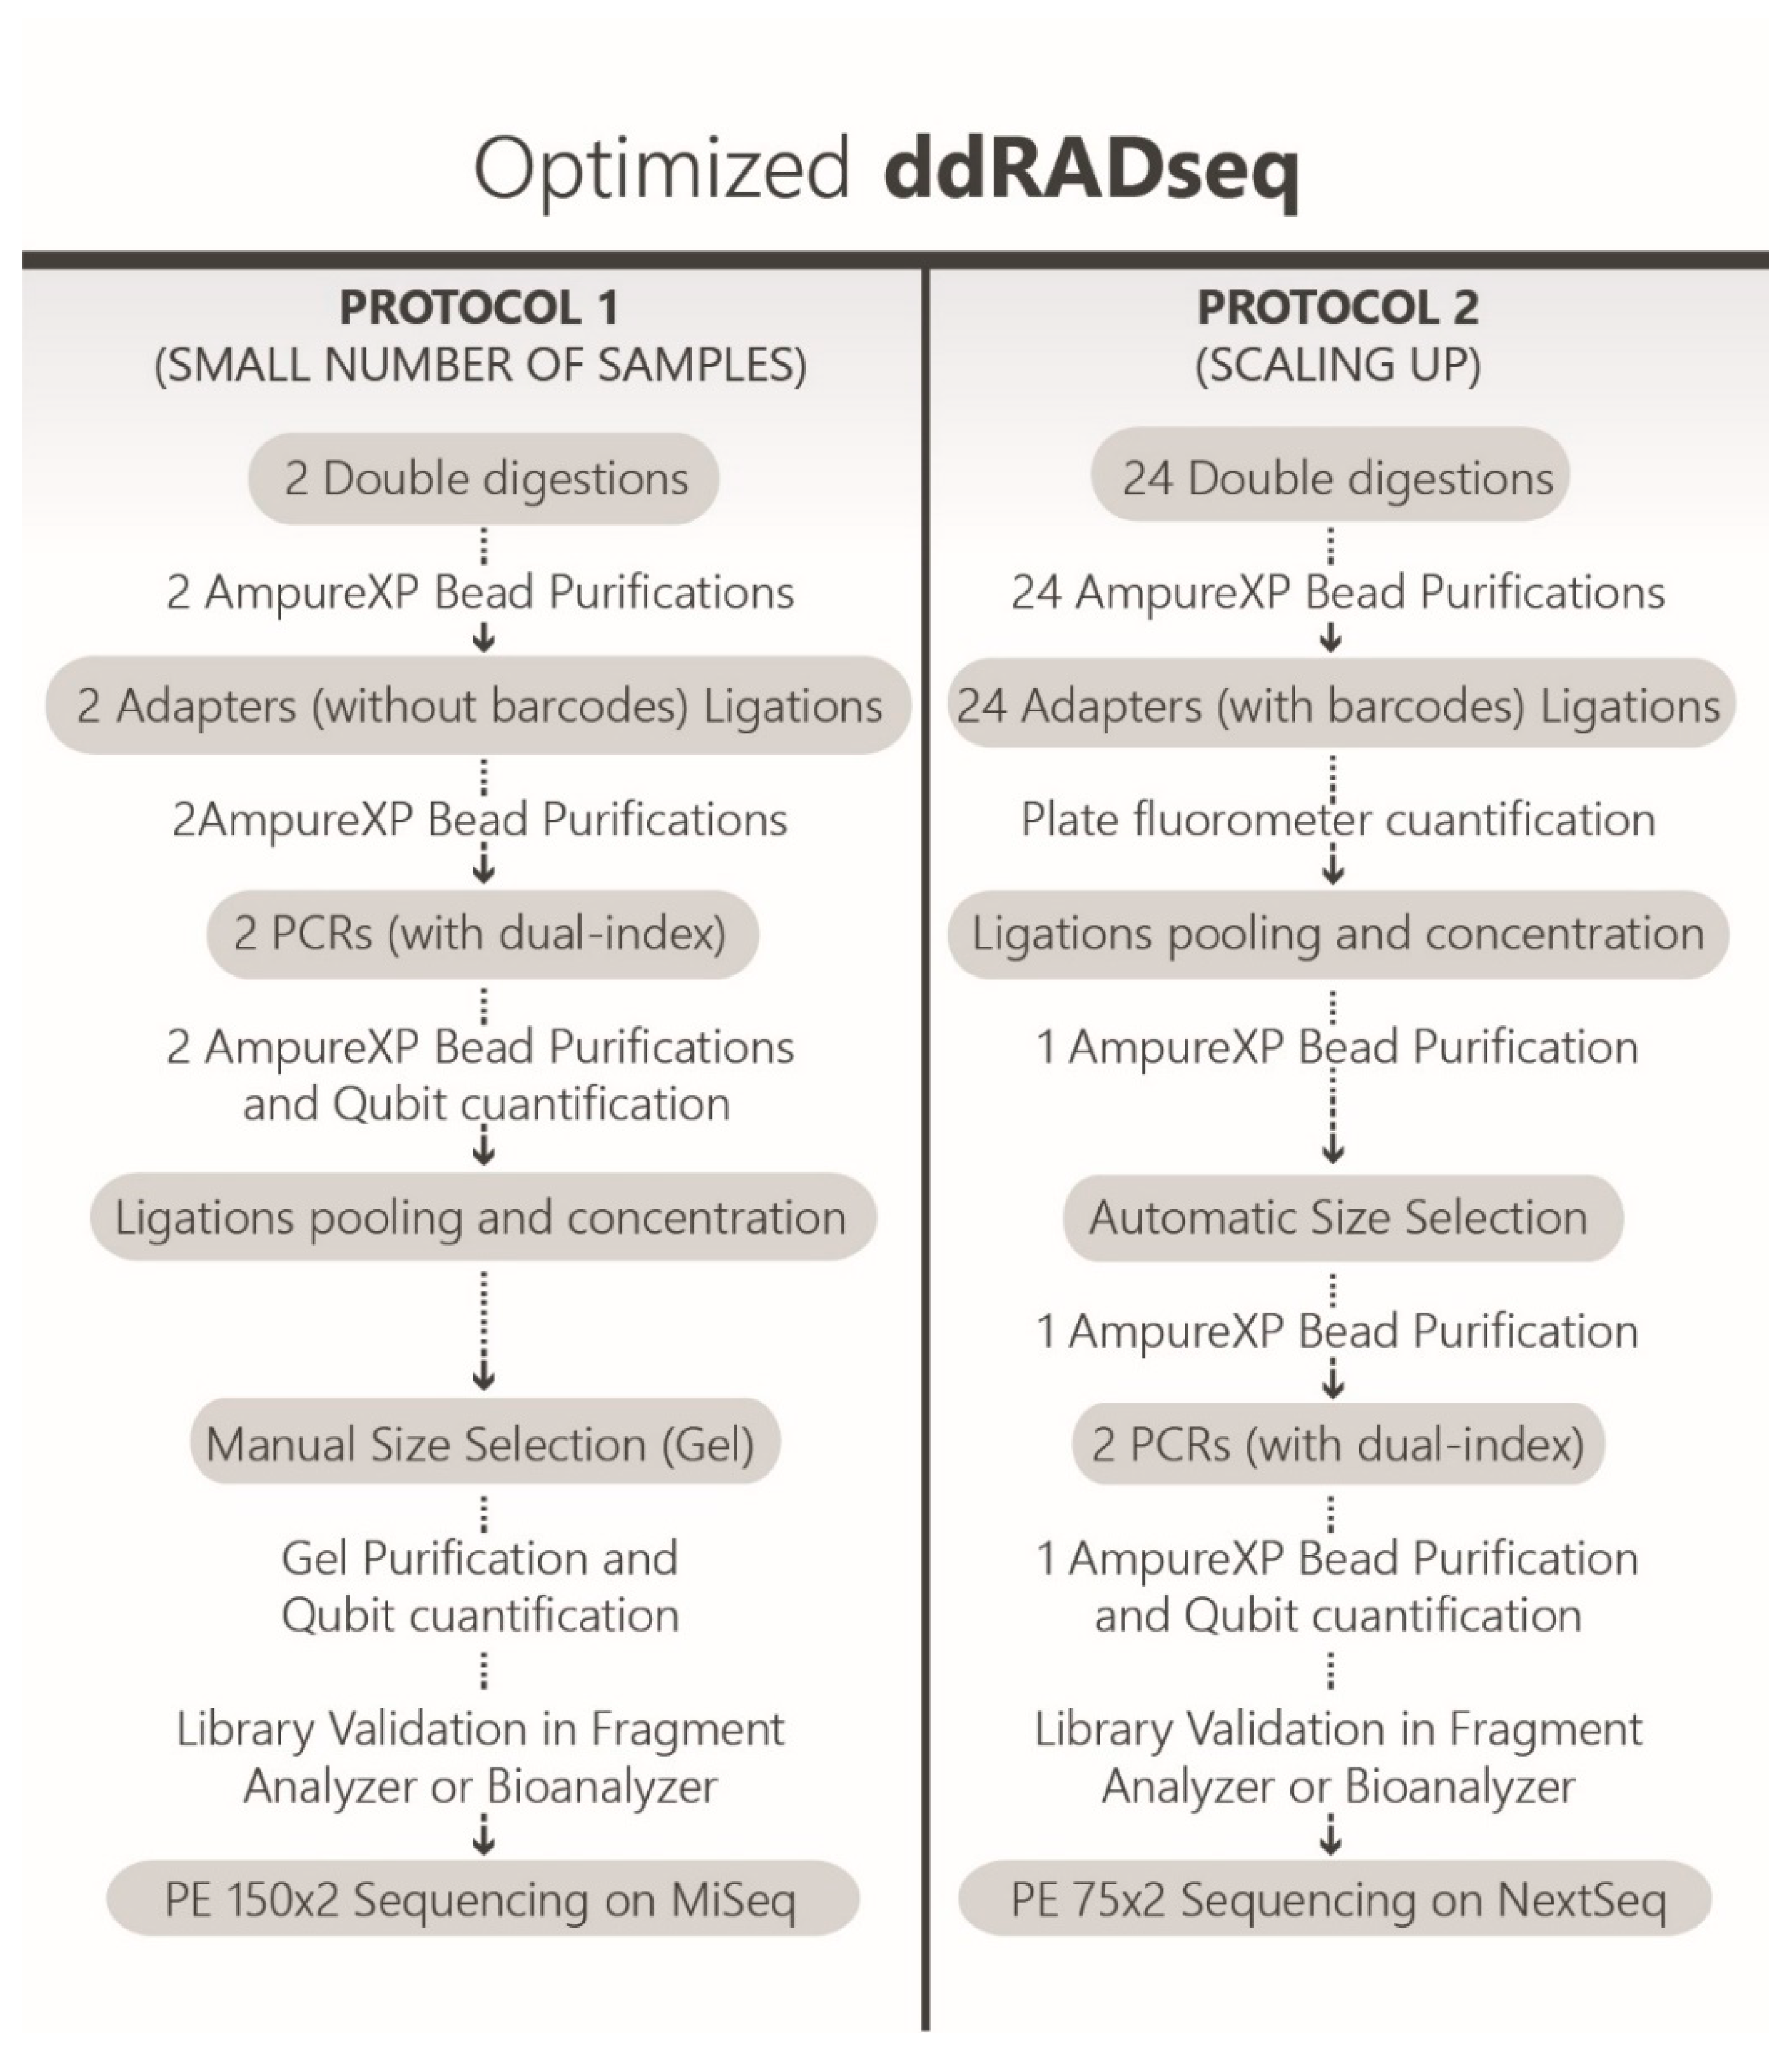
Figure 1. Workflow of the two optimized ddRADseq protocols.
Agronomy 09 00484 g001
Figure 2. Histograms of in silico simulations (frequency versus fragment size). (a) In silico digestion with SphI-MboI. (b) In silico digestion with PstI-MspI. Total fragments obtained in digestion (grey); subpopulation of fragments obtained by manual size selection (the whole colored area); subpopulation of fragments obtained by automatic size selection (pink + light blue area); and subpopulation of AB+BA fragments selected, amplified and sequenced (manual: blue + light blue areas; automatic: light blue area).
Agronomy 09 00484 g002
Figure 3. In vitro digestions of E. dunnii genomic DNA. Fragment Analyzer system runs. (a) SphI-MboI. (b) PstI-MspI.
Agronomy 09 00484 g003
Figure 4. Data of 24 samples sequenced on NextSeq: Number of loci per sample compared with: (a) number of reads per sample and (b) mean depth of coverage (×) per sample.
Agronomy 09 00484 g004
Figure 5. Distribution of 15,950 SNPs in the 11 chromosomes of E. grandis reference genome, NextSeq 24-plex run (1 Mb window).
Agronomy 09 00484 g005
Figure 6. Dendrogram for the combined MiSeq and NextSeq dataset of 23 E. dunnii samples with a MAF of 0.05 and missing data below 20%. Each of 23 individuals has two sets of ddRADseq SNPs data: one set sequenced on a MiSeq and another sequenced on a NextSeq 500.
Agronomy 09 00484 g006
Table 1. Subpopulations of fragments obtained by in silico simulations of E. grandis genome v2.0.
EnzymesWindowManual Size SelectionAutomated Size Selection
Insert Size 100 or 150 bp Window (mean) Fragment Size in Gel (Protocol 1) Hypothetical Fragment Size in Gel (Protocol 2; mean) N° of Predicted Fragments (100 or 150 bp window) Insert Size 70 bp (1 or 2 wells) N° of Predicted Fragments (100 or 150 bp window)
SphI-MboI100 or 70 bp 270–370 (320) 400–500 350–450 (400) 28,107285–355 (1)19,184
320–420 (370) 450–550 400–500 (450) 24,508335–405 (1)17,317
370–470 (420) 500–600 450–550 19,347 385–455 (1) 12,906
150 bp 220–370 (295) 350–500 300–450 45,655 225–365 (2) ~ manual selection a
270–420 (345) 400–550 350–500 39,122 265–415 (2) ~ manual selection a
PstI-MspI100 or 70 bp 270–370 (320) 400–500 350–450 13,102285–355 (1) 9137
320–420 (370) 450–550 400–500 (450) 12,026335–405 (1)8359
370–470 (420) 500–600 450–550 10,940 385–455 (1) 7595
150 bp 220–370 (295) 350–500 300–450 20,749 225–365 (2) ~ manual selection a
270–420 (345) 400–550 350–500 18,826 265–415 (2) ~ manual selection a
a The final number of predicted fragments will be almost the same for both manual an automated size selection. This is so because two contiguous elution wells of 70 bp range each are required to select a fraction of 150 bp using Automated Size Selection in SAGE ELF.
Table 2. Comparison of ddRADseq loci and polymorphic markers identified in two samples using with reference and de novo analyses. Number of SNPs and SSRs markers discovered by with reference and de novo analyses with Protocol 1. Total: total discovered markers; Shared: markers shared between both samples.
AnalysisTotalShared
SNPslociSSRsSNPslociSSRsSSRs Polym.
with reference19,5259299424615,792 7346 42016
de novo33,31318,951771725,77814,423136655