Article

Integrating Modelling and Expert Knowledge for Evaluating Current and Future Scenario of Large Cardamom Crop in Eastern Nepal

International Centre for Integrated Mountain Development (ICIMOD), Kathmandu 44700, Nepal
*
Author to whom correspondence should be addressed.
Agronomy 2019, 9(9), 481; https://doi.org/10.3390/agronomy9090481
Submission received: 29 May 2019 / Revised: 15 July 2019 / Accepted: 18 July 2019 / Published: 26 August 2019
(This article belongs to the Special Issue Remote Sensing Applications for Agriculture and Crop Modelling)

Abstract

:
Large Cardamom (Amomum subulatum Roxb.) is one of the most valuable cash crop of the Himalayan mountain region including Nepal, India, and Bhutan. Nepal is the world’s largest producer of the crop while the Taplejung district contributes a 30%–40% share in Nepal’s total production. Large cardamom is an herbaceous perennial crop usually grown under the shade of the Uttis tree in very specialized bioclimatic conditions. In recent years, a decline in cardamom production has been observed which is being attributed to climate-related indicators. To understand the current dynamics of this under-canopy herbaceous crop distribution and its future potential under climate change, a combination of modelling, remote sensing, and expert knowledge is applied for the assessment. The results suggest that currently, Uttis tree cover is 10,735 ha in the district, while 50% (5198 ha) of this cover has a large cardamom crop underneath. When existing cultivation is compared with modelled suitable areas, it is observed that the cultivatable area has not yet reached its full potential. In a future climate scenario, the current habitat will be negatively affected, where mid elevations will remain stable while lower and higher elevation will become infeasible for the crop. Future changes are closely related to temperature and precipitation which are steadily changing in Nepal over time.

Graphical Abstract

1. Introduction

Large cardamom (Amomum subulatum Roxb.) is mostly being cultivated in the Himalayan mountain region of Nepal, India, and Bhutan [1]. There is an increasing demand of the spices from local to global markets which has fascinated farmers in its commercial cultivation [2]. The high-value crop cultivation has substantially improved the livelihood of farmers residing in these mountain regions. However, several studies have highlighted threats of cardamom farming which include problems in disease management, change in climatic conditions, and human activities such as infrastructure development in cardamom growing areas [2,3]. Alongside this, comprehensive information on its current distribution and potentially suitable areas for cultivation is unavailable, which is essential for crop planning and management. Further, for its distribution and current suitability, information on the impacts of climate change is also vital for future planning as climate has a significant impact on the geographical distribution of plant species and also alters habitat conditions [4,5].
Large cardamom is an herbaceous perennial crop usually grown under shade. Uttis (Alnus nepalensis) trees provide excellent shade, supply a good amount of litter from twigs and leaves, and nitrogen from the root nodules to understory cardamom when they are young. The crop is generally grown at an altitude of 700 to 2000 m above sea level in humid conditions, with temperature ranges between 4–20 °C and annual precipitation around 2000–2500 mm [6].
Although satellite remote sensing data can be used for accurate, timely, and consistent information on the agricultural productivity at local and regional scales [7,8], detection of understory plants is inhibited due to canopy cover, canopy gap shadowing, and terrain variability [9]. Differentiating signals of understory vegetation from overstory canopy is still challenging due to complex interactions between overstory and understory vegetation [10]. Several studies have been conducted to distinguish understory vegetation using remote sensing approaches. In this regard, evergreen understory vegetation were identified from Landsat images of leaf off-season in deciduous forest [11,12]. Phenological difference between overstory and understory vegetation was also used to detect understory vegetation using Landsat images [13,14]. However, such studies require multi-temporal data which are generally available in coarser spatial resolutions. Leduc et al. [15] have mapped wild leek which grows on forest floors using low flying Unmanned Aerial Vehicle (UAV). Other studies have used data from active sensor, mainly LIDAR data, to map understory plants in boreal forests [16,17]. Combinations of LIDAR data and hyperspectral images were used to map understory invasive species in tropical forests [9], and the use of LIDAR data and high-resolution IKONOS imagery to identify understory plant invasion in urban forests [18]. Nevertheless, there are limitations on the use of these data due to its high cost and low availability, mainly in developing countries [19].
Understory vegetation are usually hard to identify only from remote sensing, thus a substantial efforts have been made to identify these vegetation through the integration of several approaches. For instance, Wang et al. [20] have mapped understory bamboo by integrating neural network and Geographic Information System (GIS) expert system, and Tuanmu et al. [10] have detected understory vegetation using phenology metrics derived from time series of Moderate Resolution Imaging Spectroradiometer (MODIS) data together with a suitability model like the maximum entropy (Maxent) model. The Maxent model is a species distribution model (SDM) that provides an approach for making predictions from existing distribution and a set of predictors [21]. Such models predicting the potential distribution of species are useful for several applications in conservation biology [22,23]. Other approaches, such as object-based image analysis (OBIA) on multispectral and hyperspectral data, were found to be effective in identifying understory plant species [24] due to its characteristics of using contextual relationships together with spectral information. In addition, expert knowledge [25] and other ancillary data such as elevation, slope, and aspect can also be used to improve classification accuracy. Moreover, the combination of participatory mapping with remote sensing technique can further improve the accuracy as the two methods complement and validate each other [26]. Participatory mapping is an effective tool to obtain accurate baseline data of the field [27], which can be integrated in remote sensing analyses to produce more accurate maps [28].
Several species distribution models such as the genetic algorithm for rule-set production (GARP), ecological niche factor analysis (ENFA), bioclimatic modeling (BIOCLIM), CLIMEX (climate change experiment), domain environmental envelope (DOMAIN), and Maxent (maximum entropy) have been used for species distribution prediction. Among these, Maxent is widely used as it can perform better even with small sample sizes compared to other modelling methods [29,30,31]. In addition, it has other merits, such as: it requires only presence data of the species and environmental variables for the study area, it can use both categorical and continuous data and can incorporate interactions among different variables, it can produce spatially explicit habitat suitability maps, and the importance of each environmental variable on the model can be evaluated using the built-in jackknife test.
This study aims to evaluate existing spatial distribution, potential suitable areas for cultivation under various scenarios, and core distributional shift with future climate condition in the Taplejung district of Nepal. The study uses a combination of expert knowledge and species modelling approach to capture all aspects of habitat conditions in the complex environmental conditions in the mountain region.

2. Materials and Methods

2.1. Study Area

The study area, the Taplejung district, lies in eastern Nepal. The district (27°57′10′′–27°16′5′′ N and 87°26′40′′–88°12′6′′ E) with an area of 3646 km2 physiographically lies in the mid-hill to high-himal region. It lies at an elevation of 498 m to 8464 m. Forest is the major land cover of the district followed by agriculture, bare land, grass, snow, shrub, water body, and built-up, respectively. The district is the major producer of large cardamom in the country, which is the major source of income for farmers in the district. In Nepal, an estimated 12,000 ha of land in over 40 mid-hills districts are under cardamom cultivation with estimated annual production of 6000 metric tons. While the Taplejung district contribute around 4500 ha of land and yearly production of around 2600 metric tons [32].
The study broadly followed two broad approaches for Cardamom habitat mapping including species modelling- and expert knowledge-based assessment (Figure 1).

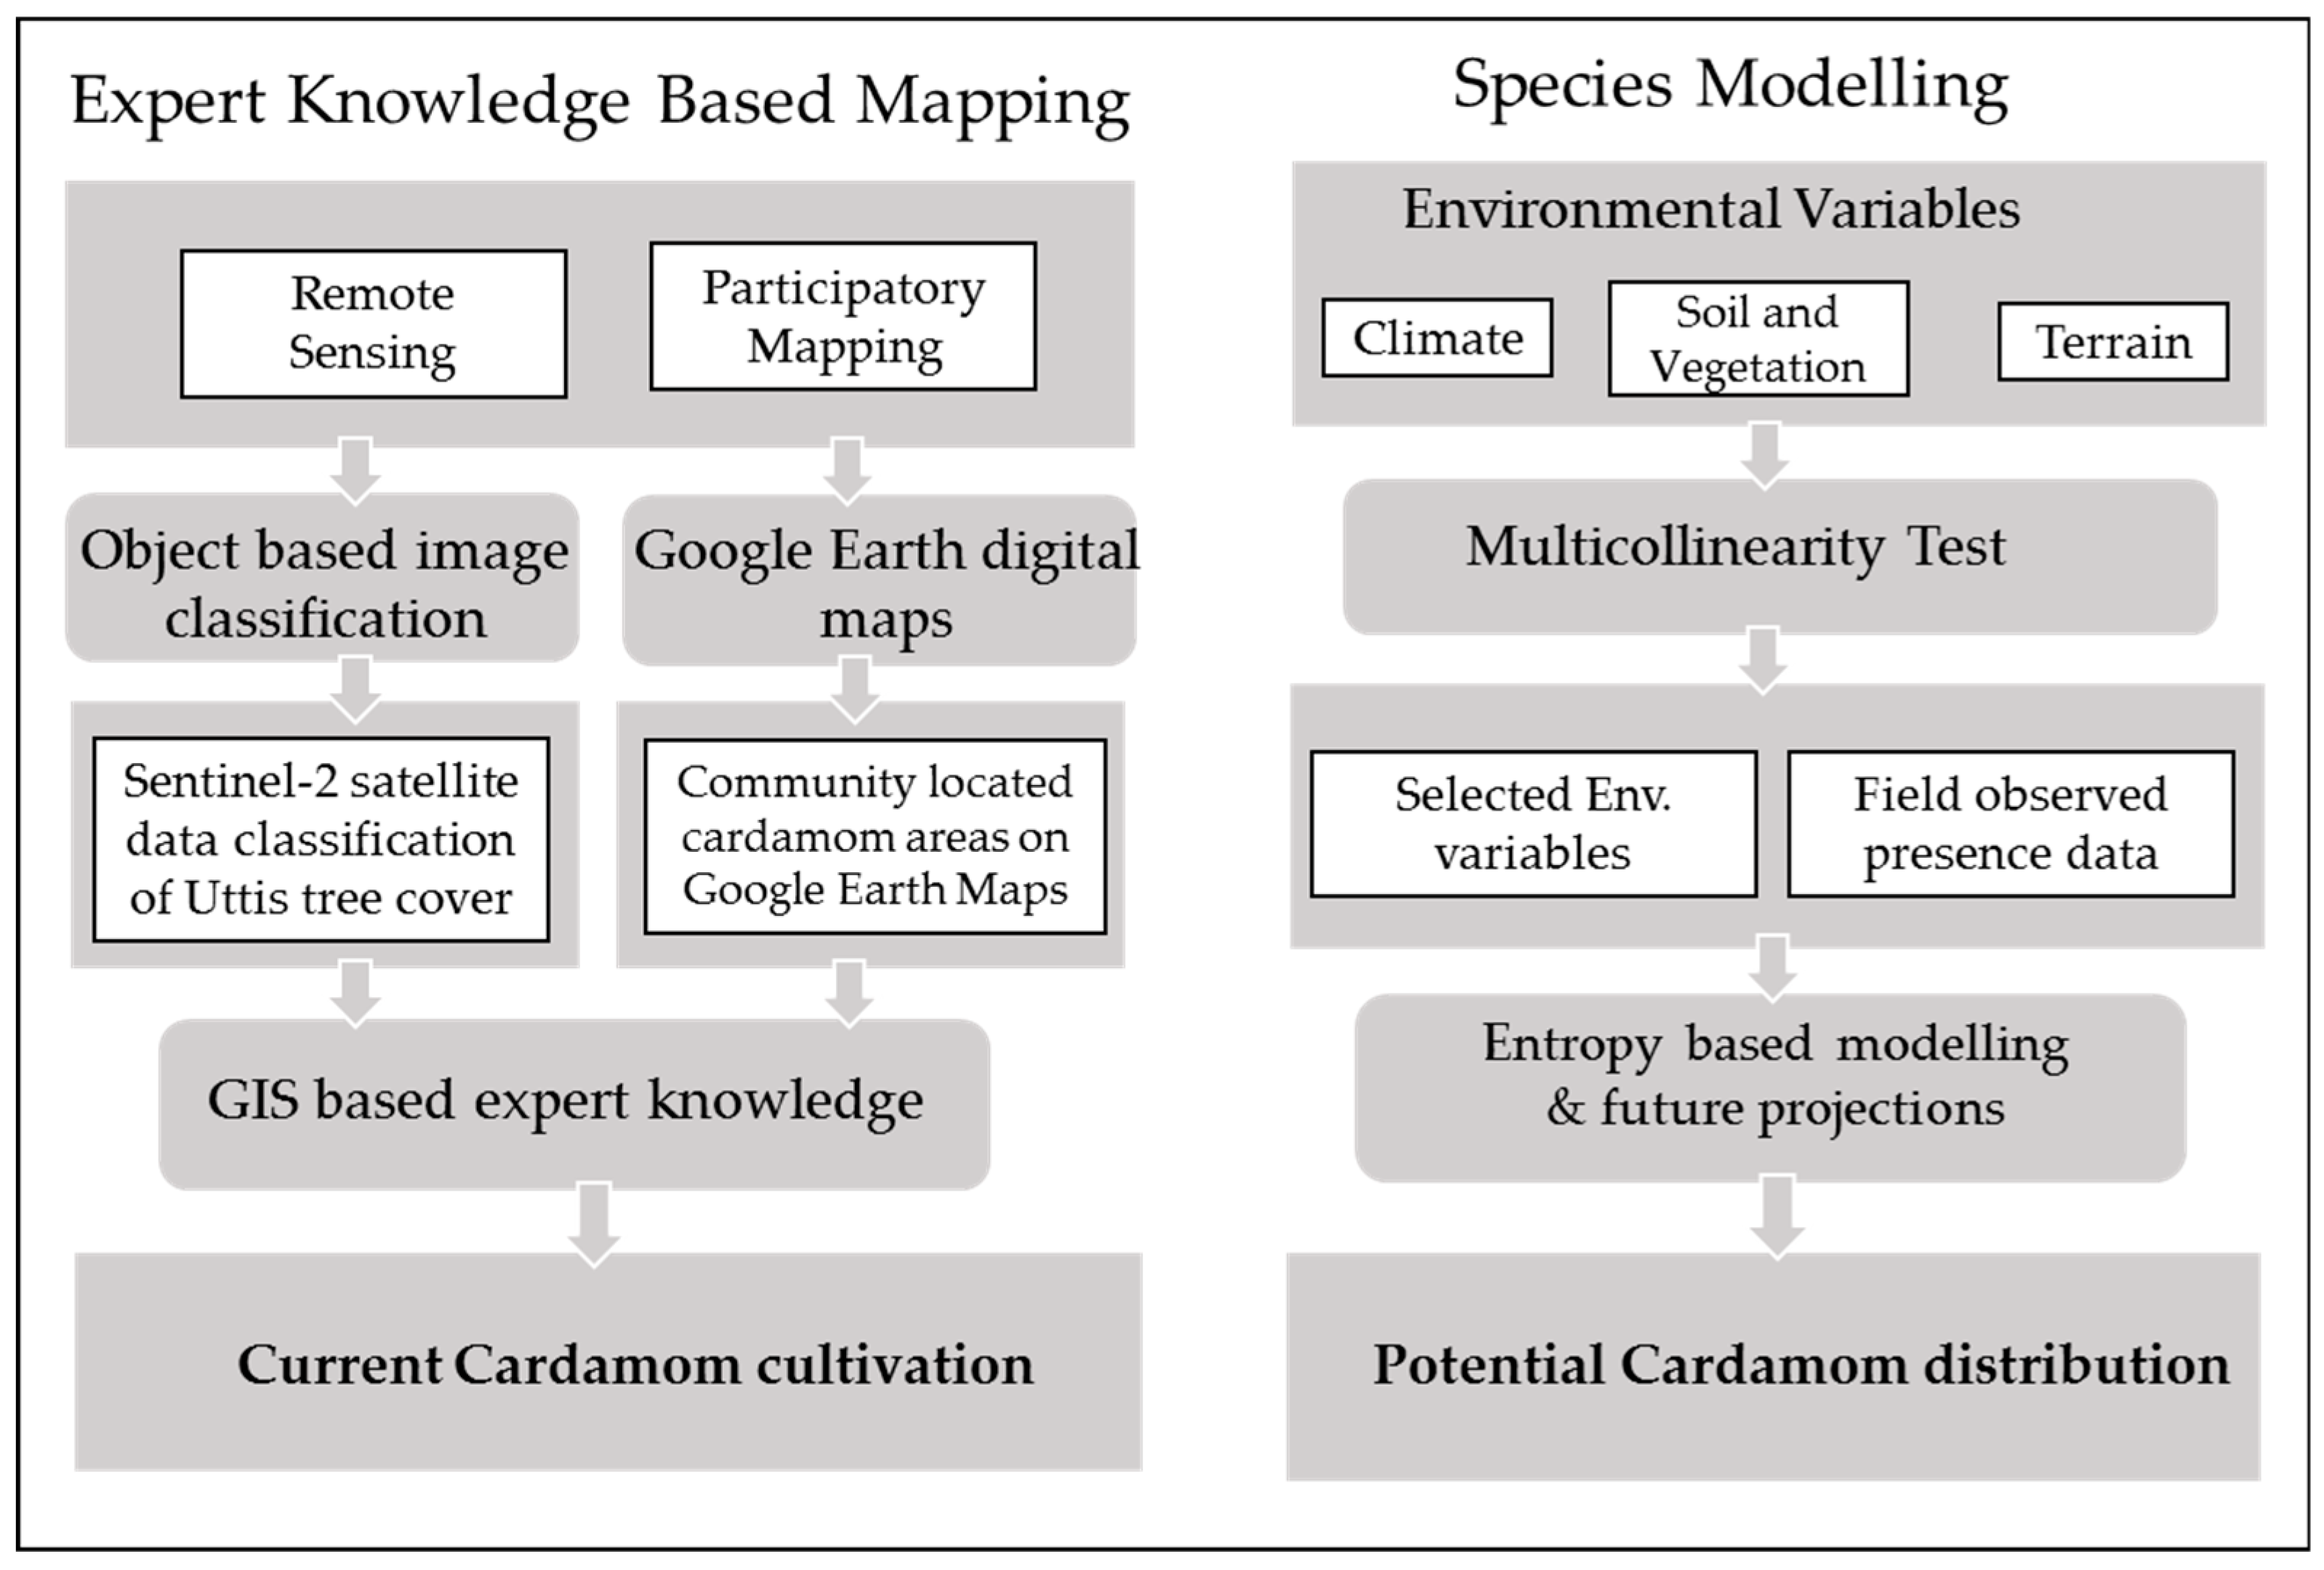
2.2. Expert Knowledge-Based Mapping

2.2.1. Participatory Mapping

Participatory mapping with the community in developing countries is found to be effective for understanding local level phenomena [33]. A two-day exercise was conducted with a community representative to map existing large cardamom farming areas on the high-resolution data of Google Earth images available in digital format as well as on the printed maps. During the exercise, large clusters of cardamom cultivated fields were identified. However, detailed delineation of cardamom fields including small patches was not possible. The data was gathered to get existing farming areas on the district which was also cross-checked with outputs obtained from remote sensing data. A part of the pockets identified by the farmers in the participatory exercise was further verified through ground validation exercise. This validation also provided GPS samples of cardamom field points along with other vegetation in the area.

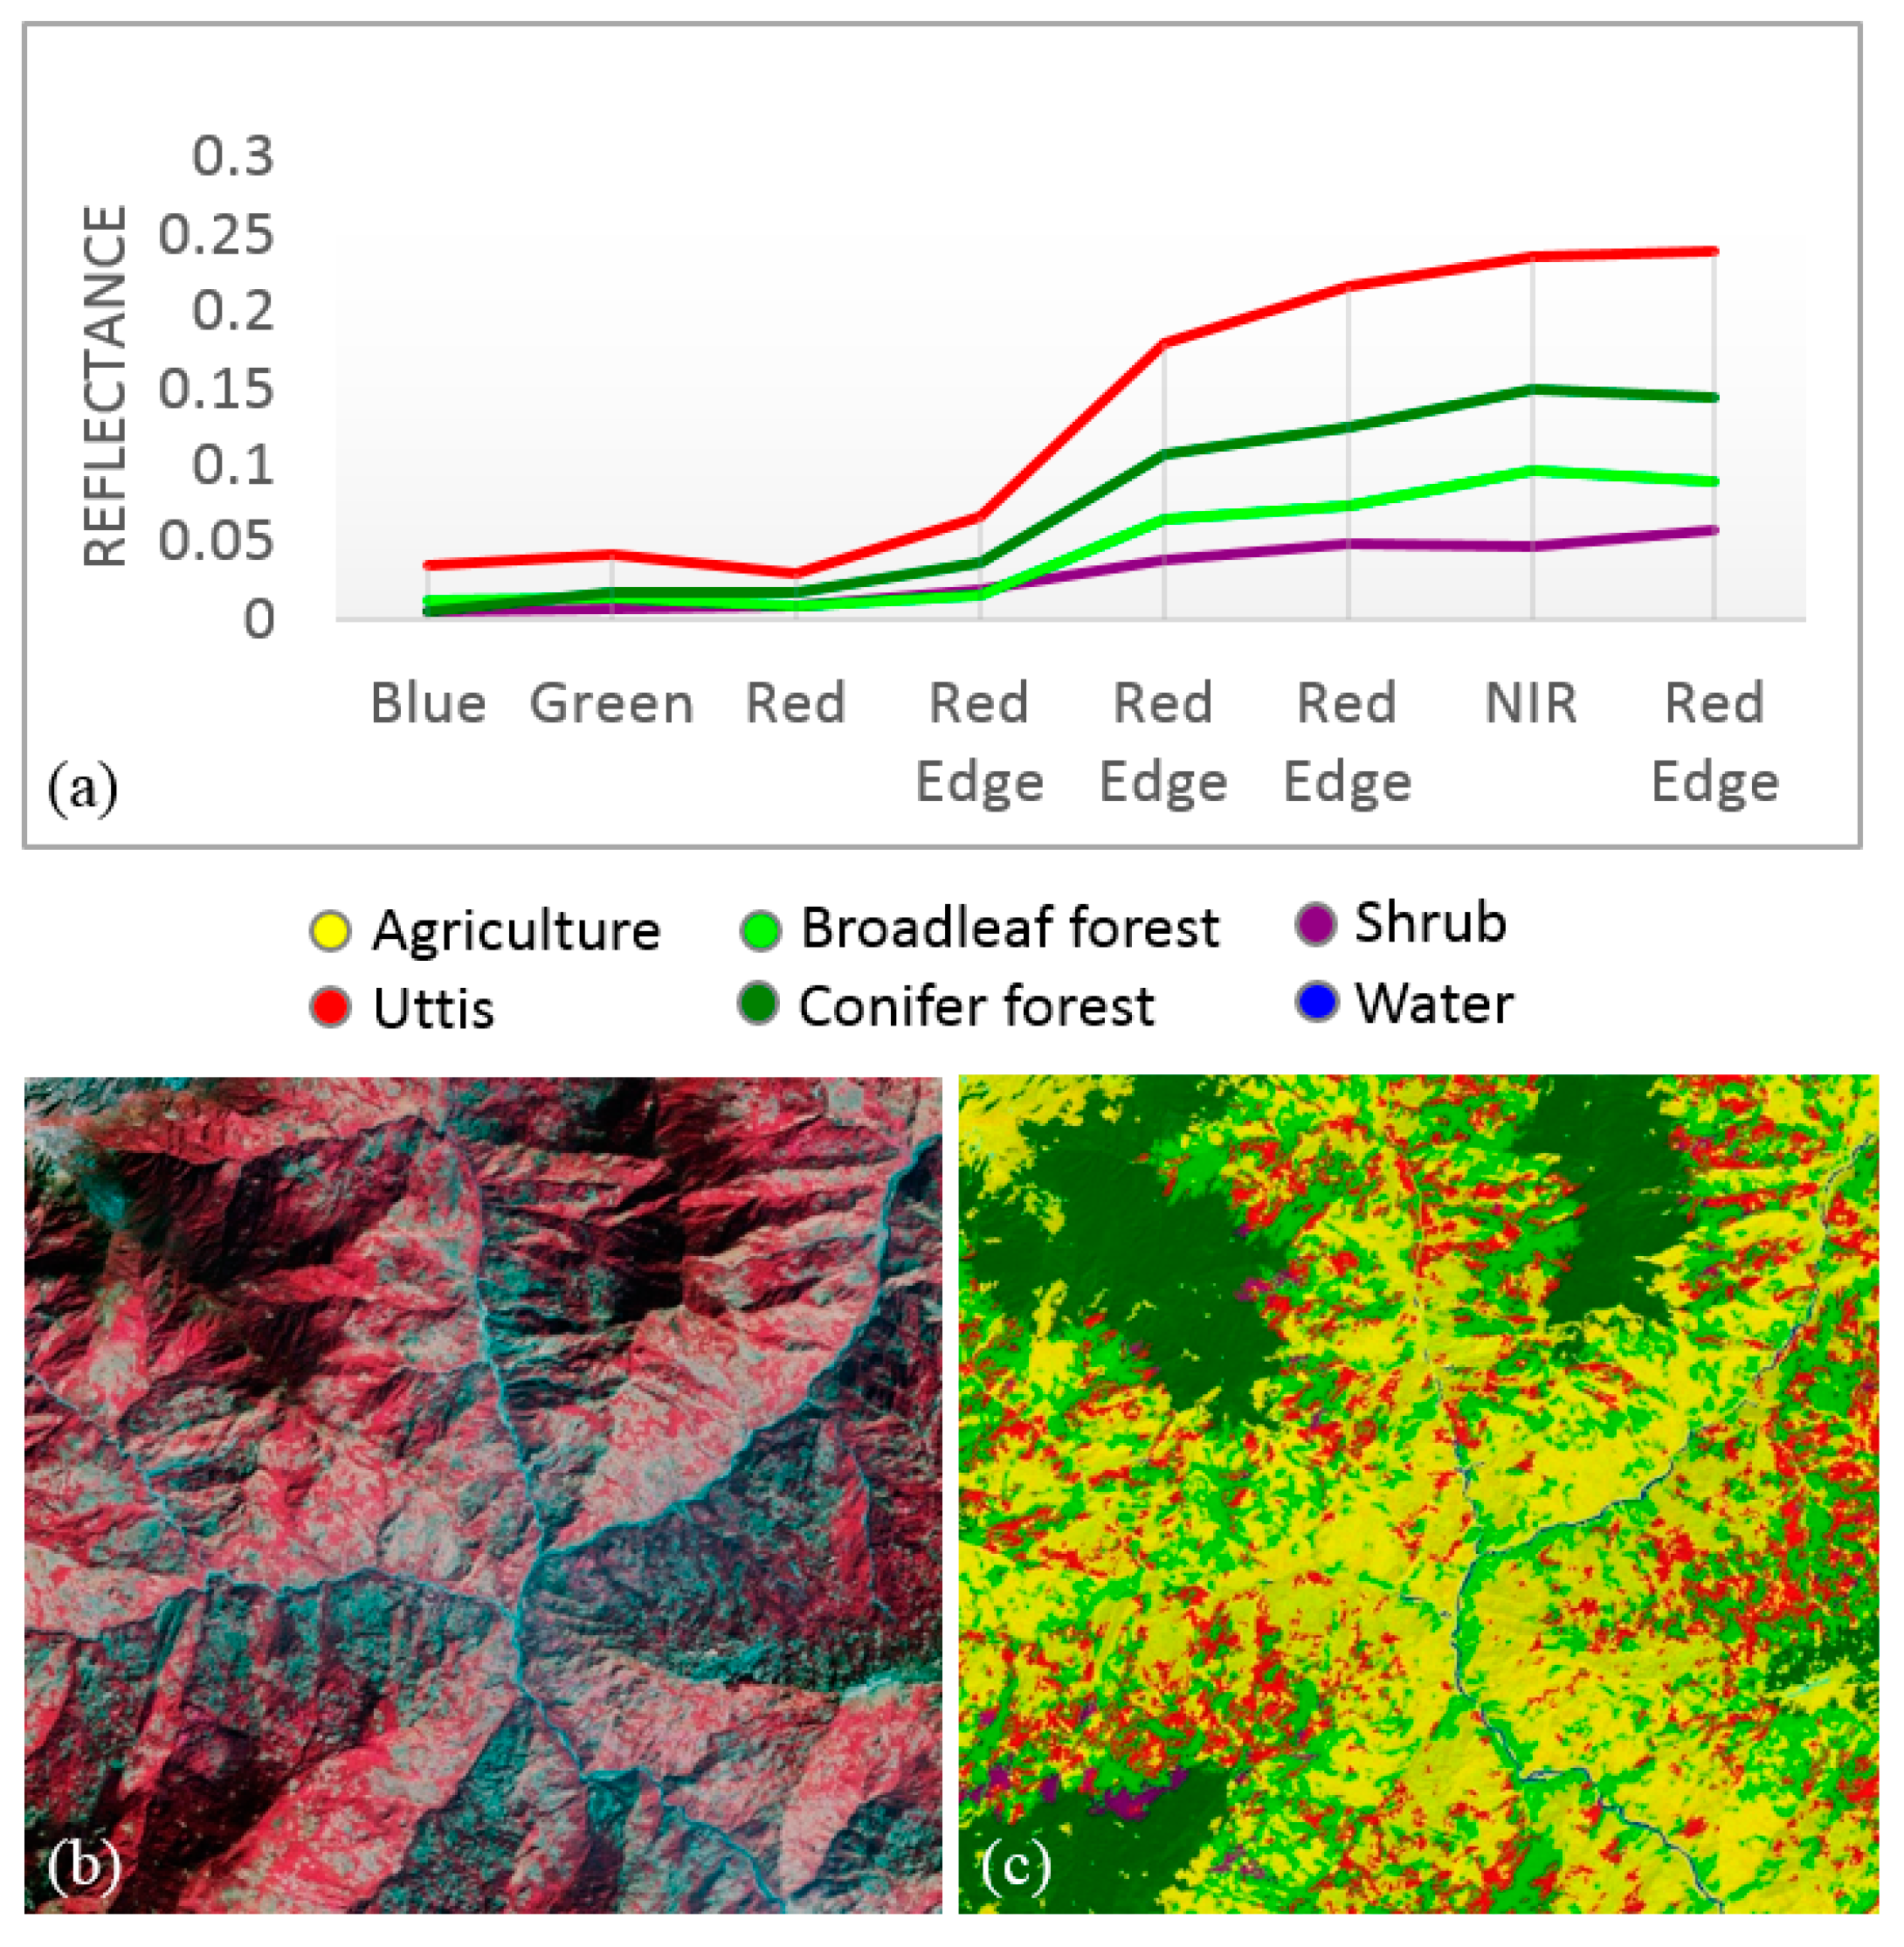
2.2.2. Uttis (Alnus nepalensis) Mapping Using High-Resolution Satellite Data

During the participatory mapping and the field activity, it was observed that the Uttis is the major tree species grown for shade to cultivate large cardamom. Since the understory crop could not be directly mapped using remote sensing data, delineation of Uttis cover was consider as proxy to map the large cardamom crop. Our focus was to map Uttis in the entire district, which can provide information on prospective cultivation of large cardamom. Uttis tree cover was mapped by using Sentinel-2A Level 1C product image acquired in February 2016. The image has very high-resolution spectral coverage that includes 12 bands (coastal aerosol, blue green, red, 3 vegetation red edge, NIR, vegetation red edge water vapor, SWIR Cirrus, and 2 SWIR respectively). The spatial resolution of blue green, red and NIR is 10 m. The resolution of the vegetation red edge band is 20 m and for the rest of the bands it is 60 m. These features of the sensor are suited for agricultural monitoring systems [34]. Level 1C product is a Top of Atmosphere (TOA) product for which atmospheric correction had to be done to get reflectance values of the image so that the image can be used for mapping. SNAP (Sentinel toolbox) software (version 5.0.0) was used for atmospheric correction of the image.
Spectral separability of forest types such as coniferous forest, broadleaf forest, Uttis, and shrub was studied before the classification. The mean pixel values of the abovementioned forest types and shrub were plotted against eight bands of Sentinel-2A image to evaluate the potential of image spectral separability before the classification. The object-based image analysis (OBIA) classification approach was adopted for Sentinel-2A image classification. The technique uses spectral and contextual information in an integrative way [25]. The fundamental technique of OBIA is the segmentation of satellite images which overcome the salt and pepper effect [35]. In this study, the chessboard and multi-resolution segmentation algorithm in eCognition software (version 8.7,) was used to develop image objects [36] using scale parameter = 80, shape = 0.1, and compactness = 0.8.
After segmentation, Assign Class algorithm was used to classify general classes (agriculture, conifer forest, broadleaf forest, shrub, water, and snow). This was done to filter the land cover which were not the focus of the study. Several features such as NDVI, brightness, slope, elevation, and field information were used in this step. For the rest of the unclassified image objects, Nearest Neighbor Classification was applied, which is a powerful approach [37] to map Uttis trees. Uttis trees grown between the elevation range of 800–2200 m and slope up to 45 degrees were mapped. This is also the elevation and the slope range where large cardamom is cultivated [38]. Seventy percent (70%) of field data were used to train the samples while the remaining 30% were used as test data for accuracy assessment. Further, in order to reduce error and improve classification accuracy, interactive visual analysis was done on a classified map using Google Earth images [39].
The remote sensing-derived Uttis cover and participatory mapping-based identification of cardamom crop areas were overlaid to get the existing large cardamom farming area. The obtained large cardamom maps in the Taplejung district were further analyzed based on elevation, slope, aspect, and Village Development Committees (VDCs). The analysis was done to understand the pattern of cultivation and environment suitability conditions in the district and the information could be useful in further planning and management of large cardamom farming in the district. Elevation range of the study area was categorized into 9 ranges (below 800 m, 800–1000 m, 1000–1200 m, 1200–1400 m, 1400–1600 m, 1600–1800 m, 1800–2000 m, 2000–2200 m, and above 2200 m). In order to comprehend the farming area slope-wise, the slope was categorized into four gradient levels (0°–15°, 15°–30°, 30°–45°, 45° above).

2.3. Species Modelling

2.3.1. Environmental Variables and Species Occurrence Records

The habitat suitability model was primarily developed based on the variables related to climate, soil, terrain, and vegetation type. Initially, 24 variables were selected to model the current distribution pattern. These comprised of 19 bioclimatic variables with 30 arc seconds (~1 km) spatial resolution from WorldClim dataset (http://www.worldclim.org/), 12.5 m resolution digital elevation model (DEM) generated by The Japan Aerospace Exploration Agency (JAXA) using ALOS PALSAR RTC products [40], slope and aspect layers generated from the DEM using spatial analyst tools in ArcGIS 10.6.1 soil pH with the resolution of 250 m was downloaded from https://soilgrids.org/#!/?layer=TAXNWRB_250m&vector=1 and Uttis cover thematic layer. All bioclimatic variables, topographic layers, and pH were resampled into 20 m spatial resolution to make them compatible with the resolution of Uttis cover. This was done in ArcGIS 10.6.1 with the nearest neighbor resampling technique. For future scenarios (year 2050), we initially selected DEM, slope, aspect, and 19 bioclimatic variables for RCP2.6 (the minimum greenhouse gas emission scenario), and RCP8.5 (the maximum greenhouse gas emission scenario) as adopted by the Intergovernmental Panel on Climate Change (IPCC) in its fifth assessment report (AR5). The climatic variables were also resampled into 20 m to make the variables uniform at one resolution.
Multicollinearity between predictor variables was tested as it can lead to inaccurate prediction by excluding significant explanatory variables [41]. The test was conducted calculating Pearson’s Correlation Coefficient (r) to assess the cross-correlation and the one variable from any pair of variables with a cross-correlation coefficient value of > ±0.8 was excluded [42]. Variables were chosen based on biological relevancy to the species. For example, pH was highly correlated with temperature seasonality (BIO4) (r = 0.88), from this pair BIO4 (temperature seasonality) was removed as pH plays a crucial role in cardamom plantation [2]. In addition, the variation inflation factor (VIF) was also used to check collinearity among the variables in R software (version 3.6). Variables with VIF values greater than 10 were excluded for modelling [43]. Out of 24 variables, 8 environmental variables (Uttis cover, pH, slope, aspect, isothermality, maximum temperature of warmest month, minimum temperature of coldest month, and precipitation of wettest month) were selected for the current scenario. For the future scenario of RCP2.6-2050 and for RCP8.5-2050, 6 variables (slope, aspect, isothermality, maximum temperature of warmest month, minimum temperature of coldest month, and precipitation of wettest month) were selected for modelling. As part of the species presence data, a total of 102 occurrence records (GPS coordinates of points) of large cardamom were collected randomly during the field visit conducted in May 2016.

2.3.2. Spatial Modelling and Statistical Analysis

The maximum entropy modelling approach using Maxent software (version 3.3.3k) was applied in this study for predicting habitat suitability of the large cardamom. Maxent is a machine-learning method with a simple and precise mathematical formulation. It uses a maximum entropy algorithm to produce a model that shows the probability of presence of the species that varies from 0 to 1, i.e., from the lowest to the highest probability [21]. We selected 70% of the data for training and the remaining 30% for testing. Area under the ROC (receiver operating characteristic) curve (AUC) was used to evaluate the model performance which ranges from 0 to 1. The curve is plotted with True Positive Rate (sensitivity) at the vertical axis and False Positive Rate (1-specificity) at the horizontal axis. The jackknife was used to evaluate the importance of the variables on the model. The model used logistic format. The final distribution maps have values ranges from 0 to 1 which were grouped into four classes of suitable habitat viz., unsuitable (<0.2), marginally suitable (0.2–0.4), moderately suitable (0.4–0.6), and highly suitable (>0.6). Further, analysis of existing farming area in comparison to current habitat suitability map was performed to understand the gaps and opportunities. In order to assess the change between current and future suitable areas, we quantified the areas (ha) of classes of habitat suitability under different scenarios across different elevation ranges.

3. Results and Discussions

3.1. Participatory Mapping of Large Cardamom

The spatial location of large cardamom fields in the Taplejung District was recorded on the basis of local people knowledge. Out of 50 VDCs in the district, 49 VDCs were found cultivating (Figure 2) large cardamom. However, the farming area varies from VDC to VDC. Participatory mapping has given a general overview of farming area in the district.

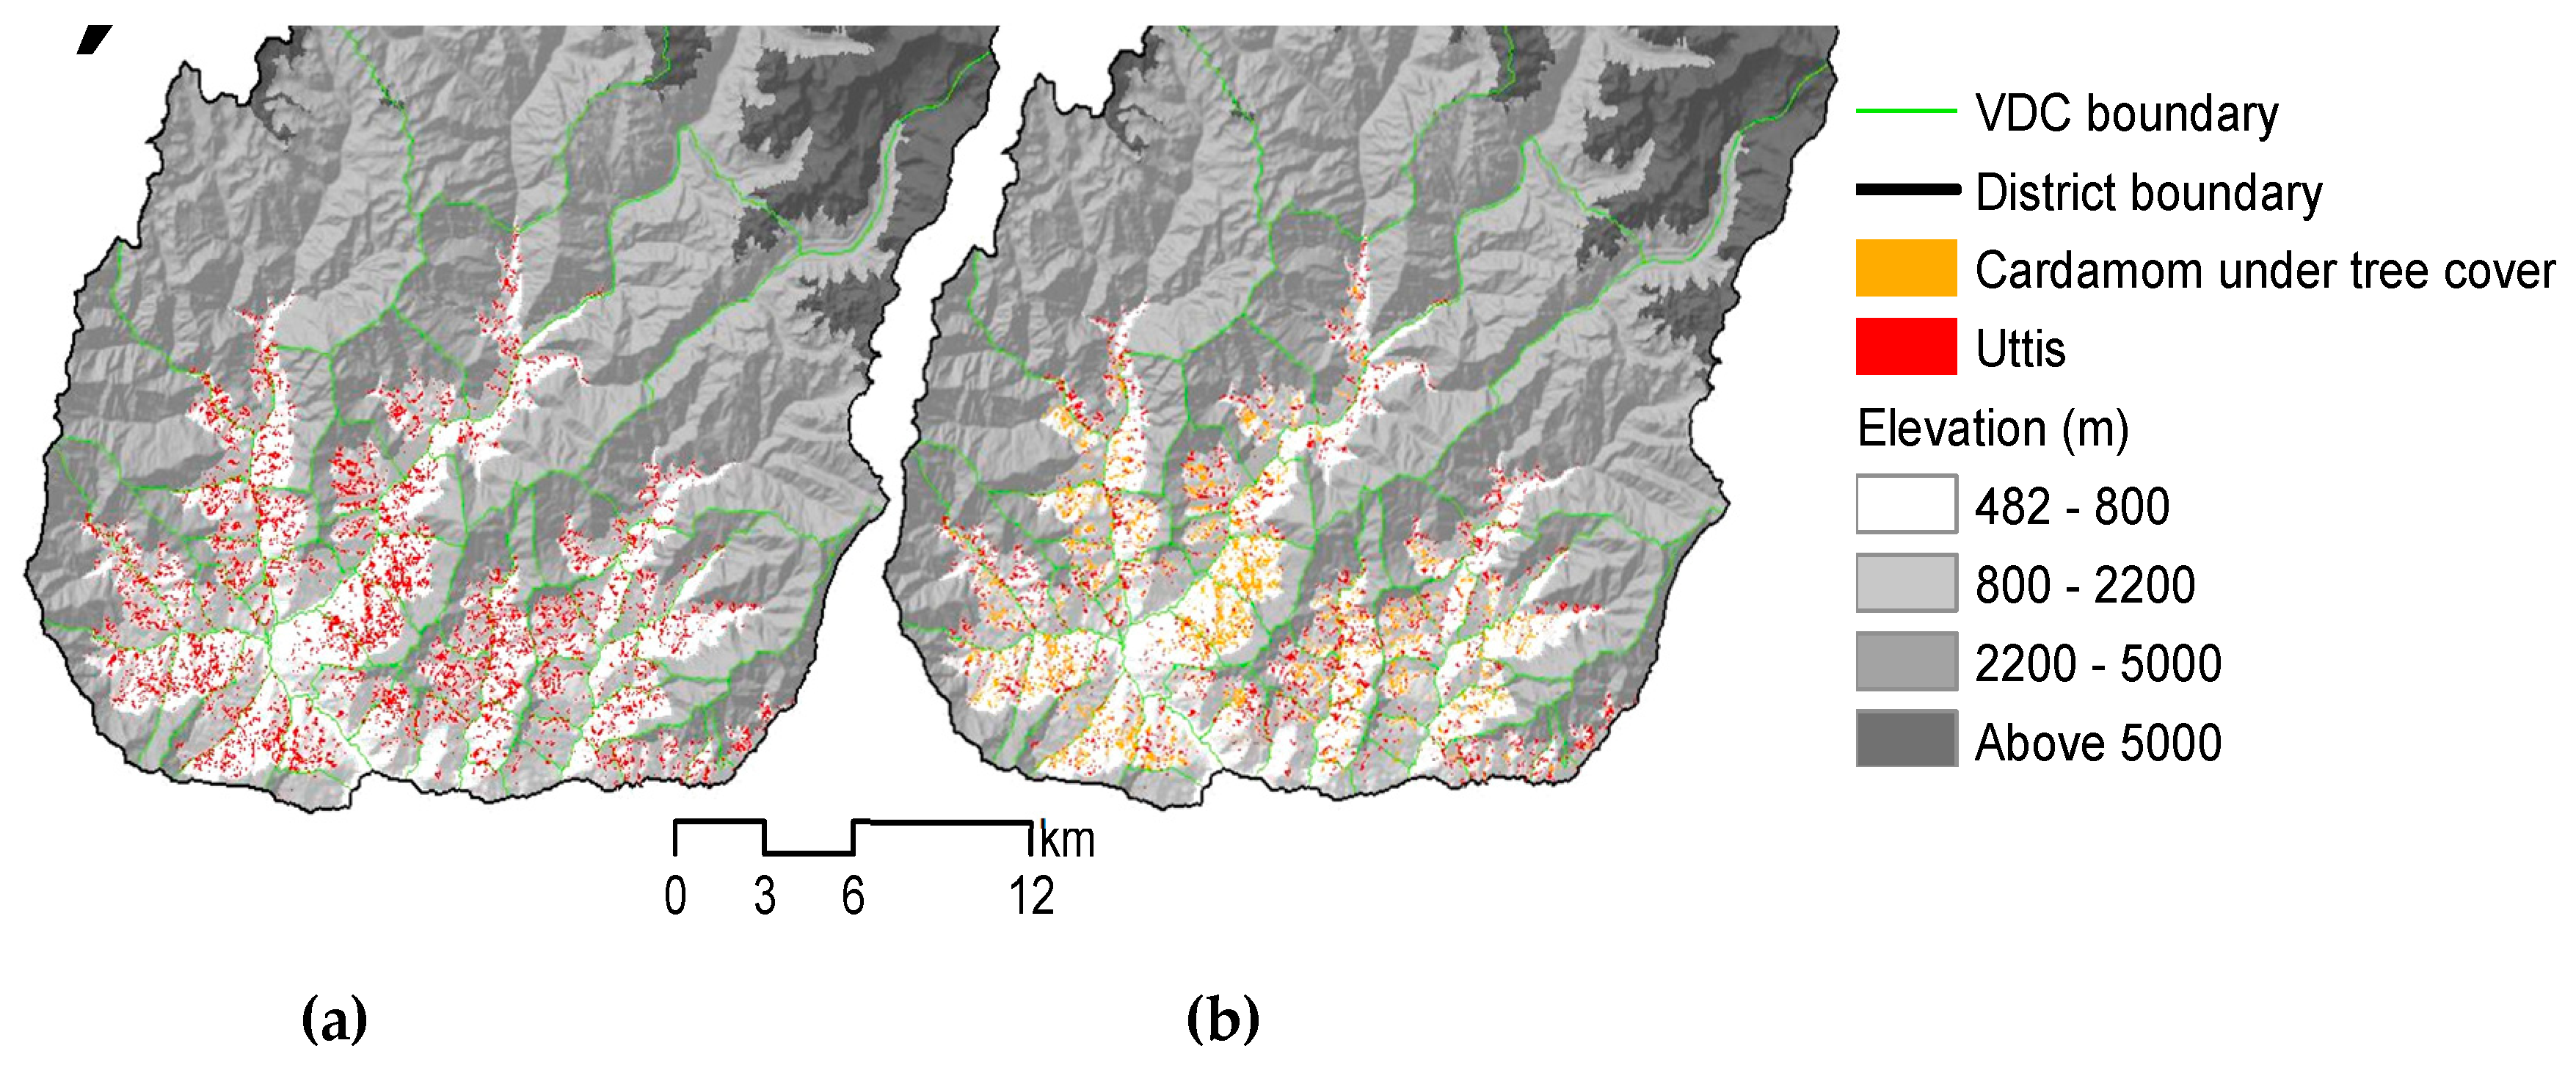
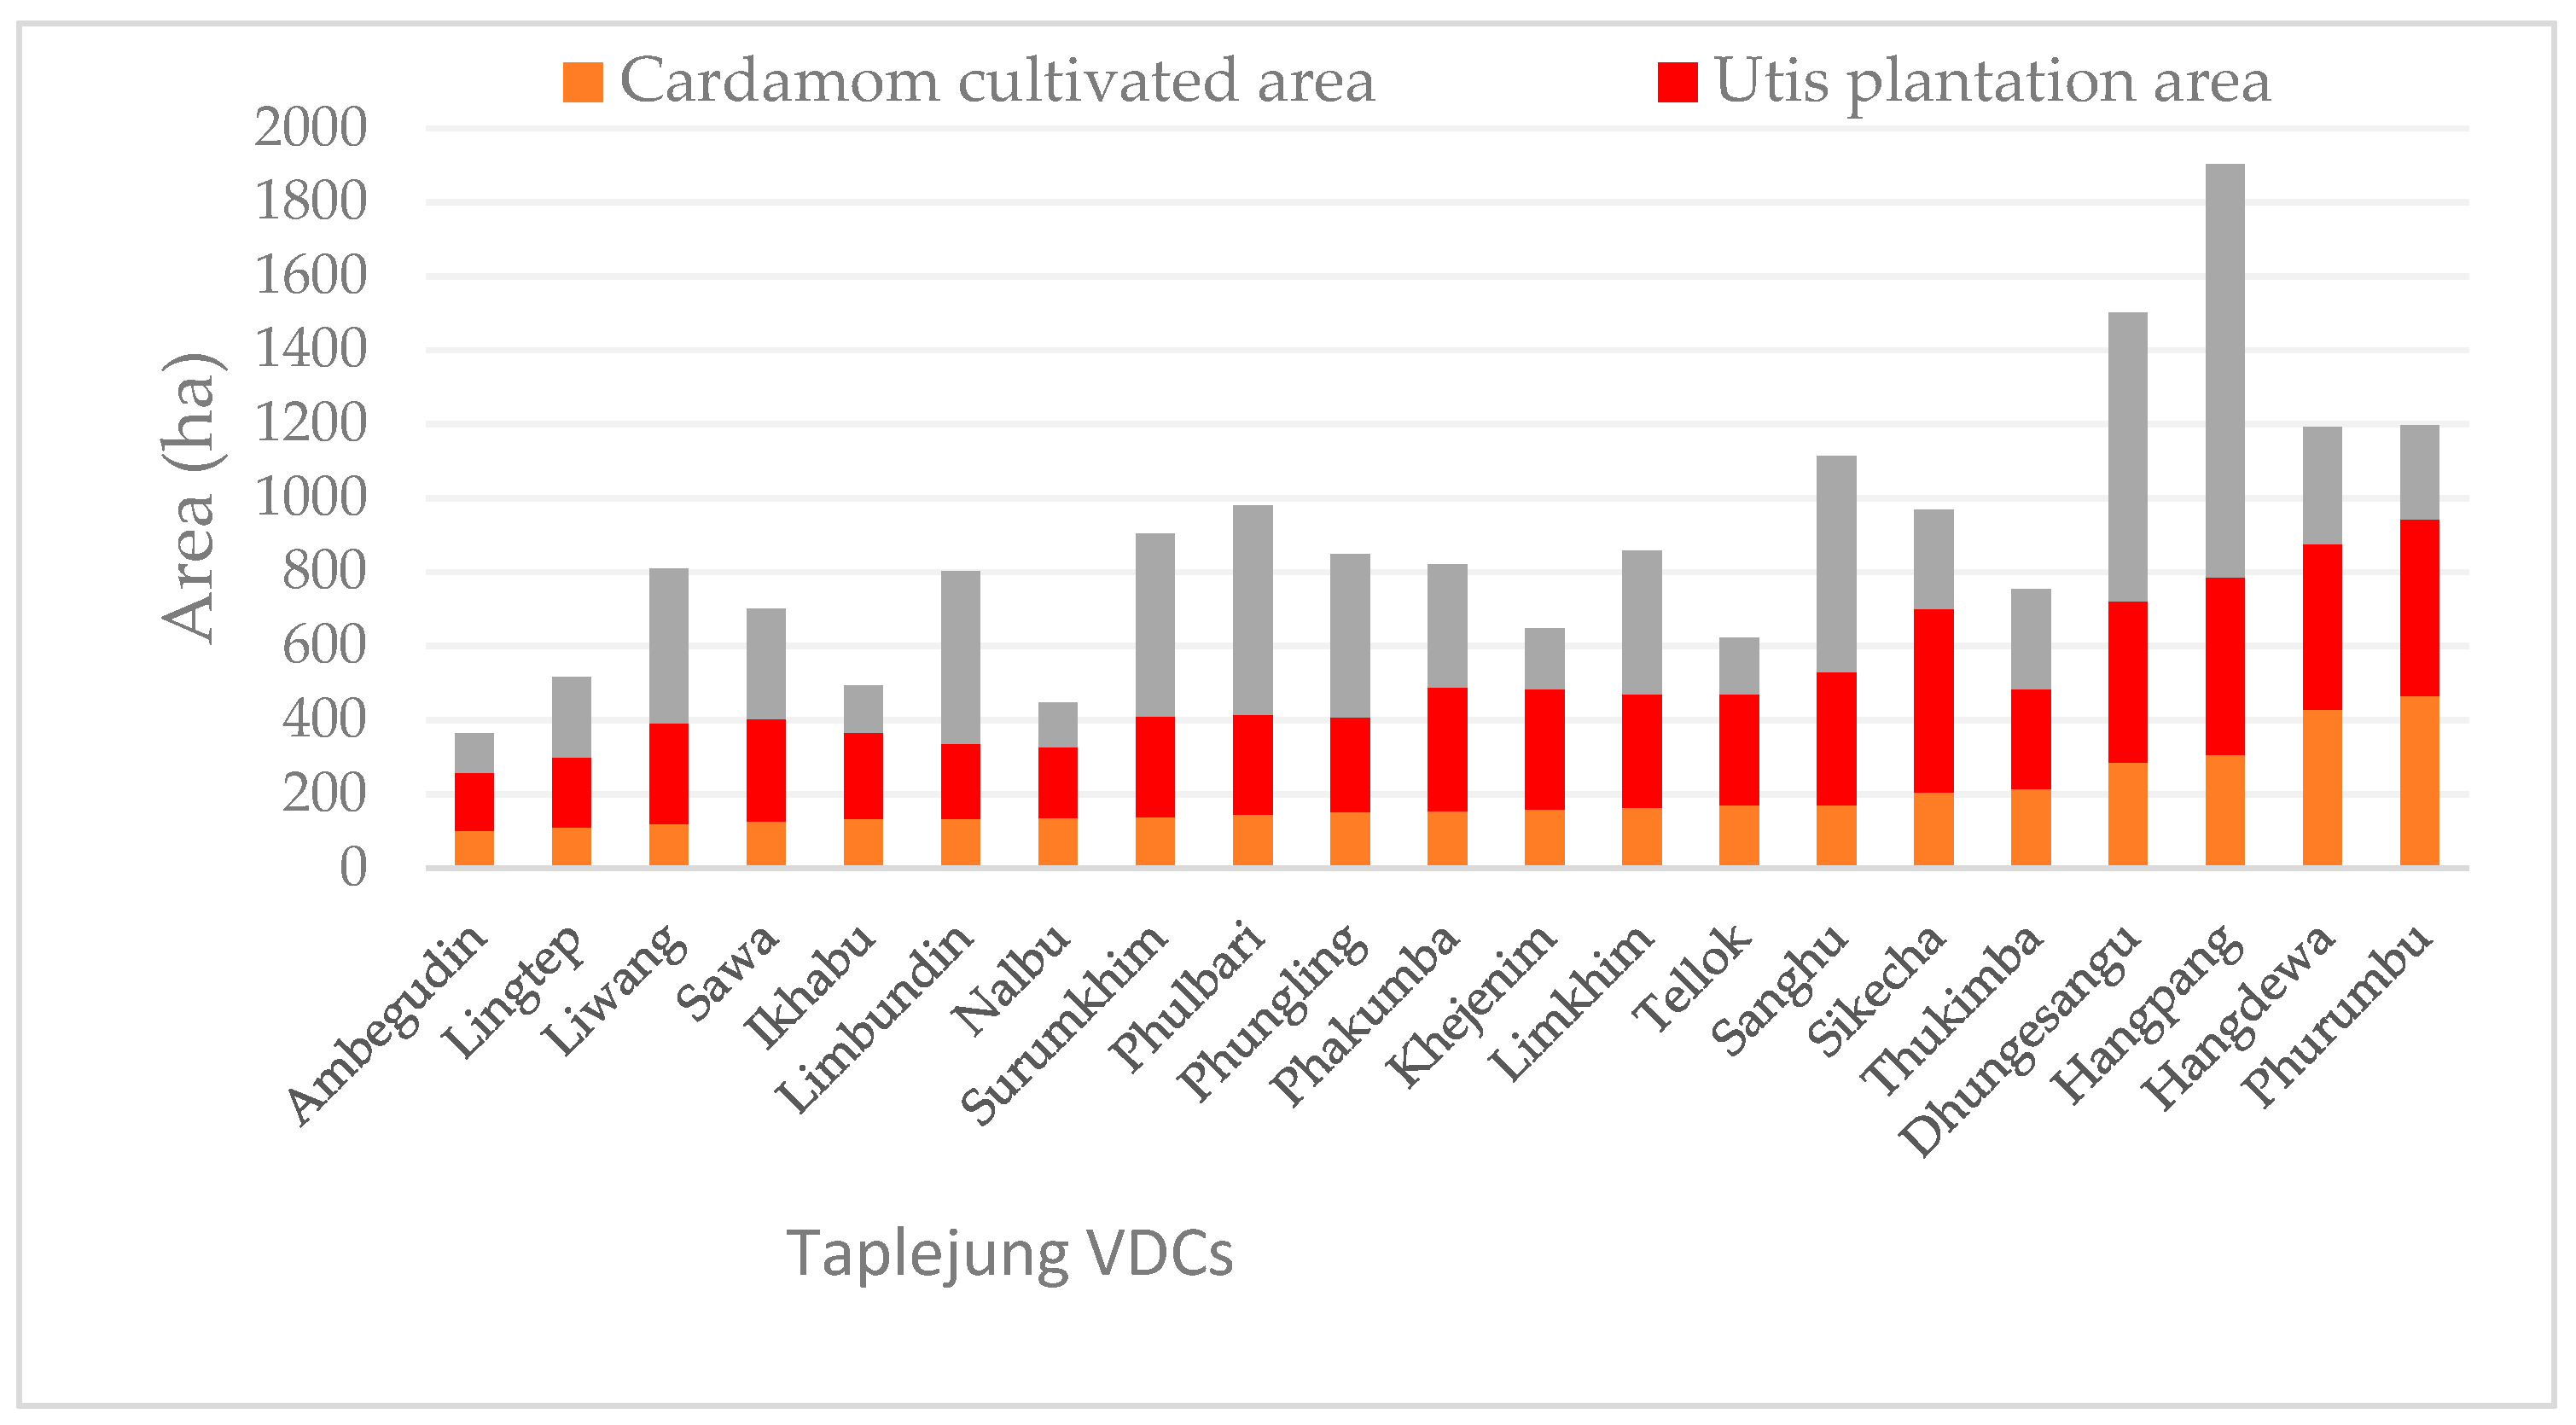
3.2. Uttis (Alnus nepalensis) Cover Mapping and Delineation of Accurate Large Cardamom Map

Spectral separability of major vegetation of the study area using Sentinel-2A image shows that the vegetation are largely separable from each other in NIR and Red Edge bands (Figure 3a). In this study, integration of ancillary data with Sentinel-2A image was applied to map Uttis using OBIA (Figure 3b,c). The classification approach in eCognition has helped to use expert knowledge in differentiating trees within agricultural land and forests, resulting in better classification accuracy. During post classification improvement, small tree patches of Uttis within agricultural land were separated. Shadow in high mountain areas was affecting the classification which was improved during post classification using Google Earth images. There are several studies done on forest type classification [44,45] and land cover classification [39], however, these studies do not include separation of tree species within the forest cover classes.
Uttis cover in the Taplejung district is about 10,735 ha (Figure 4a). Overall, accuracy of the classification was 80% with producer’s and user’s accuracies at 89% and 84%, respectively (Table 1). The obtained Uttis cover and participatory maps were overplayed to get fine resolution large cardamom farming area (Figure 4b). The overlay produced 5198 ha of existing farming area in the district.
The highest cultivation area is found at the elevation range of 1600–1800 m followed by 1800–2000 m, 1400–1600 m, 1200–1400 m, 2000–2200 m, 1000–1200 m, and 800–1000 m, respectively (Figure 5a). Although appropriate elevation for large cardamom is 800–2200 m [38], the farming is also observed below 800 m and above 2200 m. However, there are several species of large cardamom which can be farmed based on altitude [2]. The optimal productivity is possible if large cardamom species is chosen based on elevation.
The largest cultivation area is found in the range of 15°–30° slope while the least is found in the range of 45° and above (Figure 5b). The cultivation area is nearly doubled on the slope of 30°–45° compared to the 0°–15° slope. Several literatures [46,47] stated that the best aspect for cardamom cultivation is North and North-East facing slope. The field data collected for the study showed that cardamom is being cultivated in all aspects. There is no such strict constraint in the selection of aspect for farming. The result shows that the farming area is primarily found in South-West followed by West, North, East, South, North-East, South-East, and North-West (Figure 5c). This indicates that large cardamom can be grown in all kinds of aspects. An evaluation on productivity of large cardamom cultivated at various aspects is essential to identify the best aspect for the crop farming.
Out of 50 VDCs of the Taplejung district, Dhungesanghu, Hangdewa, Hangpang, Phurumbu, Sikecha, and Thukinba are the top six VDCs which have the highest cultivation area (Figure 5d). Among those VDCs, Phurumbu and Hangdewa consist of more than 400 ha of farming area whereas Dhungesanghu and Hangpang contain approximately 285 ha to 305 ha of cultivation area. Sikecha and Thukimba hold around 200 ha of cardamom field.

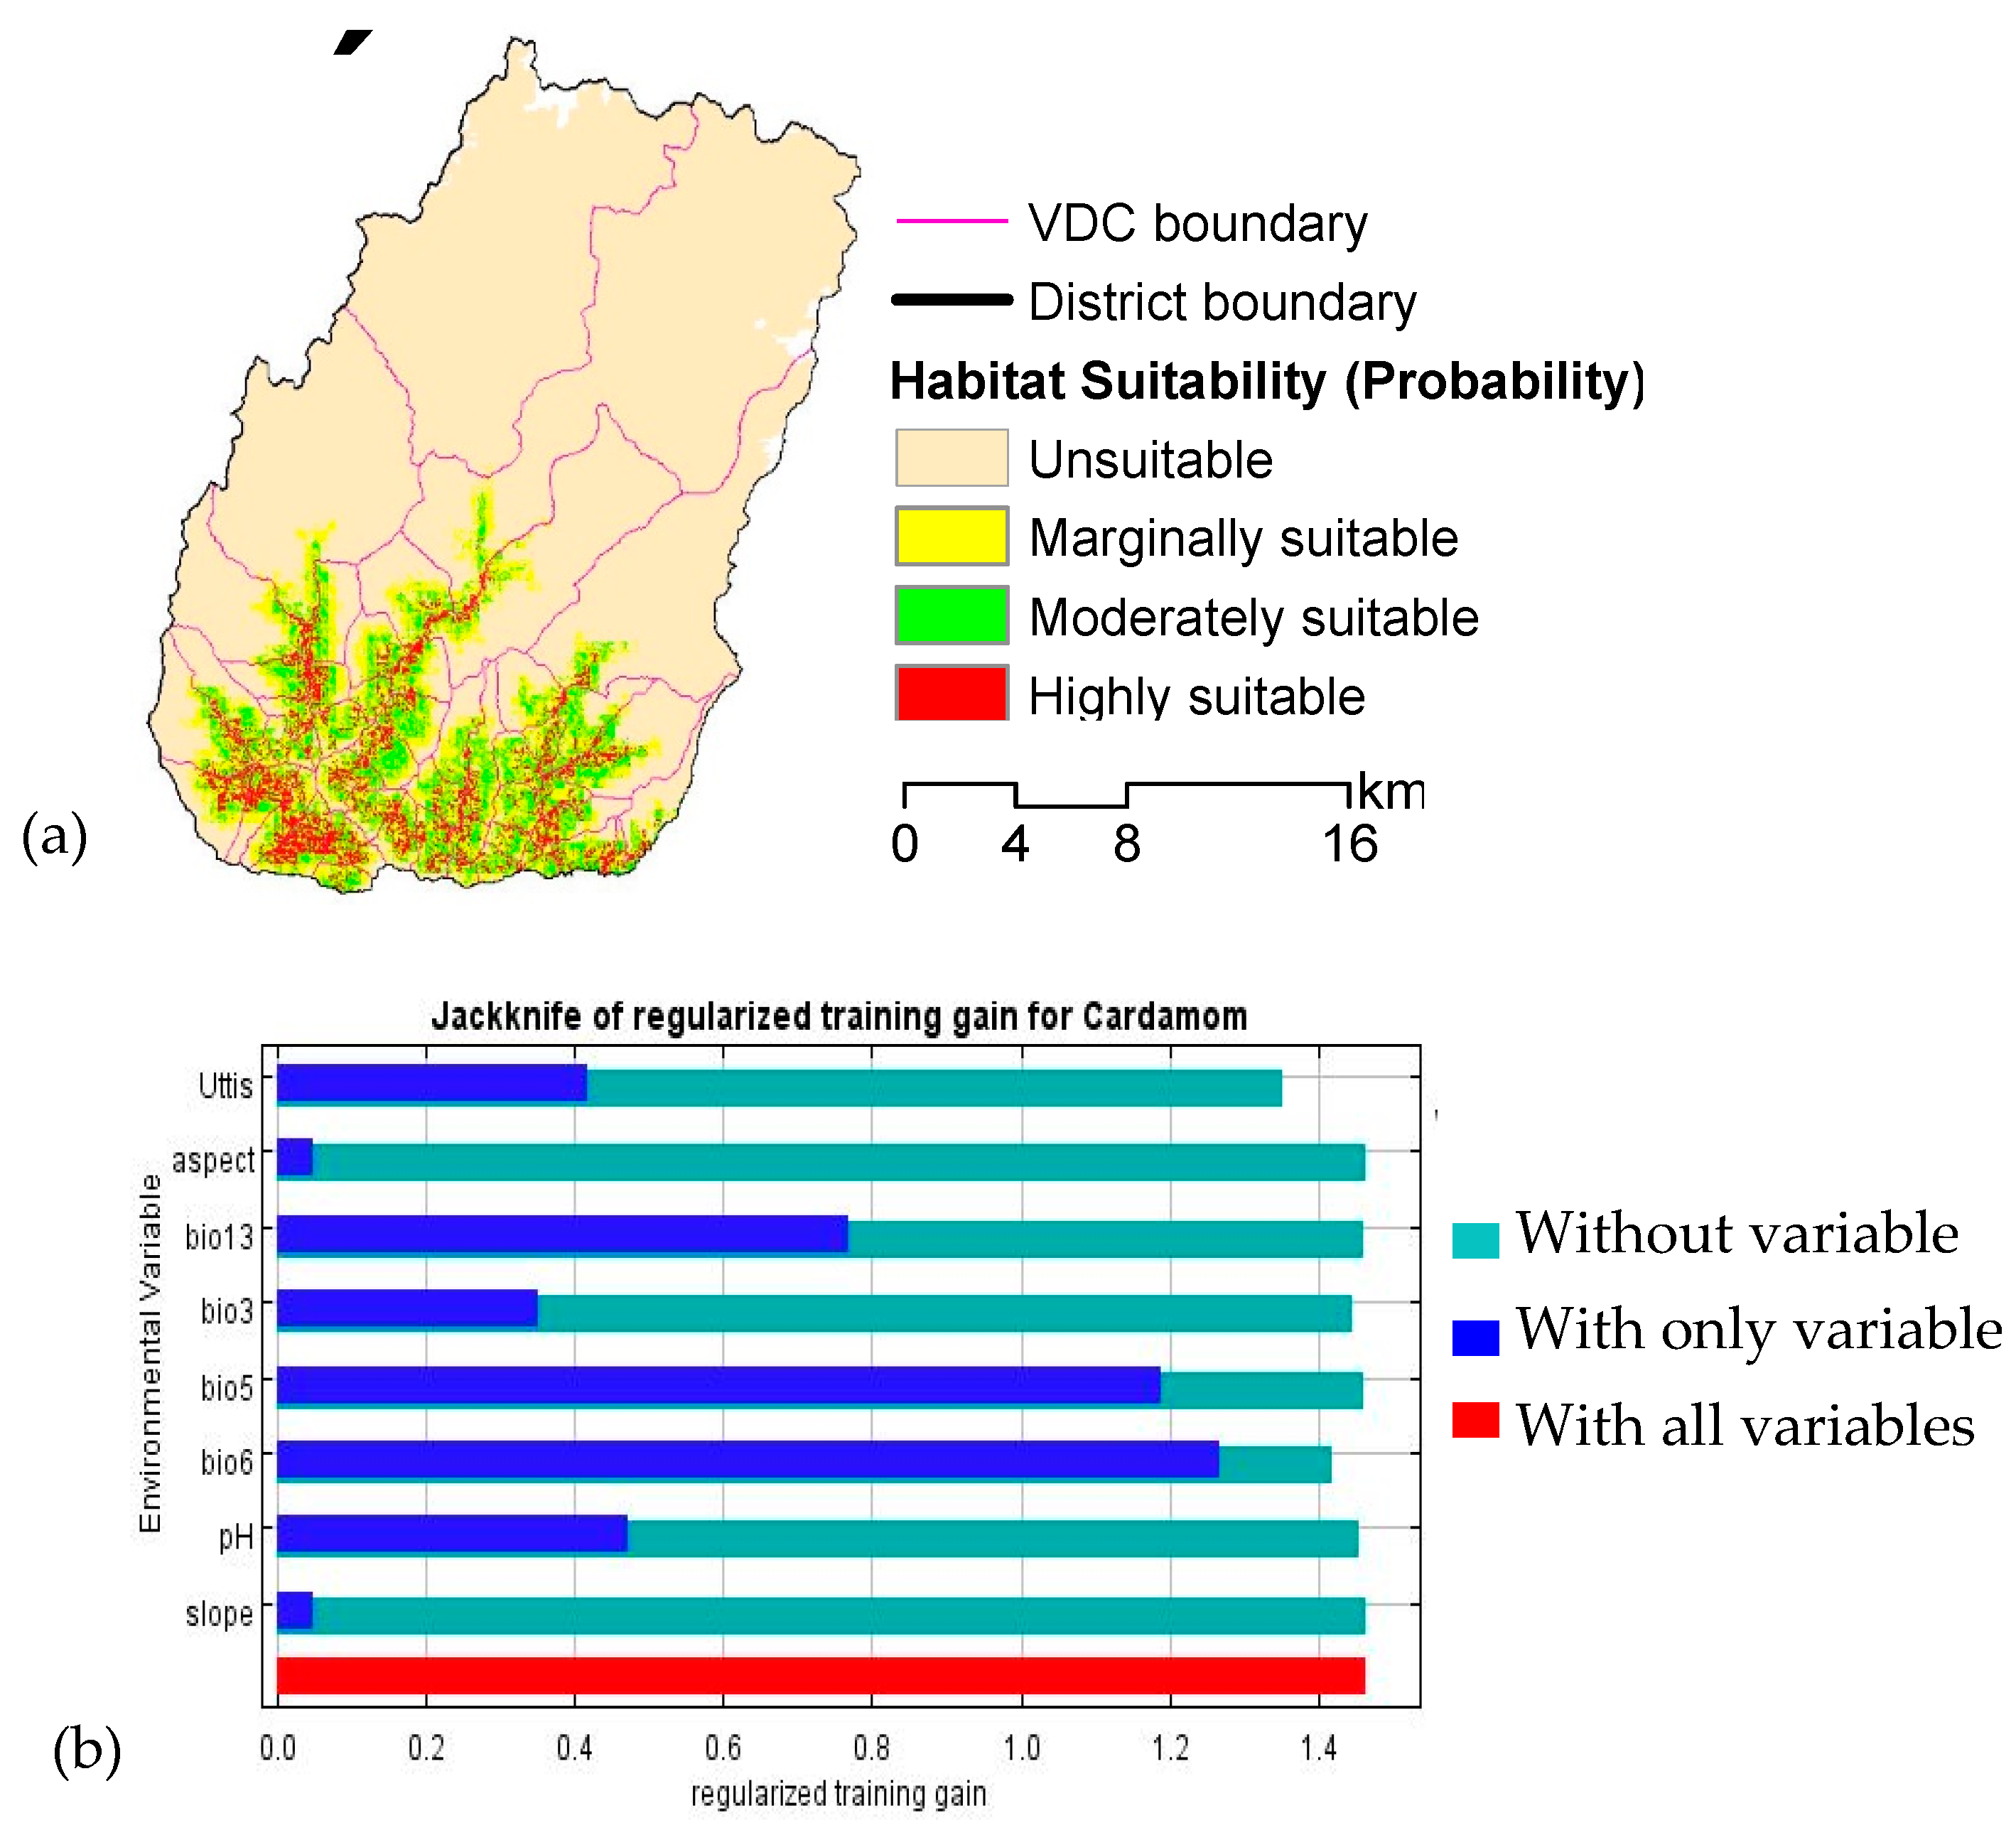
3.3. Current Suitable Habitat

The Maxent model provided a comprehensive understanding of the distribution of large cardamom (Figure 6a). Currently, the highly suitable area in the district is about 13,679 ha and the moderately suitable habitat is about 27,778 ha. The most suitable habitat for large cardamom was predicted in the southern part of Taplejung and its distribution is almost continuous. Suitability decreases with an increase in altitude. The maxent-predicted model had high accuracy with an AUC value of 0.941 for training data and 0.934 for test data. Jackknife results showed that Bio6 (minimum temperature of coldest month) among the eight variables considered for the model had the highest predictive power. The Bio5 (maximum temperature of warmest month) is the second most important variable followed by Bio13 (precipitation of wettest month), pH, Uttis cover, and Bio3 (Isothermality) (Figure 6b).
SDM are influenced by several factors, such as data quality [48,49] and decisions taken during the model fitting [50], sample size [51], multicollinearity [52], and selection of independent variables [53]. Despite these, SDM are increasingly used for various purposes, such as species conservation planning [42] and risk analysis [50]. In this study, we have dealt with some of these issues, such as multicollinearity by removing highly correlated variables, selection of important variables for the species, and considered default settings in Maxent as it provided the best model. Maxent performs best among other modelling methods and even performs better with small sample sizes compared to other modelling methods [30,54,55].

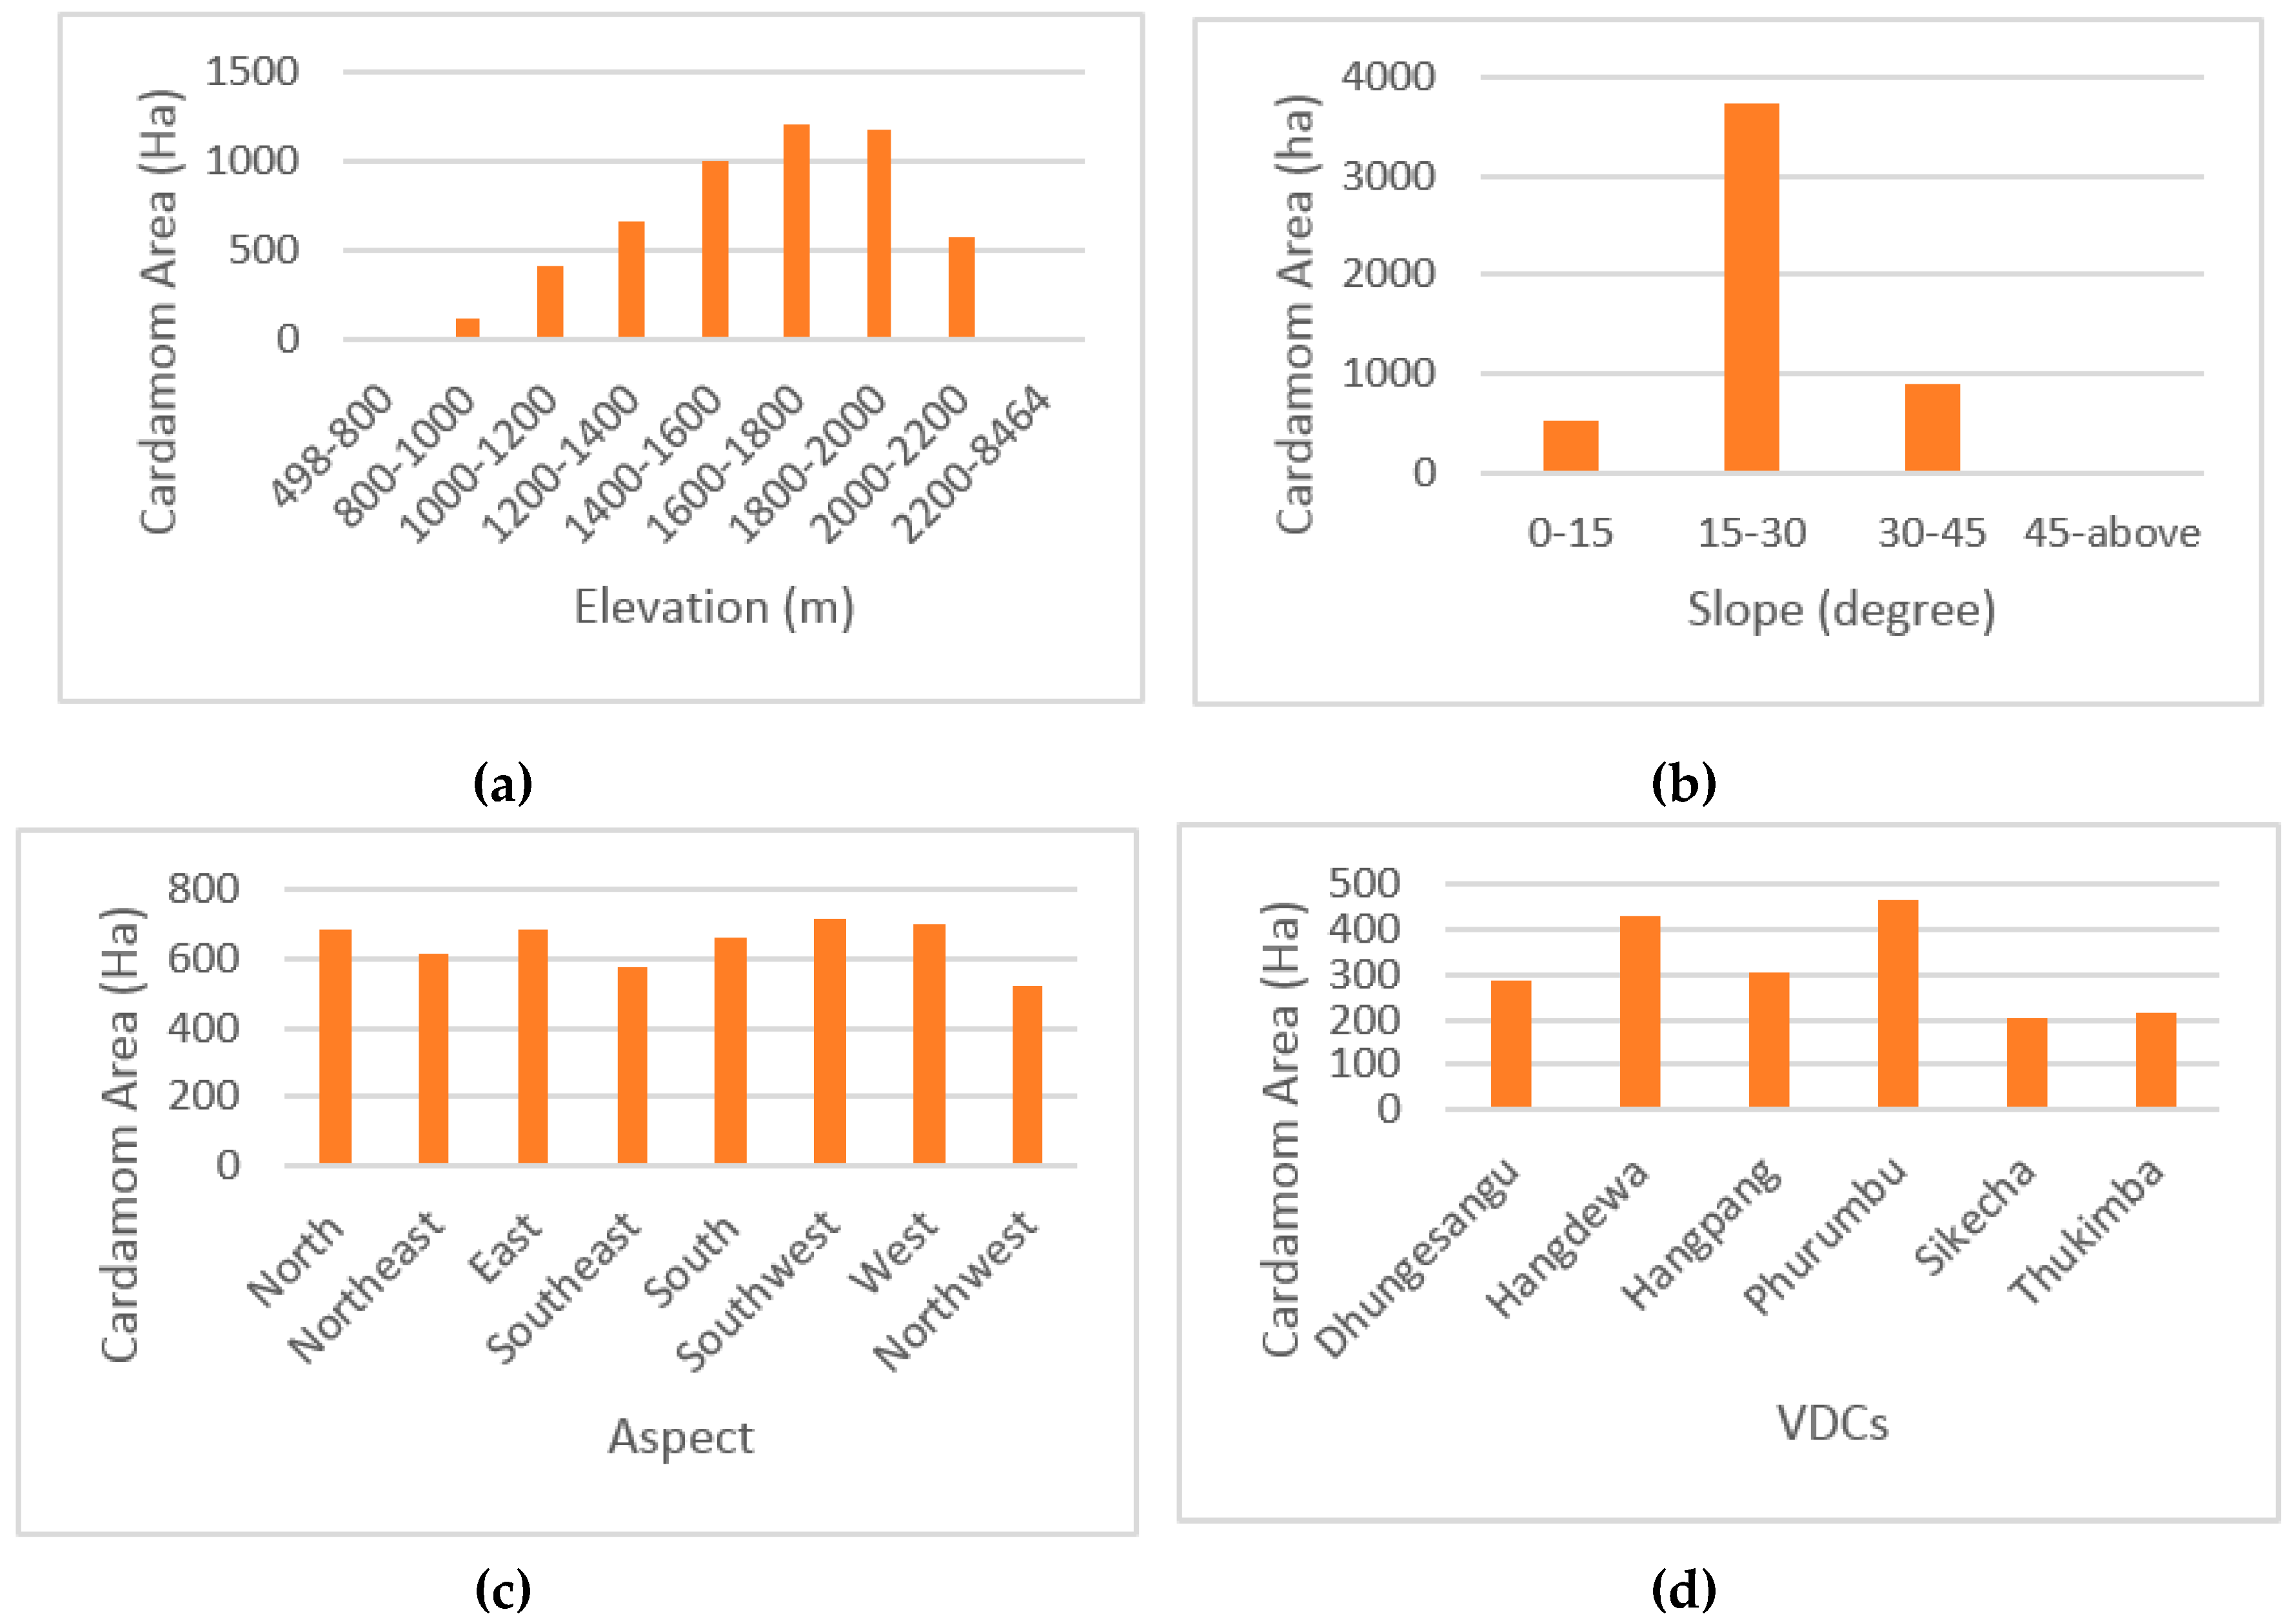
3.4. Current Cardamom Cultivation and Habitat Suitability Analysis

Almost 33% of the current farming area is found in the highly suitable class, 44% of the area is found in the moderately suitable class, and nearly 23% of the area is in the marginally suitable class. This indicates that the cultivation has not yet reached its full potential range. Therefore, the farmers need sensitization on potential areas for the farming which would eventually improve productivity (Figure 7).
The Uttis map, existing cultivated area, and current habitat suitability of large cardamom provided the means to look at the gaps and opportunities for cardamom cultivation at the VDC level. Figure 7 demonstrates that the current cultivation area of large cardamom is much less in most of the VDCs, though there are more Uttis areas and highly suitable areas. The cardamom cultivated area and Uttis area in Ambegudin, Hangdewa, Phurumbu, and Thukimba VDCs are much closer, whereas current highly suitable areas in Hangdewa, Ikhabu, Nalbu, Phurumbu, and Tellok VDCs are less than the existing cultivated area. The statistics describing gaps and opportunities for cardamom crop cultivation will support management plans across the administrative area.
Suitability maps help in selecting the areas for better success in cultivating any particular crop. However, productivity of a crop is not solely dependent on suitable site but also heavily depend on many other factors, such as infrastructure and investments (like irrigation, fertilization, and farm management), biological (insect, pests, and disease), and governance (farmers’ training on growth management). A map on Large Cardamom suitability classes and crop yield data, of year 2011, across the VDCs of Taplejung District is given in the Supplementary Materials S1 and S2.

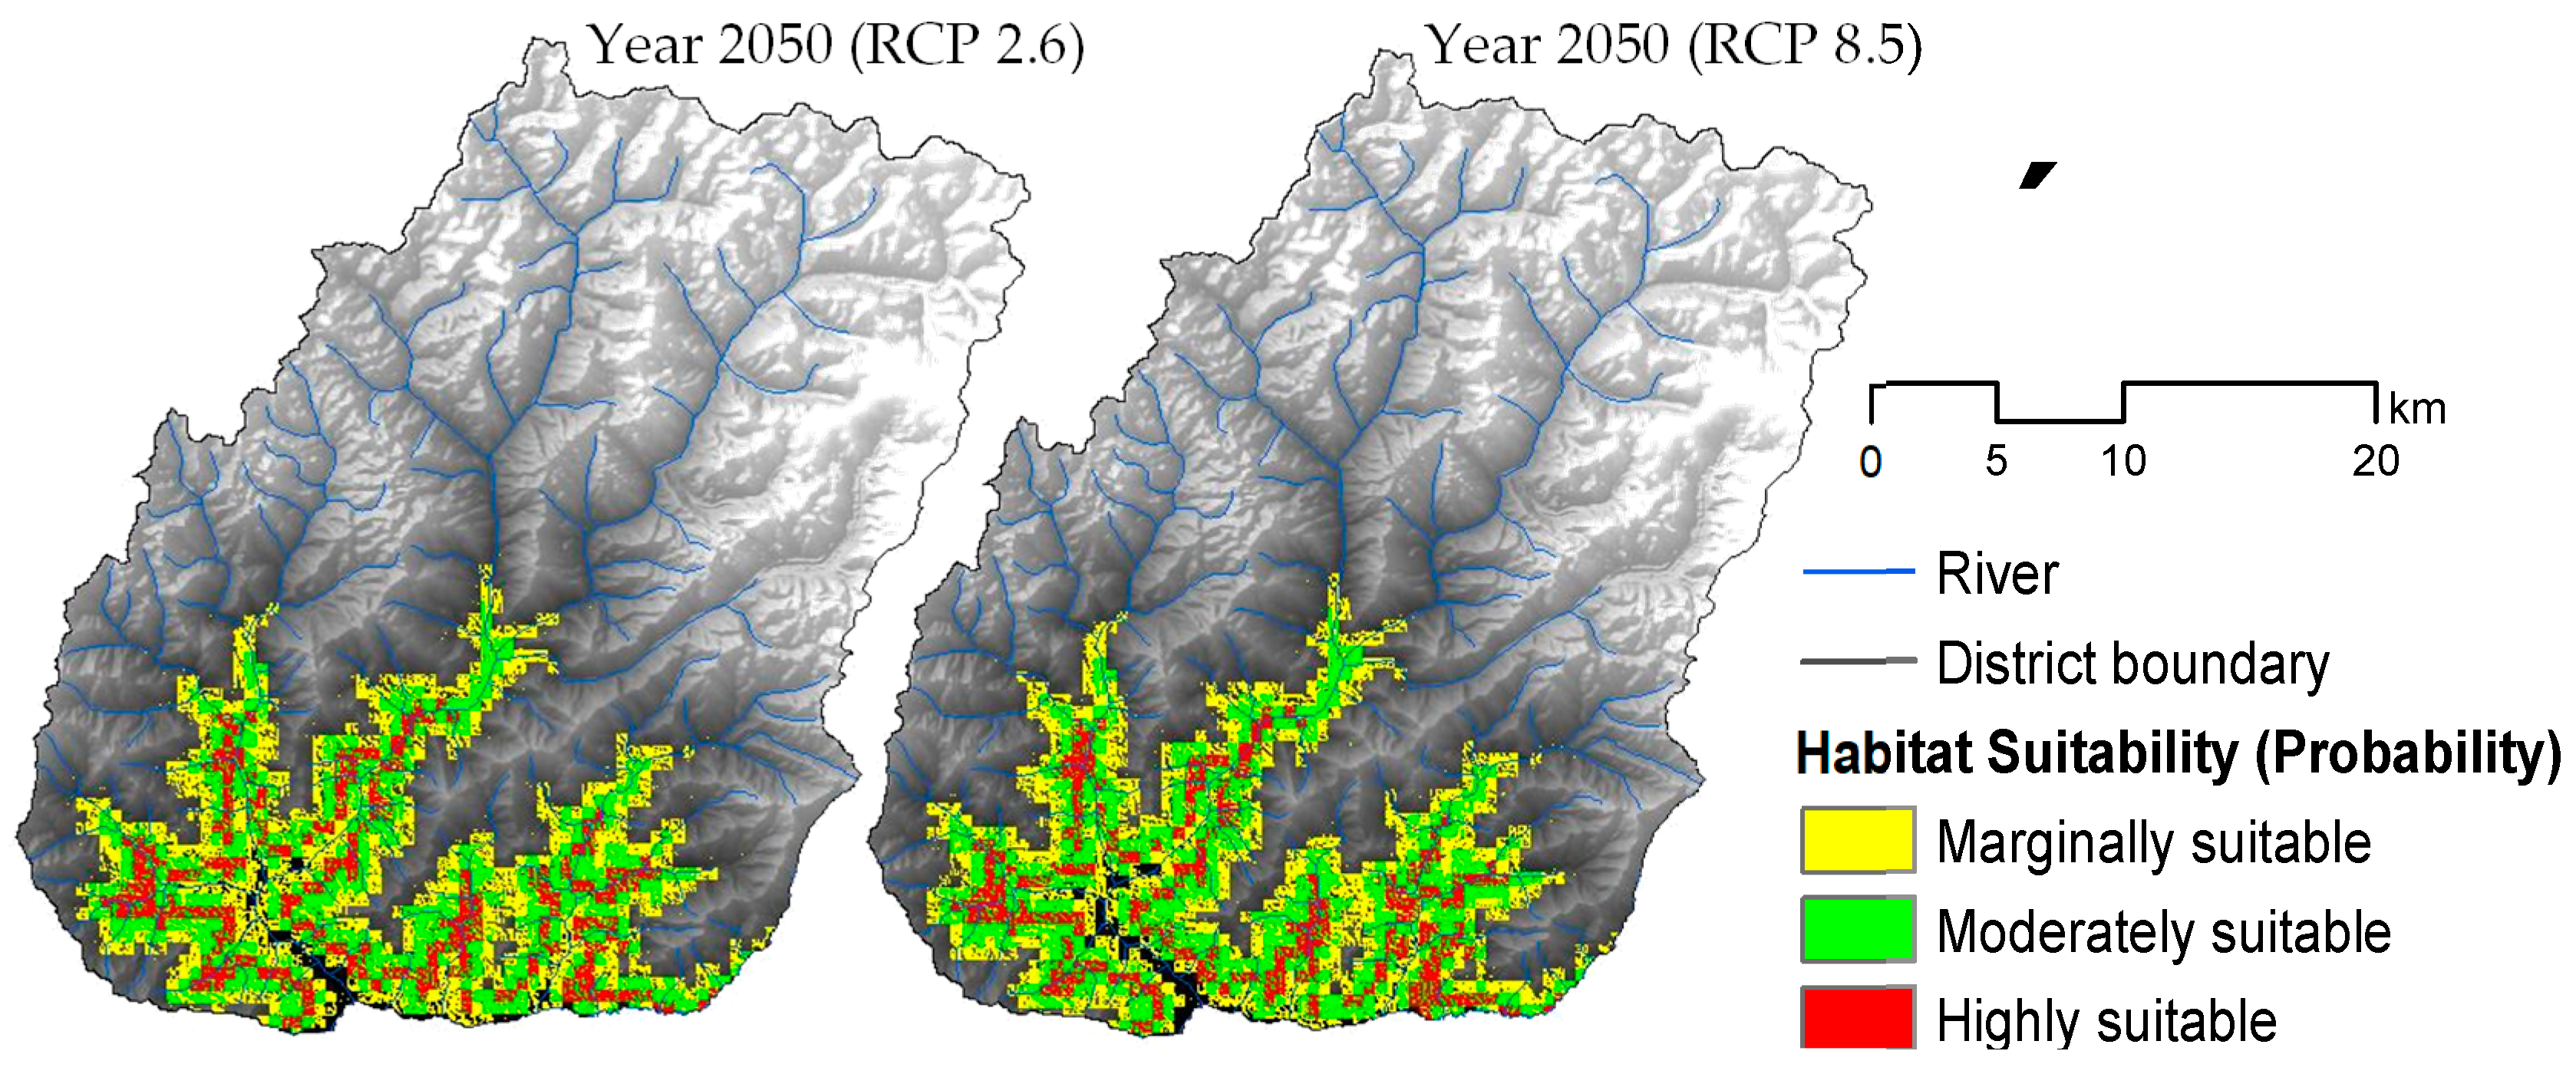
3.5. Suitable Habitat under Climate Change Scenerio

The predicted future habitat suitability for large cardamom in the district under RCP2.6-2050 and RCP8.5-2050 is shown in Figure 8. The model predicted under RCP2.6-2050 has accuracy with an AUC value of 0.94 and 0.914 for training and test data, respectively. Under RCP8.5-2050, the AUC values are 0.939 and 0.916 for training and test data, respectively.

3.6. Projected Changes in the Suitable Habitat Area

Compared to the currently suitable areas, the total areas tend to decrease in both the future scenarios. However, there is no major difference in total areas of the highly suitable class (2%) in RCP 2.6 and a relatively high change in RCP 8.5 (12%). Elevation-wise, we can see there is loss of highly suitable area from the current scenario to both future scenarios, which for the lower is 80% and in higher elevation it is 94% (Table 2). The area tends to maintain a nearly steady-state at elevation range 1000–2000 m, which is ± 0.2%. In conclusion, total potentially suitable areas maintain a nearly steady-state under medium elevation range (1000–2000 m) for all scenarios, whereas the areas are decreasing under future scenarios for the low (500–1000 m) and high elevation (2000–3000 m) (Table 2).
This is the first study to explore current crop cultivation as well as the climate change impacts on the potential distribution of large cardamom crop. Models with AUC values more than 0.75 are considered robust, acceptable, and potentially useful for ecological niche model interpretation [56,57]. Our models obtained AUC values greater than 0.9 which shows our models are satisfactory. The spatial distribution trend under climate change may vary with species causing shifts, contraction, or expansions [58,59,60,61]. Our prediction showed suitable habitat for the crop is diminishing under future conditions compared to the current scenario.
Future changes in suitable habitat area are closely related to temperature and precipitation, which are steadily changing in Nepal over time. It is really important to understand the dynamics of these environmental variables. Stations data showed that the maximum temperature in Nepal increased at the rate of 0.056 °C/year for the period of 1975–2014 [62]. The rate was recorded higher at stations placed at higher altitude, whereas very wet and extremely wet days are diminishing significantly in the northern districts of Nepal [63]. Climate projections for temperature developed for entire Nepal by the Ministry of Forest and Environment (MoFE) [63] showed that the temperature trend is higher in high mountains than other regions in both medium- (2016–2045 for RCP 4.5 and RCP 8.5) and long-term (2036–2065 for RCP 4.5 and RCP 8.5) scenarios. The study found central and western parts of the country will be wetter than the eastern region despite the fact that average annual precipitation change tends to increase by 2.1% in the medium-term period and increase by 7.9% in the long-term period. As large cardamom needs cool and humid climatic conditions [39], most of the current habitat will be negatively affected in future considering the climate projection and data recorded in the past. Particularly, lower altitude would not be favorable for the crop as the temperature tends to reach higher degrees in these elevations. Although annual precipitation change increases in the country, warmer temperature in High Mountain would lead to it becoming drier as it would stimulate more evapotranspiration [58]. These projected drier conditions will negatively influence the habitat suitability of cardamom in the study area. Further, Gudade et al. [64] observed that declining soil nutrition and soil moisture are key drivers in reduction in crop productivity both in India and Nepal.

4. Conclusions

Mapping understory crops and respective habitat conditions is challenging particularly in a complex mountain terrain. The study demonstrated using a combination of expert knowledge-based mapping and species modelling based on bio-climatic factors to understand crop dynamics in a complex mountain terrain. The work applied object-based image analysis on freely available high-resolution satellite data of Sentinel-2A to identify Uttis tree cover in the study area. Use of textures and related indices made it possible to identify a particular tree species within the land cover map. The methodology developed in this study can be used for Uttis cover mapping in other areas of Nepal related to cardamom mapping.
This is the first study to demonstrate potential distribution of large cardamom in the region and the impact of climate change on the distribution. The study showed that crop habitat distribution patterns of understory crop could be modelled using Maxent and coupled with expert knowledge-based mapping to understand the environmental constraints and dynamics. The model under the current scenario showed potentially suitable areas for large cardamom, which has created scope to fill the gaps between farmers’ practice in selection of farming land, and planners to develop sustainable land use planning and management. Current cultivation area is shown the highest in the medium suitability class. Farmers can change the farming area on high suitability area. The planning agencies can use the cardamom map and other information produced in this work for land use planning and crop management to optimize the crop sown area. Models under future scenarios showed that the overall suitable habitat is shrinking to mid-hill elevations (1000–2000 m). Therefore, in response to the projected loss of potential distribution, appropriate spatial planning for crop management and livelihood strategies needs to be developed for large cardamom farmers.

Supplementary Materials

The following are available online at https://www.mdpi.com/2073-4395/9/9/481/s1, Supplementary Materials S1: Relative contributions of the environmental variables to the Maxent model; Supplementary Material S2: Map of Suitability map and crop yield.

Author Contributions

S.M. performed the assessment and writing of the manuscript. F.M.Q. designed the study, performed field data collection, data analysis and writing of the manuscript. G.J. performed field data collection and data analysis. M.M. contributed in data analysis and manuscript writing. S.B. contributed to the writing discussion of results.

Acknowledgments

This research was supported by the Rural Livelihoods and Climate Change Adaptation in the Himalayas (Himalica) Programme, which is implemented by the International Center for Integrated Mountain Development (ICIMOD), and is funded by the European Union. The opinions expressed in the paper are those of the authors and do not necessarily reflect the views of their respective institutions.

Conflicts of Interest

The authors declare no conflict of interest.

References

  1. Sharma, E.; Sharma, R.; Singh, K.K.; Sharma, G. A Boon for Mountain Populations: Large Cardamom Farming in the Sikkim Himalaya. Mt. Res. Dev. 2000, 20, 108–111. [Google Scholar] [CrossRef]
  2. Sharma, G.; Joshi, S.R.; Gurung, M.B.; Chilwal, H.C. Package of Practices for Promoting Climate Resilient Cardamom Value Chains in Nepal. In Training Manual; International Centre for Integrated Mountain Development (ICIMOD): Kathmandu, Nepal, 2017. [Google Scholar]
  3. Vijayan, A.K. Climate change and its impact of an productivity of large cardamom (Amomum subutatum Roxburgh). In Proceedings of the Stakeholders Consultation Workshop on Large Cardamom Development in Nepal, Pakhribas, Nepal, 20 April 2015; pp. 16–27. [Google Scholar]
  4. Lenoir, J.; Gegout, J.C.; Marquet, P.A.; de Ruffray, P.; Brisse, H. A Significant Upward Shift in Plant Species Optimum Elevation during the 20th Century. Science 2008, 320, 1768–1771. [Google Scholar] [CrossRef]
  5. Bertrand, R.; Lenoir, J.; Piedallu, C.; Riofrío-Dillon, G.; de Ruffray, P.; Vidal, C.; Pierrat, J.C.; Gégout, J.C. Changes in plant community composition lag behind climate warming in lowland forests. Nature 2011, 479, 517–520. [Google Scholar] [CrossRef]
  6. Rijal, S.P. Impact of climate change on large cardamom-based livelihoods in Panchthar District, Nepal. Third Pole J. Geogr. Educ. 2013, 13, 33–38. [Google Scholar] [CrossRef]
  7. Justice, C.O.; Becker-Reshef, I. Developing a Strategy for Global Agricultural Monitoring in the Framework of Group on Earth Observations (GEO) Workshop Report; FAO: Rome, Italy, 2007. [Google Scholar]
  8. Soares, J.; Williams, M.; Jarvis, I.; Bingfang, W.; Leo, O.; Fabre, P.; Huynh, F.; Kosuth, P.; Lepoutre, D.; Parilar, J.S.; et al. Strengthening Global Agricultural Monitoring—Improving Sustainable Data for Worldwide Food Security & Commodity Market Transparency. 2011, pp. 1–16. Available online: http://www.earthobservations.org/documents/cop/ag_gams/201106_g20_global_agricultural_monitoring_initiative.pdf (accessed on 23 July 2019).
  9. Asner, G.P.; Knapp, D.E.; Kennedy-Bowdoin, T.; Jones, M.O.; Martin, R.E.; Boardman, J.; Hughes, R.F. Invasive species detection in Hawaiian rainforests using airborne imaging spectroscopy and LiDAR. Remote Sens. Environ. 2008, 112, 1942–1955. [Google Scholar] [CrossRef]
  10. Tuanmu, M.N.; Viña, A.; Bearer, S.; Xu, W.; Ouyang, Z.; Zhang, H.; Liu, J. Mapping understory vegetation using phenological characteristics derived from remotely sensed data. Remote Sens. Environ. 2010, 114, 1833–1844. [Google Scholar] [CrossRef]
  11. Hall, R.J.; Peddle, D.R.; Klita, D.L. Mapping conifer understory within boreal mixedwoods from Landsat TM satellite imagery and forest inventory information. For. Chron. 2000, 76, 887–902. [Google Scholar] [CrossRef] [Green Version]
  12. Johnston, S.E.; Henry, M.C.; Gorchov, D.L. Using Advanced Land Imager (ALI) and Landsat Thematic Mapper (TM) for the Detection of the Invasive Shrub Lonicera maackii in Southwestern Ohio Forests. GIScience Remote Sens. 2012, 49, 450–462. [Google Scholar] [CrossRef]
  13. Resasco, J.; Hale, A.N.; Henry, M.C.; Gorchov, D.L. Detecting an invasive shrub in a deciduous forest understory using latefall Landsat sensor imagery. Int. J. Remote Sens. 2007, 28, 3739–3745. [Google Scholar] [CrossRef]
  14. Becker, R.H.; Zmijewski, K.A.; Crail, T. Seeing the forest for the invasives: Mapping buckthorn in the Oak Openings. Biol. Invasions 2013, 15, 315–326. [Google Scholar] [CrossRef]
  15. Leduc, M.B.; Knudby, A.J. Mapping wild leek through the forest canopy using a UAV. Remote Sens. 2018, 10, 70. [Google Scholar] [CrossRef]
  16. Korpela, I.S. Mapping of understory lichens with airborne discrete-return LiDAR data. Remote Sens. Environ. 2008, 112, 3891–3897. [Google Scholar] [CrossRef]
  17. Peckham, S.D.; Ahl, D.E.; Gower, S.T. Bryophyte cover estimation in a boreal black spruce forest using airborne lidar and multispectral sensors. Remote Sens. Environ. 2009, 113, 1127–1132. [Google Scholar] [CrossRef]
  18. Singh, K.K.; Davis, A.J.; Meentemeyer, R.K. Detecting understory plant invasion in urban forests using LiDAR. Int. J. Appl. Earth Obs. Geoinf. 2015, 38, 267–279. [Google Scholar] [CrossRef] [Green Version]
  19. Vierling, K.T.; Vierling, L.A.; Gould, W.A.; Martinuzzi, S.; Clawges, R.M. Lidar: Shedding new light on habitat characterization and modeling. Front. Ecol. Environ. 2008, 6, 90–98. [Google Scholar] [CrossRef]
  20. Wang, T.J.; Skidmore, A.K.; Toxopeus, A.G. Improved understorey bamboo cover mapping using a novel hybrid neural network and expert system. Int. J. Remote Sens. 2009, 30, 965–981. [Google Scholar] [CrossRef]
  21. Phillips, S.B.; Aneja, V.P.; Kang, D.; Arya, S.P. Modelling and analysis of the atmospheric nitrogen deposition in North Carolina. Int. J. Glob. Environ. Issues 2006, 6, 231–252. [Google Scholar] [CrossRef]
  22. Graham, C.H.; Ferrier, S.; Huettman, F.; Moritz, C.; Peterson, A.T. New developments in museum-based informatics and applications in biodiversity analysis. Trends Ecol. Evol. 2004, 19, 497–503. [Google Scholar] [CrossRef]
  23. Barik, S.K.; Adhikari, D. Predicting the geographical distribution of an invasive species (Chromolaena odorata L. (king) & H.E. Robins) in the Indian subcontinent under climate change scenarios. In Invasive Alien Plants: An Ecological Appraisal for the Indian Subcontinent; CABI: Wallingford, UK, 2011. [Google Scholar]
  24. Niphadkar, M.; Nagendra, H.; Tarantino, C.; Adamo, M.; Blonda, P. Comparing Pixel and Object-Based Approaches to Map an Understorey Invasive Shrub in Tropical Mixed Forests. Front. Plant Sci. 2017, 8, 1–18. [Google Scholar] [CrossRef]
  25. Blaschke, T. Object based image analysis for remote sensing. ISPRS J. Photogramm. Remote Sens. 2010, 65, 2–16. [Google Scholar] [CrossRef] [Green Version]
  26. Mialhe, F.; Gunnell, Y.; Ignacio, J.A.F.; Delbart, N.; Ogania, J.L.; Henry, S. Monitoring land-use change by combining participatory land-use maps with standard remote sensing techniques: Showcase from a remote forest catchment on Mindanao, Philippines. Int. J. Appl. Earth Obs. Geoinf. 2015, 36, 69–82. [Google Scholar] [CrossRef]
  27. Robiglio, V.; Mala, W.A. Integrating local and expert knowledge using participatory mapping and GIS to implement intergrated forest management options in Akok, Cameroon. For. Chron. 2005, 81, 392–397. [Google Scholar] [CrossRef]
  28. Lauer, M.; Aswani, S. Integrating indigenous ecological knowledge and multi-spectral image classification for marine habitat mapping in Oceania. Ocean Coast. Manag. 2008, 51, 495–504. [Google Scholar] [CrossRef]
  29. Elith, J.; Graham, C.H.; Anderson, R.P.; Dudı’k, M.; Ferrier, S.; Guisan, A.; Hijmans, R.J.; Huettmann, F.; Leathwick, J.R.; Lehmann, A.; et al. Novel methods improve prediction of species’ distributions from occurrence data. Ecography 2006, 29, 129–151. [Google Scholar] [CrossRef]
  30. Pearson, R.G.; Raxworthy, C.J.; Nakamura, M.; Townsend Peterson, A. Predicting species distributions from small numbers of occurrence records: A test case using cryptic geckos in Madagascar. J. Biogeogr. 2007, 34, 102–117. [Google Scholar] [CrossRef]
  31. Kumar, S.; Stohlgren, T.J. Maxent modeling for predicting suitable habitat for threatened and endangered tree Canacomyrica monticola in New Caledonia. J. Ecol. Nat. Environ. 2009, 1, 094–098. [Google Scholar]
  32. Shrestha, J.; Prasai, H.K.; Timilsina, K.P.; Shrestha, K.P.; Pokhrel, D.; Paudel, K.; Yadav, M. Large Cardamom in Nepal: Production Practice and Economics, Processing and Marketing; National Commercial Agriculture Research Program, Nepal Agriculture Research Council: Pakhribas, Dhankuta, Nepal, 2018. [Google Scholar]
  33. McCall, M.K.; Minang, P.A. Assessing Participatory GIS for Community-Based Natural Resource Management: Claiming Community Forests in Cameroon. Geogr. J. 2005, 171, 340–356. [Google Scholar] [CrossRef]
  34. Drusch, M.; Del Bello, U.; Carlier, S.; Colin, O.; Fernandez, V.; Gascon, F.; Hoersch, B.; Isola, C.; Laberinti, P.; Martimort, P.; et al. Sentinel-2: ESA’s Optical High-Resolution Mission for GMES Operational Services. Remote Sens. Environ. 2012, 120, 25–36. [Google Scholar] [CrossRef]
  35. Blaschke, T.; Lang, S.; Lorup, E.; Strobl, J.; Zeil, P. Object-Oriented Image Processing in an Integrated GIS/Remote Sensing Environment and Perspectives for Environmental Applications. Umweltinf. Plan. Polit. Öffentl.keit Environ. Inf. Plan. Polit. Public 2000, 2, 555–570. [Google Scholar]
  36. Hay, G.J.; Blaschke, T.; Marceau, D.J.; Bouchard, A. A comparison of three image-object methods for the multiscale analysis of landscape structure. ISPRS J. Photogramm. Remote Sens. 2003, 57, 327–345. [Google Scholar] [CrossRef]
  37. Belgiu, M.; Drǎguţ, L. Comparing supervised and unsupervised multiresolution segmentation approaches for extracting buildings from very high resolution imagery. ISPRS J. Photogramm. Remote Sens. 2014, 96, 67–75. [Google Scholar] [CrossRef] [Green Version]
  38. National Spice Crop Development Programme. Annual Report of National Spice Crop Development Programme; National Spice Crop Development Programme, Ministry of Agriculture Development, Government of Nepal: Khumaltar, Kathmandu, Nepal, 2009.
  39. Uddin, K.; Shrestha, H.L.; Murthy, M.S.R.; Bajracharya, B.; Shrestha, B.; Gilani, H.; Pradhan, S.; Dangol, B. Development of 2010 national land cover database for the Nepal. J. Environ. Manag. 2015, 148, 82–90. [Google Scholar] [CrossRef]
  40. Tadono, T.; Ishida, H.; Oda, F.; Naito, S.; Minakawa, K.; Iwamoto, H. Precise Global DEM Generation by ALOS PRISM. ISPRS Ann. Photogramm. Remote Sens. Spat. Inf. Sci. 2014, II–4, 71–76. [Google Scholar] [CrossRef]
  41. Micheal, H. Graham Confronting Multicollinearity in Ecological Multiple Regression. Ecology 2003, 84, 2809–2815. [Google Scholar]
  42. Yang, X.Q.; Kushwaha, S.P.S.; Saran, S.; Xu, J.; Roy, P.S. Maxent modeling for predicting the potential distribution of medicinal plant, Justicia adhatoda L. in Lesser Himalayan foothills. Ecol. Eng. 2013, 51, 83–87. [Google Scholar] [CrossRef]
  43. Naimi, B.; Hamm, N.A.S.; Groen, T.A.; Skidmore, A.K.; Toxopeus, A.G. Where is Positional Uncertainty a Problem for Species Distribution Modelling? Available online: https://onlinelibrary.wiley.com/doi/abs/10.1111/j.1600-0587.2013.00205.x (accessed on 11 July 2019).
  44. Maharjan, S. Estimation and Mapping Above Ground Woody Carbon Stocks Using Lidar Data And Digital Camera Imagery in The Hilly Forest of Gorkha, Nepal. Master’s Thesis, University of Twente, Enschede, The Netherlands, 2012. [Google Scholar]
  45. Karna, Y.K.; Hussin, Y.A.; Gilani, H.; Bronsveld, M.C.; Murthy, M.S.R.; Qamer, F.M.; Karky, B.S.; Bhattarai, T.; Aigong, X.; Baniya, C.B. Integration of WorldView-2 and airborne LiDAR data for tree species level carbon stock mapping in Kayar Khola watershed, Nepal. Int. J. Appl. Earth Obs. Geoinf. 2015, 38, 280–291. [Google Scholar] [CrossRef]
  46. Baniya, N.; Böehme, M.; Baniya, S. Physical land suitability assessment for the large cardamom amomum subulatum roxb. Cultivation in hills of Kathmandu valley. Chin. J. Popul. Resour. Environ. 2009, 7, 59–63. [Google Scholar] [CrossRef]
  47. ECDF. Alaichi Kheti and Prashodhan Hate Pustika; Environment Conservation and Development Forum: Taplejung, Mechi Zone, Nepal, 2008. [Google Scholar]
  48. Coro, G.; Magliozzi, C.; Ellenbroek, A.; Pagano, P. Improving data quality to build a robust distribution model for Architeuthis dux. Ecol. Model. 2015, 305, 29–39. [Google Scholar] [CrossRef]
  49. Aubry, K.B.; Raley, C.M.; McKelvey, K.S. The importance of data quality for generating reliable distribution models for rare, elusive, and cryptic species. PLoS ONE 2017, 12, 1–17. [Google Scholar] [CrossRef]
  50. Kumar, S.; Graham, J.; West, A.M.; Evangelista, P.H. Using district-level occurrences in MaxEnt for predicting the invasion potential of an exotic insect pest in India. Comput. Electron. Agric. 2014, 103, 55–62. [Google Scholar] [CrossRef]
  51. Stockwell, D.R.B.; Peterson, A.T. Effects of sample size on accuracy of species distribution models. Ecol. Model. 2002, 148, 1–13. [Google Scholar] [CrossRef]
  52. Dormann, C.F.; Elith, J.; Bacher, S.; Buchmann, C.; Carl, G.; Carré, G.; Marquéz, J.R.G.; Gruber, B.; Lafourcade, B.; Leitão, P.J.; et al. Collinearity: A review of methods to deal with it and a simulation study evaluating their performance. Ecography 2013, 36, 027–046. [Google Scholar] [CrossRef]
  53. Evangelista, P.H.; Kumar, S.; Stohlgren, T.J.; Jarnevich, C.S.; Crall, A.W.; Norman, J.B.; Barnett, D.T. Modelling invasion for a habitat generalist and a specialist plant species. Divers. Distrib. 2008, 14, 808–817. [Google Scholar] [CrossRef]
  54. Elith, J.; Graham, C.H.; Anderson, R.P.; Dudík, M.; Guisan, A.; Hijmans, R.J.; Huettmann, F.; Leathwick, J.R.; Lehmann, A.; Li, J.; et al. Novel Methods Improve Prediction of Species’ Distributions from OccurrenceData. Ecography. 2006, 29, 129–151. [Google Scholar] [CrossRef]
  55. Ortega-Huerta, M.A.; Peterson, A.T. Modeling ecological niches and predicting geographic distributions: A test of six presence-only methods. Rev. Mex. De Biodivers. 2008, 79, 205–216. [Google Scholar]
  56. Pearce, J.; Ferrier, S. An evaluation of alternative algorithms for fitting species distribution models using logistic regression. Ecol. Model. 2000, 128, 127–147. [Google Scholar] [CrossRef]
  57. Elith, J. Quantitative Methods for Modeling Species Habitat: Comparative Performance and An Application to Australian Plants; Springer: New York, NY, USA, 2000. [Google Scholar]
  58. Li, R.; Xu, M.; Wong, M.H.G.; Qiu, S.; Sheng, Q.; Li, X.; Song, Z. Climate change-induced decline in bamboo habitats and species diversity: Implications for giant panda conservation. Divers. Distrib. 2014, 21, 379–391. [Google Scholar] [CrossRef]
  59. Lamsal, P.; Kumar, L.; Aryal, A.; Atreya, K. Invasive alien plant species dynamics in the Himalayan region under climate change. Ambio 2018, 47, 697–710. [Google Scholar] [CrossRef]
  60. Maclean, I.M.D.; Wilson, R.J. Recent ecological responses to climate change support predictions of high extinction risk. Proc. Natl. Acad. Sci. USA 2011, 108, 12337–12342. [Google Scholar] [CrossRef] [Green Version]
  61. Ponce-Reyes, R.; Nicholson, E.; Baxter, P.W.J.; Fuller, R.A.; Possingham, H. Extinction risk in cloud forest fragments under climate change and habitat loss. Divers. Distrib. 2013, 19, 518–529. [Google Scholar] [CrossRef] [Green Version]
  62. DHM Observed Climate Trend Analysis in the Districts and Physiographic Zones of Nepal (1971–2014); Government of Nepal Ministry of Population and Environment Department of Hydrology and Meteorology: Kathmandu, Nepal, 2017.
  63. MoFE Climate Change Scenarios for Nepal for National Adaptation Plan (NAP); Ministry of Forests and Environment: Kathmandu, Nepal, 2019.
  64. Gudade, B.A.; Harsha, K.N.; Vijayan, A.K.; Chhetri, P.; Deka, T.N.; Babu, S.; Singh, R. Effect of soil application of Zn, Mn and Mg on growth and nutrient content of large cardamom, Amomum subulatum Roxb at Sikkim. Int. J. Farm Sci. 2015, 5, 51–55. [Google Scholar]
Figure 1. Methodology flow diagram.
Agronomy 09 00481 g001
Figure 2. Mapping of large cardamom crop clusters across the Taplejung district based on participatory mapping.
Agronomy 09 00481 g002
Figure 3. (a) Spectral separability of vegetation, (b) Sentinel-2A satellite image (False color), (c) object-based classification of satellite data.
Agronomy 09 00481 g003
Figure 4. (a) Spatial distribution of Uttis tree cover, (b) spatial distribution of cardamom under Uttis tree and standalone Uttis tree cover.
Agronomy 09 00481 g004
Figure 5. Analysis of large cardamom cultivation area based on elevation, slope, aspect, and VDCs. (a). Cardamom cultivation area with elevation; (b). Cardamom cultivation area with slope; (c). Cardamom cultivation area in various aspects; (d). Top 6 VDCs with the highest cultivation area.
Agronomy 09 00481 g005
Figure 6. (a) Potential distribution of cardamom in the district, (b) Relative predictive power of different contributing variables based on the jackknife of regularized training gain in the Maxent model for large cardamom.
Agronomy 09 00481 g006
Figure 7. VDC-wise statistics to identify current utilization of the potential habitat.
Agronomy 09 00481 g007
Figure 8. Distribution of large cardamom in Taplejung, Nepal, under future scenarios.
Agronomy 09 00481 g008
Table 1. Contingency matrix for accuracy assessment.
Observed Vegetation Classes Grand TotalUser’s Accuracy
AgricultureConiferOther Broadleaf ShrubsUttis
Mapped Vegetation ClassesAgriculture1500311979
Conifer0162011984
Other Broadleaf 0212021675
Shrubs2031602176
Uttis2031253181
Grand Total:1918202029106
Producer’s Accuracy:7989608086
Overall accuracy: 80%
Table 2. Areas (ha) of habitat suitability under different scenarios with elevation ranges.
Current Cultivation (2016)Current RCP2.6 (2050) RCP8.5 (2050)
Suitability Marginal ModerateHighTotalMarginalModerateHighTotalMarginal ModerateHighTotal
Elevation Ranges (m)500–10007262673141548345712700667102346923005131072920
1000–200017,40016,69921,03812,86650,60215,95222,47113,37451,79715,52123,31811,30050,139
2000–3000460316,686532533122,34211,62610751812,71912,26610512013,336
Total22,72936,05827,77813,67977,51530,27824,21313,49467,98530,08724,88211,42666,395

