Article

Effects of LED lights on Expression of Genes Involved in Phenylpropanoid Biosynthesis and Accumulation of Phenylpropanoids in Wheat Sprout

Department of Crop Science, Chungnam National University, 99 Daehak-ro, Yuseong-gu, Daejeon 34134, Korea
*
Authors to whom correspondence should be addressed.
Those authors contributed equally to this work.
Agronomy 2019, 9(6), 307; https://doi.org/10.3390/agronomy9060307
Submission received: 6 May 2019 / Revised: 4 June 2019 / Accepted: 10 June 2019 / Published: 12 June 2019

Abstract

:
Phenylpropanoids are naturally occurring compounds that exert beneficial pharmacological effects on human health. Phenylpropanoids can act as antioxidants and are involved in resistance to ultraviolet light and cancer; these compounds possess anti-inflammatory, antiviral, and antibacterial activity, and aid in wound healing. The expression of genes involved in phenylpropanoid biosynthesis, and consequent accumulation of phenylpropanoids in wheat sprout under conditions of stress, have not been extensively studied. This is the first study to examine the effects of light-emitting diodes (LED) on the expression of genes involved in phenylpropanoid biosynthesis and accumulation of phenylpropanoids in wheat sprouts. Our results, obtained using qRT-PCR and HPLC analyses, indicate that white light (380 nm) was the optimal wavelength for epicatechin biosynthesis in wheat sprouts. Compared with the effects of white light, blue light (470 nm) enhanced the accumulation of gallic acid and quercetin, but decreased the levels of p-coumaric acid and epicatechin; red light (660 nm) increased the accumulation of ferulic acid at 8 day and p-coumaric acid at 12 day. Compared gene expression with phenylpropanoid content showed that TaPAL3, TaPAL4, and TaDFR maybe important genes in phenylpropanoid biosynthesis in wheat sprout. This study provides insights into the effects of led lights on phenylpropanoid production in wheat sprouts. This knowledge will help improve secondary metabolite production in wheat sprouts.

1. Introduction

There has been an increase in the use of sprouted grains, including barley, rye, wheat, triticale, rice, oats, sorghum, maize, and buckwheat in the human diet. Wheat (Triticum aestivum L.) is an important grain cultivated worldwide. It is a significant source of human nutrition that provides dietary fiber, minerals, vitamins (notably thiamine, riboflavin, niacin, B5 vitamin, and B6 vitamin), phytochemicals (such as phenolic acids, flavonoids, stilbenes/lignans, and carotenoids), and protein (mainly gluten) [1]. During growth and development, wheat is affected by environmental factors, including light quality, UV light, temperature variations, and irrigation. One of the most influential factors is light, which affects plant photosynthesis, physiology, variation in growth, and development. Light also drives the production of metabolites in plants [2,3]. Near monochromatic light-emitting diodes (LEDs) possess features such as wavelength specificity, high energy-conversion efficiency, long operating lifetime, low heat emission, small size, and adjustable light intensity [4,5]. The use of LEDs enables us to assess how different narrow-band wavelengths of light impact the accumulation of secondary compounds, and seedling morphology and physiology, in controlled environments. Numerous studies have examined the influence of LEDs on plant production of secondary metabolites. LEDs have been used to examine the production of secondary metabolites in lettuce [6,7], buckwheat [8,9], lemon balm [10], pea seedling [11], broccoli [3], bitter melon [12], Chinese cabbage [13], rapeseed [14], and kale [2]; however, the influence of LEDs on the production of secondary metabolites in wheat sprouts has not been investigated.
Phenylpropanoids are a large class of secondary metabolites, including coumarins, aurones, catechin, isoflavonoids, lignin, lignocellulose, flavonoids, and stilbenes [15]. Phenylpropanoids are present in fruits, vegetables, medicinal herbs (seeds, root, and leaves), and nuts [16,17]. Phenylpropanoids possess anti-inflammatory, antiviral, anti-allergenic, antibacterial, and antioxidant properties, which are beneficial to human health [18,19,20]. Phenylpropanoid is also reported to inhibit carcinogenesis and reduce the risk of diabetes and heart disease [21,22]. In plants, the major component of plant cell walls is lignin [23]. The antimicrobial properties of certain phenylpropanoids are also used in the defense of the plant during plant–microbe interactions [24]. Phenylalanine is involved in the phenylpropanoid biosynthetic pathway (Figure 1). In the first three steps, phenylalanine ammonia lyase (PAL), cinnamate 4-hydroxylase (C4H), and p-coumaroyl coenzyme A ligase (4CL) catalyze the conversion of phenylalanine into p-coumaroyl CoA; this is termed the general phenylpropanoid pathway (GPP) [25]. Ferulic acid is formed from p-coumaric acid via the activity of 4-hydroxycinnamate 3-hydroxylase (CH3) and caffeic acid 3-o-methyltransferase (COMT). In the next three steps, dihydrokaempferol is formed from p-coumaroyl CoA via chalcone synthase (CHS), chalcone isomerase (CHI), and flavone 3-hydroxylase (F3H). Subsequently, flavonoid 3′-hydroxylase (F3′H) catalyzes the production of dihydroquercetin and splits it into two branches. Flavonol synthase (FLS) converts dihydroquercetin to quercetin. Dihydroflavonol-4 reductase (DFR) catalyzes the transformation of dihydroquercetin into leucocyanidin, and then into epicatechin.
In this study, we analyzed the expression of genes involved in phenylpropanoid biosynthesis pathways. We then examined the accumulation of the products encoded by these genes in wheat sprouts treated with white, blue, and red light. This study provides insights into phenylpropanoid production in wheat sprouts under controlled environmental conditions.

2. Materials and Methods

2.1. Plant Materials

Wheat seeds were purchased from Asia Seed Co., Ltd. (Seoul, Korea) One hundred wheat seeds were placed into separate pots (size: 11 cm × 11 cm). The pots were placed in a growth chamber maintained at a 16-h light/8-h dark cycle and temperature of 25 °C and irradiated with 380 nm (white light), 470 nm (blue light), or 660 nm (red light). Wheat spouts were harvested at 4, 8, or 12 days of growth, and then shoot length, root length, and fresh weight were measured. These harvested samples were powdered using liquid nitrogen for quantitative real-time PCR (qRT-PCR), which was used to examine the expression levels of genes involved in phenylpropanoid and flavonoid biosynthesis. The harvested samples were also freeze-dried at −80 °C for 72 h for high performance liquid chromatography (HPLC) analysis used to assess the content of phenolic compounds. All samples were prepared in triplicate.

2.2. Total RNA Isolation and cDNA Synthesis

Each sample of wheat sprout was finely ground in liquid nitrogen. Total RNA was isolated using the Easy BLUE Total RNA Kit (iNtRON, Seongnam, Korea). An agarose gel (1.2%) and NanoVue plus (GE Healthcare Life Sciences, Marlborough, MA, USA) were used to determine the quality of RNA in each sample. Then, 1 ng of total RNA per sample was used to synthesize cDNA using a ReverTra Ace kit (Toyobo Co., Ltd., Osaka, Japan).

2.3. Quantitative Real-Time PCR Analysis

Primers were designed using the Primer3 website (http://bioinfo.ut.ee/primer3-0.4.0/primer3/) [26] based on the sequence of genes involved in the wheat phenylpropanoid pathway (Table 1). Each qRT-PCR reaction mixture (20 µL) contained 5 µL cDNA diluted 20-fold, 10 µL 2× SYBR Green buffer, 3 µL DNase-free water, and 2 µL primers (10 ppM). All qRT-PCR reactions were performed thrice using a Bio-Rad CFX machine and Bio-Rad CFX Manager software (version 2.0, Bio-Rad Laboratories, Inc., Hercules, CA, USA). PCR reactions were performed under the following thermal cycling conditions: 95 °C (5 min), 38 cycles of 95 °C (20 s), 56 °C (20 s), 72 °C (20 s), and 72 °C (8 min). The expression of actin (TaActin, accession number: GQ339780) was used as a reference to quantify the expression of genes involved in phenylpropanoid biosynthesis in wheat sprouts.

2.4. Analysis of Phenylpropanoid Content by HPLC

Samples of wheat sprouts were extracted and subjected to HPLC analysis of soluble phenolic compounds using the method by Cuong et al., (2018) with slight modifications [27]. Prior to HPLC analysis, samples of wheat sprouting were freeze-dried at −80 °C for at least 48 h, and then ground into a fine powder using mortar and pestle. For extraction of phenolic compounds, 80% aqueous MeOH (3 mL) was added to 100 mg of each powdered sample. Each mixture was vortexed for 1 min and vigorously sonicated at 35 °C for 60 min. After centrifugation at 10,000 g for 15 min, the supernatants were filtered through 0.45-µm filters for HPLC analysis. The conditions and gradient program for HPLC, used in this study, have previously been described by Cuong et al., (2018) [27]. HPLC analysis was performed with a C18 column (250 mm × 4.6 mm, 5 µm; RStech; Daejeon, Korea). The mobile phase consisted of methanol and water:acetic acid (98.5:1.5 v/v), and the column was maintained at 29 °C. The flow rate was maintained at 1.0 mL/min−1, the injection volume was 20 µL, and the detection wavelength was 280 nm. Spiking tests and comparison of retention time were performed for peak identification. Corresponding calibration curves were used to quantify the contents of phenolic compounds.

2.5. Statistical Analysis

All the results in this study are expressed as the mean ± SD of three independent replicates. The data were analyzed using the computer software Statistical Analysis System (SAS version 9.2, SAS Institute Inc., Cary, NC, USA, 2009). Treatment mean comparisons were performed with the least significant difference (LSD).

3. Results and Discussion

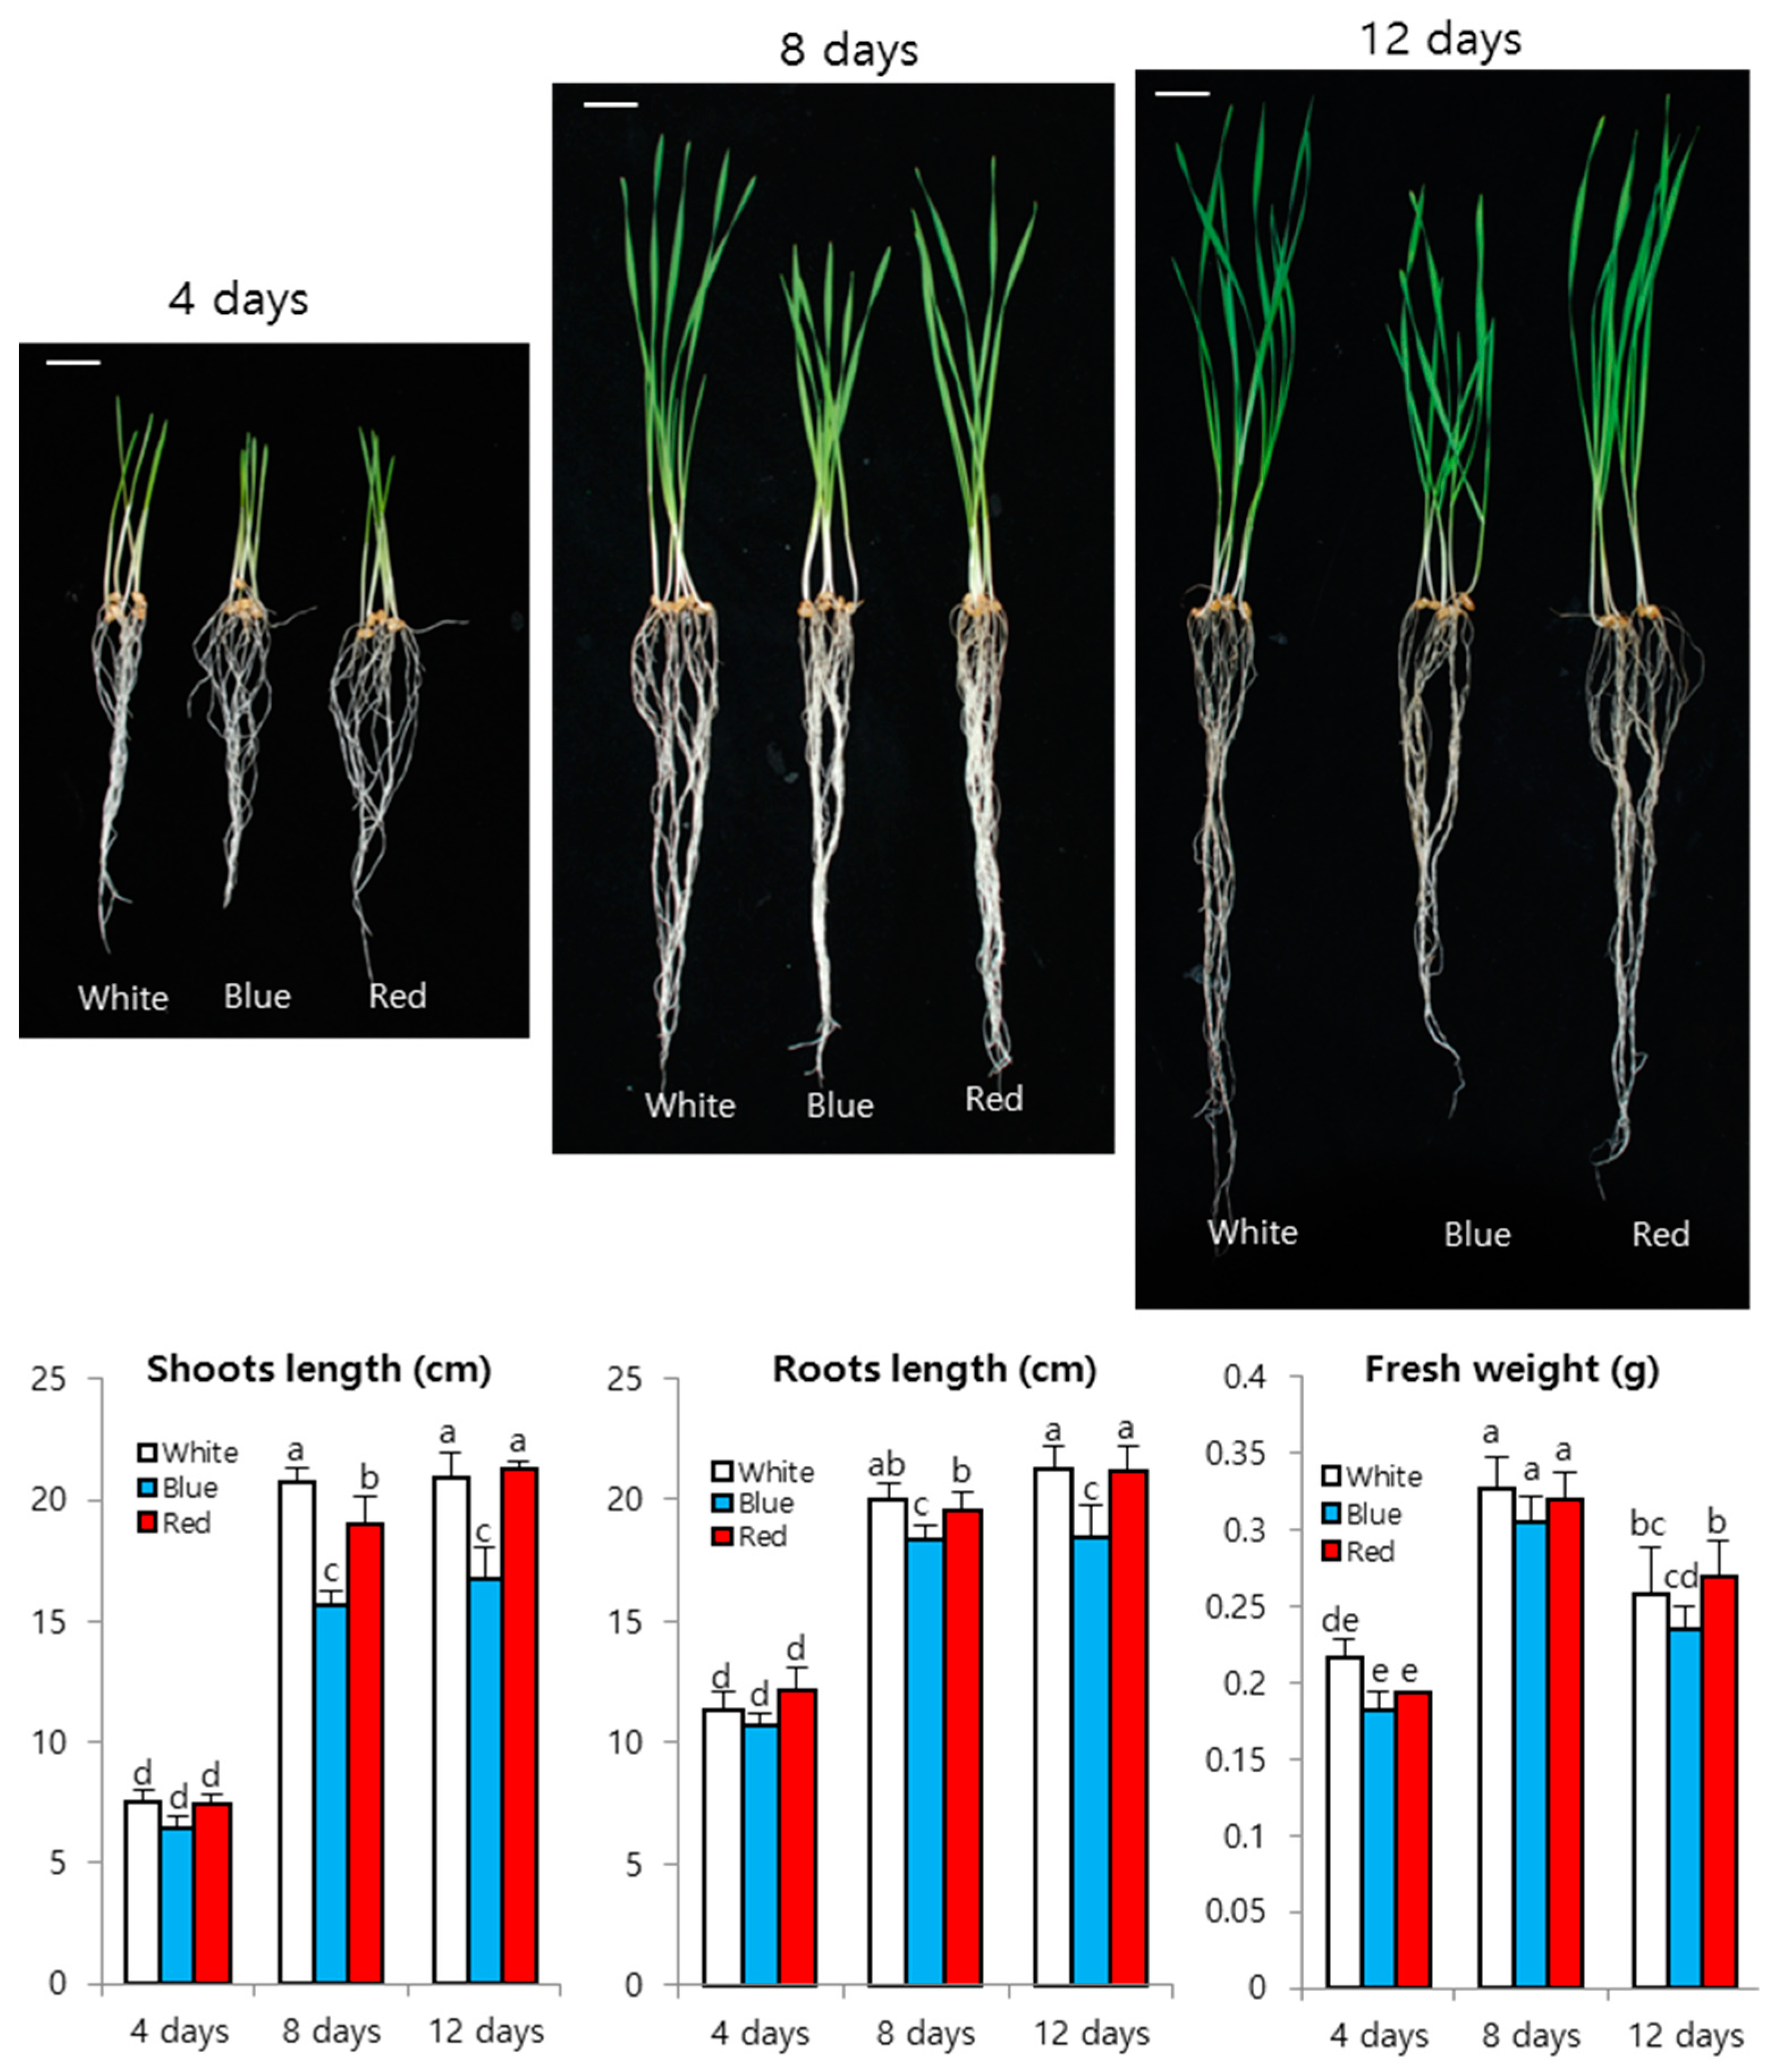
3.1. Wheat Sprout Growth under LED Light

Shoot length, root length, and fresh weight of wheat sprouts were measured at 4 to 12 days after sowing (DAS) (Figure 2). The three groups of wheat sprouts, grown under the three differed LED lights, showed different growth patterns. Wheat sprouts grown under blue light showed slower development than that of wheat sprouts grown under white and red light. The shoot and root length were similar between the wheat sprouts grown under white and red light (Figure 2). The length of shoots and roots increased over time under all three LED light conditions; however, after 8 days of growth, the shoot and root length did not increase insignificantly. Fresh weight decreased at 8 to 12 days of growth. These results indicate that maximal biomass for commercial purposes can be achieved in wheat sprouts grown under white or red light for approximately 8 days; however, wheat sprouts grown under blue light showed decreased development. These results agree with the findings of Jacobsen et al., [28] who found that blue light inhibits germination in dormant grain. Blue light also inhibits germination in barley [29], brachypodium [30], and ryegrass [31].

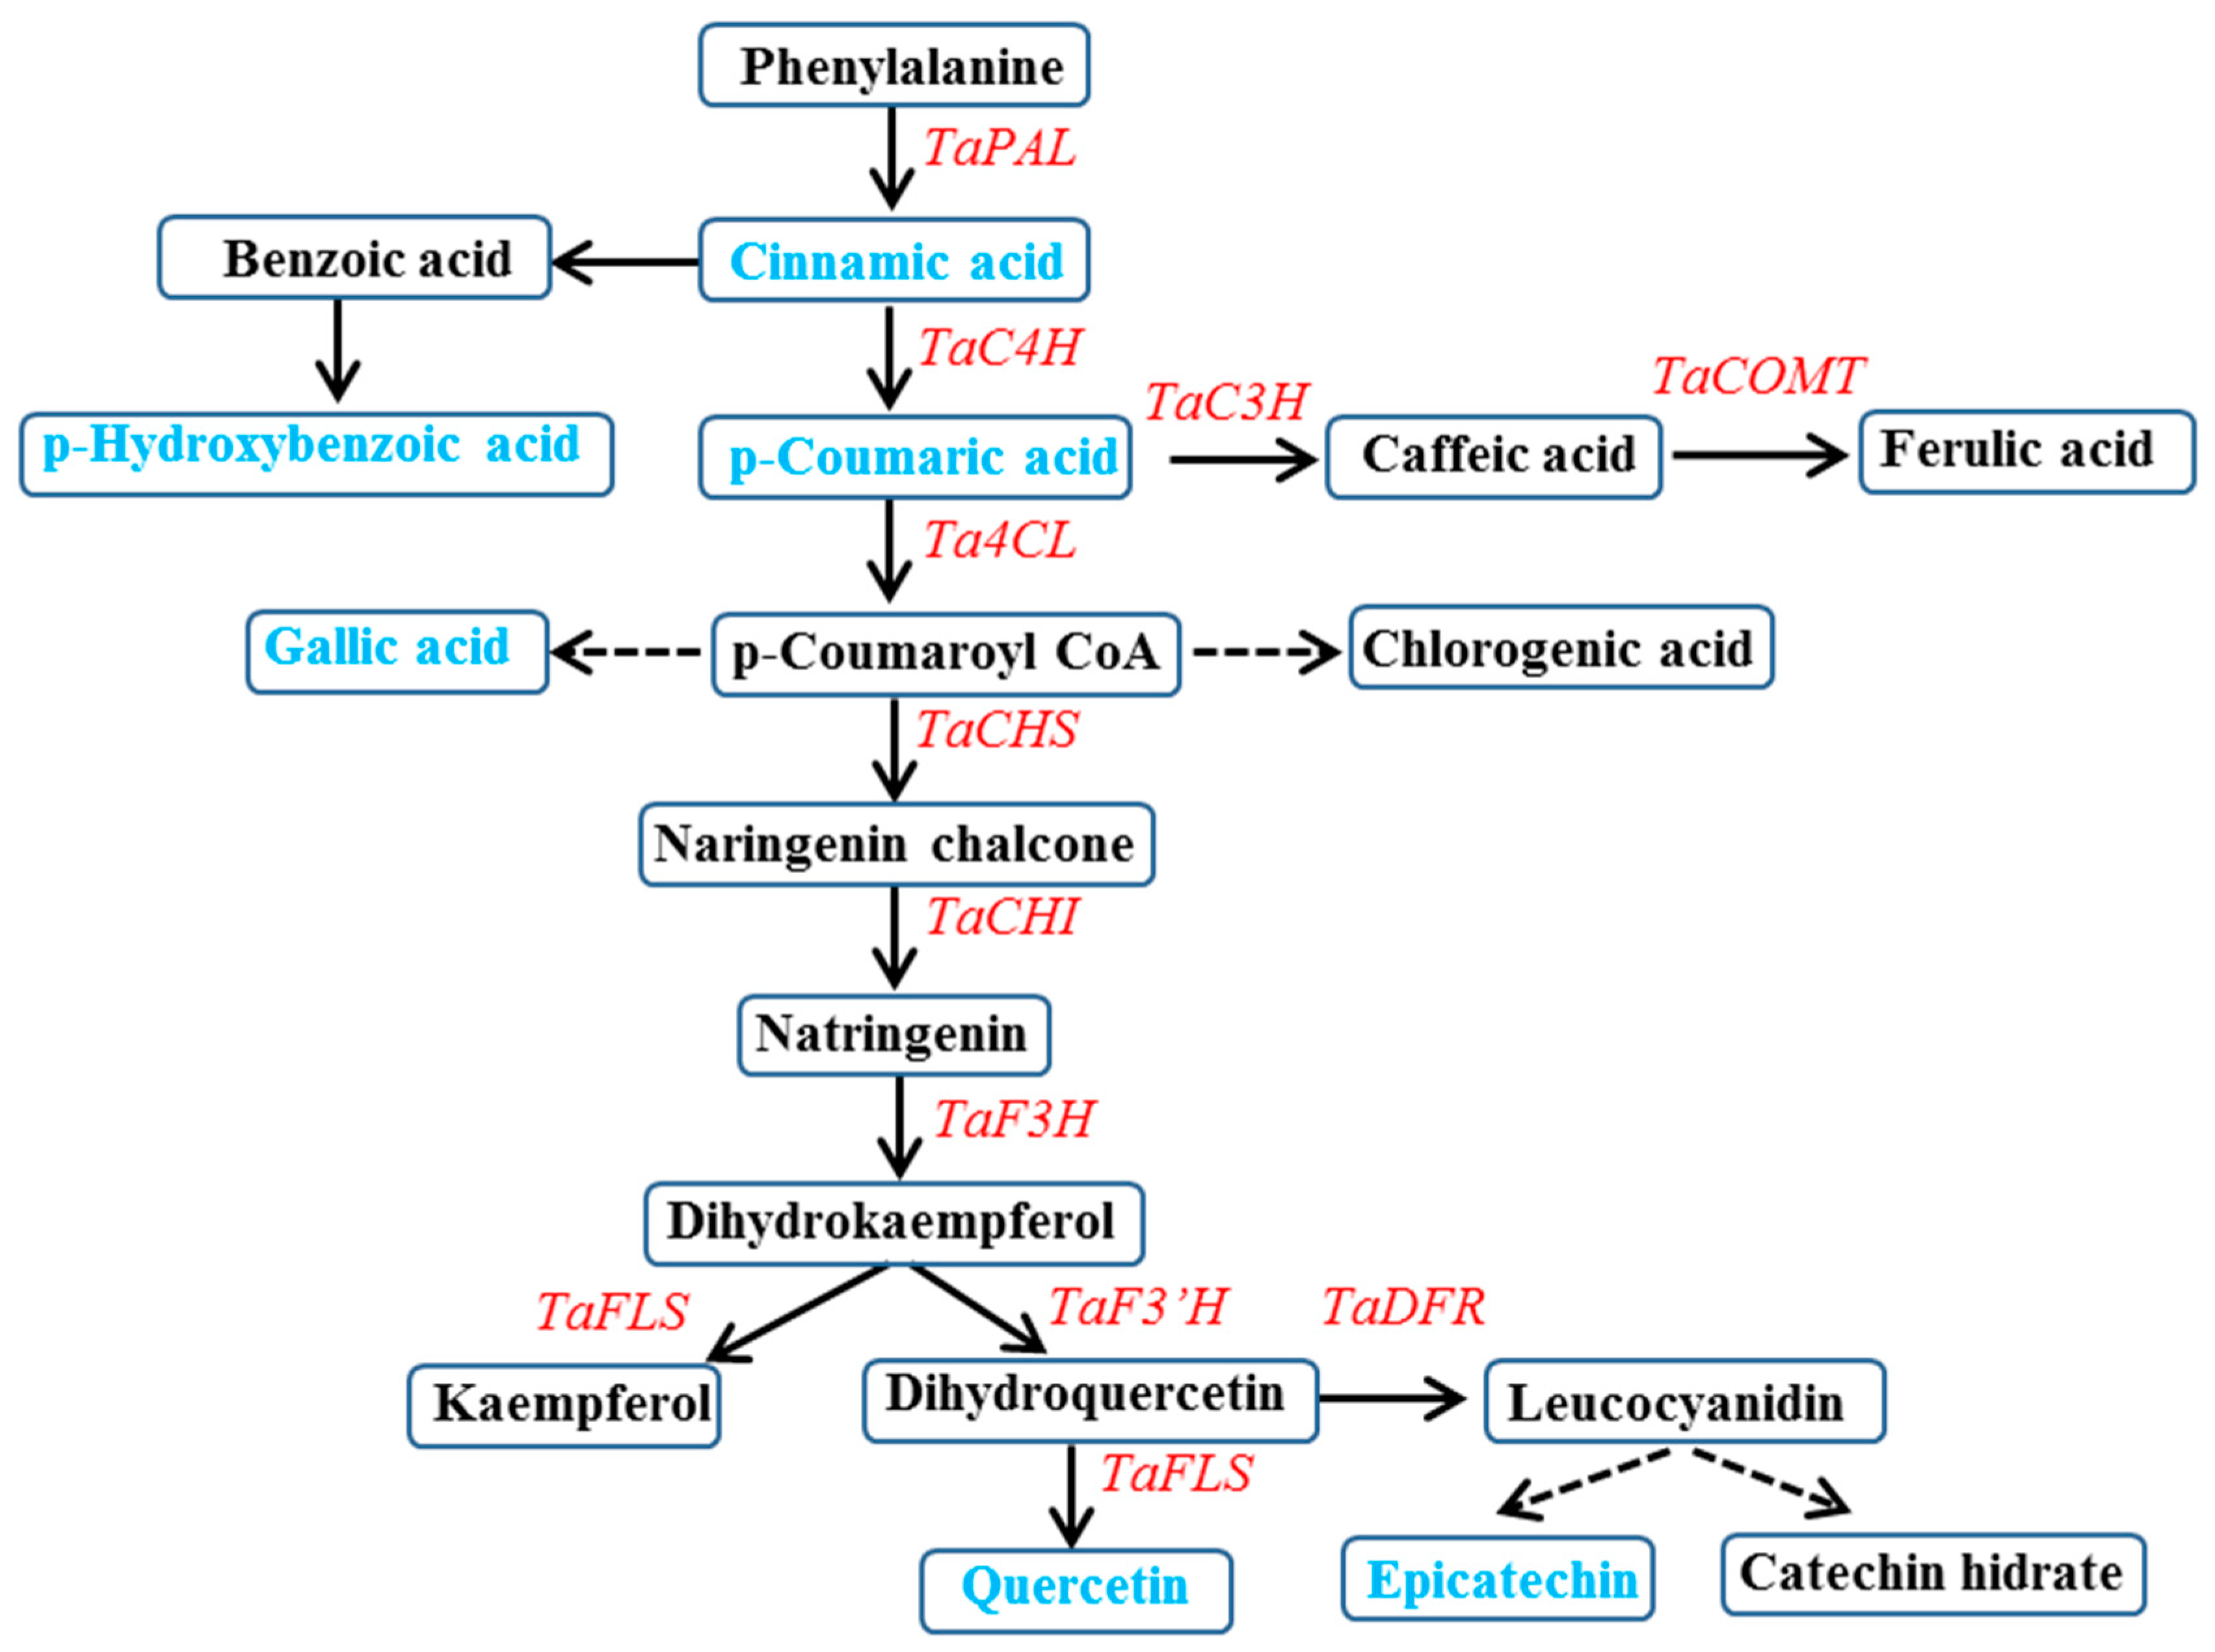
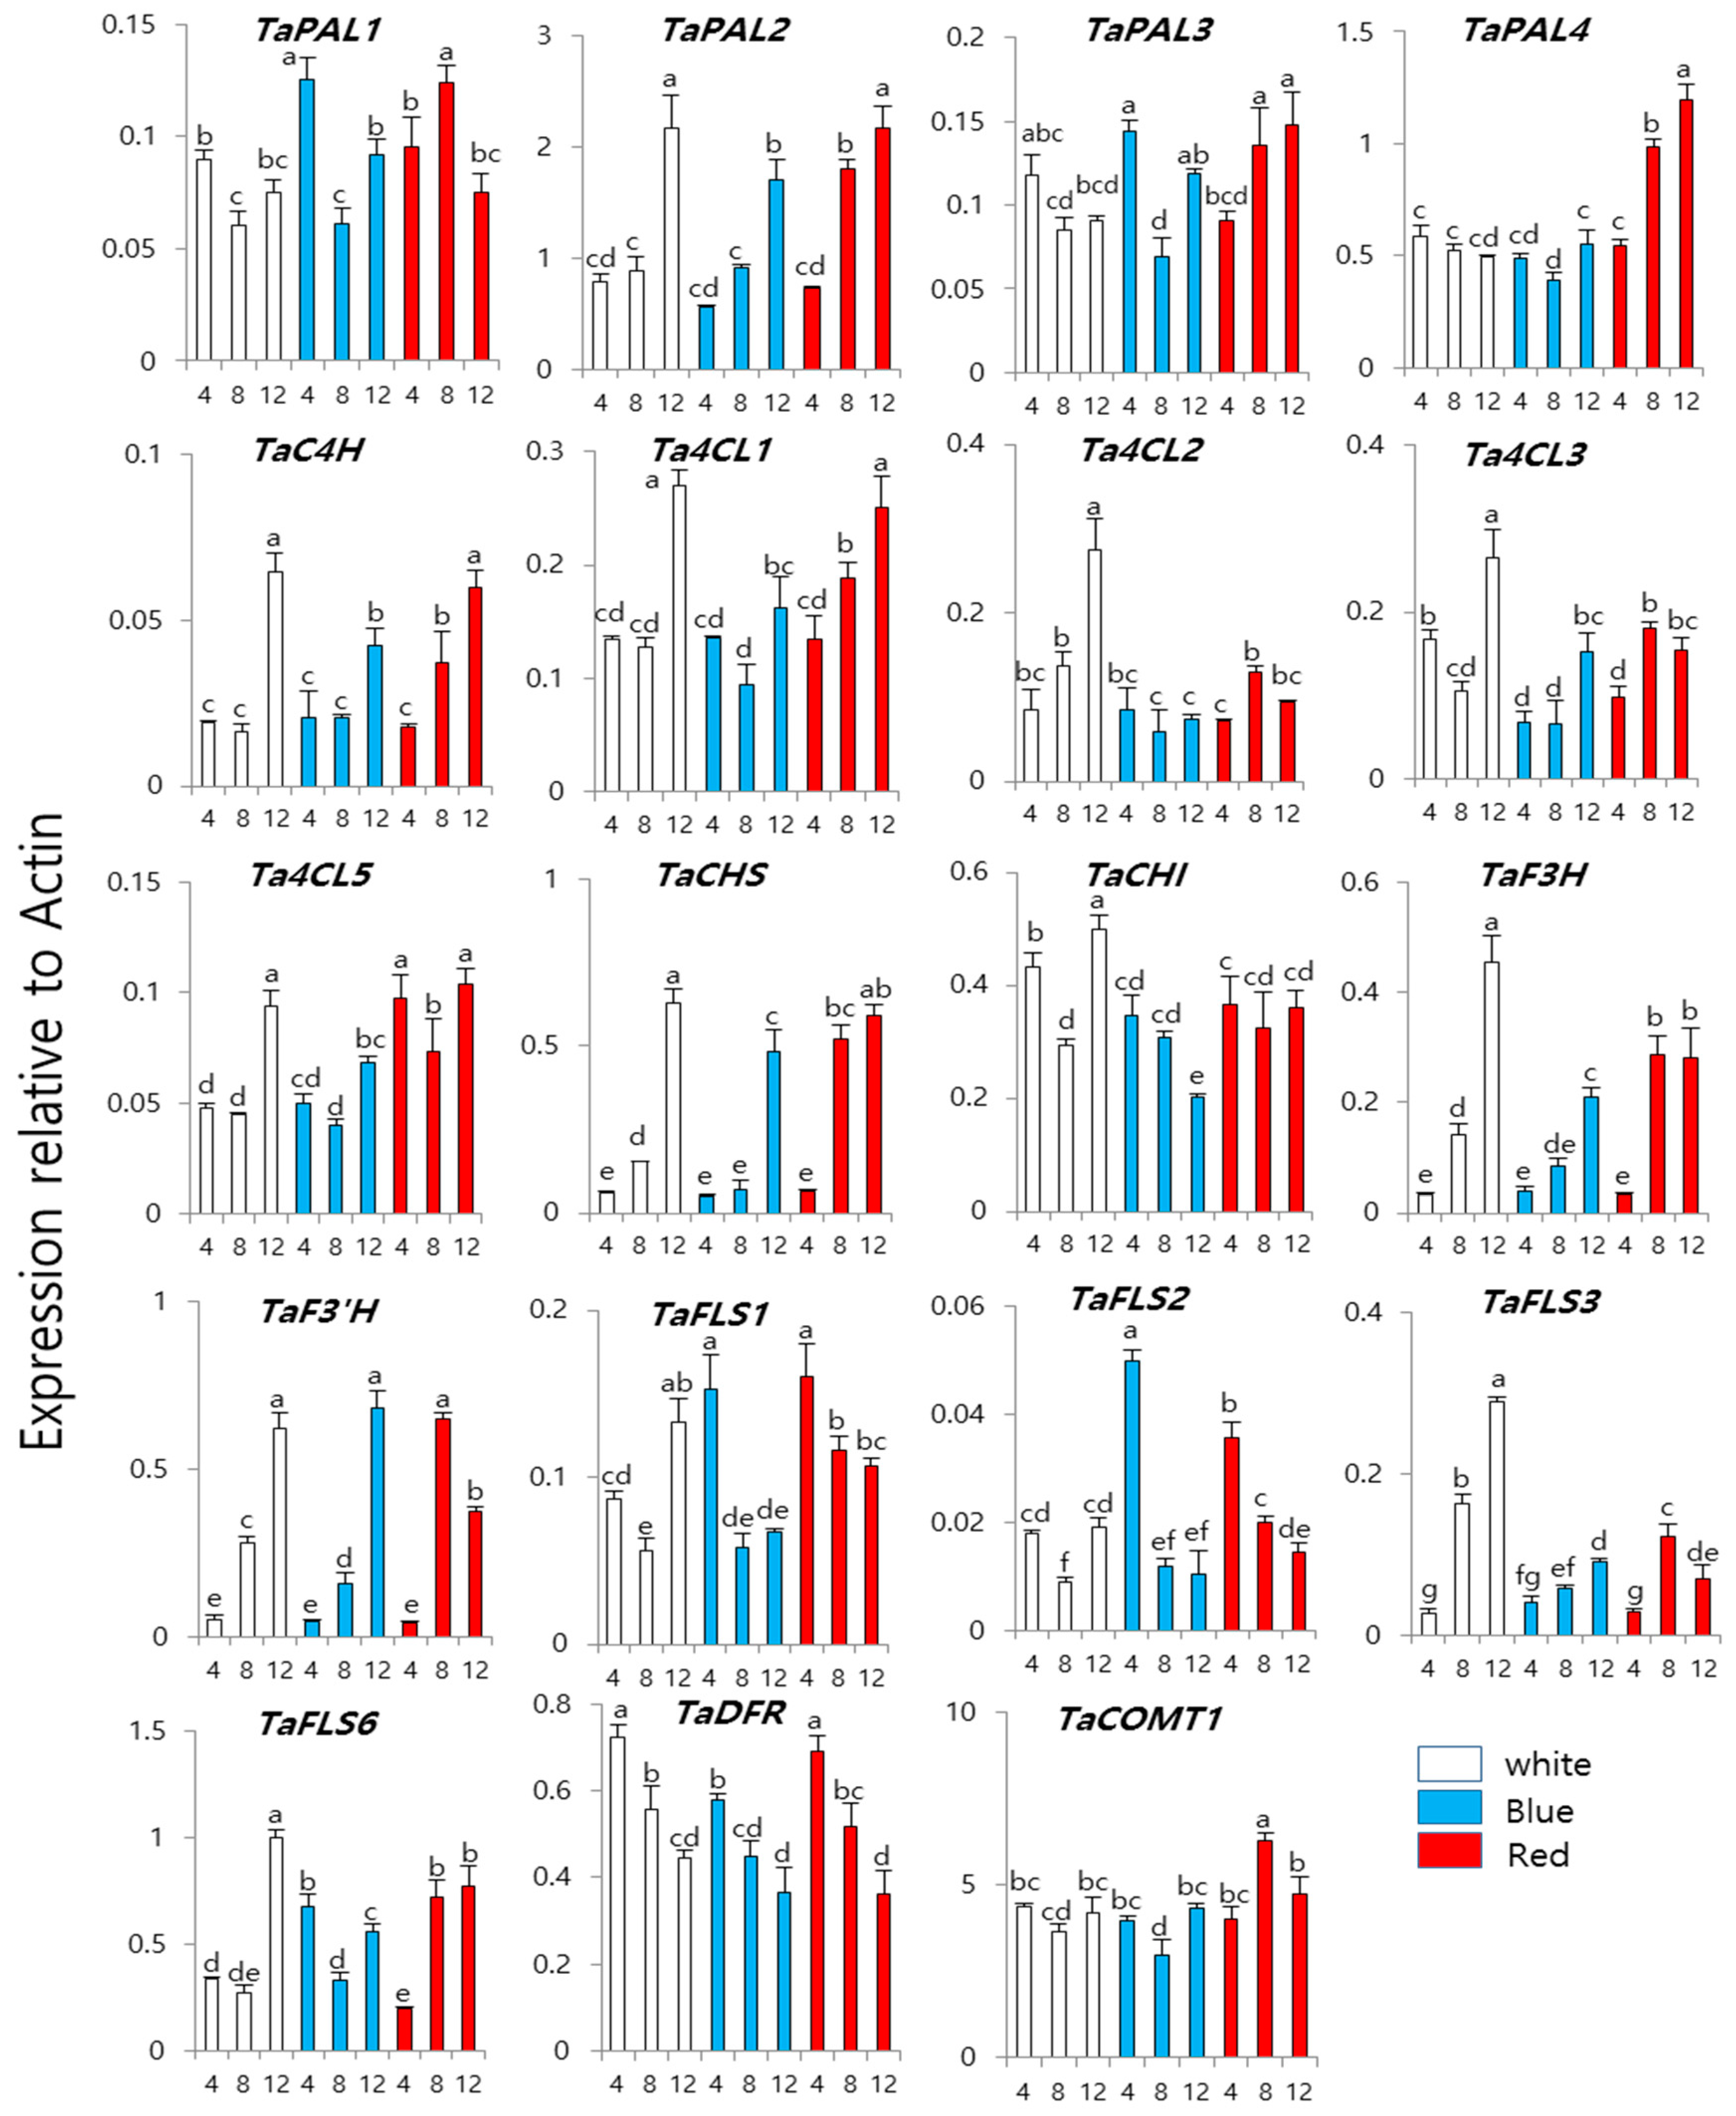
3.2. Expression of Phenylpropanoid Biosynthesis Genes in Wheat Sprouts Grown under White, Blue, or Red Light

Using quantitative RT-PCR analysis, we investigated the transcriptional levels of genes involved in phenylpropanoid biosynthesis in wheat sprouts at 4, 8, or 12 days after germination under white, red, or blue light (Figure 3). The expression of TaPAL1 at day 4 and day 12 under blue light was higher under white and red light treatment. However, expression of TaPAL1 was highest at day 8 under white light treatment. The transcription of TaPAL2 was highest under red light illumination, higher by 2.02-, 1.97-fold than white and blue illumination, respectively. TaPAL3 expression level under blue light was higher than white and red at day 4. The expression of TaPAL3 and TaPAL4 under red illumination at day 8 and day 12 were significantly higher than white and blue illumination. At 8 days illumination, the expression of TaC4H, Ta4CL1, TaCHS, TaF3H, TaF3′H, TaFLS6, and TaCOMT1 were highest under red light. Ta4CL2 and Ta4CL3 expression were highest at day 12 under white illumination, higher by 3.7-, 1.74-fold and 2.93-, 1.72-fold than blue and red illumination, respectively. Ta4CL5 expression level under red illumination was higher than white and blue at all experiment time. The expression of TaFLS1 under blue illumination at day 12 was lower than white and red illumination. TaFLS2 expression level was highest at day 4 under blue illumination, higher by 2.8-, 1.4-time than white and red, respectively. The expression of TaFLS3 at day 8 and day 12 under white illumination were significantly higher than blue and red. Under blue illumination, TaDFR expression level was lower than white and red illumination. Under white light, the transcription of TaPAL1, TaPAL3, Ta4CL1, Ta4CL3, Ta4CL5, TaCHI, TaFLS1, TaFLS2, and TaFLS6 decreased at 8 DAS and then increased at 12 DAS. The expression of TaPAL2, TaC4H, Ta4CL1, Ta4CL2, TaCHS, TaF3H, TaF3’H, and TaFLS3 steadily increased at 4 to 12 DAS, while expression of TaPAL4 and TaDFR gradually decreased at 4 to 12 DAS under the same lighting conditions. Under blue light illumination, the expression of TaPAL2, TaC4H, Ta4CL3, TaCHS, TaF3H, TaF3′H, and TaFLS3 was increased, while that of TaCHI, TaFLS2, and TaDFR was gradually decreased at 4 to 12 DAS. The expression of TaPAL1, TaPAL3, TaPAL4, Ta4CL1, Ta4CL5, TaFLS1, TaFLS6, and TaCOMT1 decreased at 8 DAS but subsequently increased at 12 DAS, under blue light illumination. Compared with levels of expression observed under white light, the expression of TaPAL2, TaC4H, Ta4CL1, Ta4CL2, Ta4CL3, Ta4CL5, TaF3H, and TaFLS3 under blue light was significantly decreased (Figure 3). The expression of almost all genes under red light was similar to that under white and blue light; however, the expression of TaPAL4, Ta4CL1, and Ta4CL5 showed greater changes under red light. The expression of TaPAL2, TaPAL4, TaC4H, Ta4CL1, TaCHS, TaF3H, and TaFLS6 was gradually increased, in contrast to TaFLS1, TaFLS2, and TaDFR, which gradually decreased at 4 to 12 DAS under red light.

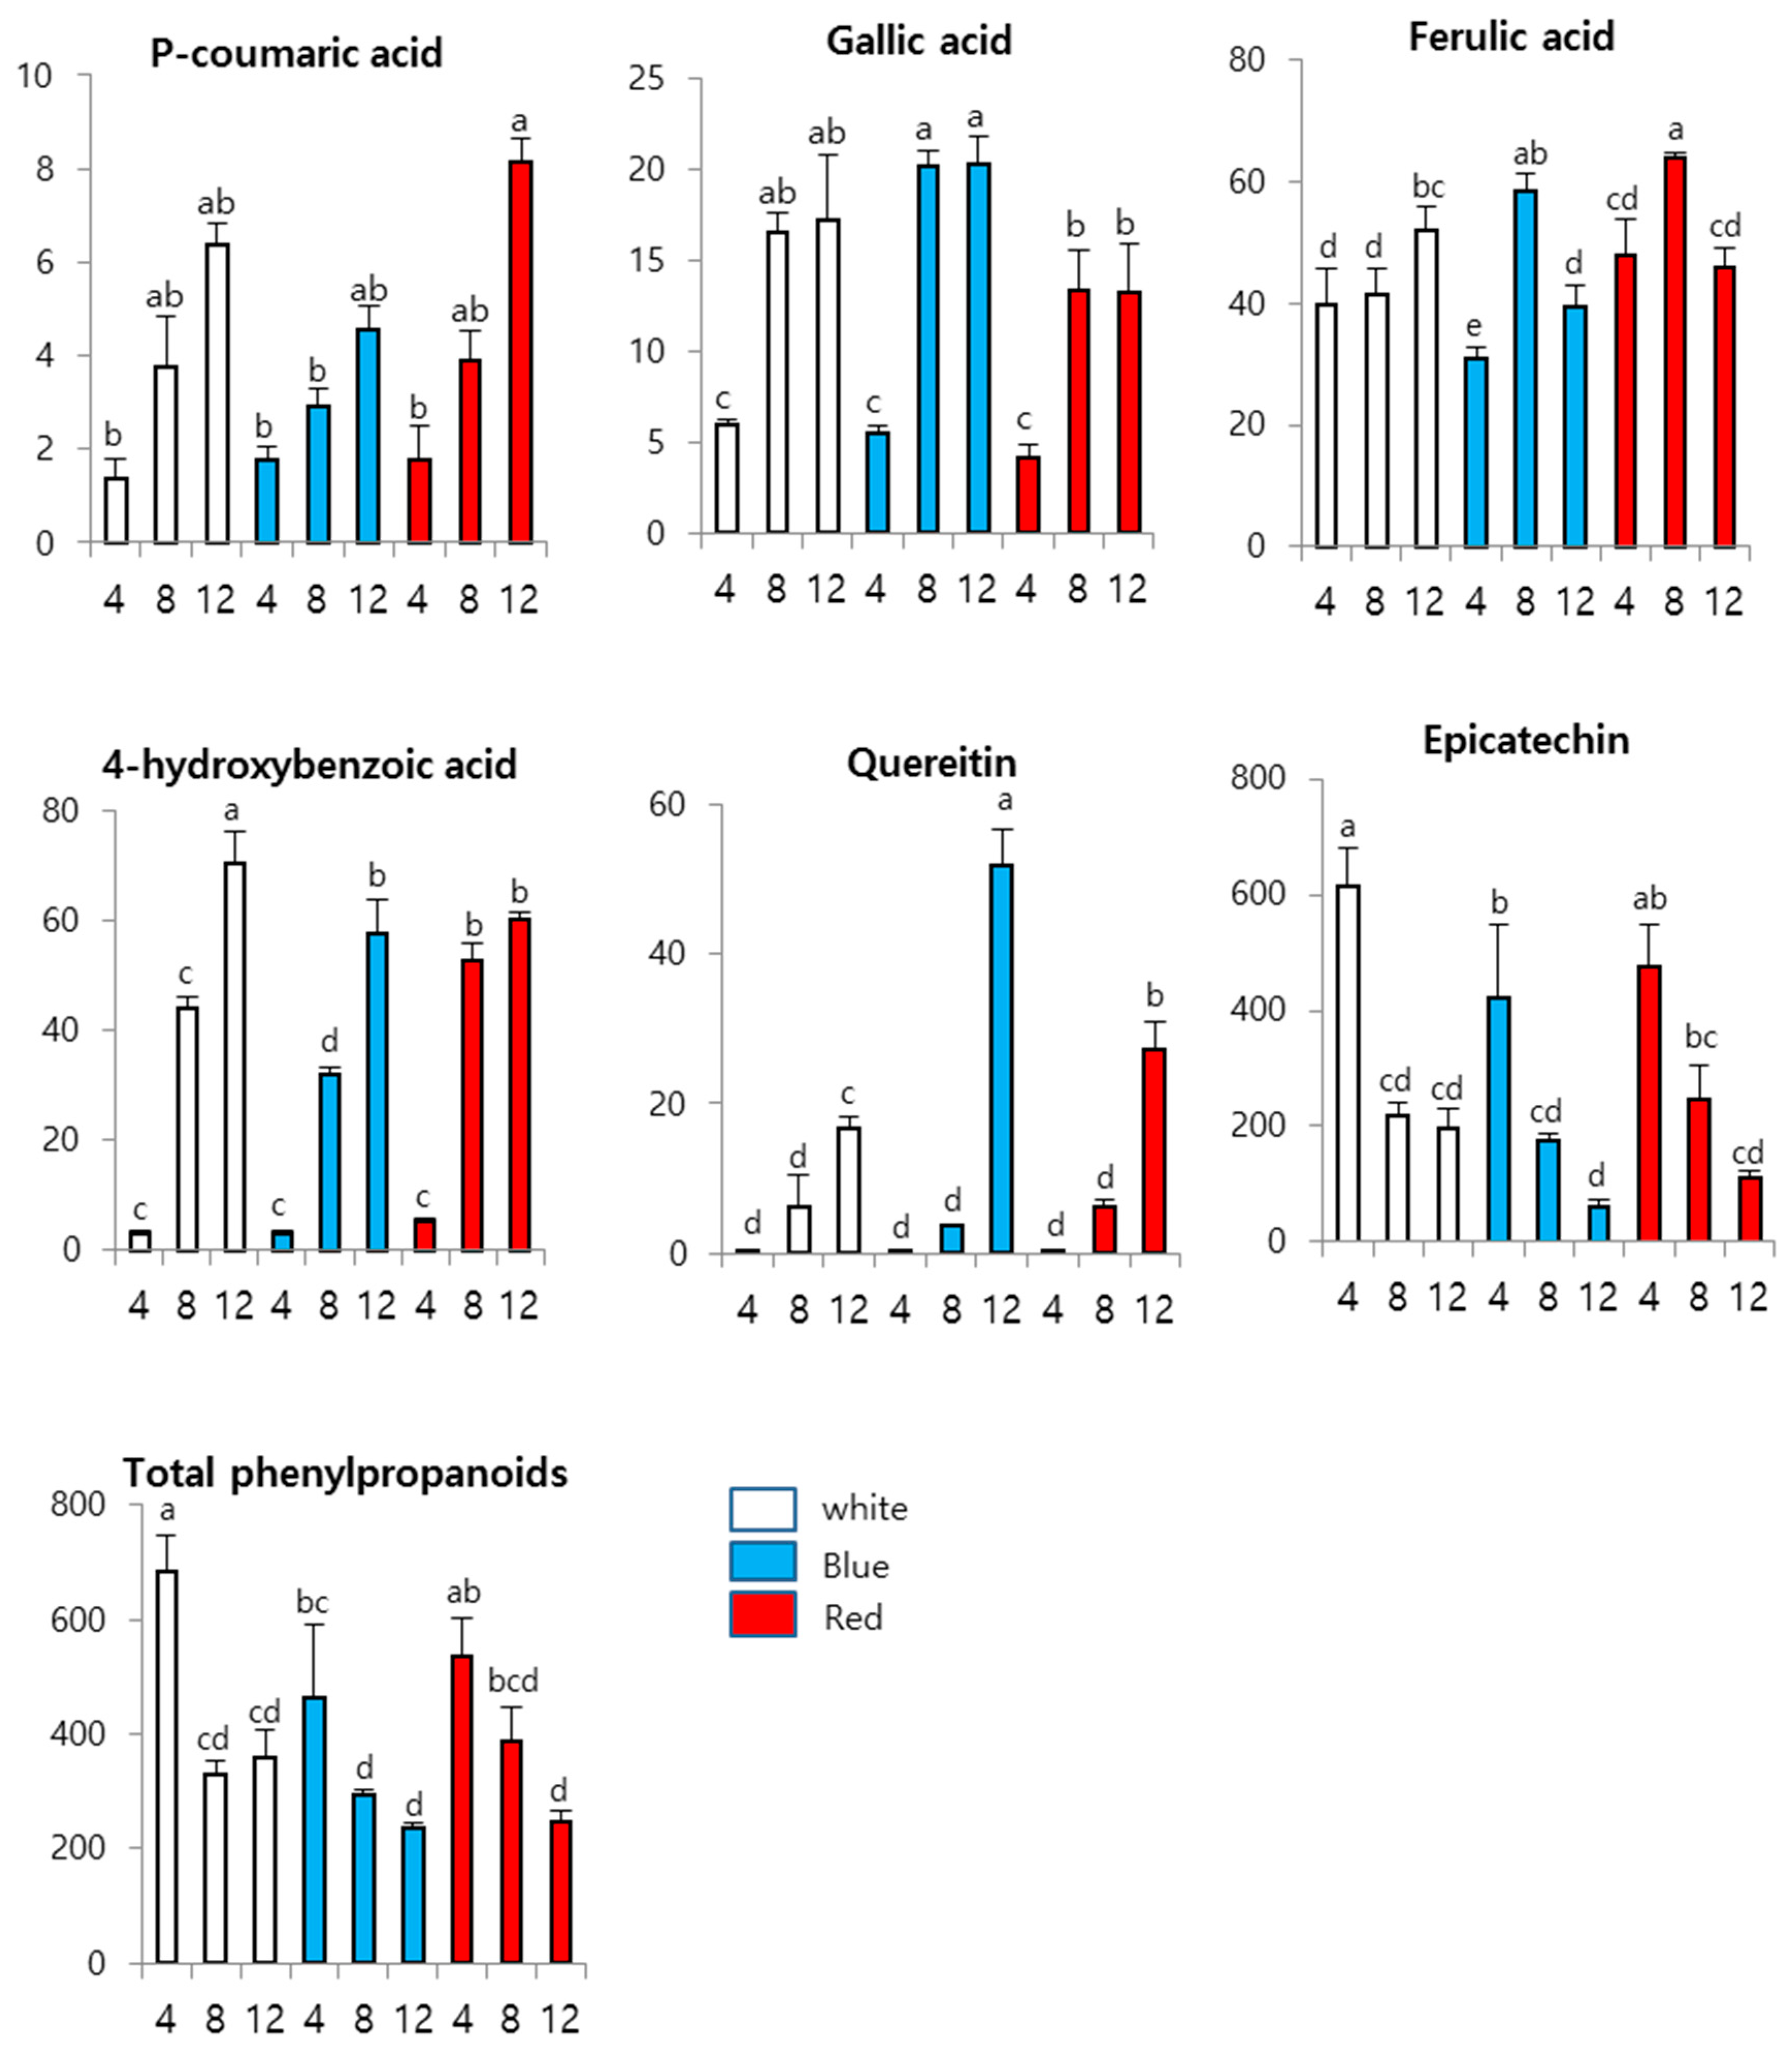
3.3. Effects of LEDs on Phenylpropanoid Content in Wheat Sprouts

After treatment with white, blue, or red light for 4, 8, or 12 days, the content of phenylpropanoids was analyzed in wheat sprouts by HPLC analysis (Figure 4). Our results indicate that different lights exerted different effects on phenylpropanoid biosynthesis. The accumulation of phenylpropanoids, except that of epicatechin, was gradually increased at 4 to 12 days of growth under all light conditions. Epicatechin, one of the main phenylpropanoids found in wheat sprouting. The highest content of epicatechin was observed at 4 days and gradually decreased at 8 to 12 days under all three LEDs lights condition. The highest content of epicatechin (616.56 µg/g dry weight) was found at 4 days of growth under white light; this was 1.46- fold and 1.3-fold higher than that observed under blue or red light, respectively. The high content of epicatechin observed under white light coincided with the expression of TaDFR, which decreased at 4 to 12 days of growth.
In this study, six soluble phenolic compounds (gallic acid, p-coumaric acid, ferulic acid, 4-hydroxybenzoic acid, quercetin, and epicatachin) were detected in wheat sprouts exposed to different types of LEDs. Our results agree with those of previous studies reporting the presence of 4-hydroxybenzoic acid [32], ferulic acid [32], p-coumaric acid [32], gallic acid [33], and epicatechin [33] in wheat sprouts. Under all the light conditions used in this study, the contents of gallic acid, 4-hydroxybenzoic acid, p-coumaric acid, and quercetin were gradually increased and reached a maximum at 12 days; this coincided with the expression of TaPAL2, TaC4H, Ta4CL1, TaCHS, and TaF3H, which was increased at 4 to 12 days. The accumulation of ferulic acid peaked at 8 DAS, decreased under blue and red light, but gradually increased under white light. Under blue light, the accumulation of gallic acid (20.18 µg/g dry weight) at 8 days of growth was 1.2-fold and 1.5-fold higher than that observed under white and red light, respectively, and this accumulation maintains for up to 12 days. The content of quercetin in wheat sprouts was increased at 4 to 12 days under all the LED light conditions used in this study. However, under blue light, the accumulation of quercetin was the highest at 12 days (51.77 µg/g dry weight), which was 3.12-fold and 1.9-fold higher than that observed under white and red light, respectively. The effect of blue light on the accumulation of secondary compounds in plants has been examined previously. In Norway spruce, blue light enhances the accumulation of flavonoids, lignin, and phenylpropanoids [34]. Blue light also promotes the accumulation of polyphenols in lettuce [6] and that of phenolic compounds in Chinese cabbage [13]. In this study, treatment with red light affected the content of p-coumaric acid in wheat sprouts. The accumulation of p-coumaric acid was the highest (8.11 µg/g dry weight) at 12 days of growth under red light, which was 1.27-fold and 1.77-fold higher than that observed under white and blue light, respectively. This coincided with the expression of TaPAL3 and TaPAL4, which was highest under red light. Red light also has been reported to enhance the accumulation of charantin in bitter melon [12], aliphatic glucosinolates in kale [2], and β-cryptoxanthin in citrus fruit [35]. Exposing pea seedlings to red light is an effective method for inducing accumulation of β-carotene [11].

4. Conclusions

In summary, our results indicate that illumination with white light was optimal for inducing the accumulation of 4-hydroxybenzoic acid and epicatechin in wheat sprouts. Compared with the effects obtained using white light, blue light increased the accumulation of gallic acid and quercetin but decreased the contents of epicatechin. Red light was optimal for inducing p-coumaric acid and ferulic acid biosynthesis in wheat sprouts. Compared gene expression with phenylpropanoid content showed that TaPAL3, TaPAL4, and TaDFR maybe important gene in phenylpropanoid biosynthesis in wheat sprout. This is the first study to examine the effects of LED light on the expression of genes involved in phenylpropanoid biosynthesis and accumulation of phenylpropanoids in wheat sprouts. Further studies are needed for a more comprehensive assessment of these effects.

Author Contributions

C.K. and S.U.P. designed the experiments and analyzed the data. D.M.C., T.W.H., C.H.P., N.S.K., H.J.Y. and S.W.C. performed the experiments and analyzed the data. D.M.C. and S.U.P. wrote the manuscript. All authors read and approved the final manuscript.

Funding

This work is supported by the “Cooperative Research Program for Agriculture Science and Technology Development (Project No. PJ01252701)”, Rural Development Administration, Republic of Korea.

Conflicts of Interest

The authors declare no conflict of interest.

References

  1. Shewry, P.R.; Hey, S.J. The contribution of wheat to human diet and health. Food Energy Secur. 2015, 4, 178–202. [Google Scholar] [CrossRef] [PubMed]
  2. Carvalho, S.D.; Folta, K.M. Sequential light programs shape kale (Brassica napus) sprout appearance and alter metabolic and nutrient content. Hortic. Res. Engl. 2014, 1, 8. [Google Scholar] [CrossRef] [PubMed]
  3. Kopsell, D.A.; Sams, C.E. Increases in shoot tissue pigments, glucosinolates, and mineral elements in sprouting broccoli after exposure to short-duration blue light from light emitting diodes. J. Am. Soc. Hortic. Sci. 2013, 138, 31–37. [Google Scholar] [CrossRef]
  4. Massa, G.D.; Kim, H.H.; Wheeler, R.M.; Mitchell, C.A. Plant productivity in response to led lighting. Hortscience 2008, 43, 1951–1956. [Google Scholar] [CrossRef]
  5. Morrow, R.C. Led lighting in horticulture. Hortscience 2008, 43, 1947–1950. [Google Scholar] [CrossRef]
  6. Johkan, M.; Shoji, K.; Goto, F.; Hashida, S.; Yoshihara, T. Blue light-emitting diode light irradiation of seedlings improves seedling quality and growth after transplanting in red leaf lettuce. Hortscience 2010, 45, 1809–1814. [Google Scholar] [CrossRef]
  7. Son, K.H.; Oh, M.M. Leaf shape, growth, and antioxidant phenolic compounds of two lettuce cultivars grown under various combinations of blue and red light-emitting diodes. Hortscience 2013, 48, 988–995. [Google Scholar] [CrossRef]
  8. Hossen, M.Z. Light emitting diodes increase phenolics of buckwheat (Fagopyrum esculentum) sprouts. J. Plant Interact. 2007, 2, 71–78. [Google Scholar] [CrossRef]
  9. Thwe, A.A.; Kim, Y.B.; Li, X.; Seo, J.M.; Kim, S.J.; Suzuki, T.; Chung, S.O.; Park, S.U. Effects of light-emitting diodes on expression of phenylpropanoid biosynthetic genes and accumulation of phenylpropanoids in fagopyrum tataricum sprouts. J. Agric. Food Chem. 2014, 62, 4839–4845. [Google Scholar] [CrossRef] [PubMed]
  10. Fraszczak, B.; Golcz, A.; Zawirska-Wojtasiak, R.; Janowska, B. Growth rate of sweet basil and lemon balm plants grown under fluorescent lamps and led modules. Acta Sci. Pol.-Hortoru. 2014, 13, 3–13. [Google Scholar]
  11. Wu, M.C.; Hou, C.Y.; Jiang, C.M.; Wang, Y.T.; Wang, C.Y.; Chen, H.H.; Chang, H.M. A novel approach of led light radiation improves the antioxidant activity of pea seedlings. Food Chem. 2007, 101, 1753–1758. [Google Scholar] [CrossRef]
  12. Cuong, D.M.; Jeon, J.; Morgan, A.M.A.; Kim, C.; Kim, J.K.; Lee, S.Y.; Park, S.U. Accumulation of charantin and expression of triterpenoid biosynthesis genes in bitter melon (Momordica charantia). J. Agric. Food Chem. 2017, 65, 7240–7249. [Google Scholar] [CrossRef] [PubMed]
  13. Kim, Y.J.; Kim, Y.B.; Li, X.; Choi, S.R.; Park, S.; Park, J.S.; Lim, Y.P.; Park, S.U. Accumulation of phenylpropanoids by white, blue, and red light irradiation and their organ-specific distribution in chinese cabbage (Brassica rapa ssp. Pekinensis). J. Agric. Food Chem. 2015, 63, 6772–6778. [Google Scholar] [CrossRef]
  14. Li, H.M.; Tang, C.M.; Xu, Z.G. The effects of different light qualities on rapeseed (Brassica napus L.) plantlet growth and morphogenesis in vitro. Sci. Hortic.-Amst. 2013, 150, 117–124. [Google Scholar] [CrossRef]
  15. Vogt, T. Phenylpropanoid biosynthesis. Mol. Plant 2010, 3, 2–20. [Google Scholar] [CrossRef] [PubMed]
  16. Shahidi, F.; Ambigaipalan, P. Phenolics and polyphenolics in foods, beverages and spices: Antioxidant activity and health effects—A review. J. Funct. Foods 2015, 18, 820–897. [Google Scholar] [CrossRef]
  17. Ignat, I.; Volf, I.; Popa, V.I. A critical review of methods for characterisation of polyphenolic compounds in fruits and vegetables. Food Chem. 2011, 126, 1821–1835. [Google Scholar] [CrossRef]
  18. Cevallos-Casals, B.A.; Cisneros-Zevallos, L. Impact of germination on phenolic content and antioxidant activity of 13 edible seed species. Food Chem. 2010, 119, 1485–1490. [Google Scholar] [CrossRef]
  19. Panda, P.; Appalashetti, M.; Judeh, Z.M.A. Phenylpropanoid sucrose esters: Plant-derived natural products as potential leads for new therapeutics. Curr. Med. Chem. 2011, 18, 3234–3251. [Google Scholar] [CrossRef] [PubMed]
  20. Korkina, L.; Kostyuk, V.; De Luca, C.; Pastore, S. Plant phenylpropanoids as emerging anti-inflammatory agents. Mini-Rev. Med. Chem. 2011, 11, 823–835. [Google Scholar] [CrossRef] [PubMed]
  21. Yang, C.S.; Landau, J.M.; Huang, M.T.; Newmark, H.L. Inhibition of carcinogenesis by dietary polyphenolic compounds. Annu. Rev. Nutr. 2001, 21, 381–406. [Google Scholar] [CrossRef] [PubMed]
  22. Yao, L.H.; Jiang, Y.M.; Shi, J.; Tomas-Barberan, F.A.; Datta, N.; Singanusong, R.; Chen, S.S. Flavonoids in food and their health benefits. Plant. Food Hum. Nutr. 2004, 59, 113–122. [Google Scholar] [CrossRef]
  23. Eudes, A.; Liang, Y.; Mitra, P.; Loque, D. Lignin bioengineering. Curr. Opin. Biotechnol. 2014, 26, 189–198. [Google Scholar] [CrossRef] [PubMed] [Green Version]
  24. Naoumkina, M.A.; Zhao, Q.; Gallego-Giraldo, L.; Dai, X.; Zhao, P.X.; Dixon, R.A. Genome-wide analysis of phenylpropanoid defence pathways. Mol. Plant. Pathol. 2010, 11, 829–846. [Google Scholar] [CrossRef] [PubMed]
  25. Liu, J.Y.; Osbourn, A.; Ma, P.D. Myb transcription factors as regulators of phenylpropanoid metabolism in plants. Mol. Plant. 2015, 8, 689–708. [Google Scholar] [CrossRef] [PubMed]
  26. Untergasser, A.; Cutcutache, I.; Koressaar, T.; Ye, J.; Faircloth, B.C.; Remm, M.; Rozen, S.G. Primer3—New capabilities and interfaces. Nucleic Acids Res. 2012, 40, e115. [Google Scholar] [CrossRef] [PubMed]
  27. Cuong, D.M.; Kwon, S.J.; Jeon, J.; Park, Y.J.; Park, J.S.; Park, S.U. Identification and characterization of phenylpropanoid biosynthetic genes and their accumulation in bitter melon (Momordica charantia). Molecules 2018, 23, 469. [Google Scholar] [CrossRef]
  28. Jacobsen, J.V.; Barrero, J.M.; Hughes, T.; Julkowska, M.; Taylor, J.M.; Xu, Q.; Gubler, F. Roles for blue light, jasmonate and nitric oxide in the regulation of dormancy and germination in wheat grain (Triticum aestivum L.). Planta 2013, 238, 121–138. [Google Scholar] [CrossRef]
  29. Gubler, F.; Hughes, T.; Waterhouse, P.; Jacobsen, J. Regulation of dormancy in barley by blue light and after-ripening: Effects on abscisic acid and gibberellin metabolism. Plant. Physiol. 2008, 147, 886–896. [Google Scholar] [CrossRef]
  30. Barrero, J.M.; Jacobsen, J.V.; Talbot, M.J.; White, R.G.; Swain, S.M.; Garvin, D.F.; Gubler, F. Grain dormancy and light quality effects on germination in the model grass Brachypodium distachyon. New Phytol. 2012, 193, 376–386. [Google Scholar] [CrossRef]
  31. Goggin, D.E.; Steadman, K.J.; Powles, S.B. Green and blue light photoreceptors are involved in maintenance of dormancy in imbibed annual ryegrass (Lolium rigidum) seeds. New Phytol. 2008, 180, 81–89. [Google Scholar] [CrossRef] [PubMed]
  32. Pham, V.H.; Hatcher, D.W.; Barker, W. Phenolic acid composition of sprouted wheats by ultra-performance liquid chromatography (uplc) and their antioxidant activities. Food Chem. 2011, 126, 1896–1901. [Google Scholar]
  33. Amici, M.; Bonfili, L.; Spina, M.; Cecarini, V.; Calzuola, I.; Marsili, V.; Angeletti, M.; Fioretti, E.; Tacconi, R.; Gianfranceschi, G.L.; et al. Wheat sprout extract induces changes on 20s proteasomes functionality. Biochimie 2008, 90, 790–801. [Google Scholar] [CrossRef] [PubMed]
  34. OuYang, F.; Mao, J.F.; Wang, J.; Zhang, S.; Li, Y. Transcriptome analysis reveals that red and blue light regulate growth and phytohormone metabolism in norway spruce [Picea abies (L.) karst]. PLoS ONE 2015, 10, e0127896. [Google Scholar] [CrossRef] [PubMed]
  35. Ma, G.; Zhang, L.C.; Kato, M.; Yamawaki, K.; Kiriiwa, Y.; Yahata, M.; Ikoma, Y.; Matsumoto, H. Effect of blue and red led light irradiation on beta-cryptoxanthin accumulation in the flavedo of citrus fruits. J. Agric. Food Chem. 2012, 60, 197–201. [Google Scholar] [CrossRef] [PubMed]
Figure 1. Proposed phenylpropanoid and flavonoid biosynthetic pathway in wheat sprouts. Blue color denotes the phenylpropanoids and flavonoids assessed in this study via HPLC analysis. Red color indicates the enzymes whose gene expression was assessed via qRT-PCR. PAL, phenylalanine ammonia-lyase; C4H, cinnamate 4-hydroxylase; C3H, 4-hydroxycinnamate 3-hydroxylase; COMT, caffeic acid 3-O-methyltransferase; 4CL, 4-coumaroyl CoA ligase; CHS, chalcone synthase; CHI, chalcone isomerase; F3H, flavanone 3-hydroxylase; F3′H, flavonoid 3′-hydroxylase; FLS, flavonol synthase; DFR, dihydroflavonol-4 reductase; 3GT, flavonoid 3-o-glucosyltransferase.
Agronomy 09 00307 g001
Figure 2. Development of wheat sprout at 4, 8, and 12 days of growth under white, blue, and red LED lights. The scale bars represent 2 cm. The means and standard deviations were obtained from three independent experiments. Letters a–e indicate significant differences (p < 0.05).
Agronomy 09 00307 g002
Figure 3. Expression levels of genes involved in phenylpropanoid biosynthesis in wheat sprouts irradiated with white, blue, or red LED light. The means and standard deviations were obtained from three independent experiments. Letters a–g indicates significant differences (p < 0.05).
Agronomy 09 00307 g003
Figure 4. Phenylpropanoid content (µg/g dry weight) in wheat sprouts irradiated with white, blue, and red LED lights. Samples were harvested after 4, 8, and 12 days of growth under illumination and used for HPLC analysis. The means and standard deviations were obtained from three independent experiments. Letters a–e indicate significant differences (p < 0.05).
Agronomy 09 00307 g004
Table 1. Primers used in this study for quantitative real-time PCR analysis.
GeneIDPrimer Sequence (5′ to 3′)
Forward PrimerReverse Primer
WpPAL1CJ628388.1GCTCTTTGAGGCCAATGTTCTTGCTTCTATCTGTCCAGGGTGGT
WpPAL2CJ707202.1CTACATGGCACTCGCAAAGAAGGTTGATCTCACGCTCGATTGAC
WpPAL3CJ805150.1TACATGAAGCAGGCAAAGAAGCTTGTCGTTGACGGAGTTGATCT
WpPAL4BQ752712.1GTGAACTCTCTGGGCCTTGTGTTCACGGAGGTCTTGATGTTCTC
WpC4HHX132432.1CAACCACCGCAACCTCATGGTGAAGATGTCGAAGACGA
Wp4CL1GH727954.1GCCGCTGTTCCACATCTAGGTCGCTCTTGGCGATCT
Wp4CL2CJ951387.1GAGGCCACAAAGAACACCATTTTGATTTCGGCGTGTGTAA
Wp4CL3CK163034.1AGTTCGCCTTCTCCTTCCTCCGTACTCCAGCACCTTGTCC
Wp4CL5GH724596.1CAAGGGCGTCATGCTCAAGCGAGTAGATGTGGAACAGC
WpCHSHX091886.1CGTGGACGAAGTGATGAAGATTAGGTGTTCGCTGTTGGTG
WpCHICD890742.1ACAAGGTGACGGAGAACTGCGAGTGGGTGAAGAGGATGGA
WpF3HCJ659795.1CTGGAGAAGGTGATGGCTGTCAGATAGTCCCGCCAGTTGT
WpF3′HHX255892.1AAGGAGAGGCGCAATAGGATGTGATGGGGAAGCTACAAGC
WpFLS1BE423889.1TGAAGGATTTGGCTACTGTGGGAGAAGACGCGGATGTCGT
WpFSL2BQ244276.1ATCCAAACTGACACGCATGAAGTTCCCGGCCAAGTACAAG
WpFLS3HX107493.1CTACGGCTTCTTCCAGATCGCAGATAGTCCCGCCAGTTGT
WpFLS6CD454732.1GTACCAGCATCCGTCCTTGAGTGGTGCTCCTCCAGAAGAT
WpDFRCJ714375.1TACGACCAGGACAACTGGAGGGGATGATGCTGATGAAGTC
WpCOMT1CJ858964.1CCATCAAGGGCATCAACTTCCAAGGCGTCGTAGCAGTTCT
WpActinGQ339780CGTGTTGGATTCTGGTGATGCGAGCTTCTCCTTGATGTCC

