Article

Genetic Diversity of Field Pennycress (Thlaspi arvense) Reveals Untapped Variability and Paths Toward Selection for Domestication

1
Department of Agronomy and Plant Genetics, University of Minnesota, St. Paul, MN 55108-6028, USA
2
Department of Plant and Microbial Biology, University of Minnesota, St. Paul, MN 55108-6028, USA
3
Department of Plant Pathology, Kansas State University, Manhattan, KS 66506-5502, USA
*
Author to whom correspondence should be addressed.
Agronomy 2019, 9(6), 302; https://doi.org/10.3390/agronomy9060302
Submission received: 7 May 2019 / Revised: 6 June 2019 / Accepted: 9 June 2019 / Published: 11 June 2019
(This article belongs to the Special Issue Crop Domestication and Evolution)

Abstract

:
Evaluation of genetic diversity within wild populations is an essential process for improvement and domestication of new crop species. This process involves evaluation of population structure and individual accessions based on genetic markers, growth habits, and geographic collection area. In this study, accessions of field pennycress were analyzed to identify population structure and variation in germplasm available for breeding. A total of 9157 genome-wide single nucleotide polymorphisms (SNPs) were identified among the 121 accessions analyzed, and linkage disequilibrium based pruning resulted in 3497 SNPs. Bayesian cluster analysis was implemented in STRUCTURE v2.3.4 to identify four population groups. These groups were confirmed based on principal components analysis and geographic origins. Pairwise diversity among accessions was evaluated and revealed considerable genetic variation. Notably, a subset of accessions from Armenia with exceptional genetic variation was identified. This survey is the first to report significant genetic diversity among pennycress accessions and explain some of the phenotypic differences previously observed in the germplasm. Understanding variation in pennycress accessions will be a crucial step for selection, breeding, and domestication of a new cash cover crop for cold climates.

1. Introduction

Thlaspi arvense L., also known as field pennycress, is a promising species for domestication as a cash cover crop that produces a biofuel feedstock [1,2,3]. As a winter annual, it can be integrated into the fallow periods of traditional cropping systems in the U.S. Midwest [4,5]. Pennycress is extremely winter hardy in natural settings (−30 °C) [6], therefore, the species is an excellent candidate for a fall planted cover crop. It provides a protective soil cover over the winter and spring, and reduces soil erosion and nutrient loss, while also suppressing spring weed growth [4,5,7]. In addition, it acts as a food source for pollinators in the early spring [8]. Pennycress is harvested in May or June in the Upper Midwest with some reported yields above 2240 kg ha−1 [3]. Following pennycress harvest, summer annuals can be planted, resulting in a double crop system that increases total seed yields while also providing ecosystem services [5,9]. Wild pennycress produces seed containing 30–35% oil with a fatty acid profile amenable to producing biofuels meeting the U.S. Renewable Fuels Standard [10,11,12]. Efforts to convert pennycress oil and protein meal into edible products with higher value are underway and will increase the profitability of this crop for growers [13,14,15].
Pennycress is native to Eurasia and has been naturalized on most continents [6], resulting in opportunities for genetic and phenotypic diversification. It is a diploid member of the Brassicaceae family with a haploid number of seven chromosomes (2n = 14) and has a small genome size of 539 Mb [16]. Pennycress is predominately self-pollinating [1]. It is closely related to the Brassica species rapeseed (Brassica rapa and Brassica napus L.), camelina (Camelina sativa L.), and the model plant Arabidopsis thaliana [1]. A transcriptome and draft genome have been developed for pennycress [16,17] and a recent report has confirmed one-to-one gene correspondence between pennycress and Arabidopsis [2].
While genetic diversity and population structure have been evaluated in related crop species including rapeseed and camelina [18,19], few evaluations of natural pennycress germplasm have been completed. Forty-one pennycress accessions were evaluated for variation in seed size and fatty acid profile, but no genetic analysis was completed [20]. Several limited genetic analyses of pennycress germplasm have been completed, including an evaluation of allelic diversity of the FLOWERING LOCUS C (FLC) locus in 35 spring annual pennycress accessions [21] and the genetic diversity of 19 Chinese pennycress populations using three chloroplast and one nuclear DNA genes [22]. Thus far, pennycress breeding has focused on the use of mutagenesis and genome editing to manipulate specific traits of interest for pennycress domestication [2,13,14,23]. However, these breeding methods restrict the researcher to a genetic base of limited accessions. This may impede the identification of desirable traits in natural germplasm and slow the long-term progress of breeding programs. Worse, the use of a limited genetic base may create a bottleneck that results in the loss of important traits and hinders the adoption of pennycress as a crop.
New genomic technologies such as genome-wide sequencing allow plant breeders to approach crop domestication in a guided manner without risking genetic bottlenecks common in crops such as soybean, wheat, and barley [24,25,26]. As a new crop undergoing selection for domestication, wild accessions of pennycress are important resources for environmental adaptation, agronomic improvements, and allelic diversity. However, selection for domestication traits and improved agronomic characteristics based on phenotypes alone could result in rapid loss of genetic diversity, thus reducing the potential for future selection of traits such as biotic resistance, abiotic tolerance, or end use quality. It is not known how wide the pennycress gene pool represented in collected accessions is, or if further expansion of this pool is needed. It is also unknown if population structure in the collections is present or related to geographic distribution. Knowledge of population structure could benefit new pennycress breeding and domestication programs. For example, allelic variants conferring selective advantages to pennycress in its native Eurasian range may not be present in the naturalized North American populations. Consequently, the objective of this study was to utilize high-density SNP genotyping to evaluate genome-wide genetic diversity and population structure in the pennycress accessions available in the USDA-ARS National Plant Germplasm System and accessions collected by pennycress breeding programs in the Midwest USA.

2. Materials and Methods

2.1. Plant Material and DNA Isolation

One hundred and nineteen pennycress accessions including both winter and spring annual growth habits were analyzed (Table S1). Winter annual pennycress accessions require a cold period of approximately 4 °C for 21 days to flower, while spring annual accessions require no cold treatment to induce flowering [1,27]. Seventy-two accessions were retrieved from the collections of the USDA-ARS North Central Regional Plant Introduction Station in Ames, Iowa, 40 accessions were collected by University of Minnesota researchers, and seven were contributed by Dr. John Sedbrook from Illinois State University. These accessions represent pennycress populations across the Caucasus region, Europe, the U.S., and Canada. Collection protocol at the site of origin for each accession varied. Some collections were made by pooling seeds from multiple plants in a single location, while other accessions were maintained as separate collections of seeds from nearby plants. To reduce heterogeneity and prepare accessions for use as inbred lines in a breeding program, each accession was inbred by single seed descent for one to two generations prior to tissue collection. Duplicate single seed descent lines were maintained of accessions Ames32757 and Ames32239. Both replicates were tested in this study and considered as separate accessions in the analysis because the level of heterogeneity in pennycress accessions was unknown. This brought the total number of sequenced lines to 121. All accessions were similar morphologically and matched the physiological description of Thlaspi arvense in both field trials and growth chamber evaluations. One accession from Armenia was observed to exhibit larger flowers and partial sterility (approximately 25% non-fertile pods with 1–2 seeds per fertile pod) in a field grow out, and the phenotype was seen in subsequent generations grown in a growth chamber. A single plant representing each accession was grown in a growth chamber, and approximately 500 mg of fresh tissue was collected, immediately frozen in liquid nitrogen, and stored at −80 °C. DNA extraction was performed using a Qiagen DNeasy Plant mini kit (Qiagen, Valencia, CA, USA) according to the manufacturer’s instructions.

2.2. Genotyping and SNP Identification

After DNA extraction, genotyping-by-sequencing (GBS) [28] was performed by BGI (Hong Kong, China). Each sample was digested with ApeKI, barcoded, and sequenced on four Illumina HiSeq2500 single-end 100 base pair lanes generating 457 million reads. Raw reads obtained from the sequencer were de-multiplexed based on the barcode information and aligned to the draft pennycress genome using bwa v0.7.17-r1188 [29]. Sequence aligned files were processed through SAMtools v1.9 and Picard tools v1.83 [30] to sort the files and add read group identifiers. Variants were called using GATK haplotype caller v3.3 [31]. A total of 81,034 SNPs were identified among the accessions analyzed. Many of the lines had heterozygous SNPs, which could be a result of collapsed assembly in the draft pennycress genome. Therefore, we removed heterozygous sites and retained the SNPs present in all sequenced samples using Tassel 5.2.50 [32]. SNPs were further pruned based on linkage disequilibrium using Plink v1.8 [33] and the criteria—indep-pairwise 100 5 0.2. All analysis was performed using the LD pruned SNP panel, which is available in Table S2.

2.3. Analysis of Genetic Structure

The number of differentiated population groups within pennycress accessions was examined with Bayesian clustering utilizing Markov Chain Monte Carlo (MCMC) algorithms. This analysis was implemented using the admixture model of STRUCTURE v2.3.4 [34]. All 121 accessions were tested using K = 2 to 10, where K is the number of population groups tested, with 10 runs per K value. Each run consisted of 30,000 initial burn-in iterations and 100,000 MCMC iterations. The admixture model and independent allele frequencies were used without including any prior information on the origin of each accession. The most probable value of K was determined based on the deltaK method of Evanno et al. [35] as implemented in Structure Harvester web v0.6.94 [36]. Results from the individual runs were aligned with CLUMPP v1.1.2 using the Greedy algorithm [37].
Principal components analysis (PCA) was used to further analyze genetic structure and evaluate patterns caused by growth habit or geographic origins. SNP data was first converted to numeric classes and PCA was implemented in the population stratification workflow in JMP Genomics 9 (SAS, Cary, NC, USA). Briefly, SNP data were used to calculate principle components, and a scree plot was used to determine the number of useful principal components (data not shown). The first two principle components were used to determine if clustering due to geographic origin was present. Differences between winter and spring growth habits were then tested by subjecting each growth type to PCA.
Minor allele frequency (MAF) was determined using the Basic Genetics workflow in JMP Genomics 9 and used to examine the occurrence of unique alleles in groups of pennycress accessions. Pairwise genetic distance was used to evaluate the amount of genetic diversity present in the pennycress collection and was calculated using the package ‘ape’ in R v 3.4.1 as per Poets et al. [38,39,40]. The genetic distance matrix was then utilized to calculate a phylogenetic tree using the R package ‘phylogram’ [41].

3. Results

3.1. Germplasm and Genotypic Data

The 121 accessions in the study consisted of 80 winter annuals and 41 spring annuals. Latitude of the original collection locations ranged from 51° S to 55° N, however, most collections were made in latitudes ranging from 38° to 49° N. Seven collections were made in Europe, seven in Armenia, and one in South America. The remaining accessions were collected in North America, including 23 in Canada and 83 in the United States.
Across the 121 accessions, we obtained 9177 SNPs after filtering for quality parameters. SNPs were obtained by aligning raw reads of each accession to the draft pennycress genome [11]. Further filtering based on LD and associated parameters as described in the methods resulted in 3947 SNPs. The number of polymorphic SNPs were then evaluated for different geographic groups and winter and spring annual growth habits. Of the 3947 SNPs, 851 and 875 segregated in Canadian and European accessions respectively. The seven Armenian accessions hosted 1750 polymorphic SNPs while 2603 polymorphic SNPs were present in accessions collected in the United States. Eighty-seven percent of SNPs (3433) were polymorphic in the winter annual accessions, while only 36% (1438 SNPs) were polymorphic in the spring annual accessions.

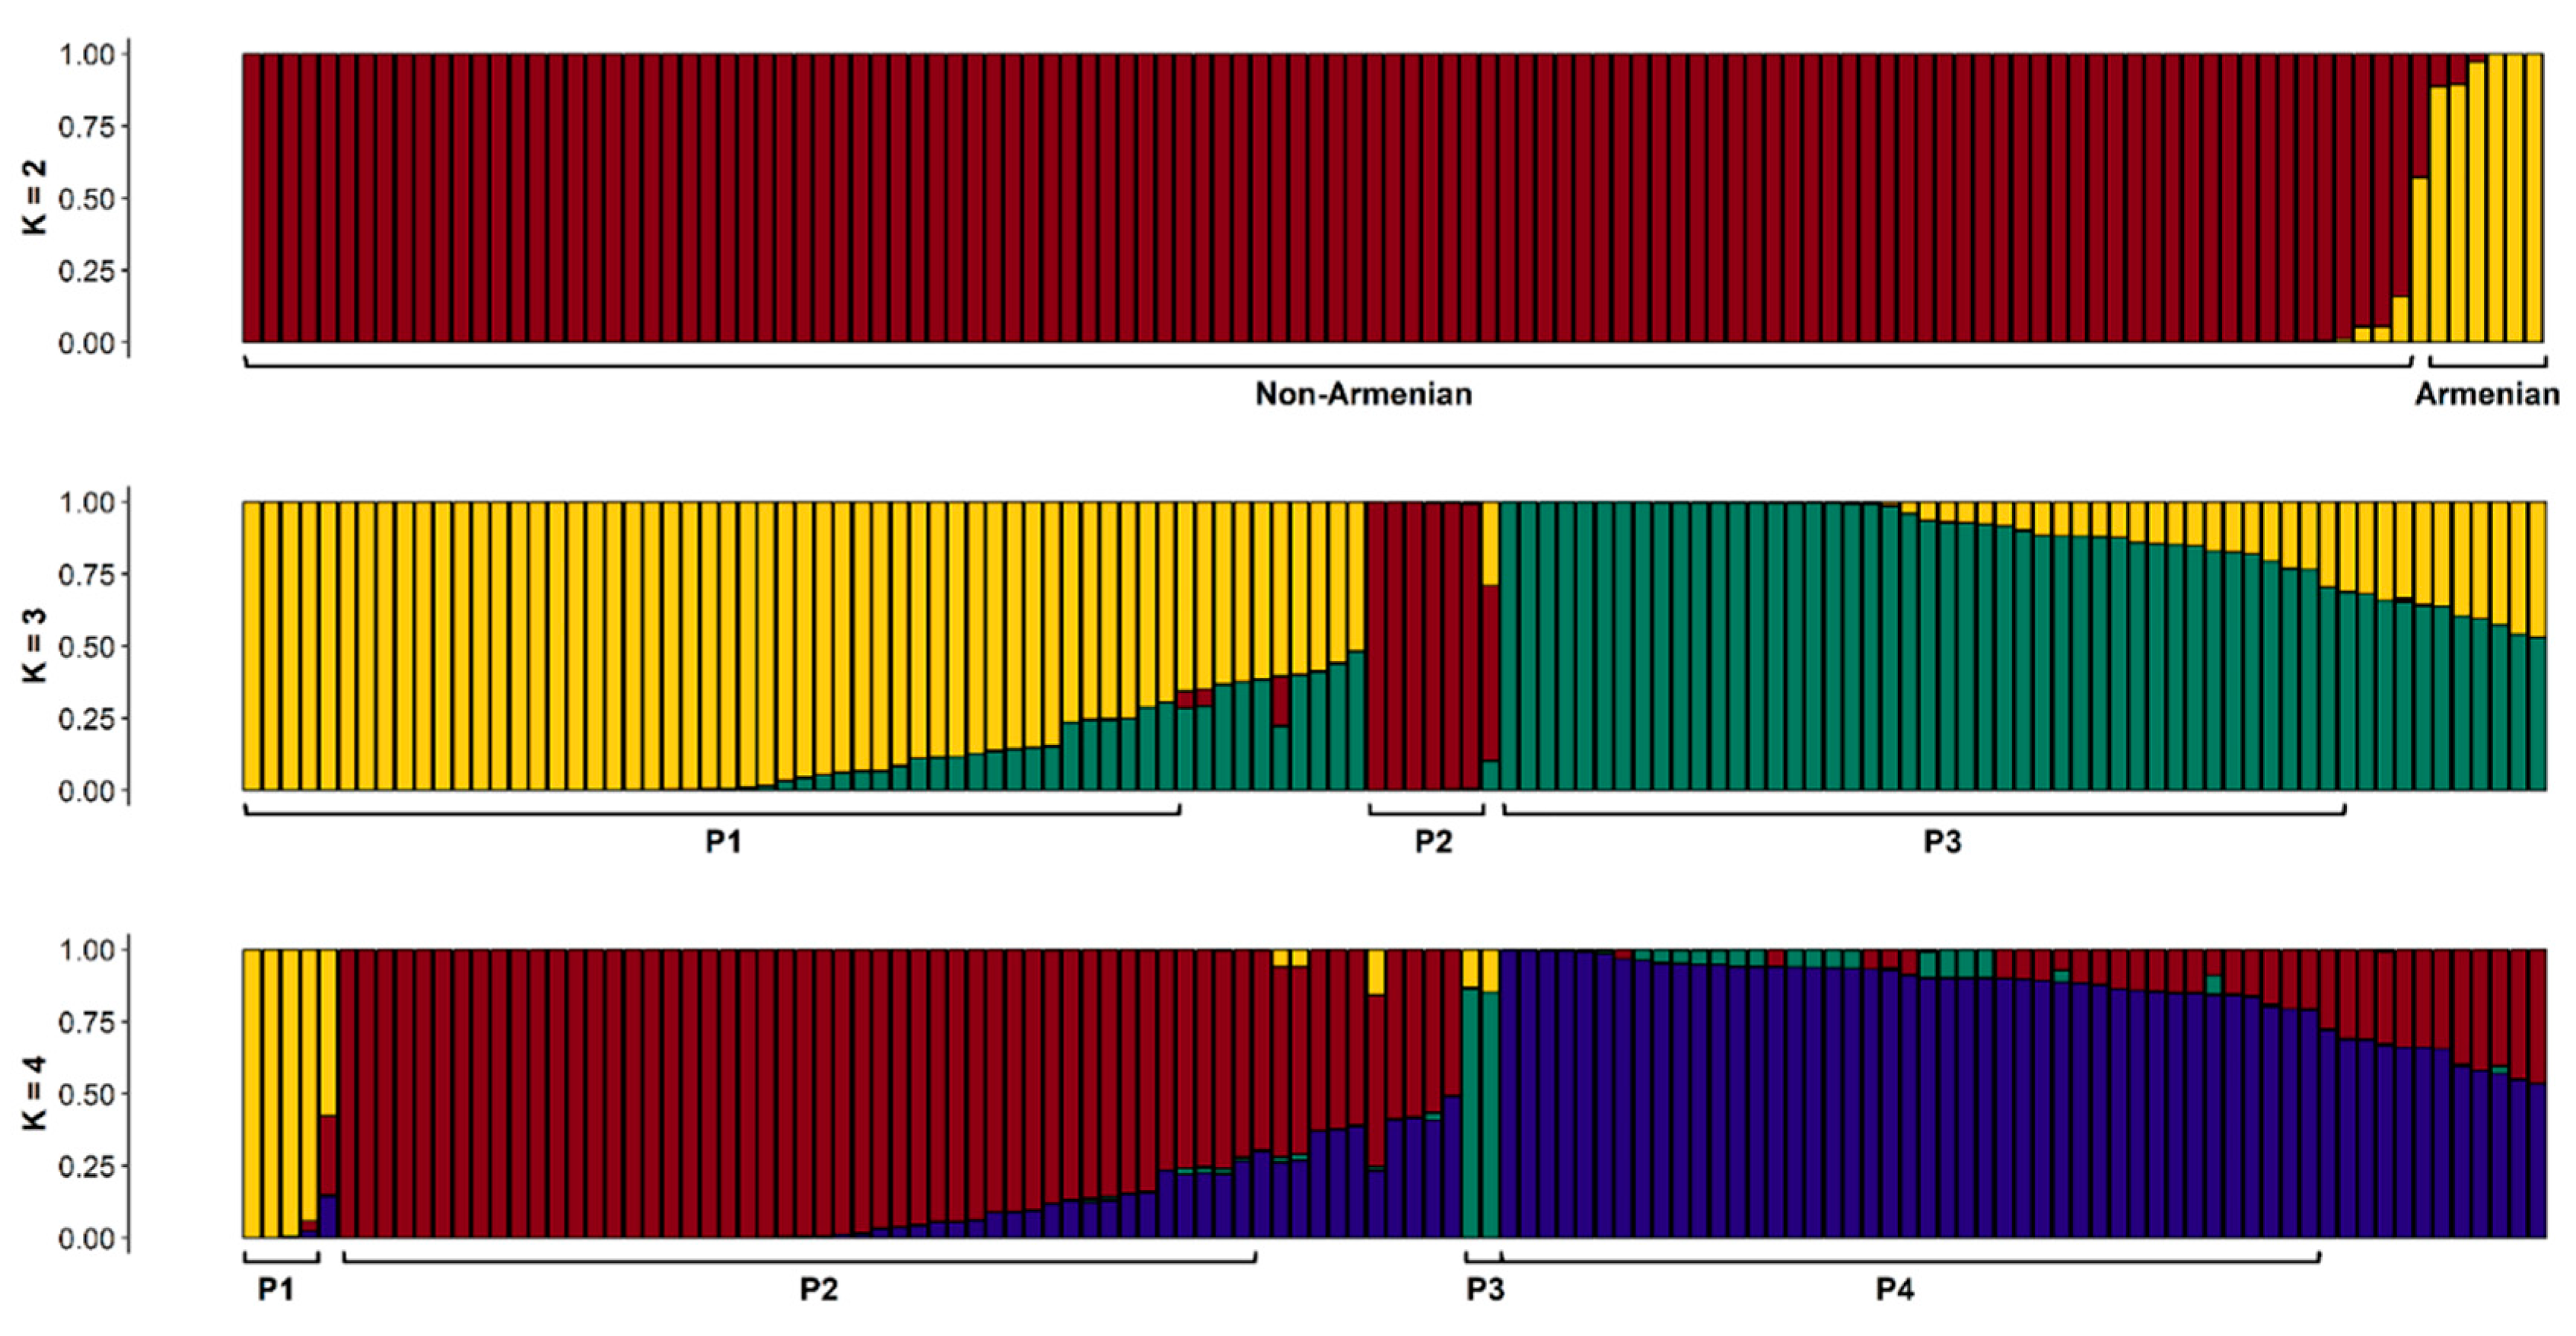
3.2. Bayesian Clustering (STRUCTURE) Analysis

Estimation of population structure across all pennycress accessions revealed a maximum K value at K = 2 using the DeltaK method [29], and a second, smaller peak was detected at K = 4 (Figure S1). At K = 2, the pennycress accessions were divided into Armenian and non-Armenian groups except for one accession that appeared to be admixed between the two groups (Figure 1). At K = 3, the non-Armenian accessions are divided into two populations (Figure 1). At K = 4, the Armenian accessions were split into two groups, and the non-Armenian accessions were split into two population groups or were genetically admixed between populations (Figure 1). Using a cutoff value of 70% ancestry suggested by Filippi et al. [42] to determine the population assignment, 96 of the accessions were attributed to a specific population while 25 were classified as admixed at K = 4. The two Armenian groups consisted of four and two lines respectively. The third group contains 48 accessions originating mostly from Canada and the upper Midwest U.S. (Minnesota) with a few accessions collected in Montana, Colorado, and Europe. The fourth group contains 44 accessions originating from Europe, the Midwest USA (Iowa, Illinois, and Nebraska), as well as most accessions collected in the Rocky Mountain region of the USA (Table S1). At K = 5, 40 accessions were considered admixed, and no valuable information on population structure was gained.
To confirm the two separate groups of non-Armenian accessions, all Armenian accessions were removed from the dataset, and the remaining lines were subjected to STRUCTURE analysis. The maximum K value was detected at K = 2. Population assignment of the 114 non-Armenian accessions was nearly identical in both analyses with only five differences in population assignment (Figure S2). The five differences were mainly in the assignment of an accession to a population group versus defining it as admixed. No differences in grouping between winter and spring annual accessions were observed in any STRUCTURE analysis.

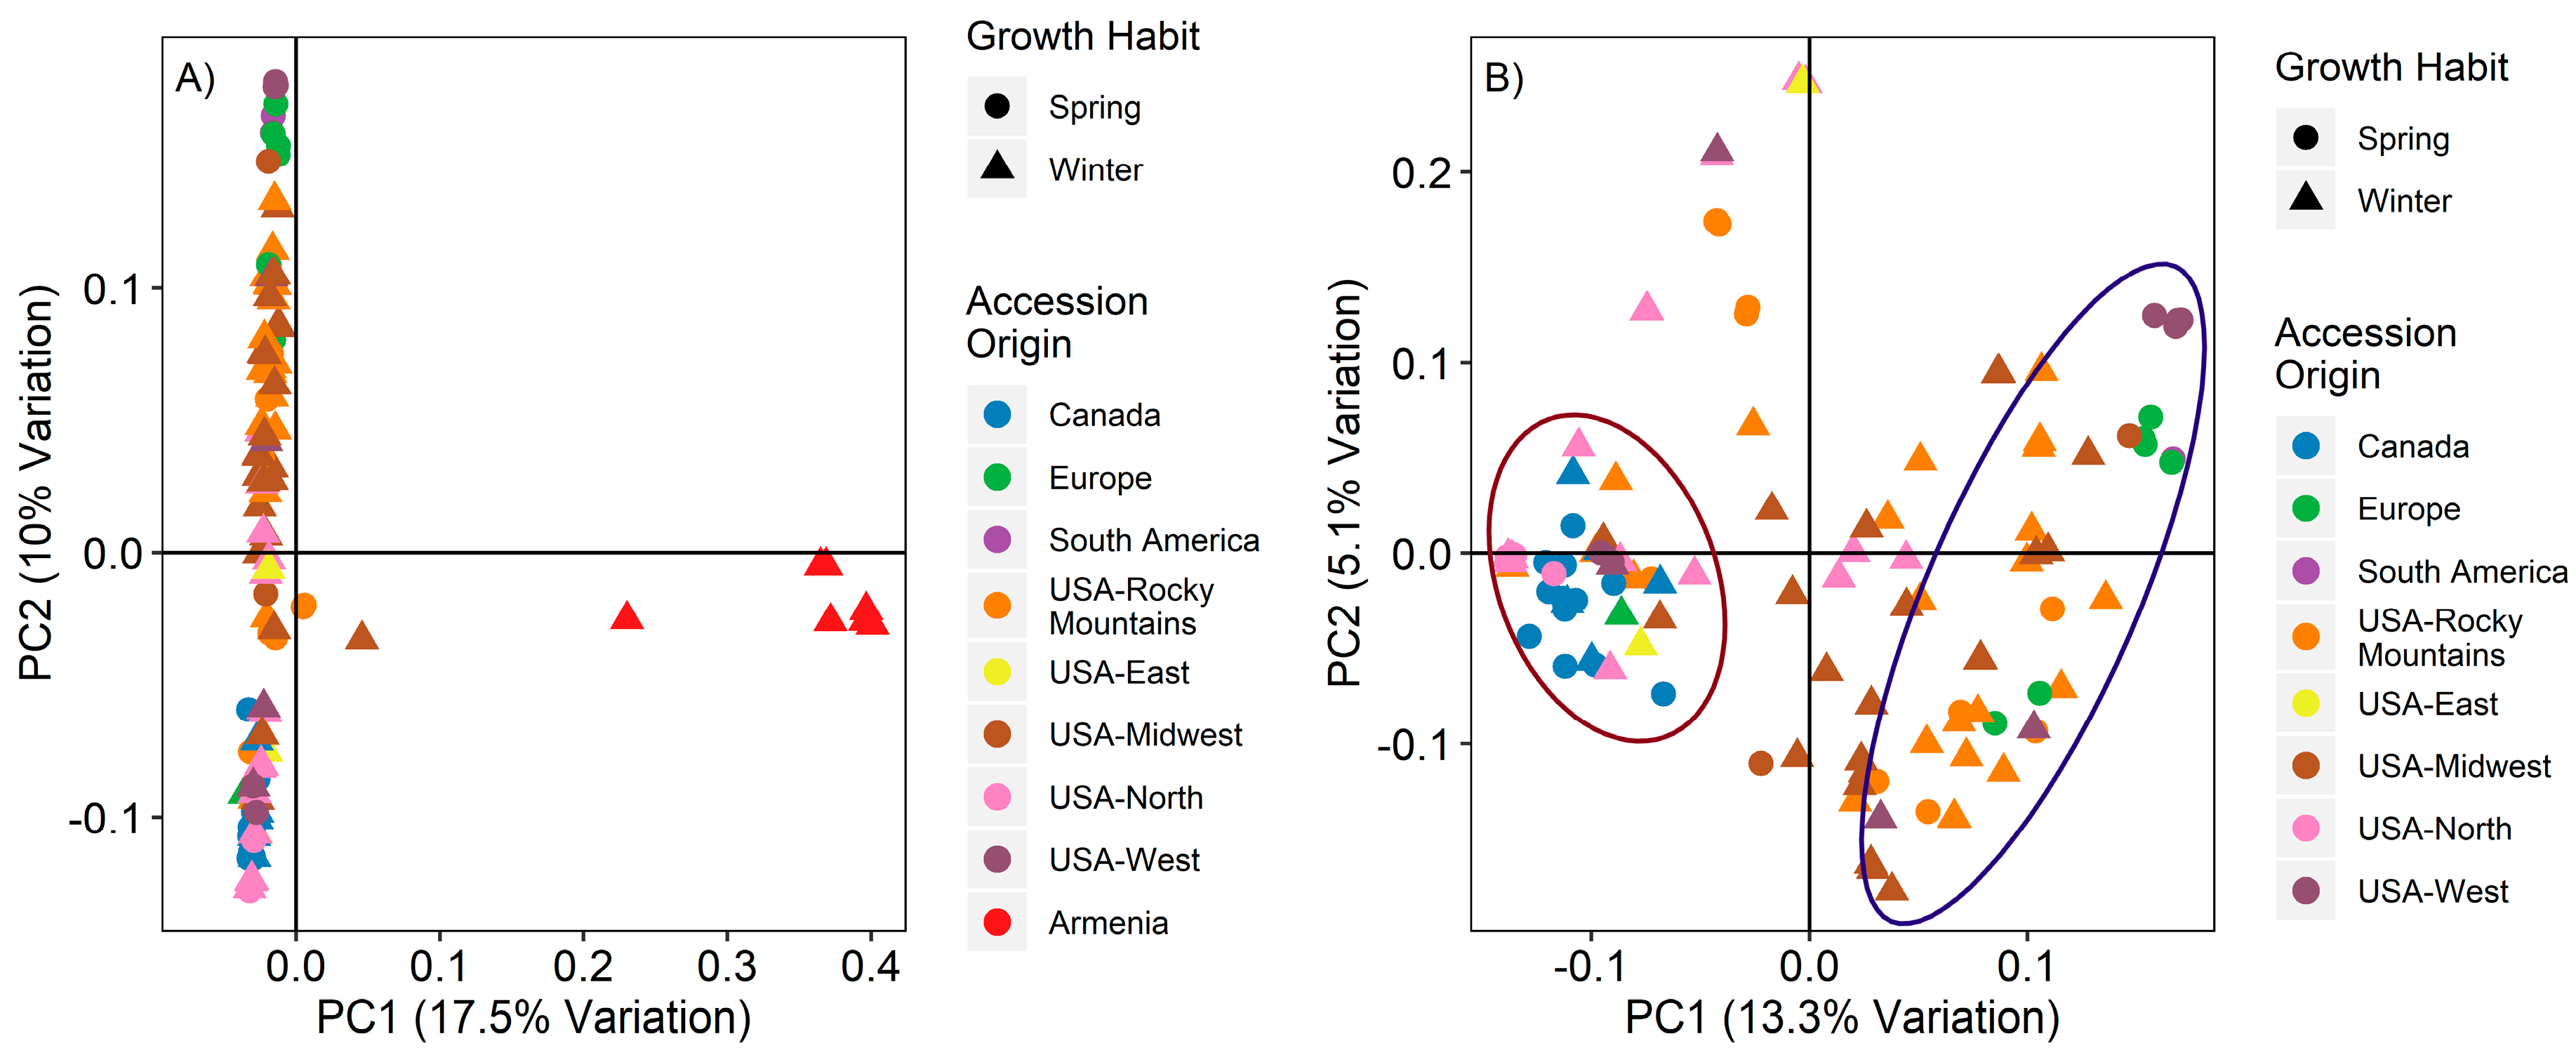
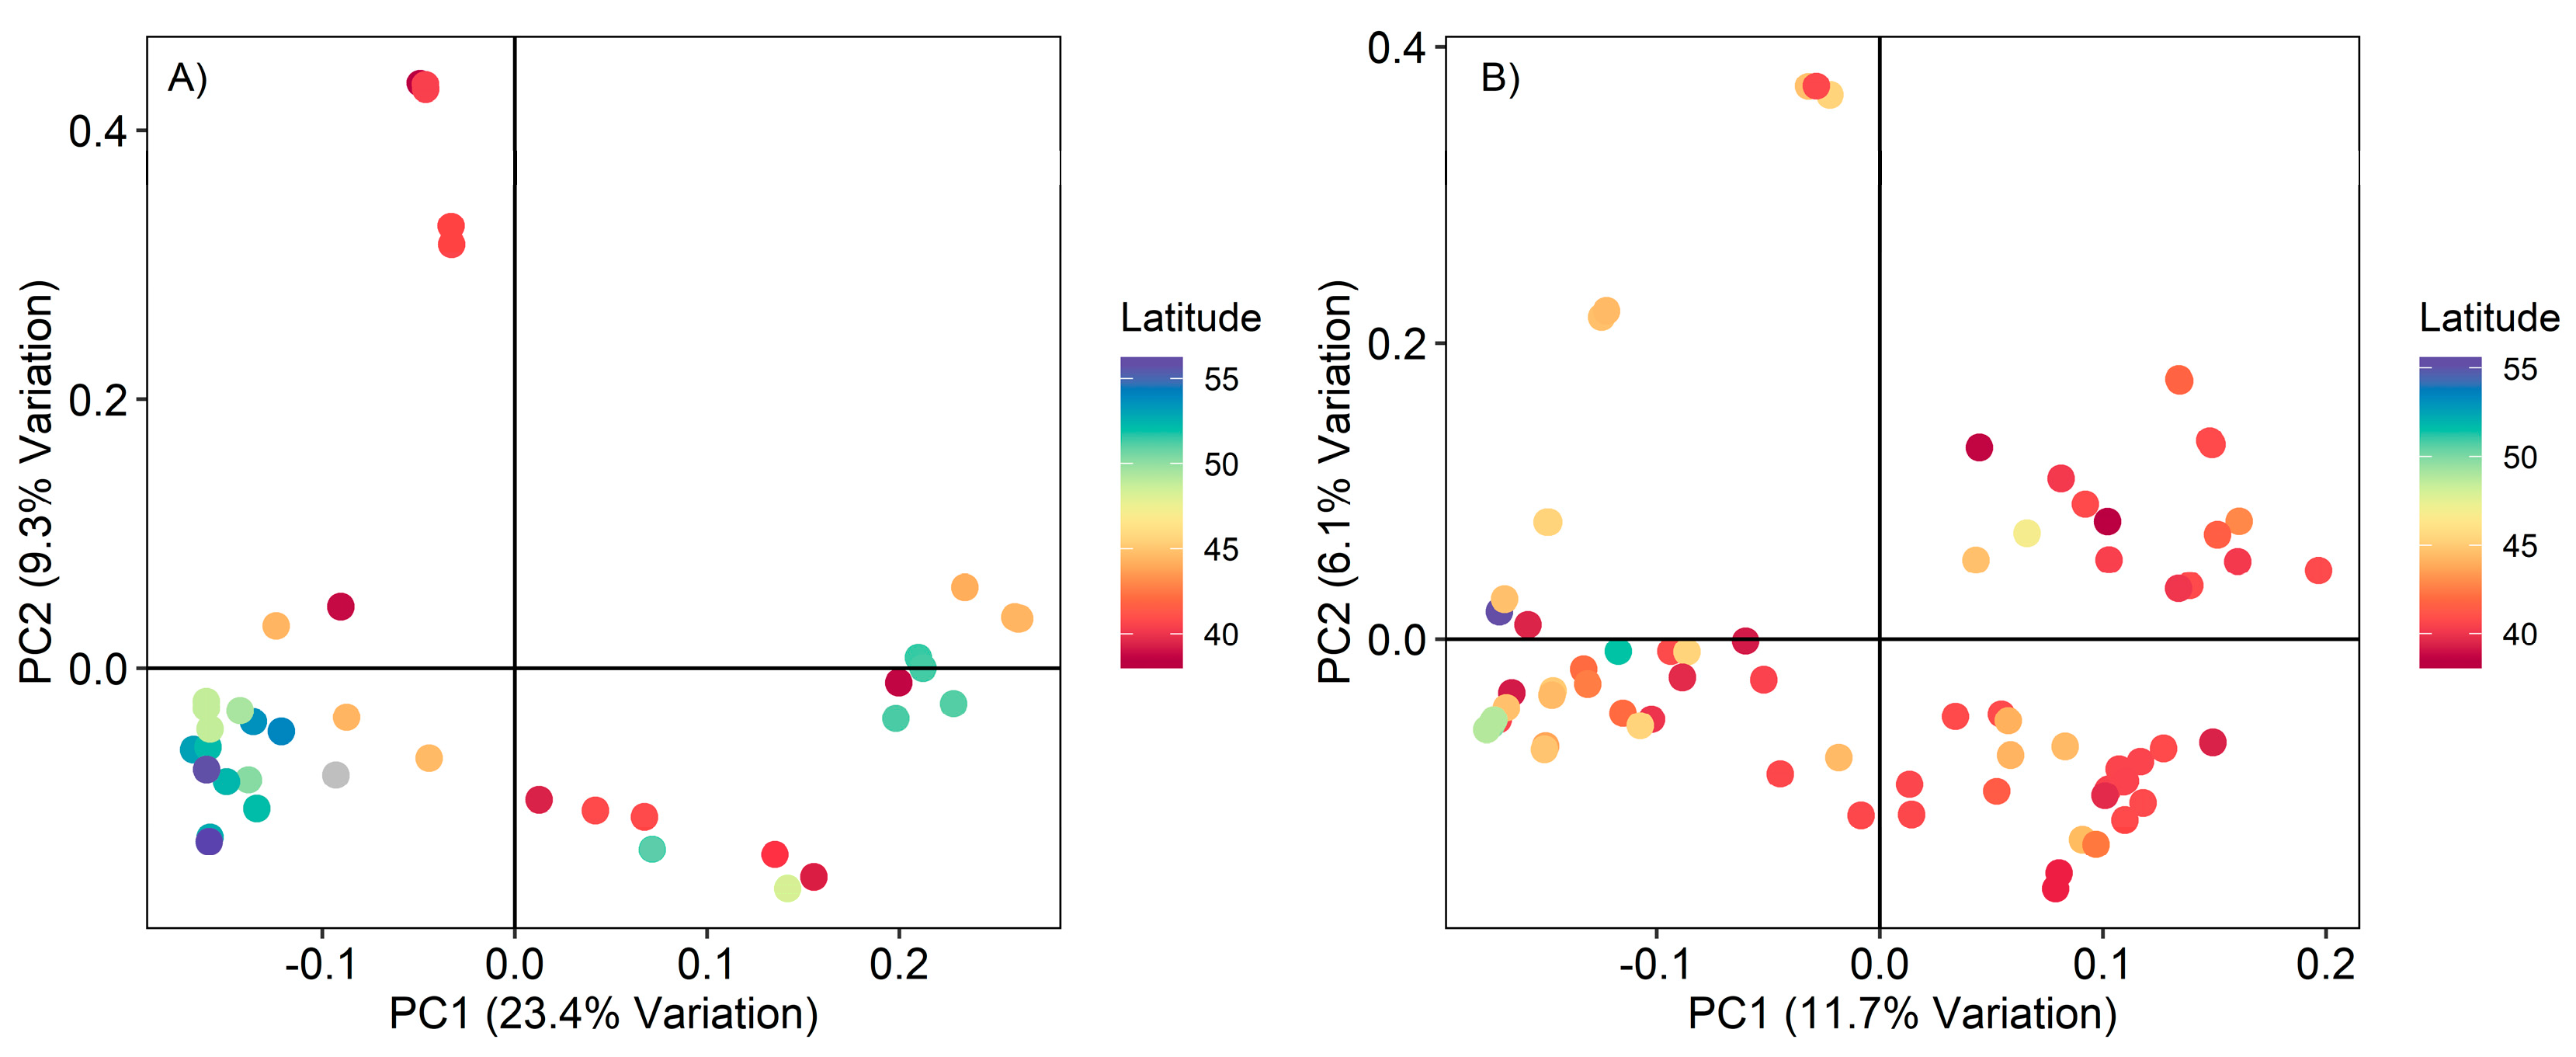
3.3. Principal Component Analysis

Principal component analysis was first deployed on all pennycress accessions (Figure 2A). The first principal component (PC) divides Armenian accessions from all other accessions and explains 17.5% of the total variation. The second PC explains 10% of the total variation, however, the large cluster is difficult to visualize due to the large effect of the Armenian accessions on PC 1. Therefore, the Armenian accessions were removed from the dataset, and principal components were recalculated for the remaining accessions (Figure 2B). After removing the Armenian accessions, the first two PCs cumulatively explain 18.4% of the remaining variation. The first principal component divides STRUCTURE population 2 from STRUCTURE population 4. Some clustering according to the geographic location of the original collection was present. The non-Armenian lines were further divided into winter and spring annual growth habits and subjected to PCA (Figure 3). Spring annual pennycress accessions clearly cluster based on latitude of the collection site, however, European accessions from similar latitudes are divided from North American accessions by the first principal component (Figure 3A). Only two winter annual accessions were collected from above 50° North latitudes. However, the first principal component still divides collections made in higher latitudes (above 45° N) from those made at lower latitudes (Figure 3B).

3.4. Population Genetic Diversity and Pairwise Comparison of Genetic Distances

Minor allele frequency (MAF) for the 3947 filtered SNP loci in this study averaged 0.075. The proportion of MAF less than 0.05 was 62.1% while the proportion of MAF greater than 0.4 was 2.7%. Mean pairwise distance across all unique pairs of accessions was 0.122 (Table S3). Pairwise distances were then calculated within the spring and winter annual subsets. Mean pairwise distance for all unique spring pairs was 0.094, while mean pairwise distance for all unique winter pairs was 0.134. Pairwise genetic distance between Ames32757 and its sib line was 0.008 while the distance between Ames32239 and its sib line was 0.089 (Table S3). Average within population genetic distance tended to be low, ranging from 0.043 to 0.11 (Table 1). Genetic distance was highest between the Armenian and non-Armenian populations P1 and P3 vs P2 and P4 (0.3–0.4), and average genetic distances between the two non-Armenian populations P2 and P4 was low (0.11). The genetic distance matrix was used to develop a phylogenetic tree for all 121 pennycress accessions (Figure S3). Phylogenetic grouping largely matched the population groups identified through STRUCTURE analysis of four population groups in Figure 1.

4. Discussion

This study is the first report of genome-wide marker analysis of genetic diversity and population structure in a large collection of Thlapsi arvense. As a new oilseed crop species, it is critical to understand the genetic diversity available for breeding and effectively manage the accessions available in collections to utilize and preserve valuable diversity. The accessions included in the study were identified in the wild and show such traits as pod shatter, dormancy, and non-uniform germination [43], suggesting that no domestication pressure had been applied to these lines prior to collection.
Pennycress was likely introduced to the United States by European immigrants in the last 100–250 years [1,6]; therefore, we expect ancestral relationships between the North American and European lines. Indeed, we found that each population as determined by STRUCTURE analysis contains one or more European accessions (Figure 1 and Figure 2B). Other introduced weedy species such as Arabidopsis, Ambrosia artemisiifolia L., and Allaria petiolata have also shown significant population structure based on collection site and genetic ties to ancestral populations in Europe [44,45,46].
A recent study of Chinese pennycress populations failed to identify population structure due to geographic origins and suggested that because pennycress seed dispersal can occur quickly through animal, water, and human intervention, pennycress populations did not undergo adaptation to a region prior to further spread [22]. Frequent dispersal events could also result in gene flow, creating regions where the populations are admixtures of ancestral populations as evidenced in related Brassica species Arabidopsis thaliana [44,47], and Arabis alpina [48]. In the present study, the effect of human intervention on North American pennycress could be represented by the mix of populations and residual effects of admixture present in accessions collected in areas such as popular tourist destinations like the Rocky Mountains and agricultural regions such as the Midwest USA where hay and other agricultural products are regularly transported with minimal containment (Figure 2B).
Recent studies in some Brassicaceae species have shown significant correlation between genetic diversity and latitude, with genetic diversity declining at higher latitudes [44,46,49]. Here we show that pennycress growth habit and diversity is influenced by latitude, with the reduced polymorphism spring accessions found at higher latitudes while the more diverse winter accessions found at lower latitudes. Despite differences in level of polymorphism, the spring accessions do not form a distinct subpopulation from the winter annual accessions (Figure 1 and Figure 2). Interestingly, both growth habits co-existed in certain regions such as Saskatchewan, Canada and near the Canadian-U.S. border. Average genetic diversity between winter and spring accessions in these two regions was low (0.033 and 0.053 respectively). This suggests that growth habit could be a strategy for wild-pennycress to survive in changing or harsh climates by ensuring seed dispersal.
Overall, the North American pennycress accessions in this study had lower levels of pairwise genetic diversity than reported in barley (0.25) [40], but similar to values reported in wild soybean collections [50,51]. This could suggest that a genetic bottleneck occurred as pennycress was inadvertently introduced to North America [52,53,54]. However, due to the limited number of European accessions in this study, we cannot conclusively determine if the overall genetic diversity is lower in North America than in Europe. Further studies that include more European and Asian pennycress accessions as well as collections from other areas of the world will be needed to explicitly compare the global genetic diversity of pennycress and investigate the presence of genetic bottlenecks.
The seven accessions collected in or derived from Armenia were the most diverse lines in the germplasm pool with mean pairwise distances of 0.36 from the other accessions or an approximately 1420 SNP difference between Armenian and non-Armenian accessions (Table S3). Unlike accessions from Europe, the Armenian accessions do not cluster with any of the collected accessions from North America, demonstrating that this germplasm has not been introduced into North America. The Armenian accessions do not appear to be morphologically different than other accessions, and successful crosses have been made between several Armenian accessions and MN106, a known diploid North American accession described in Dorn et al. [16]. No indications have been found that these accessions were incorrectly classified as Thlaspi arvense, although some phenotypic differences including larger seed size (hundred seed weight > 0.12 g) and robust growth were observed. These observations, combined with the large pairwise genetic diversity values between the populations (Table 1), suggest that the Armenian accessions may be useful for increasing genetic diversity of pennycress breeding programs as well as introducing beneficial alleles for traits such as increased seed size and seed yield. Crossing these divergent lines may also generate useful epistatic interactions with the potential to create unexpected but desirable phenotypes [55]. Some population structure exists within the Armenian accessions as evidenced by the STRUCTURE analysis at K = 4 (Figure 1 and Figure S3). In this case, two of the Armenian accessions are classified as distinct, and one of these lines showed partial sterility. Further investigation is underway to determine the cause of this sterility and how it relates to the genetic differences and population structure between this accession and other Armenian collections. Proximity to the center of origin in Eurasia could explain the genetic differences between the Armenian accessions and the other accessions studied.
Apart from the Armenian accessions, the pennycress accessions available for breeding reflect somewhat limited genetic diversity as indicated by the low pairwise diversity values both within and between non-Armenian populations. A recent study of agronomic characteristics of pennycress accessions found significant phenotypic variation for seed size (0.097–0.112 g hundred seed weight), oil content (30–33%), and fatty acid profile [20], however, the range in variation for these traits was relatively narrow. Of the 40 pennycress accessions present in both studies, the average pairwise genetic distance between the accessions was 0.093 (summarized from Table S3). No attempt was made to genetically map the phenotypic traits in Altendorf et al. [20], therefore it is unknown how these phenotypes relate to the genotypes. For future analysis of quantitative traits such as yield or yield components, trait-gene associations could be difficult to dissect if genetic diversity is low [56].
Additional genetic diversity would benefit pennycress breeding. As a new crop, pennycress may face unforeseen biotic and abiotic challenges, and new collections of wild pennycress germplasm could increase the diversity available for breeding. However, based on the present analysis, the search for diverse pennycress accessions for use in breeding should focus on areas outside of the U.S. and Western Europe. Opportunities for genetically diverse accessions can be found in the Caucasus region of Western Asia or the Fertile Crescent region where pennycress likely originated. Pennycress accessions adapted to high elevations such as those studied in An et al. [22] may also be useful to breeders. Overall, the level of genetic diversity in the pennycress collection suggests that reported efforts such as mutation breeding and gene editing are necessary to rapidly identify more variation for domestication traits such as reduced pod shatter and improved oil quality in pennycress [2,13,14]. Traits created through these methods can be introgressed into high yielding pennycress lines developed from wild germplasm, thereby avoiding any genetic bottlenecks that may be incurred due to strict selection for domestication.

Supplementary Materials

The following are available online at https://www.mdpi.com/2073-4395/9/6/302/s1, Table S1: List of 121 T. arvense accessions used in the study. Table S2: LD pruned SNP dataset in hapmap format. Table S3: Pairwise genetic distance matrix of all 121 T. arvense accessions. Figure S1: Estimation of the true number of populations within 121 pennycress accessions using the ΔK method, where K is the number of populations ranging from 2–10. Figure S2: STRUCTURE analysis of non-Armenian T. arvense accessions. The colored bar indicates population membership greater than 70%. Striped sections indicate admixture. Figure S3: Phylogenetic tree of 121 pennycress accessions.

Author Contributions

Conceptualization, K.F., D.L.W. and J.A.A.; Formal analysis, K.F. and R.C.; Funding acquisition, J.A.A.; Investigation, K.M.D. and M.D.M.; Methodology, K.M.D.; Resources, D.L.W. and M.D.M.; Supervision, J.A.A.; Writing—original draft, K.F.; Writing—review & editing, R.C., Kevin M. Dorn, D.L.W., M.D.M. and J.A.A.

Funding

Project funding was provided by Clean Water Funds through the Minnesota Department of Agriculture contract 77358. Additional funds were provided by the University of Minnesota Forever Green Initiative to J.A. Anderson, and the Walton Family Foundation to D.L. Wyse.

Acknowledgments

The authors thank John Sedbrook and Kayla Altendorf for contributing germplasm and Selena Lopez for assistance with lab work and plant maintenance. We thank Ana Poets for advice on data analysis and Zenith Tandukar for helpful suggestions on the manuscript.

Conflicts of Interest

The authors declare no conflicts of interest. The funders had no role in the design of the study; in the collection, analyses, or interpretation of data; in the writing of the manuscript, or in the decision to publish the results.

References

  1. Sedbrook, J.C.; Phippen, W.B.; Marks, M.D. New approaches to facilitate rapid domestication of a wild plant to an oilseed crop: Example pennycress (Thlaspi arvense L.). Plant Sci. 2014, 227, 122–132. [Google Scholar] [CrossRef] [PubMed]
  2. Chopra, R.; Johnson, E.B.; Daniels, E.; McGinn, M.; Dorn, K.M.; Esfahanian, M.; Folstad, N.; Amundson, K.; Altendorf, K.; Betts, K.; et al. Translational genomics using Arabidopsis as a model enables the characterization of pennycress genes through forward and reverse genetics. Plant J. 2018, 96, 1093–1105. [Google Scholar] [CrossRef] [PubMed]
  3. Boateng, A.A.; Mullen, C.A.; Goldberg, N.M. Producing stable pyrolysis liquids from the oil-seed presscakes of mustard family plants: Pennycress (Thlaspi arvense L.) and camelina (Camelina sativa). Energ. Fuel. 2010, 24, 6624–6632. [Google Scholar] [CrossRef]
  4. Johnson, G.A.; Wells, M.S.; Anderson, K.; Gesch, R.W.; Forcella, F.; Wyse, D.L. Yield tradeoffs and nitrogen between pennycress, camelina, and soybean in relay- and double-crop systems. Agron. J. 2017, 109, 2128–2135. [Google Scholar] [CrossRef]
  5. Johnson, G.A.; Kantar, M.B.; Betts, K.J.; Wyse, D.L. Field pennycress production and weed control in a double crop system with soybean in minnesota. Agron. J. 2015, 107, 532–540. [Google Scholar] [CrossRef]
  6. Warwick, S.I.; Francis, A.; Susko, D.J. The biology of Canadian weeds. Thlaspi arvense L. (updated). Can. J. Plant Sci. 2002, 82, 803–823. [Google Scholar] [CrossRef]
  7. Weyers, S.; Thom, M.; Forcella, F.; Eberle, C.; Matthees, H.; Gesch, R.; Ott, M.; Feyereisen, G.; Strock, J.; Wyse, D. Reduced Potential for Nitrogen Loss in Cover Crop–Soybean Relay Systems in a Cold Climate. J. Environ. Qual. 2019, 48, 660. [Google Scholar] [CrossRef]
  8. Eberle, C.A.; Thom, M.D.; Nemec, K.T.; Forcella, F.; Lundgren, J.G.; Gesch, R.W.; Riedell, W.E.; Papiernik, S.K.; Wagner, A.; Peterson, D.H.; et al. Using pennycress, camelina, and canola cash cover crops to provision pollinators. Ind. Crops Prod. 2015, 75, 20–25. [Google Scholar] [CrossRef]
  9. Phippen, W.B.; Phippen, M.E. Soybean seed yield and quality as a response to field pennycress residue. Crop Sci. 2012, 52, 2767–2773. [Google Scholar] [CrossRef]
  10. Fan, J.; Shonnard, D.R.; Kalnes, T.N.; Johnsen, P.B.; Rao, S. A life cycle assessment of pennycress (Thlaspi arvense L.)—Derived jet fuel and diesel. Biomass Bioenergy 2013, 55, 87–100. [Google Scholar] [CrossRef]
  11. Moser, B.R.; Shah, S.N.; Winkler-Moser, J.K.; Vaughn, S.F.; Evangelista, R.L. Composition and physical properties of cress (Lepidium sativum L.) and field pennycress (Thlaspi arvense L.) oils. Ind. Crops Prod. 2009, 30, 199–205. [Google Scholar] [CrossRef]
  12. Moser, B.R. Biodiesel from alternative oilseed feedstocks: Camelina and field pennycress. Biofuels 2012, 3, 193–209. [Google Scholar] [CrossRef]
  13. McGinn, M.; Phippen, W.B.; Chopra, R.; Bansal, S.; Jarvis, B.A.; Phippen, M.E.; Dorn, K.M.; Esfahanian, M.; Nazarenus, T.J.; Cahoon, E.B.; et al. Molecular tools enabling pennycress (Thlaspi arvense) as a model plant and oilseed cash cover crop. Plant Biotechnol. J. 2019, 17, 776–778. [Google Scholar] [CrossRef] [PubMed]
  14. Chopra, R.; Johnson, E.B.; Emenecker, R.; Cahoon, E.B.; Lyons, J.; Kliebenstein, D.J.; Daniels, E.; Dorn, K.M.; Esfahanian, M.; Folstad, N.; et al. Progress toward the identification and stacking of crucial domestication traits in pennycress. bioRxiv 2019, 609990. [Google Scholar]
  15. Claver, A.; Rey, R.; López, M.V.; Picorel, R.; Alfonso, M. Identification of target genes and processes involved in erucic acid accumulation during seed development in the biodiesel feedstock Pennycress (Thlaspi arvense L.). J. Plant Physiol. 2017, 208, 7–16. [Google Scholar] [CrossRef] [PubMed] [Green Version]
  16. Dorn, K.M.; Fankhauser, J.D.; Wyse, D.L.; Marks, M.D. A draft genome of field pennycress (Thlaspi arvense) provides tools for the domestication of a new winter biofuel crop. DNA Res. 2015, 22, 121–131. [Google Scholar] [CrossRef]
  17. Dorn, K.M.; Fankhauser, J.D.; Wyse, D.L.; Marks, M.D. De novo assembly of the pennycress (Thlaspi arvense) transcriptome provides tools for the development of a winter cover crop and biodiesel feedstock. Plant J. 2013, 75, 1028–1038. [Google Scholar] [CrossRef] [PubMed]
  18. Vollmann, J.; Grausgruber, H.; Stift, G.; Dryzhyruk, V.; Lelley, T. Genetic diversity in camelina germplasm as revealed by seed quality characteristics and RAPD polymorphism. Plant Breed. 2005, 124, 446–453. [Google Scholar] [CrossRef]
  19. Luo, Z.; Brock, J.; Dyer, J.M.; Kutchan, T.; Schachtman, D.; Augustin, M.; Ge, Y.; Fahlgren, N.; Abdel-Haleem, H. Genetic Diversity and Population Structure of a Camelina sativa Spring Panel. Front. Plant Sci. 2019, 10, 184. [Google Scholar] [CrossRef] [Green Version]
  20. Altendorf, K.; Isbell, T.; Wyse, D.L.; Anderson, J.A. Significant variation for seed oil content, fatty acid profile, and seed weight in natural populations of field pennycress (Thlaspi arvense L.). Ind. Crops Prod. 2019, 129, 261–268. [Google Scholar] [CrossRef]
  21. Dorn, K.M.; Johnson, E.B.; Daniels, E.C.; Wyse, D.L.; Marks, M.D. Spring flowering habit in field pennycress (Thlaspi arvense) has arisen multiple independent times. Plant Direct 2018, 2, e00097. [Google Scholar] [CrossRef]
  22. An, M.; Zeng, L.; Zhang, T.; Zhong, Y. Phylogeography of Thlaspi arvense (Brassicaceae) in China Inferred from Chloroplast and Nuclear DNA Sequences and Ecological Niche Modeling. Int. J. Mol. Sci. 2015, 16, 13339–13355. [Google Scholar] [CrossRef] [PubMed] [Green Version]
  23. Chopra, R.; Folstad, N.; Lyons, J.; Ulmasov, T.; Gallaher, C.; Sullivan, L.; McGovern, A.; Mitacek, R.; Frels, K.; Altendorf, K.; et al. The adaptable use of Brassica NIRS calibration equations to identify pennycress variants to facilitate the rapid domestication of a new winter oilseed crop. Ind. Crops Prod. 2019, 128, 55–61. [Google Scholar] [CrossRef]
  24. Hyten, D.L.; Song, Q.; Zhu, Y.; Choi, I.-Y.; Nelson, R.L.; Costa, J.M.; Specht, J.E.; Shoemaker, R.C.; Cregan, P.B. Impacts of genetic bottlenecks on soybean genome diversity. Proc. Natl. Acad. Sci. USA 2006, 103, 16666–16671. [Google Scholar] [CrossRef] [PubMed] [Green Version]
  25. Kilian, B.; Martin, W.; Salamini, F. Genetic Diversity, Evolution and Domestication of Wheat and Barley in the Fertile Crescent. In Evolution in Action; Springer: Berlin/Heidelberg, Germany, 2010; pp. 137–166. [Google Scholar]
  26. Haudry, A.; Cenci, A.; Ravel, C.; Bataillon, T.; Brunel, D.; Poncet, C.; Hochu, I.; Poirier, S.; Santoni, S.; Glémin, S.; et al. Grinding up Wheat: A Massive Loss of Nucleotide Diversity Since Domestication. Mol. Biol. Evol. 2007, 24, 1506–1517. [Google Scholar] [CrossRef] [Green Version]
  27. Best, K.F.; Intyre, G.I.M. Studies on the Flowering of Thlaspi arvense L. III. The Influence of Vernalization Under Natural and Controlled Conditions. Bot. Gaz. 1976, 137, 121–127. [Google Scholar] [CrossRef]
  28. Elshire, R.J.; Glaubitz, J.C.; Sun, Q.; Poland, J.A.; Kawamoto, K.; Buckler, E.S.; Mitchell, S.E. A Robust, Simple Genotyping-by-Sequencing (GBS) Approach for High Diversity Species. PLoS ONE 2011, 6, e19379. [Google Scholar] [CrossRef]
  29. Li, H.; Durbin, R. Fast and accurate short read alignment with Burrows-Wheeler transform. Bioinformatics 2009, 25, 1754–1760. [Google Scholar] [CrossRef] [Green Version]
  30. Li, H.; Handsaker, B.; Wysoker, A.; Fennell, T.; Ruan, J.; Homer, N.; Marth, G.; Abecasis, G.; Durbin, R. The Sequence Alignment/Map format and SAMtools. Bioinformatics 2009, 25, 2078–2079. [Google Scholar] [CrossRef] [Green Version]
  31. Ren, S.; Bertels, K.; Al-Ars, Z. Efficient Acceleration of the Pair-HMMs Forward Algorithm for GATK HaplotypeCaller on Graphics Processing Units. Evol. Bioinform. 2018, 14, 117693431876054. [Google Scholar] [CrossRef]
  32. Bradbury, P.J.; Zhang, Z.; Kroon, D.E.; Casstevens, T.M.; Ramdoss, Y.; Buckler, E.S. TASSEL: Software for association mapping of complex traits in diverse samples. Bioinformatics 2007, 23, 2633–2635. [Google Scholar] [CrossRef] [PubMed]
  33. Purcell, S.; Neale, B.; Todd-Brown, K.; Thomas, L.; Ferreira, M.A.R.; Bender, D.; Maller, J.; Sklar, P.; de Bakker, P.I.W.; Daly, M.J.; et al. PLINK: A Tool Set for Whole-Genome Association and Population-Based Linkage Analyses. Am. J. Hum. Genet. 2007, 81, 559–575. [Google Scholar] [CrossRef] [PubMed] [Green Version]
  34. Pritchard, J.K.; Stephens, M.; Donnelly, P. Inference of population structure using multilocus genotype data. Genetics 2000, 155, 945–959. [Google Scholar] [PubMed]
  35. Evanno, G.; Regnaut, S.; Goudet, J. Detecting the number of clusters of individuals using the software structure: A simulation study. Mol. Ecol. 2005, 14, 2611–2620. [Google Scholar] [CrossRef] [PubMed]
  36. Earl, D.A.; vonHoldt, B.M. STRUCTURE HARVESTER: A website and program for visualizing STRUCTURE output and implementing the Evanno method. Conserv. Genet. Resour. 2012, 4, 359–361. [Google Scholar] [CrossRef]
  37. Jakobsson, M.; Rosenberg, N.A. CLUMPP: A cluster matching and permutation program for dealing with label switching and multimodality in analysis of population structure. Bioinformatics 2007, 23, 1801–1806. [Google Scholar] [CrossRef] [PubMed]
  38. Paradis, E.; Claude, J.; Strimmer, K. APE: Analyses of phylogenetics and evolution in R language. Bioinformatics 2004, 20, 289–290. [Google Scholar] [CrossRef] [PubMed]
  39. R Core Team. R: A Language and Environment for Statistical Computing; R Foundation for Statistical Computing: Vienna, Austria, 2017. [Google Scholar]
  40. Poets, A.M.; Mohammadi, M.; Seth, K.; Wang, H.; Kono, T.J.Y.; Fang, Z.; Muehlbauer, G.J.; Smith, K.P.; Morrell, P.L. The Effects of Both Recent and Long-Term Selection and Genetic Drift Are Readily Evident in North American Barley Breeding Populations. G3 (Bethesda) 2015, 6, 609–622. [Google Scholar] [CrossRef]
  41. Wilkinson, S.P.; Davy, S.K. Phylogram: An R package for phylogenetic analysis with nested lists. J. Open Source Softw. 2018, 3, 790. [Google Scholar] [CrossRef]
  42. Filippi, C.V.; Aguirre, N.; Rivas, J.G.; Zubrzycki, J.; Puebla, A.; Cordes, D.; Moreno, M.V.; Fusari, C.M.; Alvarez, D.; Heinz, R.A.; et al. Population structure and genetic diversity characterization of a sunflower association mapping population using SSR and SNP markers. BMC Plant Biol. 2015, 15, 52. [Google Scholar] [CrossRef]
  43. Altendorf, K. Characterization of Field Pennycress (Thlaspi arvense L.) Germplasm for Use as a Cover Crop and Biofuel Feedstock. Master’s Thesis, University of Minnesota, St. Paul, MN, USA, 2017. [Google Scholar]
  44. Alonso-Blanco, C.; Andrade, J.; Becker, C.; Bemm, F.; Bergelson, J.; Borgwardt, K.M.; Cao, J.; Chae, E.; Dezwaan, T.M.; Ding, W.; et al. 1,135 Genomes Reveal the Global Pattern of Polymorphism in Arabidopsis thaliana. Cell 2016, 166, 481–491. [Google Scholar] [CrossRef] [PubMed] [Green Version]
  45. Martin, M.D.; Olsen, M.T.; Samaniego, J.A.; Zimmer, E.A.; Gilbert, M.T.P. The population genomic basis of geographic differentiation in North American common ragweed (Ambrosia artemisiifolia L.). Ecol. Evol. 2016, 6, 3760–3771. [Google Scholar] [CrossRef] [PubMed]
  46. Durka, W.; Bossdorf, O.; Prati, D.; Auge, H. Molecular evidence for multiple introductions of garlic mustard (Alliaria petiolata, Brassicaceae) to North America. Mol. Ecol. 2005, 14, 1697–1706. [Google Scholar] [CrossRef] [PubMed]
  47. Yin, P.; Kang, J.; He, F.; Qu, L.-J.; Gu, H. The origin of populations of Arabidopsis thaliana in China, based on the chloroplast DNA sequences. BMC Plant Biol. 2010, 10, 22. [Google Scholar] [CrossRef] [PubMed]
  48. Koch, M.A.; Kiefer, C.; Ehrich, D.; Vogel, J.; Brochmann, C.; Mummenhoff, K. Three times out of Asia Minor: The phylogeography of Arabis alpina L. (Brassicaceae). Mol. Ecol. 2006, 15, 825–839. [Google Scholar] [CrossRef] [PubMed]
  49. Beck, J.B.; Schmuths, H.; Schaal, B.A. Native range genetic variation in Arabidopsis thaliana is strongly geographically structured and reflects Pleistocene glacial dynamics. Mol. Ecol. 2007, 17, 902–915. [Google Scholar] [CrossRef] [PubMed]
  50. Cho, G.-T.; Lee, J.; Moon, J.-K.; Yoon, M.-S.; Baek, H.-J.; Kang, J.-H.; Kim, T.-S.; Paek, N.-C. Genetic diversity and population structure of Korean soybean landrace [Glycine max (L.) Merr.]. J. Crop Sci. Biotech. 2008, 11, 83–90. [Google Scholar]
  51. Kiang, Y.T.; Chiang, Y.C.; Kaizuma, N. Genetic diversity in natural populations of wild soybean in Iwate Prefecture, Japan. J. Hered. 1992, 83, 325–329. [Google Scholar] [CrossRef]
  52. Baker, H.G. The Evolution of Weeds. Annu. Rev. Ecol. Syst. 1974, 5, 1–24. [Google Scholar] [CrossRef]
  53. Dlugosch, K.M.; Parker, I.M. Founding events in species invasions: Genetic variation, adaptive evolution, and the role of multiple introductions. Mol. Ecol. 2008, 17, 431–449. [Google Scholar] [CrossRef]
  54. Bossdorf, O.; Auge, H.; Lafuma, L.; Rogers, W.E.; Siemann, E.; Prati, D. Phenotypic and genetic differentiation between native and introduced plant populations. Oecologia 2005, 144, 1–11. [Google Scholar] [CrossRef] [PubMed]
  55. Rasmusson, D.C.; Phillips, R.L. Plant breeding progress and genetic diversity from de novo variation and elevated epistasis. Crop Sci. 1997, 37, 303–310. [Google Scholar] [CrossRef]
  56. Glaszmann, J.; Kilian, B.; Upadhyaya, H.; Varshney, R. Accessing genetic diversity for crop improvement. Curr. Opin. Plant Biol. 2010, 13, 167–173. [Google Scholar] [CrossRef] [PubMed] [Green Version]
Figure 1. Bayesian cluster analysis of populations present within 121 pennycress accessions. Population structure was estimated using the STRUCTURE admixture model at K = 2, 3, 4, where K is the number of populations. Each accession is represented by a vertical line, which divided into K colored segments proportional to the likelihood of membership in each population. Populations are labeled below the plot. Accessions with less than 70% membership in a population are considered admixed and are not labeled.
Agronomy 09 00302 g001
Figure 2. Principal component analysis of pennycress accessions using 3947 SNPs. Accessions are colored by the geographic region of the original collection site. Analysis was completed on (A) all pennycress accessions and (B) non-Armenian pennycress accessions. Circles delineate non-Armenian populations P2 and P4 determined by K = 4 STRUCTURE analysis.
Agronomy 09 00302 g002
Figure 3. Principal component analysis of (A) non-Armenian spring pennycress accessions and (B) non-Armenian winter pennycress accessions. Accessions are colored by the latitude of the original collection site.
Agronomy 09 00302 g003
Table 1. Average pairwise diversity within populations and between populations determined by K = 4 STRUCTURE analysis in Figure 1.
.P1P2P3P4Admix
P10.043
P20.320.072
P30.310.40.032
P40.330.110.410.094
Admix0.310.0980.40.110.11

