Article

Field Spectroscopy to Determine Nutritive Value Parameters of Individual Ryegrass Plants

1
Hamilton Center, Agriculture Victoria Research, Hamilton, Victoria 3300, Australia
2
School of Applied Systems Biology, La Trobe University, Bundoora, Victoria 3086, Australia
3
Agriculture Victoria, AgriBio, Centre for AgriBioscience, Bundoora, Victoria 3083, Australia
4
Faculty of Veterinary and Agricultural Sciences, The University of Melbourne, Victoria 3010, Australia
*
Author to whom correspondence should be addressed.
Agronomy 2019, 9(6), 293; https://doi.org/10.3390/agronomy9060293
Submission received: 16 April 2019 / Revised: 27 May 2019 / Accepted: 3 June 2019 / Published: 6 June 2019

Abstract

:
The nutritive value (NV) of perennial ryegrass is an important driver of productivity for grazing stock; therefore, improving NV parameters would be beneficial to meat and dairy producers. NV is not actively targeted by most breeding programs due to NV measurement being prohibitively slow and expensive. Nondestructive spectroscopy has the potential to reduce the time and cost required to screen for NV parameters to make targeted breeding of NV practical. The application of a field spectrometer was trialed to gather canopy spectra of individual ryegrass plants to develop predictive models for eight NV parameters for breeding programs. The targeted NV parameters included acid detergent fibre, ash, crude protein, dry matter, in vivo dry matter digestibility, in vivo organic matter digestibility, neutral detergent fibre, and water-soluble carbohydrates. The models were developed with partial least square regression. Model predicted ranking of plants had R2 between (0.87 and 0.39) and lab rankings of highest preforming plants. The highest ranked plants, which are generally the selection target for breeding programs, were accurately identified with the canopy-based model at a speed, cost and accuracy that is promising for NV breeding programs.

1. Introduction

For Australian and New Zealand dairy producers, the availability of high quality pasture is a requirement for remaining competitive in global markets [1]. Perennial ryegrass is the dominant forage pasture for temperate regions, due to its high nutritive value (NV) and tolerance of grazing [2,3]. NV refers to multiple traits which contribute to the amount of energy and nutrients that can be obtained by grazing stock, thereby contributing towards the total liveweight gain or milk production of the animals [3]. There is some disagreement on the relative importance of various traits but most forage scientists agree that important traits include cell wall constituents such as acid detergent fibre (ADF), neutral detergent fibre (NDF), as well as the dry matter percentage (DM), crude protein (CP), in vivo dry matter digestibility (IVVDMD), in vivo organic matter digestibility (IVVOMD) and water soluble carbohydrates (WSC) [4,5,6,7,8,9,10]. Improvement of these NV traits would increase the amount of nutrition available for stock without increasing the yield and would decrease the need for costly supplements. Despite the economic importance of NV, the difficulties in screening parameters have limited perennial ryegrass breeding programs actively targeting NV traits [9,11,12].
The biggest obstacle for improvement of NV is the expense and time required for analysis, which currently entails destructive harvesting and preparation for lab-based methods, demanding high human labour [13,14,15]. This presents a problem considering large amounts of analysis are required for breeding programs due to the quantitative genetics of the traits and several aspects of perennial ryegrass biology [16]. Perennial ryegrass is prone to inbreeding depression; therefore, a large breeding pool is needed to maintain the necessary genetic diversity while at the same time increasing desired alleles [17,18]. Breeding for NV requires a throughput of phenotyping that is not practical with the traditional methods of NV analysis [17,19]. Currently, wet chemistry and lab-based spectroscopy are the industry standards for the prediction of NV parameters in forage. Lab-based near-infrared spectroscopy (NIRS) has been determined to be a reliable measure of ADF, ash, CP, IVVDMD, IVVOMD, NDF and WSC in perennial ryegrass [20,21]. Though NIRS is relatively fast and efficient compared to wet chemistry, the transport and preparation for lab analysis renders NV analysis prohibitively expensive for large breeding populations [22,23]. Forage samples are oven dried and ground to a fine powder before NIRS, this requires destructive harvesting of samples and as well as handling and transport. Grinding has high labour requirements due to the process of cleaning grinding machinery between samples to prevent contamination [24]. Canopy spectra, or spectra captured directly from the growing plants, can be collected without destructive harvesting, transport or sample preparation removing much of the human labour. Platforms for automation, such as vehicles and drones, can be incorporated to further reduce time and cost [25].
Field-based canopy spectra are not without challenges; compared to the dried, ground samples, the sample presentation and field conditions include higher noise, or spectral signals not relating to the biophysical parameters of the ryegrass [26,27]. Atmospheric turbidity has a profound influence on solar radiance and must be considered if sunlight is used as the energy source for spectroscopy [28]. Lack of sample preparation also introduces noise, as the drying and grinding of samples for lab-based NIRS are important for improving accuracy and robustness of the technique [29]. When spectral collection is in situ, the variation in leaf size, shape and illumination create optical phenomena which are a large source of noise [30]. Multiple scattering occurs due to energy reflected by multiple leaves of various length and width at different inclinations to the energy source and reflectance from neighbouring material [30]. When using canopy spectra the background variation must be overcome with preprocessing, data mining algorithms and model building [30]. There are many techniques for finding meaningful information within data with high levels of background variation [31,32]; such as response linearisation which apply logarithmic transformation, baseline corrections, derivatives which can enhance peaks and troughs [33]. To find the meaningful patterns in spectra, it is vital that the necessary range and resolution of the electromagnetic spectrum is captured. When measuring some plant traits, broad bandwidths may be used to develop simple regression equations or vegetation indices. For complex traits like NV finding relationships between reflectance spectra and internal biochemical parameters of plants requires high spectral range and spectral resolution [34,35]. The need for high spectral range and resolution may limit the platforms for data collection to ground-based options at this stage. Studies that have used ground-based sensors have produced models with high predictive ability for NV traits in crops compared to aerial systems [1,36,37,38].
This paper will examine the feasibility of using canopy spectra to make predictions about NV parameters for individual perennial ryegrass plants in a large breeding pool. The predictive ability of models created with canopy spectra will be tested by comparing predicted results with laboratory results for eight NV parameters ADF, ash, CP, IVVDMD, IVVOMD, NDF and WSC. If this method provides a way of ranking large numbers of individual ryegrass plants for these eight NV parameters, it may be possible to improve NV through selective breeding programs.

2. Materials and Methods

The canopy spectra were collected using a portable spectrometer that can be field deployed, the ASD FieldSpec 4 ® (Boulder, CO, USA). Methods for controlling and eliminating solar radiation and other environmental variances, to reduce day-to-day variation were applied. The approach aims to create predictive models to nondestructively assess the NV of ryegrass plants in a rapid manner to enable plant breeding to deliver gains for this important trait. Canopy spectra from a field trial of perennial ryegrass were captured throughout the various growth stages of the crop, a subset of the plants were then analyzed for NV parameters in the laboratory [39]. This data was used to create predictive models based on canopy spectra that were then used to predict NV parameters in the remaining plants.

2.1. Sample Population and Study Area

The study was conducted on a trial site situated in Hamilton Victoria Australia (-37.819460: 142.062250) [40]. The plants used in this experiment are part of a field study for genomic subselection (GSS). The GSS field trial has 50 breeding cultivars of perennial ryegrass, each cultivar is grown in plots of three lines of 32 plants, 96 plants per plot (Figure 1). All 50 plots are replicated ten times to allow for environmental variance [40]. A library of perennial ryegrass spectra and lab analyzed NV parameters was created to begin building predictive models. This required both canopy reflectance and destructive harvests for lab analysis of the same plants. For this field trial destructive harvests were conducted whenever the plants reach a three-leaf growth stage as both maintenance of vegetative growth and to collect plant material for analysis in various studies. The harvests were approximately once a month in the spring and less often in winter and autumn. In summer, the grass goes into a dormancy phase so does not require harvesting. The lines that were included for developing the predictive model were chosen due to their inclusion in a genomic subselection study. Having genotypic and phenotypic data for the same plants will be useful in future research.
The number of plants harvested for lab analysis varied, due to several factors; weather, technical issues with the new equipment and constraints set by other experiments conducted on the field trial. In September, spectra from genotype A were captured; however, the destructive harvest was not able to be incorporated for lab results due to conflicts with other experiments; for this reason it was decided this genotype should not be used in future and genotype B and genotype C were selected for use instead. In total, 1704 plants were measured for canopy reflectance spectra, and a subset of 190 were analyzed for NV parameters in the laboratory (Table 1).

2.2. Spectral Collection

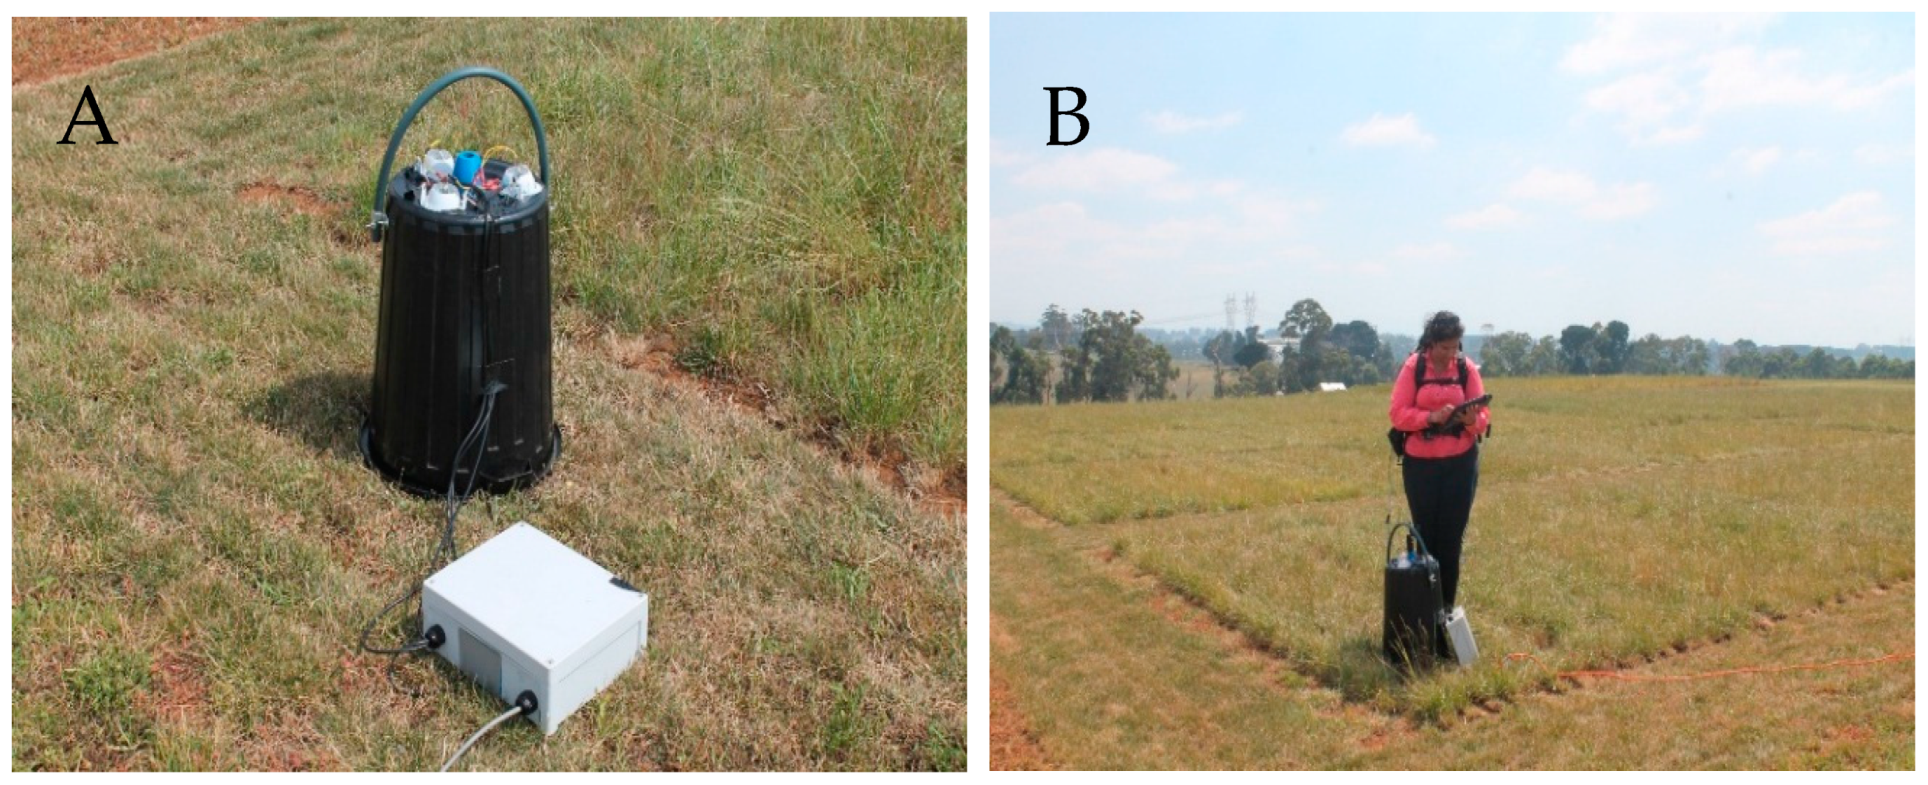
Ryegrass plants were sampled using the ASD FieldSpec® HiRes 4, and spectra was collected from 23rd August 2018 to 30th November 2018 (winter–spring). The ground field of view was at nadir using a fitted attachment to hold the sensor at a uniform angle and height, with a spirit level to insure the sensor was always level. Whole plants were measured under a light shield for excluding spectral signals from sunlight, atmosphere and the surroundings. An inverted plastic bin painted with mat black paint (black 2.0) was used to exclude natural light, three 50-watt, 12-volt, tungsten halogen lamps providing wavelengths ranging from 300–2500 nm were fitted inside the bin to provide the light source (Figure 2A). The spectrometer was fitted with a 10° lens, scrambler and pistol-grip attachment and was calibrated using a Spectralon® white reference panel on an adjustable tripod to keep it level. The white reference panel was placed under the light shield with the light source during calibration. The bin was placed over each individual plant, blocking sunlight, a skirt of black fabric around the rim of the bin prevented light from entering gaps left by uneven ground (Figure 2B). The lens of the FieldSpec was inserted into a hole in the bin, between the lights. Once the lens was inserted, 50 measurements of reflectance spectra were collected and averaged using ASD RS3™ Software. The plant was then harvested using hand shears, cutting the plant at 5 cm from the ground.

2.3. Laboratory Analysis

Individual plants were harvested for laboratory analysis at each harvest, all plants were unique genotypes from four breeding lines B, D, E, and F. Some plants were dead or did not produce enough biomass for laboratory analysis and these sample were discarded. The total number of lab-analyzed plants was 190 for the four destructive harvests. The plant tissue was weighed, then oven dried at 60 °C for 48 hours, and ground in a Foss cyclone grinder with a 1 mm grating [29,41]. The sample were analyzed for eight NV parameters using a Foss NIRSTM XDS rapid content analyzer (HillerØd, Denmark). This data was then used to create predictive models for each NV parameter; ADF, ash, CP, DM, IVVDMD, IVVOMD, NDF, and WSC.

2.4. Model Building

The samples collected from August to October (159) of ryegrass with both spectra and lab results were split 70/30 into a calibration (109) and validation set (50). The spectra were preprocessed using intrasoft international® software WinISI 10.1. The resolution was reduced to from 1 nm to 2 nm to reduce dimensionality and two rounds of smoothing were applied with a gap of 8 nm. Various scatter corrections were tested to determine the best for each parameter, these included standard normal variant (SNV), detrend, standard multiplicative scatter correction MSC, weighted MSC, Inverse MSC, scale and offset, scale and linear, scale and quadratic, and derivative, scale and offset. For each model a range of derivatives were tested, none, 1st, 2nd and 3rd derivatives were applied to the spectra to find the best option for modelling for each parameter. Three types of linear dimensionality reduction were then trialed for building the models; principal component analysis (PCA), partial least squares regression (PLSR) and modified partial least squares regression (MPLSR). The water bands and areas of high variability at the beginning and end of the spectra were removed, originally the range covered 350–2500 nm but was cut into three smaller bandwidths 454–1359 nm, 1425–1828 nm, and 1970–2450 nm. These predictive models were created with samples from the 24th of the August 2018 to the 12th of October 2018 using four genotypes B, D, E, and F. Plants were also sampled in November but at this point in the plants growth cycle they were reproductive, and it was expected they may not fit the same model as plants in the vegetative stage.
Hundreds of predictive models were created to try each combination of preprocessing and dimensionality reduction but only the models with the highest predictive statistics were selected. The predictive models were evaluated using statistical measures R2 (coefficient of determination), the t statistic or standard error of covariance (SEC), standard error of prediction (SEP) and standard error of prediction covariance (SEPC). Models were also validated by splitting the data into a calibration set which was used to build the models, and a validation set which was used to test the predictive ability of the models. This was done by first using PCA to create score files for each sample, then an algorithm within the WinISI software was used to split the data. The same statistic measurements were used to evaluate the predictive ability in validation of the models R2, SEC, SEP and SEPC. The predictive ability of models was also confirmed by ranking each sample for how high or low the plant was in each NV parameter based on the model and lab values then compared the ranking.

3. Results

3.1. PLS Models Descriptive Statistic

Table 2 shows the cross-validation statistic of the eight NV predictive models created using this calibration set using the leave-one-out method. The cross validation of the models showed high r2 between 0.79 and 0.98, and acceptable SEC, SEP and SEPC, all being under 2, except for WSC, NDF and DM which were under 3 (Table 2). The number of wavelengths used in developing these models was 887 for each model but the number of samples included in the calibration varied for each parameter from 103 to 105 out of a possible 109. For all parameters the most successful models used MPLSR as the regression technique and took the first derivative. For ADF the most successful pretreatment had no scatter correction (Table 2), for ash weighted MSC was the best scatter correction (Table 2), for CP the scatter correction was derivative, remove, scale and offset (Table 2), for DM the scatter correction was SNV, IVVDMD used derivative, scale and offset (Table 2), IVVOMD used remove, scale and quadratic (Table 2), NDF used SNV and for WSC the scatter correction was standard MSC (Table 2).
Table 2. Statistics from model created with 70% of the 109 samples with both lab results and spectra (cross validation leave-one-out). Statistics include the mean, standard deviation (SD), the estimated minimum (Est.Min) and maximum (Est.Max), standard error of covariance (SEC), standard error of prediction (SEP) the coefficient of determination (R2), and standard error of prediction covariance (SEPC) and the number of wavelengths included in the model (λN).
StatisticADFASHCPDMIVVDMDIVVOMDNDFWSC
Scatter correctionnoneweighted MSCderivative scale & offsetSNVderivative scale & offsetremove, scale & offsetSNVMSC
Derivative, gap, smooth 1, smooth 21,8,1,11,8,1,11,8,1,11,8,1,11,8,1,11,8,1,11,8,1,11,8,1,1
Samples (N)103102105103104104104105
Mean24.429.8211.5924.6376.7772.8946.1724.25
SD1.591.963.382.942.732.133.542.87
Est. Min19.653.941.4415.8168.5866.4835.5615.63
Est. Max29.2015.7121.7433.4684.9679.2956.7832.87
SEC0.730.460.661.180.780.741.470.44
R20.790.950.960.840.920.880.830.98
SEPC1.370.981.382.111.691.562.872.46
λN887887887887887887887887
The models with the most promising cross validation statistics were tested with the 30% validation set of 50 samples, that were independent from those used in the model building. The models did not perform as well with independent samples with R2 ranging from 0.11 to 0.74 (Table 3).
Table 3. Statistics from comparing results predicted with the above-mentioned models compared to lab results of 50 independent samples. This includes the slope of the regression line, the y-intercept, the bias, standard error of covariance (SEC), standard error of prediction (SEP) and standard error of prediction covariance (SEPC), the coefficient of determination (R2), the predicted and actual average, and the predicted and actual standard deviation (SD).
StatisticADFashCPDMIVVDMDIVVOMDNDFWSC
N5050505050505050
Slope0.750.720.840.540.950.870.680.50
Y-intercept6.013.002.1010.804.509.4214.2812.18
Bias−0.070.310.26−0.440.330.07−0.660.18
SEC1.281.401.842.851.521.392.852.86
SEP1.271.511.912.951.531.383.033.03
SEPC1.281.491.922.951.511.392.993.06
R20.220.510.740.110.690.520.350.64
Predicted ave24.349.7311.5924.3276.5272.9446.5923.98
Actual ave24.2710.0311.8623.8876.8573.0145.9424.16
Predicted SD0.881.953.691.812.391.633.042.30
Actual SD1.431.983.602.992.721.983.503.06
The models reduced predictive perform compared to internal cross validation when used to predict independent samples may suggest the models are overfitted. The model may require more training data to help find patterns relating to NV amongst the background variation from interference.

3.2. Robustness of the Predictive Model

Towards the end of October, the plants transitioned from vegetative to reproductive with the emergence of inflorescence. This resulted in significant physiological differences in the plants and high variation in spectral signatures. The field models’ predictions of all parameters failed to show any significant correlation to lab parameters (Table 4). The reproductive samples collected on the 30th of November 2018 were excluded from this study with the intent of creating a second calibration for plants that have become reproductive. This includes 94 canopy spectra and 30 lab results.

3.3. Predictive Ability of Field Model

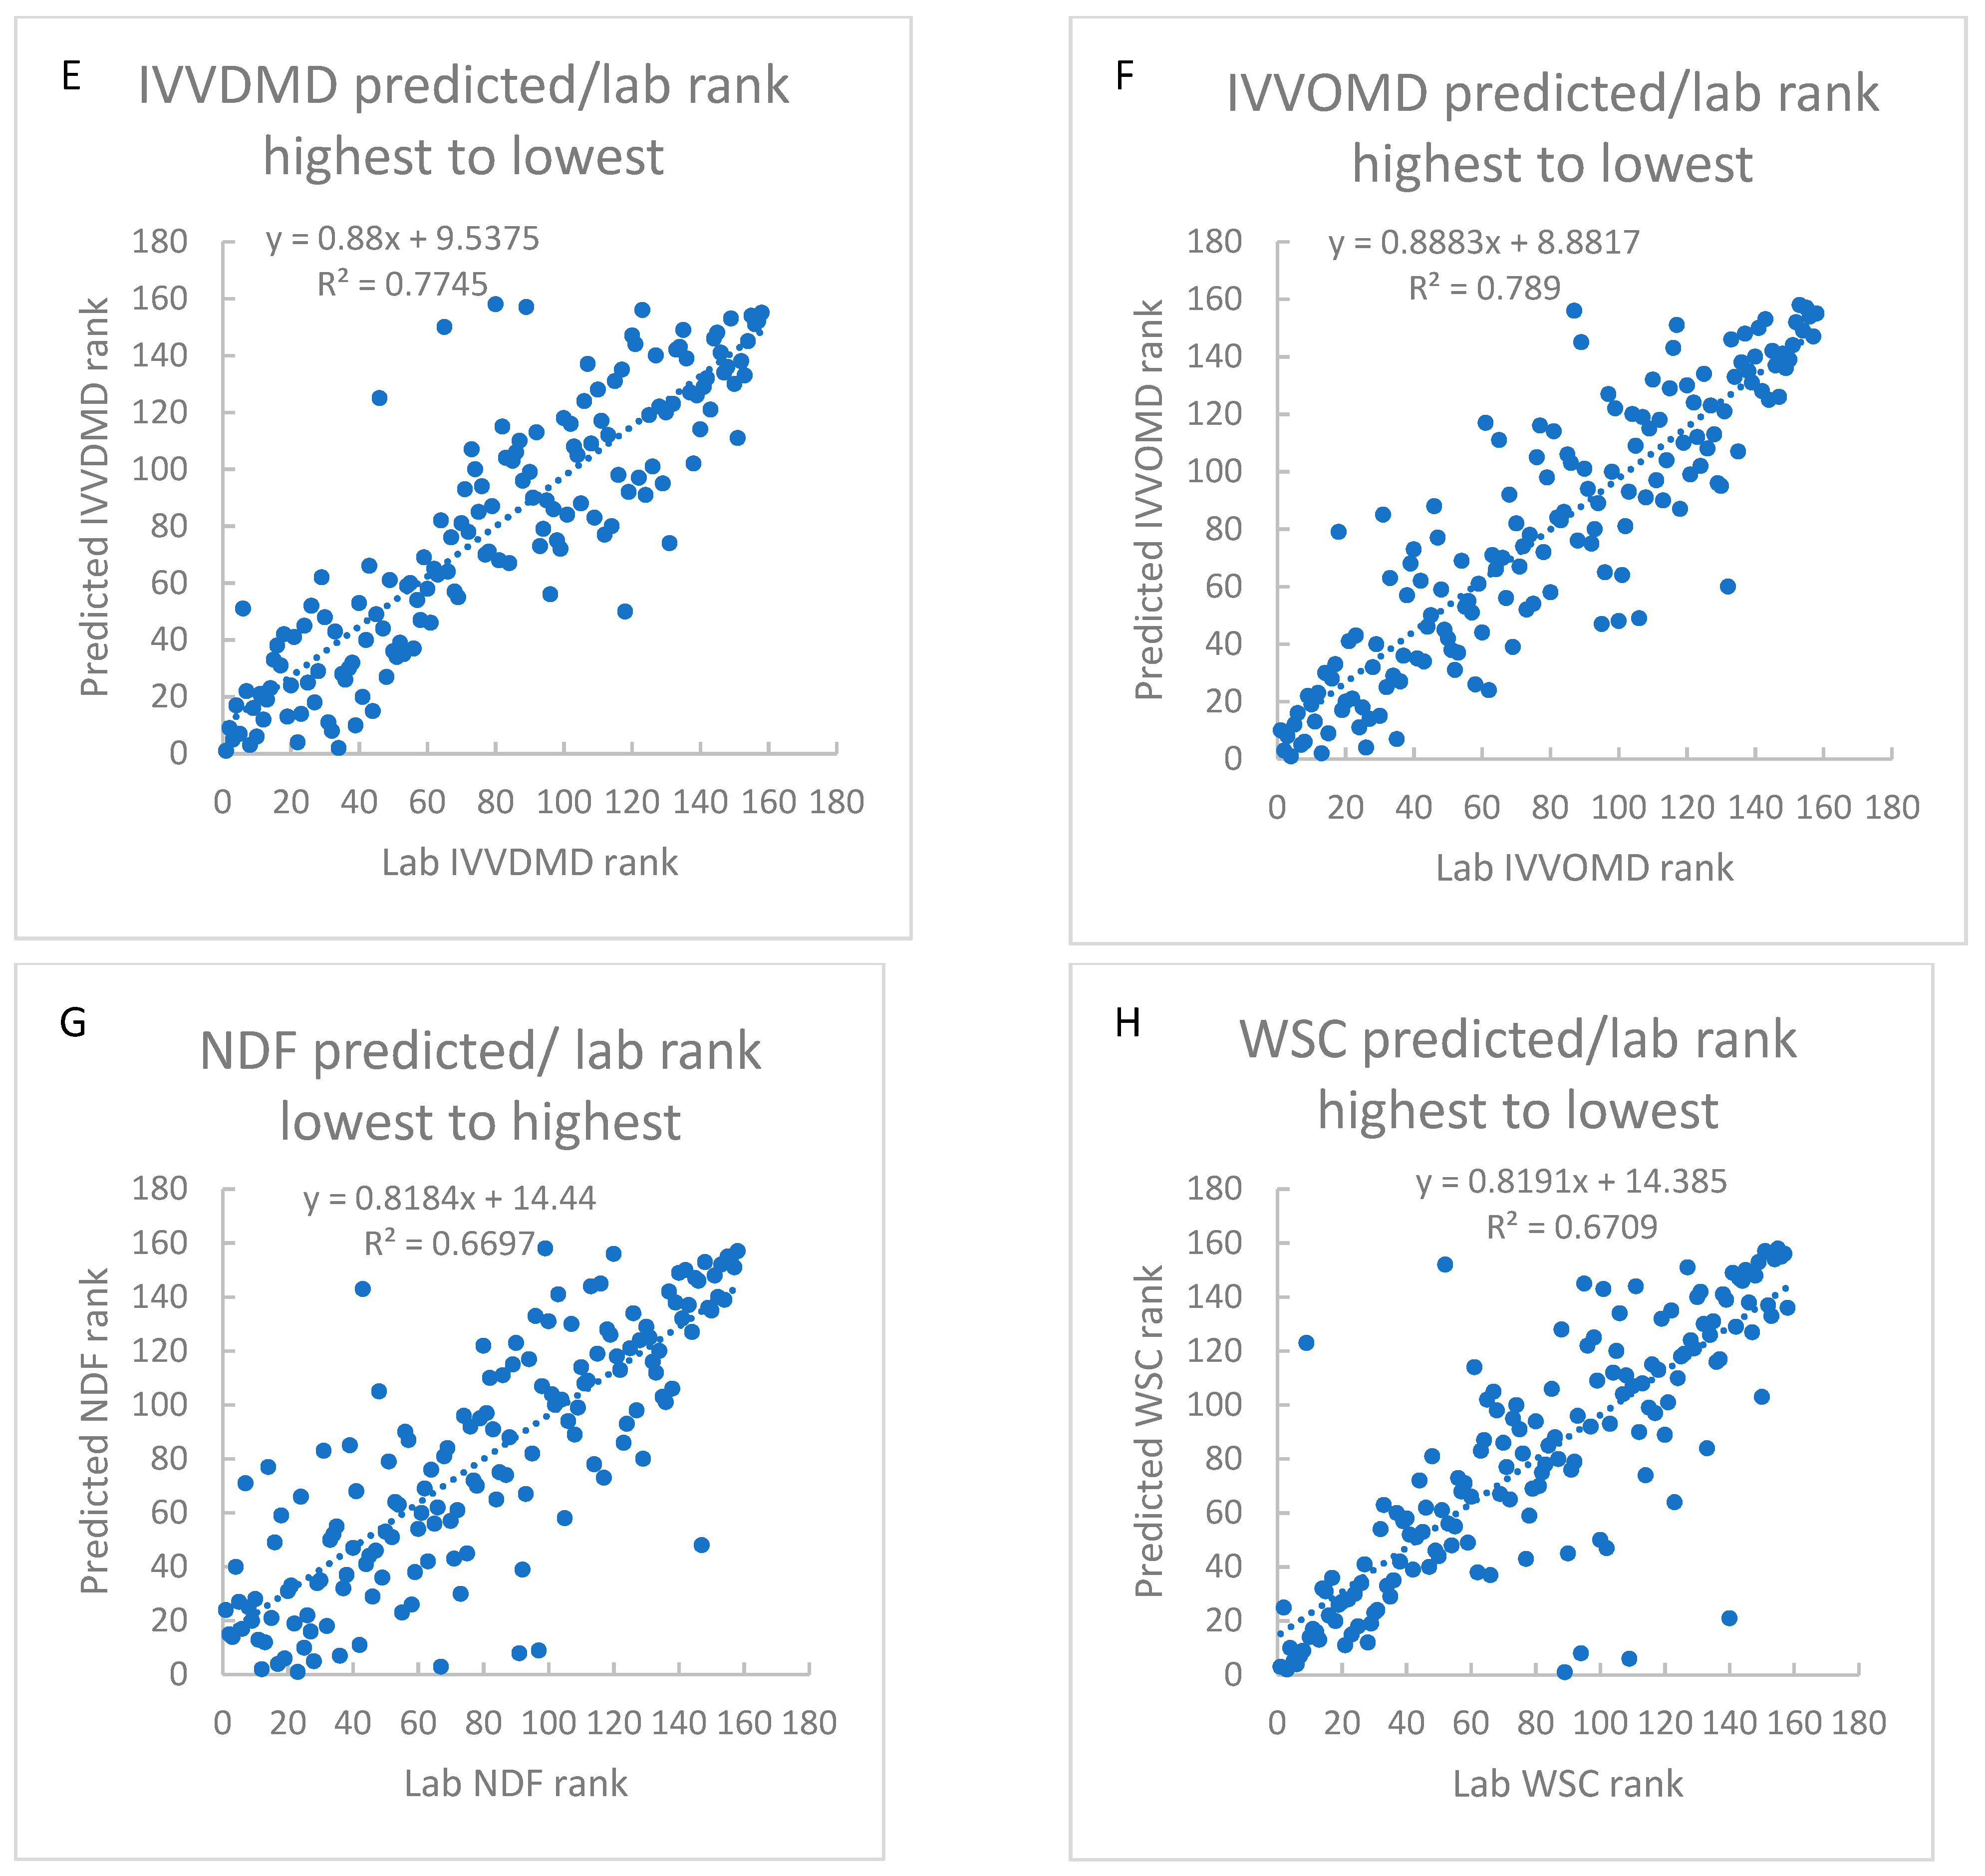
The predictive abilities of these models were first tested by using the field model to predict NV parameters then comparing the predicted values to lab-based NIRS. Plant samples were assigned a ranking based on the lab analysis. For some traits, improvement would mean reduction if the trait is a barrier to digestion, and these were ranked lowest to highest so that, for example, the plant with the lowest ADF was ranked number one for ADF. These traits included ADF, ash and NDF. The remaining traits increases productivity and were ranked highest to lowest, for example the plant with the highest WSC was ranked number one for WSC. The rankings were repeating using NV values from the predictive models. This illustrated the performance of predictive models for ranking each plant compared to lab results. The following graphs show the predictive ability of the models for the eight NV parameters, ADF, ash, CP, DM, IVVDMD, NDF, IVVOMD, and WSC (Figure 3).

3.4. Prediction of NV Parameters in Plants Using the Field Model

This method of sampling allowed for capturing spectra of 480 plants per day with two people working standard hours. The previously developed models allowed for processing of this spectra into predictions of the eight NV parameters for all plants that had been measured for canopy spectra; between August and October, this included 1610 plants. All traits showed normal distributions, the top percentile plants for each trait was easily identified (Table 5).

4. Discussion

4.1. Predictive Model Performance

When creating predictive models for pasture NV parameters Pullanagari et al. (2012) achieved R2 for CP of 0.72, ADF of 0.59, NDF of 0.45, ash of 0.67, and organic matter digestibility (OMD) if 0.76 [36]. The models created in this study had lower predictive ability than the models developed by Pullanagari. This may have been due to this higher temporal range of data, with sample collections happening between August and October (winter–spring). In Pullanagari’s study, samples were collected between April and May (Autumn) [1,36]. The difficulty in combining more than one growth stage within a single predictive model has been previously documented, with large changes in parameters from the vegetative state to the reproductive state making it difficult to create robust models [21,27]. Though plants that had fully transitioned into the reproductive phase were removed from this calibration, many of the samples from October were beginning to transition, with plants elongating and therefore having a higher stem to leaf ratio. Using only samples from within the same month or two months may show higher predictive ability; however, this model was intended to be robust, covering the greatest length of a growing season as possible while still making appropriate choices for selection. Predictions may prove to be more accurate if models are developed for every two months, but for the purposes of selection of the top 10% for each parameter, the current models are adequate.
The models created in this study did not perform as well with independent samples as they did in the cross validation, with R2 of 0.22 for ADF, 0.11 for DM, 0.35 for NDF and 0.14 for WSC (Table 3). There was some concern that the WSC models would be affected by changing WSC throughout the day as WSC levels are lower at night and early morning. This could be an explanation as to why the WSC models did not perform well; however, no significant relationship (R2 0.01) between time of day and WSC was detected. Models did perform well for ash with an R2 of 0.51, CP with R2 of 0.74, IVVDMD with R2 of 0.69, and IVVOMD with R2 0.52. The models were created with the aim of providing a tool for selection in breeding programs, it was expected to have a degree of accuracy sacrificed for the speed and efficiency needed to measure the large numbers required for improvement of NV through traditional breeding programs. This system showed a high degree of correlation between the rankings of individual plants for each parameter except for DM, with R2 between lab rankings and model rankings between 0.67 and 0.87. Though DM did not have a significant R2 (0.39), when the model was used to select the top 10% highest DM plants and this selection was compared to the top 10% selected using lab results, the same plants were selected 80% of the time. The plants at either end of the model generally are identified by the model as being in the top or bottom percentile, it is the middle plants with less variability that failed to match lab results. This is an advantage as it is these percentiles that are targeted in breeding programs [42].

4.2. Interaction Between Parameters

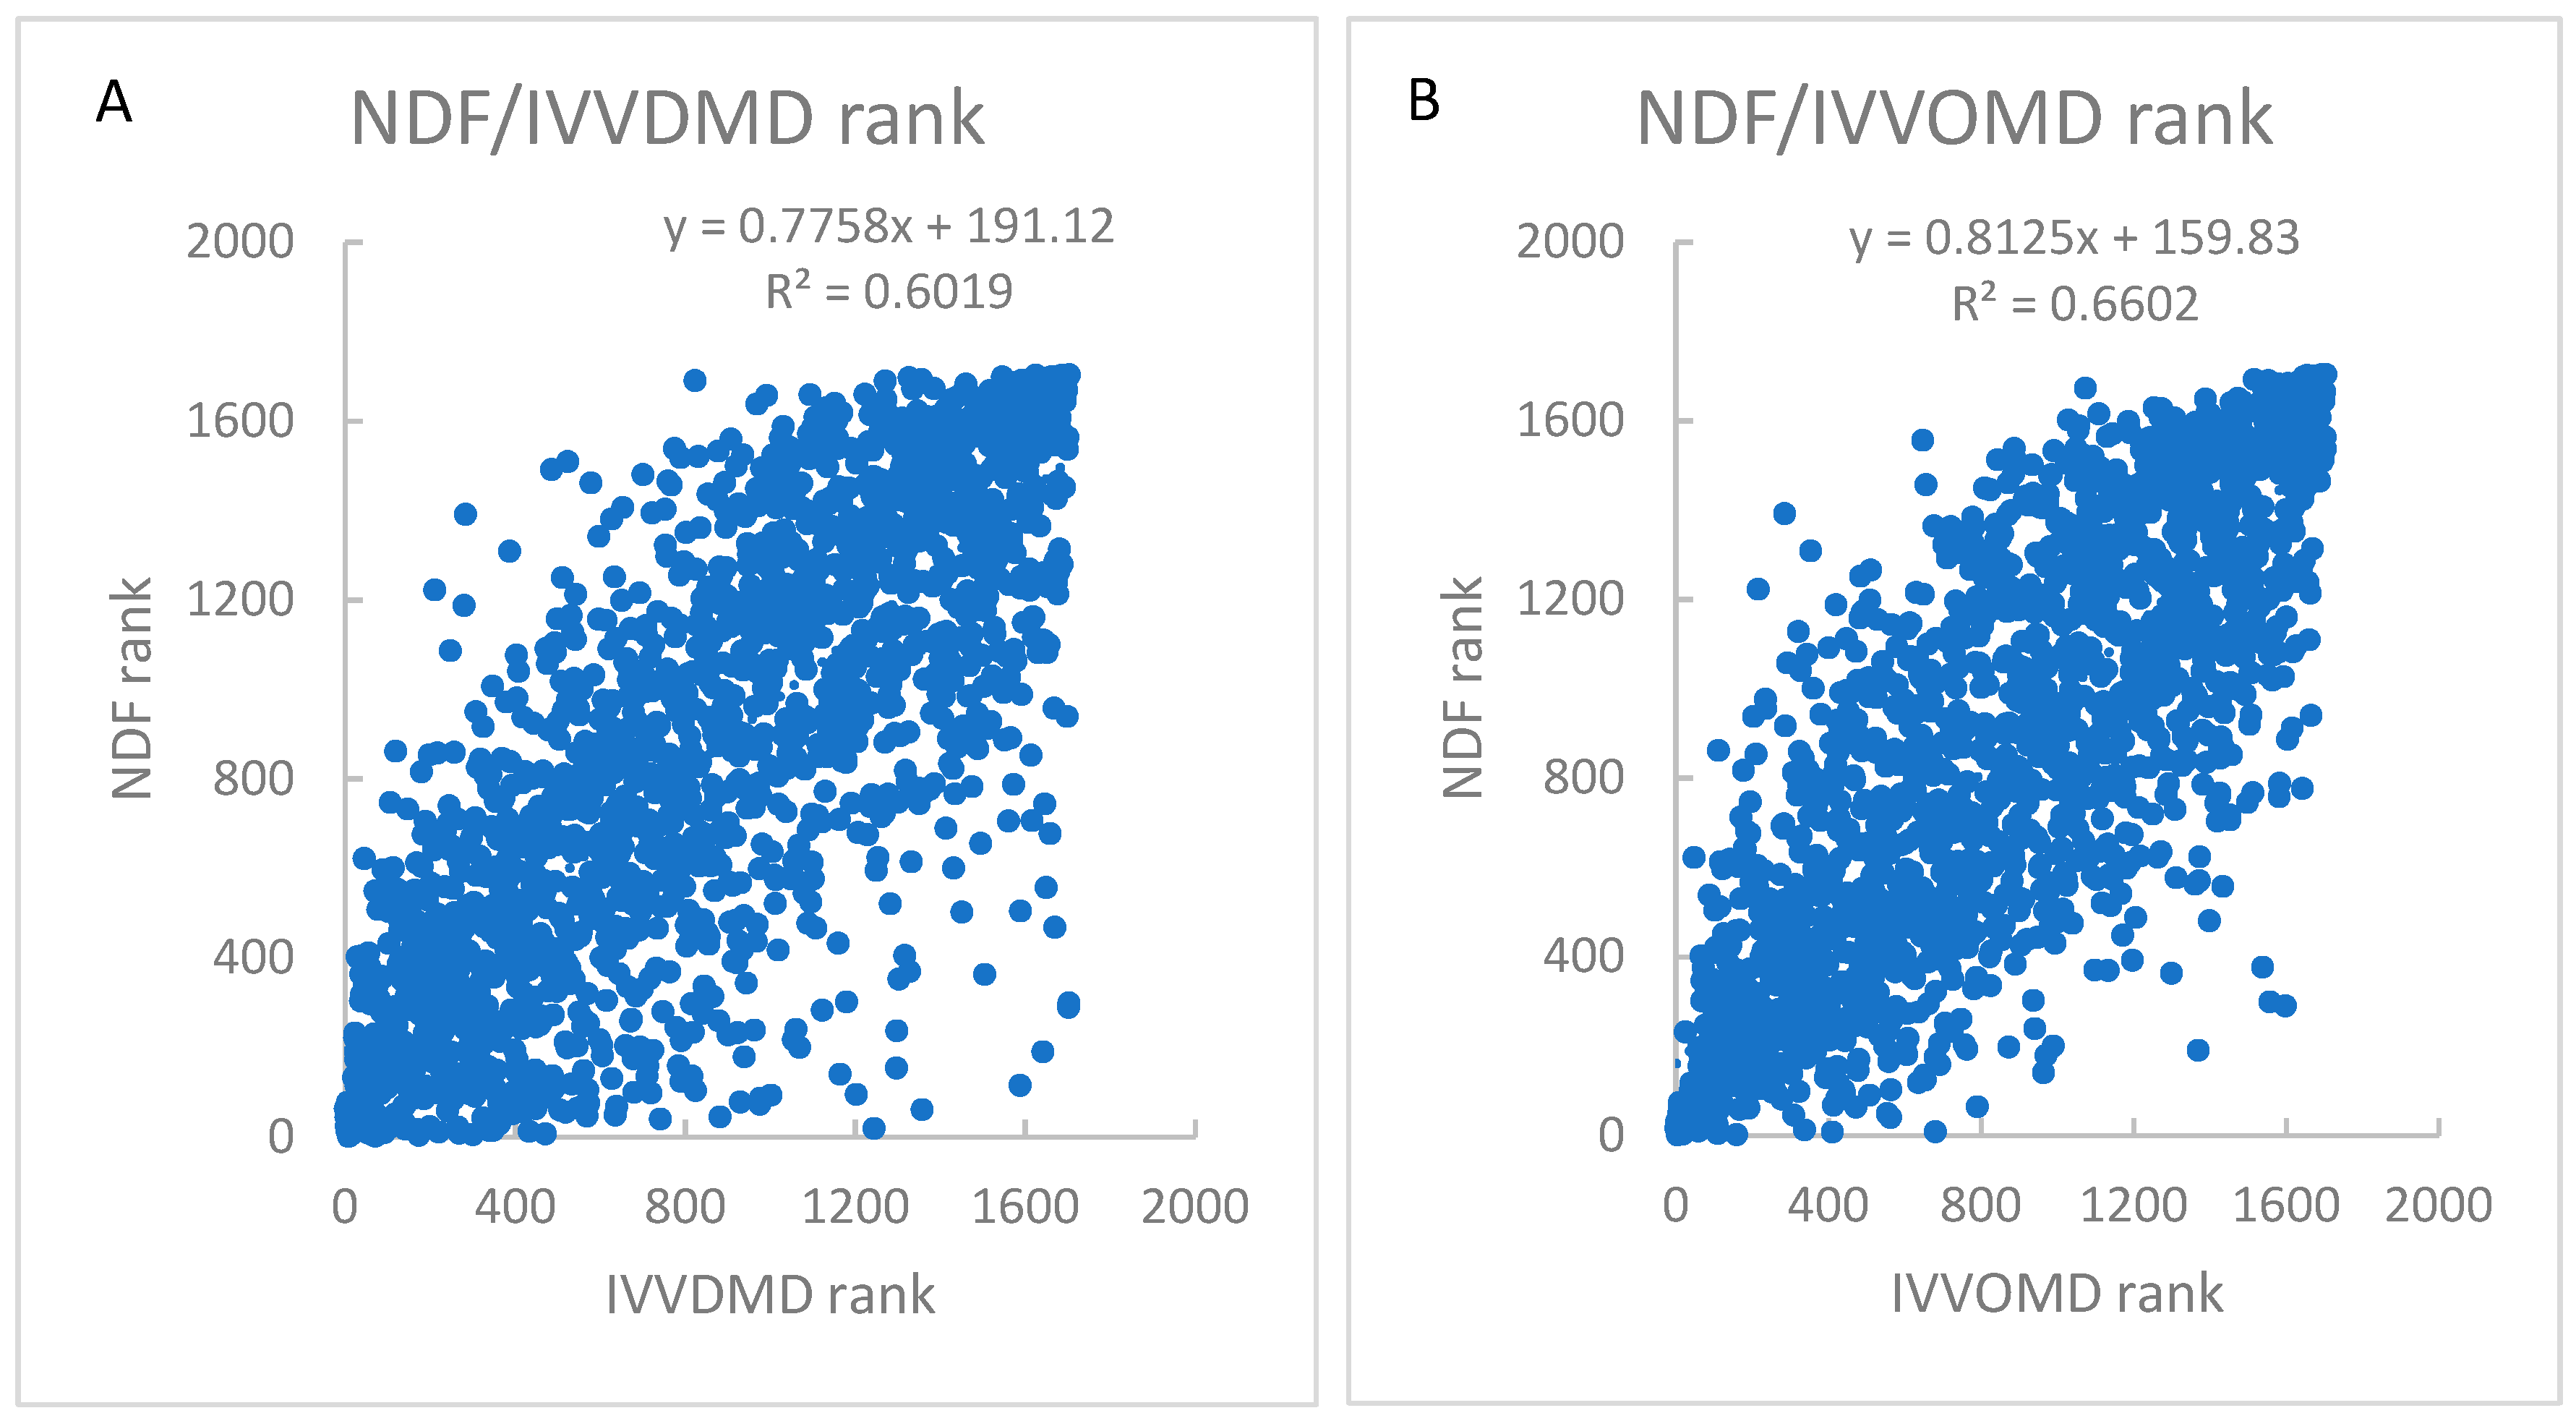
Though these models could be utilized to select for improvement for individual traits, ideally multiple traits could be selected for at once. Unfortunately, there is no system for ranking pasture that utilizes measures of all eight NV parameters combined, such as the AFIA rubric for grading hay and silage [43]. There was no significant relationship between most parameters except for NDF, which showed a negative correlation to IVVDMD R2 of 0.534 and IVVOMD R2 0.692 (Figure 4). The rankings for these parameters also showed correlations with R2 of 0.61 and 0.66 (Figure 5). This makes it possible to select plants that both rank low in NDF and high in digestibility. For the other parameters, it would be useful to assign weights to the different parameters and create a rubric for overall NV.

5. Conclusions

This system has demonstrated a degree of confidence in prediction to be effectively used for selection of individuals for improvement of NV parameters. This method of field spectroscopy was able to predict eight NV parameters with an accuracy comparable to lab-based spectroscopy but with a significant increase in speed. This allowed for processing of 1610 samples with low human labor in comparison to a lab-based approach. The speed of the system could be further improved with the addition of automation; for example, with the addition of a plant and ground-based vehicle to transport the sensor and robotics to lift and lower the light-shield and a GPS navigation system to locate specific plants. The current system without further development would enable hundreds to thousands of samples to be routinely measured to further understand changes of pasture quality over time and response to the environment. This will deliver more detailed understanding than has been realistically been possible to achieve previously. The frequency of measurement of this method allows one to examine how NV parameters change over time and respond to environmental changes such as rain and heat waves. Measuring a greater number of genotypes would also provide valuable information about the breeding lines, especially if these plants are also genotyped.

Author Contributions

Conceptualization, C.S. and K.S.; methodology, C.S., K.S., P.B., & N.C.; software, C.S.

Funding

This research was funded by Agriculture Victoria, Dairy Australia and the Gardiner Foundation.

Acknowledgments

Many thanks to Carly Elliot, Andy Phelan, Alem Gebre, Junping Wang, Chinthaka Jayasinghe, Jess Frankel, Peter Hardy, Darren Keane, Miceala Murry, Simone Rochfort, Darren Pickett, Elly Polonowita, Greg Mason, and Russell Elton.

Conflicts of Interest

The authors declare no conflict of interest.

References

  1. Pullanagari, R.; Yule, I.; Tuohy, M.; Hedley, M.; Dynes, R.; King, W. In-field hyperspectral proximal sensing for estimating quality parameters of mixed pasture. Precis. Agric. 2012, 13, 351–369. [Google Scholar] [CrossRef]
  2. Tas, B.M.; Taweel, H.Z.; Smit, H.J.; Elgersma, A.; Dijkstra, J.; Tamminga, S. Effects of perennial ryegrass cultivars on intake, digestibility, and milk yield in dairy cows. J. Dairy Sci. 2005, 88, 3240–3248. [Google Scholar] [CrossRef]
  3. Smith, K.F.; Reed, K.F.M.; Foot, J.Z. An assessment of the relative importance of specific traits for the genetic improvement of nutritive value in dairy pasture. Grass Forage Sci. 1997, 52, 167–175. [Google Scholar] [CrossRef]
  4. Badenhorst, P.; Panter, S.; Palanisamy, R.; Georges, S.; Smith, K.; Mouradov, A.; Mason, J.; Spangenberg, G. Molecular breeding of transgenic perennial ryegrass (Lolium perenne L.) with altered fructan biosynthesis through the expression of fructosyltransferases. New Strateg. Plant Improv. 2018, 38, 1–13. [Google Scholar] [CrossRef]
  5. Starks, P.; Zhao, D.; Phillips, W.; Coleman, S. Development of canopy reflectance algorithms for real-time prediction of bermudagrass pasture biomass and nutritive values. Crop Sci. 2006, 46, 927–934. [Google Scholar] [CrossRef]
  6. Stewart, A.; Hayes, R. Ryegrass breeding—Balancing trait priorities. Ir. J. Agric. Food Res. 2011, 50, 31–46. [Google Scholar]
  7. Chapman, D.; Edwards, G.; Stewart, A.; McEvoy, M.; O’Donovan, M.; Waghorn, G. Valuing forages for genetic selection: What traits should we focus on? Anim. Prod. Sci. 2015, 55, 869–882. [Google Scholar] [CrossRef]
  8. Surmen, M.; Yavuz, T.; Albayrak, S.; Cankaya, N. Forage yield and quality of perennial ryegrass (Lolium perenne L.) lines in the black sea coastal area of turkey. Turk. J. Field Crop. 2013, 18, 40–45. [Google Scholar]
  9. Casler, M.; Vogel, K. Accomplishments and impact from breeding for increased forage nutritional value. Crop Sci. 1999, 39, 12–20. [Google Scholar] [CrossRef]
  10. Vogel, K.; Gabrielsen, B.; Ward, J.; Anderson, B.; Mayland, H.; Masters, R. Forage quality, mineral constituents, and performance of beef yearlings grazing two crested wheatgrasses. Agron. J. 1993, 85, 584. [Google Scholar] [CrossRef]
  11. Buxton, D.R. Quality-related characteristics of forages as influenced by plant environment and agronomic factors. Anim. Feed Sci. Technol. 1996, 59, 37–49. [Google Scholar] [CrossRef]
  12. Casler, M.D. Breeding forage crops for increased nutritional value. Adv. Agron. 2001, 71, 51–107. [Google Scholar]
  13. White, J.W.; Andrade-Sanchez, P.; Gore, M.A.; Bronson, K.F.; Coffelt, T.A.; Conley, M.M. Field-based phenomics for plant genetics research. Field Crop. Res 2012, 133, 101–112. [Google Scholar] [CrossRef]
  14. Fahlgren, N.; Gehan, M.A.; Baxter, I. Lights, camera, action: High-throughput plant phenotyping is ready for a close-up. Curr. Opin. Plant Biol. 2015, 24, 93–99. [Google Scholar] [CrossRef] [PubMed]
  15. Thulin, S.M. Hyperspectral Remote Sensing of Temperate Pasture Quality; RMIT University Melbourne: Melbourne, Australia, 2008. [Google Scholar]
  16. Pembleton, L.W.; Inch, C.; Baillie, R.C.; Drayton, M.C.; Thakur, P.; Ogaji, Y.O.; Spangenberg, G.C.; Forster, J.W.; Daetwyler, H.D.; Cogan, N.O. Exploitation of data from breeding programs supports rapid implementation of genomic selection for key agronomic traits in perennial ryegrass. Theor. Appl. Genet. 2018, 131, 1891–1902. [Google Scholar] [CrossRef] [Green Version]
  17. Wilkins, P. Breeding perennial ryegrass for agriculture. Euphytica 1991, 52, 201–214. [Google Scholar] [CrossRef]
  18. Humphreys, M.O. Genetic improvement of forage crops past, present and future. J. Agric. Sci. 2005, 143, 441–448. [Google Scholar] [CrossRef]
  19. Ruckelshausen, A.; Biber, P.; Dorna, M.; Gremmes, H.; Klose, R.; Linz, A.; Rahe, F.; Resch, R.; Thiel, M.; Trautz, D. Bonirob: An autonomous field robot platform for individual plant phenotyping. Precis. Agric. 2009, 9, 1. [Google Scholar]
  20. Smith, K.F.; Simpson, R.J.; Armstrong, R.D. Using near infrared reflectance spectroscopy to estimate the nutritive value of senescing annual ryegrass (Lolium rigidum): A comparison of calibration methods. Aust. J. Exp. Agric. 1998, 38, 45–54. [Google Scholar] [CrossRef]
  21. Stuth, J.; Jama, A.; Tolleson, D. Direct and indirect means of predicting forage quality through near infrared reflectance spectroscopy. Field Crop. Res. 2003, 84, 45–56. [Google Scholar] [CrossRef]
  22. Araus, J.L.; Cairns, J.E. Field high-throughput phenotyping: The new crop breeding frontier. Trends Plant Sci. 2013, 19, 52–61. [Google Scholar] [CrossRef] [PubMed]
  23. Coppens, F.; Wuyts, N.; Inzé, D.; Dhondt, S. Unlocking the potential of plant phenotyping data through integration and data-driven approaches. Curr. Opin. Syst. Biol. 2017, 4, 58–63. [Google Scholar] [CrossRef]
  24. Alomar, D.; Montero, R.; Fuchslocher, R. Effect of freezing and grinding method on near-infrared reflectance (nir) spectra variation and chemical composition of fresh silage. Anim. Feed Sci. Technol. 1999, 78, 57–63. [Google Scholar] [CrossRef]
  25. Seelan, S.K.; Laguette, S.; Casady, G.M.; Seielstad, G.A. Remote sensing applications for precision agriculture: A learning community approach. Remote Sens. Environ. 2003, 88, 157–169. [Google Scholar] [CrossRef]
  26. Kumar, J.; Pratap, A.; Kumar, S. Phenomics in Crop Plants: Trends, Options and Limitation; Springer India: New Delhi, India, 2015; Volume 1, p. 310. [Google Scholar]
  27. Vigneau, N.; Ecarnot, M.; Rabatel, G.; Roumet, P. Potential of field hyperspectral imaging as a non destructive method to assess leaf nitrogen content in wheat. Field Crop. Res. 2011, 122, 25–31. [Google Scholar] [CrossRef]
  28. Perbandt, D.; Fricke, T.; Wachendorf, M. Effects of changing simulated sky cover on hyperspectral reflectance measurements for dry matter yield and forage quality prediction. Comput. Electron. Agric. 2010, 73, 230–239. [Google Scholar] [CrossRef]
  29. Restaino, E.A.; Fernandez, E.G.; La Manna, A.; Cozzolino, D. Prediction of the nutritive value of pasture sliage by near infrared spectroscopy (nirs). Chil. J. Agric. Res. 2009, 69, 560–566. [Google Scholar] [CrossRef]
  30. Rabatel, G.; Al Makdessi, N.; Ecarnot, M.; Roumet, P. A spectral correction method for multi-scattering effects in close range hyperspectral imagery of vegetation scenes: Application to nitrogen content assessment in wheat. Adv. Anim. Biosci. 2017, 8, 353–358. [Google Scholar] [CrossRef]
  31. Blackburn, G.A. Hyperspectral remote sensing of plant pigments. J. Exp. Bot. 2007, 58, 855–867. [Google Scholar] [CrossRef]
  32. Agelet, L.E.; Hurburgh, C.R. A tutorial on near infrared spectroscopy and its calibration. Crit. Rev. Anal. Chem. 2010, 40, 246–260. [Google Scholar] [CrossRef]
  33. Esquerre, C.; Gowen, A.A.; Burger, J.; Downey, G.; O’Donnell, C.P. Suppressing sample morphology effects in near infrared spectral imaging using chemometric data pre-treatments. Chemom. Intell. Lab. Syst. 2012, 117, 129–137. [Google Scholar] [CrossRef]
  34. Zhao, D.; Starks, P.J.; Brown, M.A.; Phillips, W.A.; Coleman, S.W. Assessment of forage biomass and quality parameters of bermudagrass using proximal sensing of pasture canopy reflectance. Grassl. Sci. 2007, 53, 39–49. [Google Scholar] [CrossRef]
  35. Thenkabail, P.S.; Smith, R.B.; De Pauw, E. Hyperspectral vegetation indices and their relationships with agricultural crop characteristics. Remote Sens. Environ. 2000, 71, 158–182. [Google Scholar] [CrossRef]
  36. Pullanagari, R.; Yule, I.; Hedley, M.; Tuohy, M.; Dynes, R.; King, W. Multi-spectral radiometry to estimate pasture quality components. Int. J. Adv. Precis. Agric. 2012, 13, 442–456. [Google Scholar] [CrossRef]
  37. Hueni, A.; Damm, A.; Kneubuehler, M.; Schläpfer, D.; Schaepman, M.E. Field and airborne spectroscopy cross-validation—some considerations. IEEE J. Sel. Top. Appl. Earth Obs. Remote Sens. 2017, 10, 1117–1135. [Google Scholar] [CrossRef]
  38. Shetty, N.; Gislum, R.; Jensen, A.M.D.; Boelt, B. Development of nir calibration models to assess year-to-year variation in total non-structural carbohydrates in grasses using plsr. Chemom. Intell. Lab. Syst. 2012, 111, 34–38. [Google Scholar] [CrossRef]
  39. Lundberg, K.; Hoffman, P.; Bauman, L.; Berzaghi, P. Prediction of forage energy content by near infrared reflectance spectroscopy and summative equations. Prof. Anim. Sci. 2004, 20, 262–269. [Google Scholar] [CrossRef]
  40. Gebremedhin, A.; Badenhorst, P.E.; Wang, J.; Spangenberg, G.C.; Smith, K.F. Prospects for measurement of dry matter yield in forage breeding programs using sensor technologies. Agronomy 2019, 9, 65. [Google Scholar] [CrossRef]
  41. Deaville, E.R.; Givens, D.I. Regions of normalised near infrared reflectance difference spectra related to the rumen degradation of fresh grass, grass silage and maize silage. Anim. Feed Sci. Technol. 1998, 72, 41–51. [Google Scholar] [CrossRef]
  42. Vogel, K.; Pedersen, J.F. Breeding Systems for Cross-Pollinated Perennial Grasses; FAO: Rome, Italy, 1993. [Google Scholar]
  43. Chapman, D.F.; Bryant, J.R.; Kerr, G.A.; Judson, G.; Cookson, T.; Edwards, G.R.; McMillan, W.H. Economic values for perennial ryegrass traits in new zealand dairy farm systems. In Proceedings of the 22nd International Grasslands Congress, Sydney, Australia, 15–19 September 2013; pp. 822–823. [Google Scholar]
Figure 1. The field trial of 50 experimental perennial ryegrass cultivars grown as 48,000 individual plants in 50 plots of 96 with ten replicates.
Agronomy 09 00293 g001
Figure 2. (A) The light shield, showing the light fittings and the entrance point for the sensor, ensuring the lens will be held at a uniform depth and angle; (B) The light shield is moved over individual perennial ryegrass plants in the field and the spectra is recorded.
Agronomy 09 00293 g002
Figure 3. (A) compares the ADF rankings of 159 plants determined by the model to the rankings determined by lab analysis with R2 of 0.7878. (B) compares the ash rankings of 159 plants determined by the model to the rankings determined by lab analysis with R2 of 0.8511. (C) compares the CP rankings of 159 plants determined by the model to the rankings determined by lab analysis with R2 of 0.8678. (D) compares the DM rankings of 159 plants determined by the model to the rankings determined by weighing the plants before and after drying with R2 of 0.3916. (E) compares the IVVDMD rankings of 159 plants determined by the model to the rankings determined by lab analysis with R2 of 0.7745. (F) compares the IVVOMD rankings of 159 plants determined by the model to the rankings determined by lab analysis with R2 of 0.789. (G) compares the NDF rankings of 159 plants determined by the model to the rankings determined by lab analysis with R2 of 0.6697. (H) compares the WSC rankings of 159 plants determined by the model to the rankings determined by lab analysis with R2 of 0.6709.
Agronomy 09 00293 g003aAgronomy 09 00293 g003b
Figure 4. (A) Parameters IVVDMD and NDF showed R2 of 0.5335 for correlation between model predicted results for 159 plants; (B) NDF and IVVOMD rankings showed R2 of 0.6924 for the correlation between model predicted results for 159 plants.
Agronomy 09 00293 g004
Figure 5. (A) The rankings for parameters IVVDMD and NDF showed R2 of 0.602 for correlation between rankings of 1610 plants. (B) NDF and IVVOMD rankings showed R2 of 0.660 for the correlation between rankings of 1610 plants.
Agronomy 09 00293 g005
Table 1. The dates, breeding line and number of canopy spectra collection and vegetation harvested for lab analysis.
DateBreeding LineSpectra CollectedNV Lab Results
23/08/2018A3160
24/08/2018D2727
24/08/2018E1818
24/08/2018F3131
27/09/2018A2880
12/10/2018B45484
11/10/2018C4740
30/11/2018B9430
total1704190
Table 4. Descriptive statistics for comparing lab results to model predictions of 30 samples from 30 November 2018 (plants in reproductive phase) using the above models. This includes the slope of the regression line, the y-intercept, the Bias, standard error of covariance (SEC), standard error of prediction (SEP) and standard error of prediction covariance (SEPC), the coefficient of determination (R2), the predicted and actual average, and the predicted and actual standard deviation (SD).
StatisticADFashCPDMIVVDMDIVVOMDNDFWSC
Samples (N)3030303030303030
Slope0.610.470.680.690.700.641.080.78
Intercept9.333.693.0213.8521.5823.81−2.305.23
Bias0.19−0.80−0.156.03−1.30−2.321.22−0.91
SEC1.590.791.111.602.252.143.412.48
SEP1.581.161.136.242.553.133.512.59
SEPC1.590.861.141.632.232.143.352.47
R20.100.140.290.260.070.090.150.24
Predicted Ave23.518.4510.0225.4475.3372.6245.1127.38
Actual Ave23.707.659.8831.4774.0370.3046.3326.48
Predicted SD0.850.671.021.340.901.041.331.76
Actual SD1.640.841.301.832.302.213.642.79
Table 5. Canopy spectra from 1610 plants was analyzed using the previously tested predictive models, the average, minimum and maximum predicted value for each NV parameter in all 1610 samples are shown below.
ADFAshCPDMIVVDMDNDFIVVOMDWSC
average24.249.8611.2424.7176.3745.3772.9423.81
minimum20.355.504.0319.1168.4429.8363.4212.92
maximum29.4515.7123.4233.3790.6555.6182.8331.79