Combined Use of Low-Cost Remote Sensing Techniques and δ13C to Assess Bread Wheat Grain Yield under Different Water and Nitrogen Conditions

 , and
, and
Abstract
1. Introduction
2. Materials and Methods
2.1. Plant Material and Growing Conditions
2.2. Vegetation Indices
2.3. Canopy Temperature Measurements
2.4. Stomatal Conductance
2.5. Stable Carbon Isotope Composition
2.6. Statistical Analysis
3. Results
3.1. Irrigation and Fertilization Effects on Grain Yield
3.2. Vegetation Indices
3.3. Canopy Temperature Depression, Stable Carbon Isotope Composition and Stomatal Conductance
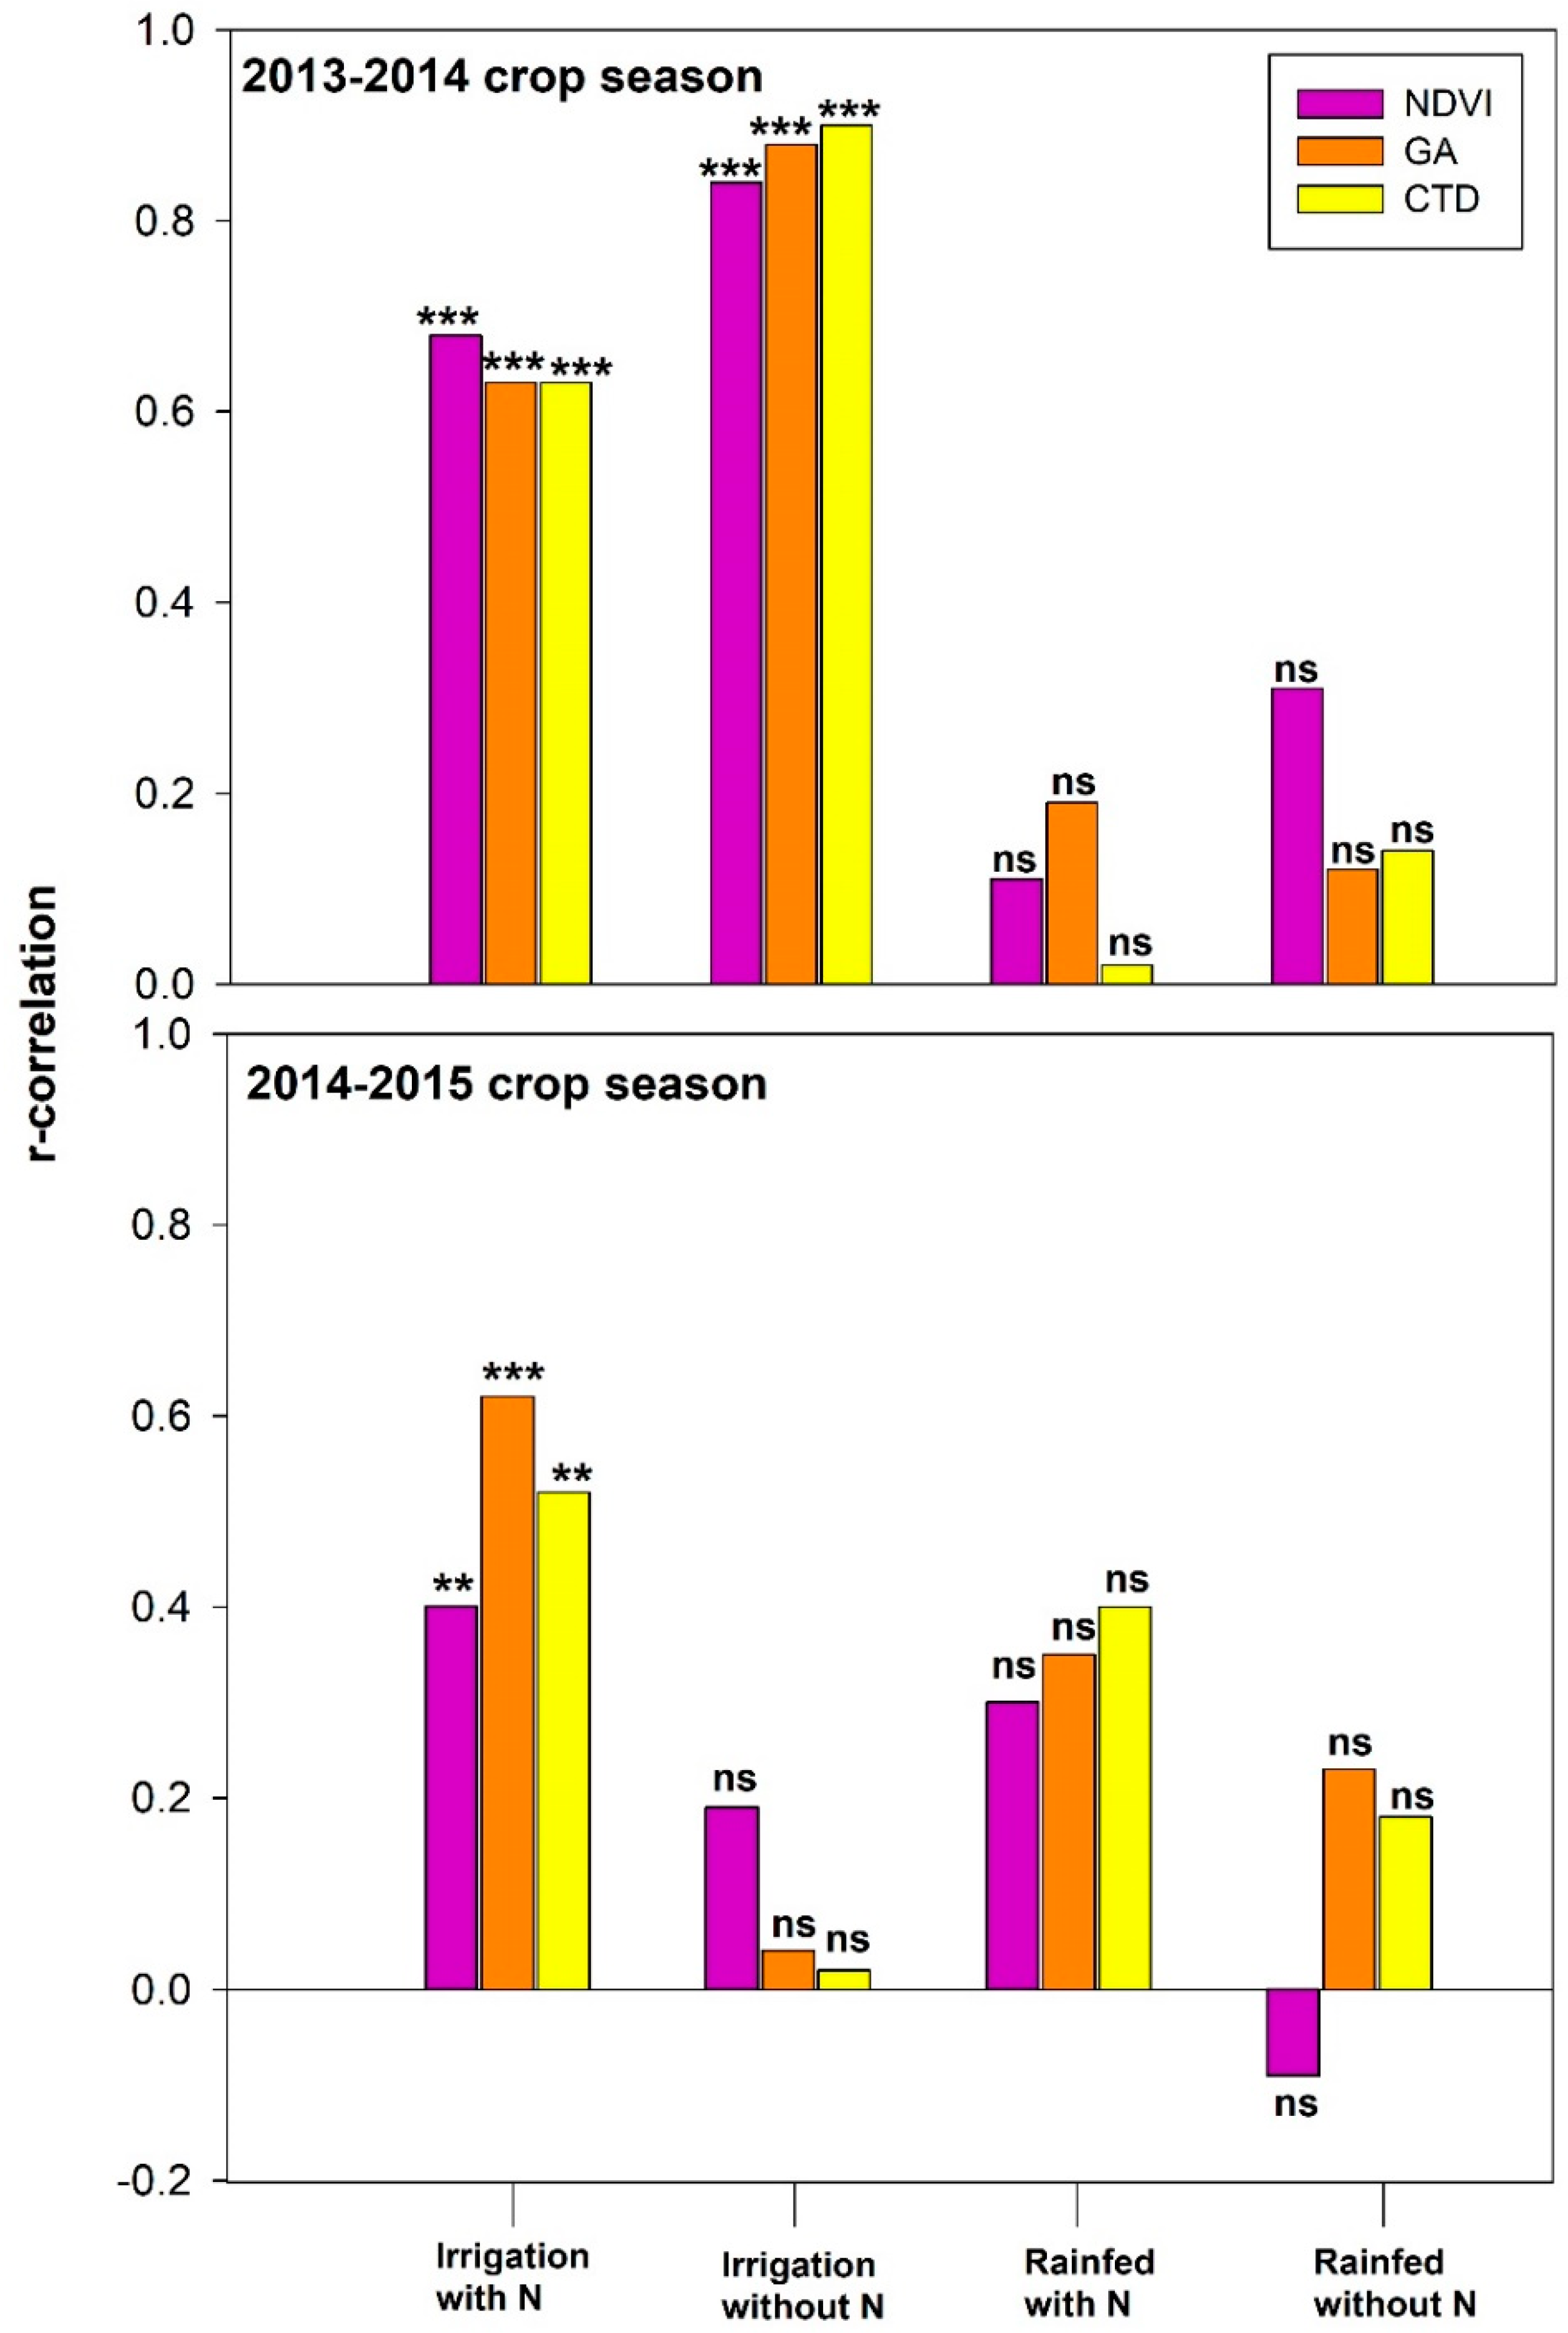
3.4. Genotypic Effect on Grain Yield, Vegetation Indices and Water Status Traits
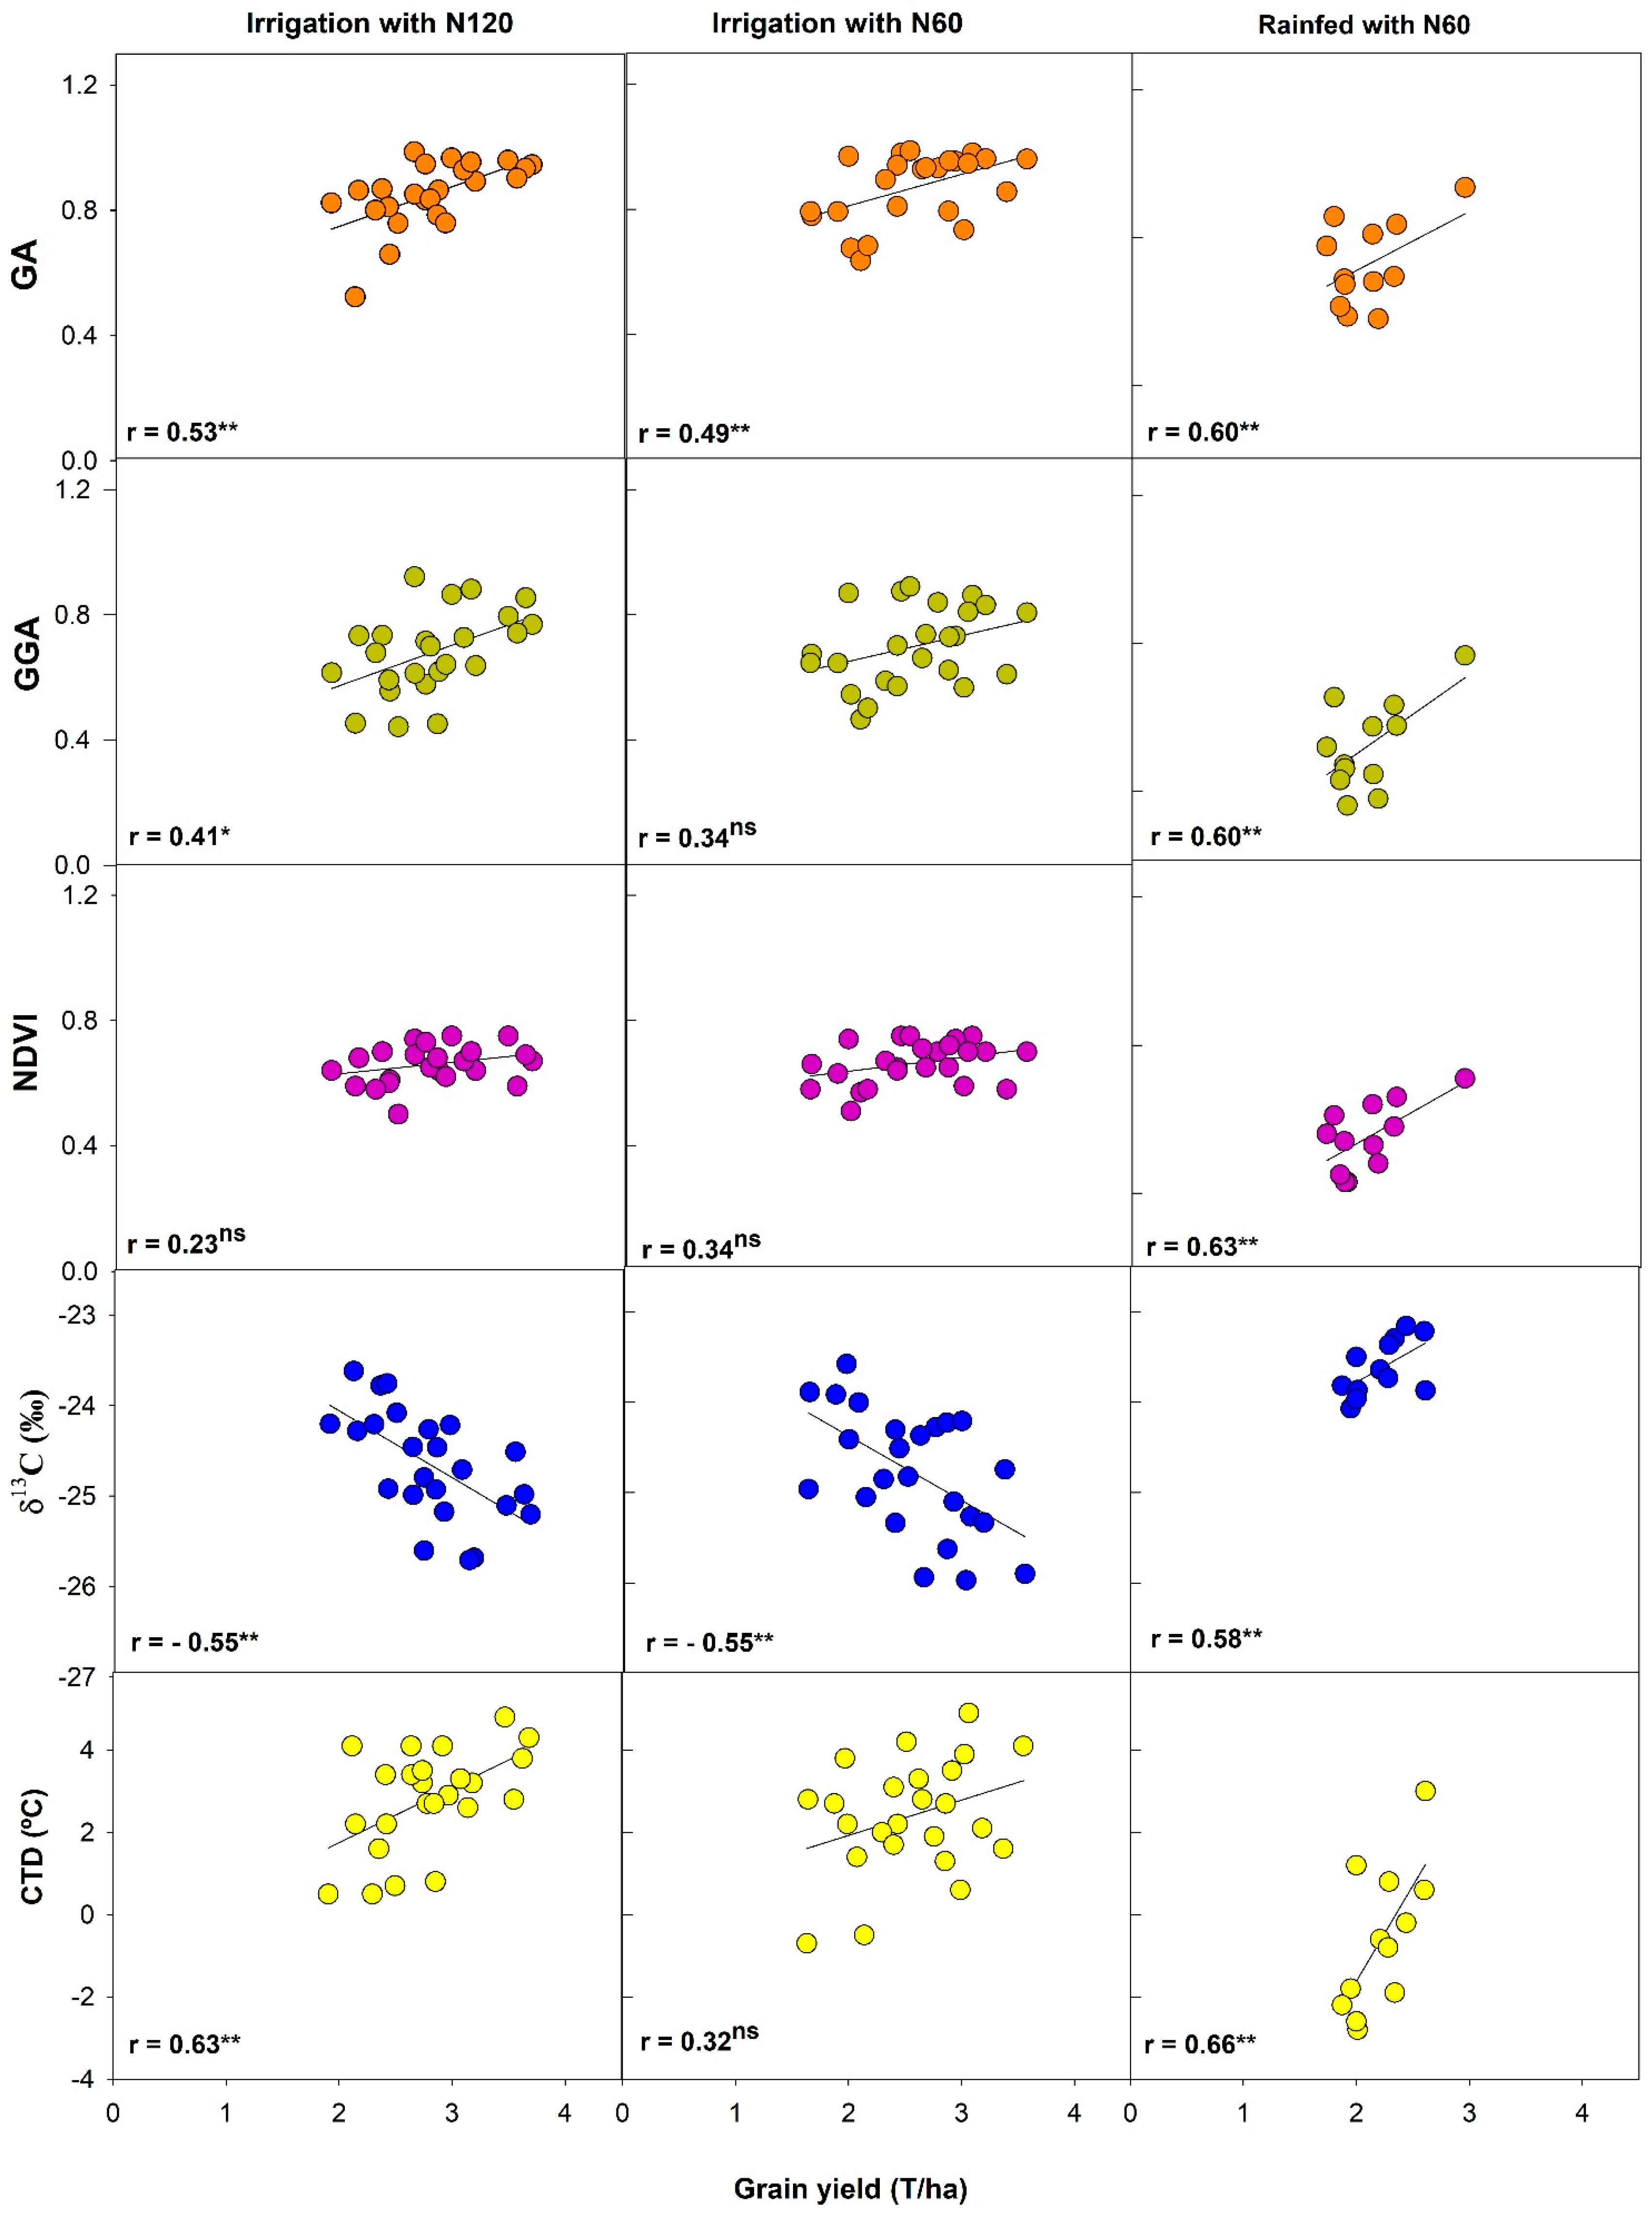
3.5. Relationships of the Grain Yield with the Vegetation Indices
3.6. Relationships of the Grain Yield with the Canopy Temperature Depression and the δ13C
3.7. Relationships of Vegetation and Water Status Indices
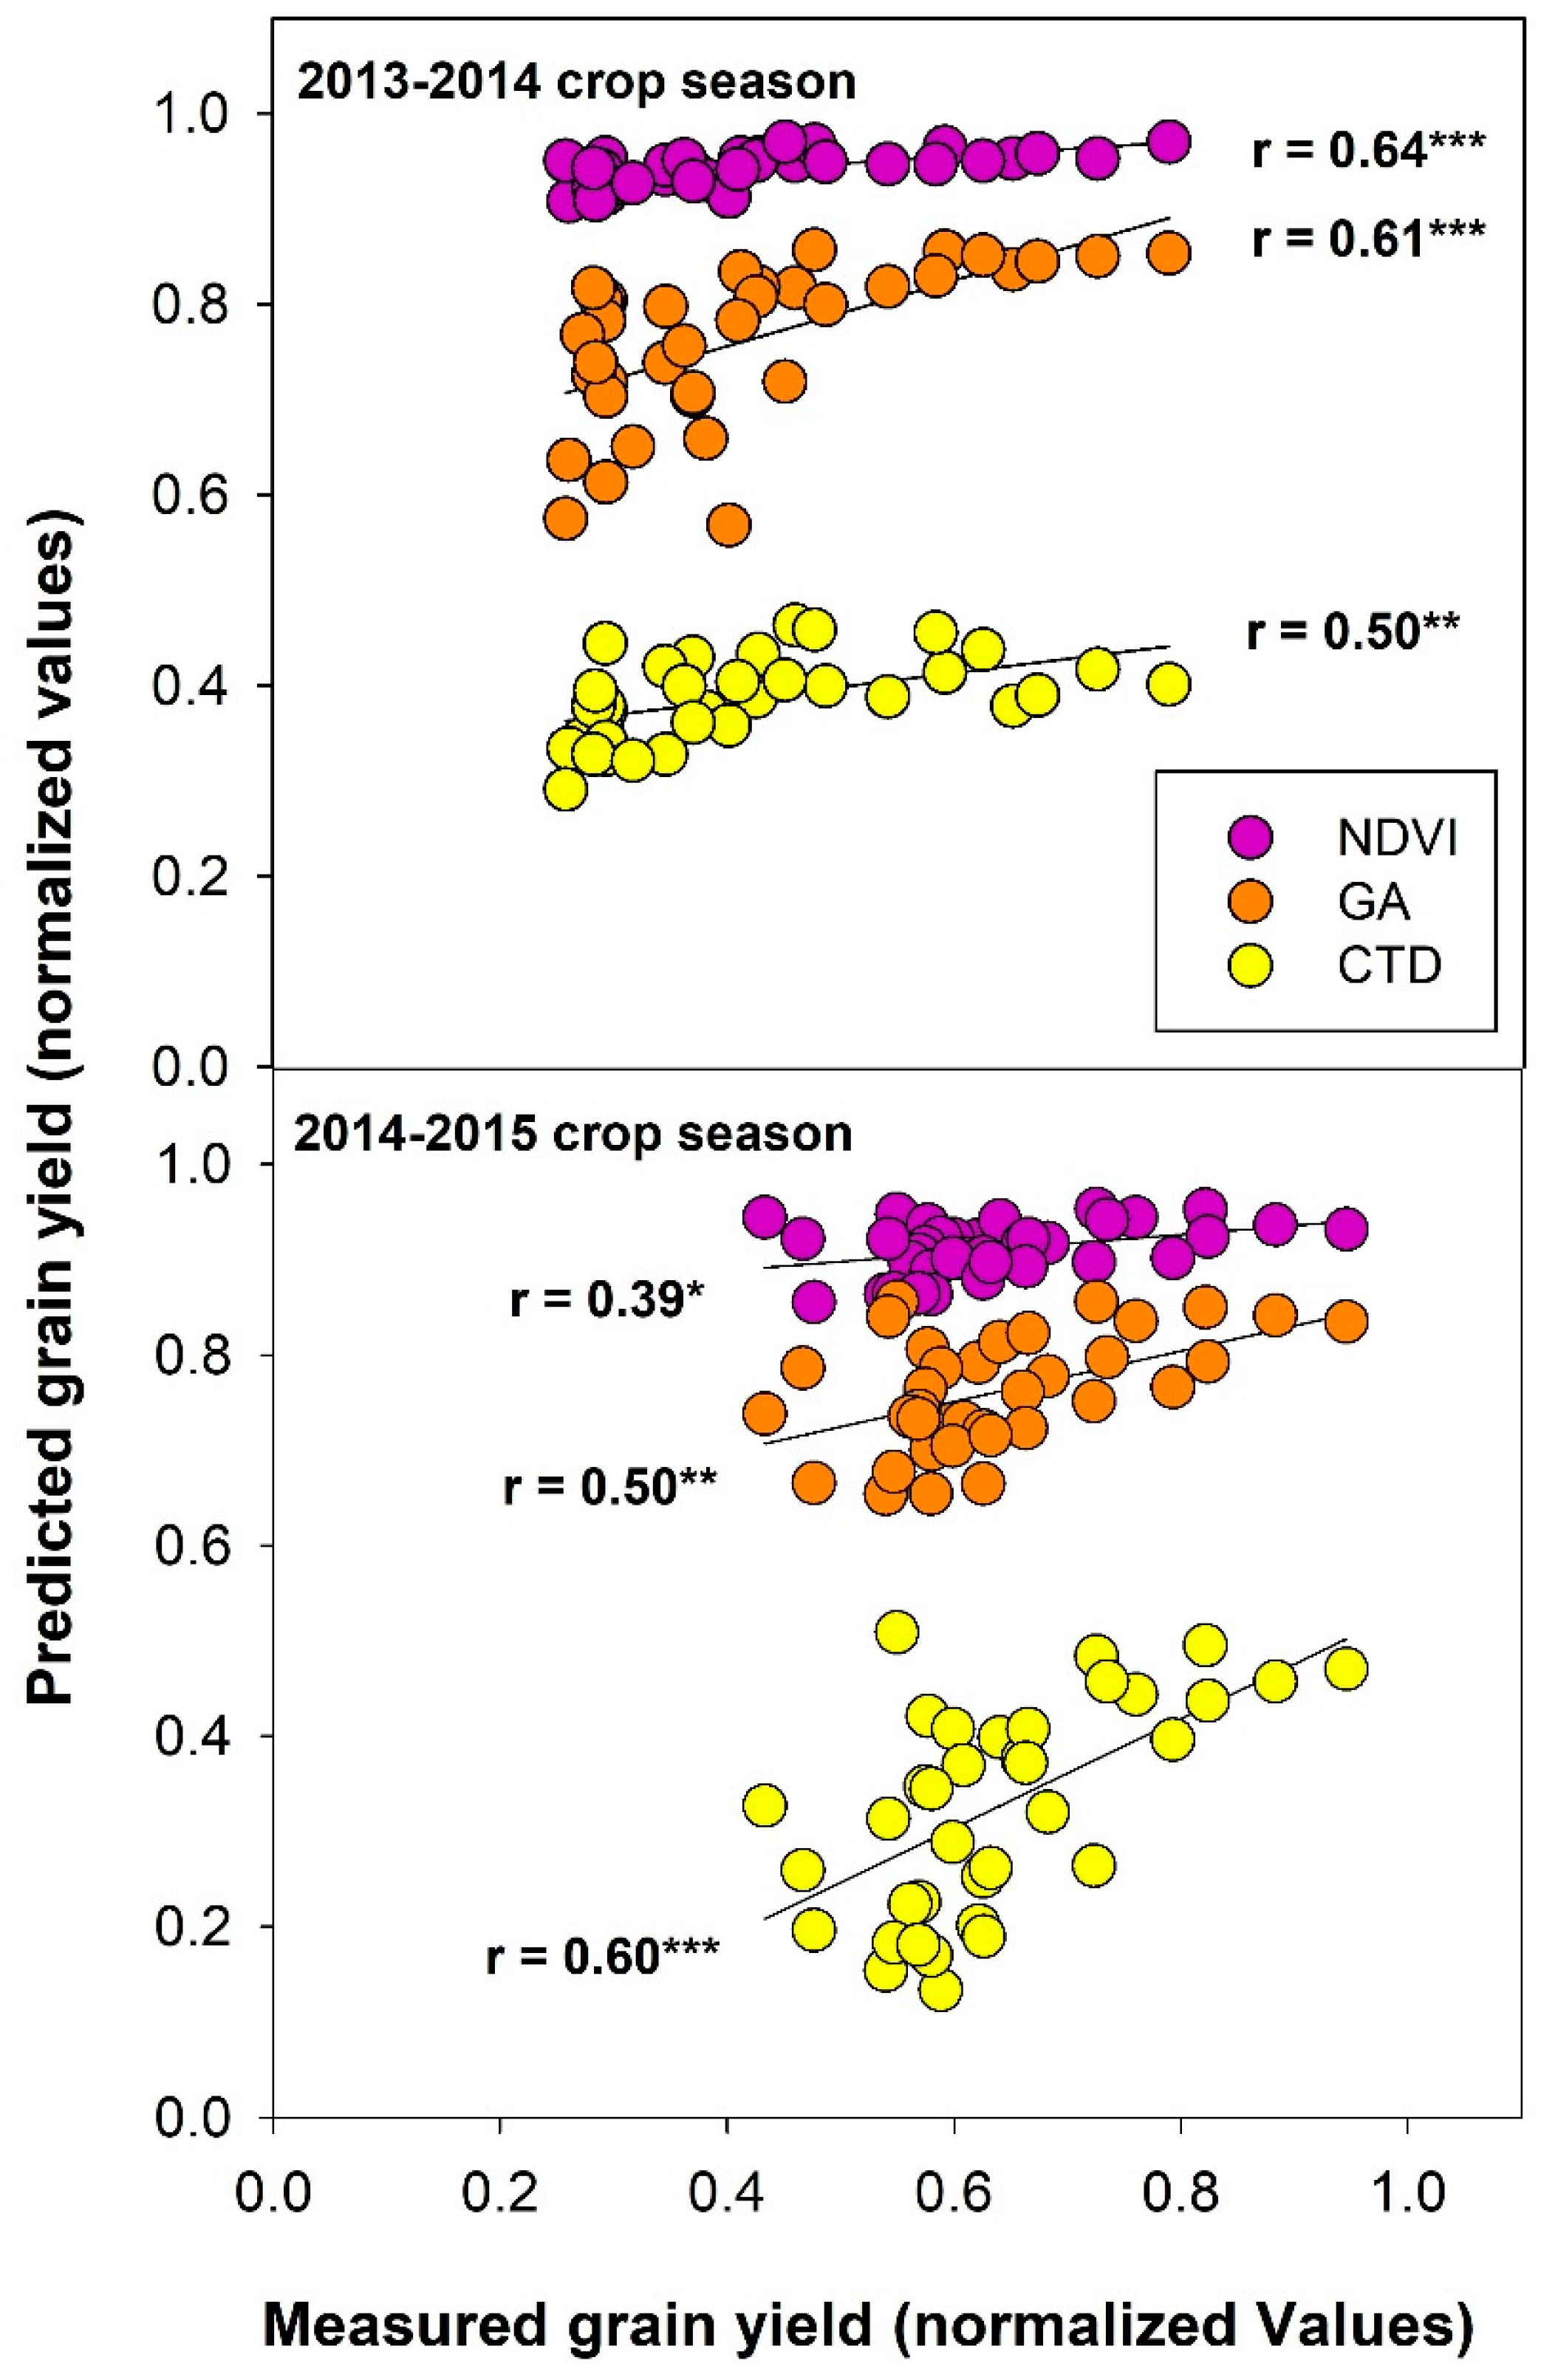
3.8. Grain Yield Estimation Using Vegetation Indices and Canopy Temperature
3.9. The Combined Effect of Remote Sensing Indices and Physiological Traits in Explaining Grain Yield
4. Discussion
4.1. Vegetation Indices and Nitrogen Fertilization
4.2. Canopy Temperature and Water Status in Wheat
4.3. Relationship of Vegetation Indices and Water Status Traits with GY
4.4. Phenotyping Parameters under Different Water and N Supplies
4.5. Grain Yield Prediction across Crop Seasons Using Low-Cost Remote Sensing Techniques
4.6. An Integrated Model to Predict Grain Yield That Combines Remote-Sensing Traits, Canopy Reflectance Measurements and Grain δ13C
5. Conclusions
Supplementary Materials
Author Contributions
Funding
Acknowledgments
Conflicts of Interest
References
- FAO. Statistical Year Book. 2012. Available online: http://www.fao.org/docrep/015/i2490e/i249e00.htm (accessed on 14 June 2015).
- Oweis, T.; Zhang, H.; Pala, M. Water use efficiency of rainfed and irrigated bread wheat in a Mediterranean environment. Agron. J. 2000, 92, 231–238. [Google Scholar] [CrossRef]
- Lobell, D.B.; Burke, M.B.; Tebaldi, C.; Mastrandrea, M.D.; Falcon, W.P.; Naylor, R.L. Prioritizing climate change adaptation needs for food security in 2030. Science 2008, 319, 607–610. [Google Scholar] [CrossRef] [PubMed]
- Araus, J.L.; Slafer, G.A.; Reynolds, M.P.; Royo, C. Plant breeding and water relations in C3 cereals: What should we breed for? Ann. Bot. 2002, 89, 925–940. [Google Scholar] [CrossRef] [PubMed]
- Seelan, S.K.; Laguette, S.; Casady, G.M.; Seielstad, G.A. Remote sensing applications for precision agriculture: A learning community approach. Remote Sens. Environ. 2003, 88, 157–169. [Google Scholar] [CrossRef]
- Chapman, S.C. Use of crop models to understand genotype by environment interactions for drought in real-world and simulated plant breeding trials. Euphytica 2008, 161, 195–208. [Google Scholar] [CrossRef]
- Araus, J.L.; Cairns, J.E. Field high-throughput phenotyping: the new crop breeding frontier. Trends Plant Sci. 2014, 19, 52–61. [Google Scholar] [CrossRef] [PubMed]
- Glenn, E.P.; Huete, A.R.; Nagler, P.L.; Nelson, S.G. Relationship between remotely-sensed vegetation indices, canopy attributes and plant physiological processes: what vegetation indices can and cannot tell us about the landscape. Sensors 2008, 8, 2136–2160. [Google Scholar] [CrossRef] [PubMed]
- Jones, H.G.; Serraj, R.; Loveys, B.R.; Xiong, L.Z.; Wheaton, A. Thermal infrared imaging of crop canopies for the remote diagnosis and quantification of plant responses to water stress in the field. Funct. Plant Biol. 2009, 36, 978–989. [Google Scholar] [CrossRef]
- Sui, J.; Qin, Q.; Ren, H.; Sun, Y.; Zhang, T.; Wang, J.; Gong, S. Winter wheat production estimation based on environmental stress factors from satellite observations. Remote Sens. 2018, 10, 962. [Google Scholar] [CrossRef]
- Zhang, C.; Pattey, E.; Liu, J.; Cai, H.; Shang, J.; Dong, T. Retrieving leaf and canopy water content of winter wheat using vegetation water indices. IEEE J. Sel. Top. Appl. Earth Obs. Remote Sens. 2018, 11, 112–126. [Google Scholar] [CrossRef]
- Segovia-Cardozo, D.A.; Rodríguez-Sinobas, L.; Zubelzu, S. Water use efficiency of corn among the irrigation districts across the Duero river basin (Spain): Estimation of local crop coefficients by satellite images. Agric. Water Manag. 2019, 212, 241–251. [Google Scholar] [CrossRef]
- Serrano, J.; Shahidian, S.; Marques da Silva, J. Evaluation of normalized difference water index as a tool for monitoring pasture seasonal and inter-annual variability in a Mediterranean agro-silvo-pastoral system. Water 2019, 11, 62. [Google Scholar] [CrossRef]
- Zhang, T.; Su, J.; Liu, C.; Chen, W.H.; Liu, H.; Liu, G. Band selection in Sentinel-2 satellite for agriculture applications. In Proceedings of the 2017 23rd International Conference on Automation and Computing (ICAC), Huddersfield, UK, 7–8 September 2017; IEEE: Huddersfield, UK, 2017; pp. 1–6. [Google Scholar]
- Varinderpal-Singh; Bijay-Singh; Yadvinder-Singh; Thind, H.S.; Gobinder-Singh; Satwinderjit-Kaur; Kumar, A.; Vashistha, M. Establishment of threshold leaf colour greenness for need-based fertilizer nitrogen management in irrigated wheat (Triticum aestivum L.) using leaf colour chart. Field Crops Res. 2012, 130, 109–119. [Google Scholar] [CrossRef]
- Varinderpal-Singh; Bijay-Singh; Yadvinder-Singh; Thind, H.S.; Buttar, G.S.; Kaur, S.; Kaur, S.; Bhowmik, A. Site-specific fertilizer nitrogen management for timely sown irrigated wheat (Triticum aestivum L. and Triticum turgidum L. ssp. durum) genotypes. Nutr. Cycl. Agroecosyst. 2017, 109, 1–16. [Google Scholar] [CrossRef]
- Bija-Singh; Varinderpal-Singh; Yadvinder-Singh; Thind, H.S.; Kumar, A.; Choudhary, O.P.; Gupta, R.K.; Vashistha, M. Site-specific fertilizer nitrogen management using optical sensor in irrigated wheat in the Northwestern India. Agric. Res. 2017, 6, 159–168. [Google Scholar] [CrossRef]
- Van Loon, J.; Speratti, A.; Govaerts, B. Precision for smallholder farmers: a small-scale-tailored variable rate fertilizer application kit. Agriculture 2018, 8, 48. [Google Scholar] [CrossRef]
- Araus, J.L.; Kefauver, S.C. Breeding to adapt agriculture to climate change: Affordable phenotyping solutions. Curr. Opin. Plant Biol. 2018, 45, 237–247. [Google Scholar] [CrossRef]
- Colaço, A.F.; Bramley, R.G. Do crop sensors promote improved nitrogen management in grain crops? Field Crops Res. 2018, 218, 126–140. [Google Scholar] [CrossRef]
- Bramley, R.G.V.; Ouzman, J. Farmer attitudes to the use of sensors and automation in fertilizer decision-making: nitrogen fertilization in the Australian grains sector. Precis. Agric. 2019, 20, 157–175. [Google Scholar] [CrossRef]
- Fernandez-Gallego, J.A.; Kefauver, S.C.; Vatter, T.; Gutiérrez, N.A.; Nieto-Taladriz, M.T.; Araus, J.L. Low-cost assessment of grain yield in durum wheat using RGB images. Eur. J. Agron. 2019, 105, 146–156. [Google Scholar] [CrossRef]
- Hansen, P.M.; Schjoerring, J.K. Reflectance measurement of canopy biomass and nitrogen status in wheat crops using normalized difference vegetation indices and partial least squares regression. Remote Sens. Environ. 2003, 86, 542–553. [Google Scholar] [CrossRef]
- Babar, M.A.; Reynolds, M.P.; Van Ginkel, M.; Klatt, A.R.; Raun, W.R.; Stone, M.L. Spectral reflectance indices as a potential indirect selection criteria for wheat yield under irrigation. Crop Sci. 2006, 46, 578–588. [Google Scholar] [CrossRef]
- Marti, J.; Bort, J.; Slafer, G.A.; Araus, J.L. Can wheat yield be assessed by early measurements of normalized difference vegetation index? Ann. Appl. Biol. 2007, 150, 253–257. [Google Scholar] [CrossRef]
- Wright, D.L.; Rasmussen, V.P.; Ramsey, R.D. Comparing the use of remote sensing with traditional techniques to detect nitrogen stress in wheat. Geocarto. Int. 2005, 20, 63–68. [Google Scholar] [CrossRef]
- Aparicio, N.; Villegas, N.; Casadesus, J.; Araus, J.L.; Royo, C. Spectral vegetation indices as non-destructive tools for determining durum wheat yield. Agron. J. 2000, 92, 83–91. [Google Scholar] [CrossRef]
- Filella, I.; Serrano, L.; Serra, J.; Penuelas, J. Evaluating wheat nitrogen status with canopy reflectance indices and discriminant analysis. Crop Sci. 1995, 35, 1400–1405. [Google Scholar] [CrossRef]
- Royo, C.; Aparicio, N.; Villegas, D.; Casadesus, J.; Monneveux, P.; Araus, J.L. Usefulness of spectral reflectance indices as durum wheat yield predictors under contrasting Mediterranean conditions. Int. J. Remote Sens. 2003, 24, 4403–4419. [Google Scholar] [CrossRef]
- Araus, J.L.; Amaro, T.; Zuhair, Y.; Nachit, M.M. Effect of leaf structure and water status on carbon isotope discrimination in field-grown durum wheat. Plant Cell Environ. 1997, 20, 1484–1494. [Google Scholar] [CrossRef]
- Casadesus, J.; Kaya, Y.; Bort, J.; Nachit, M.M.; Araus, J.L.; Amor, S.; Ferrazzano, G.; Maalouf, F.; Maccaferri, M.; Martos, V.; et al. Using vegetation indices derived from conventional digital cameras as selection criteria for wheat breeding in water-limited environments. Ann. Appl. Bot. 2007, 150, 227–236. [Google Scholar] [CrossRef]
- Vergara-Diaz, O.; Kefauver, S.C.; Elazab, A.; Nieto-Taladriz, M.T.; Araus, J.L. Grain yield loss assessment for winter wheat associated with the fungus Puccinia striiformis f.sp. tritici using digital and conventional parameters under field conditions. Crop J. 2015, 3, 200–210. [Google Scholar] [CrossRef]
- Mullan, D.J.; Reynolds, M.P. Quantifying genetic effects of ground cover on soil water evaporation using digital imaging. Funct. Plant. Biol. 2010, 37, 703–712. [Google Scholar] [CrossRef]
- Deery, D.; Jimenez-Berni, J.; Jones, H.; Sirault, X.; Furbank, R. Proximal remote sensing buggies and potential applications for field-based phenotyping. Agronomy 2014, 4, 349–379. [Google Scholar] [CrossRef]
- Araus, J.L.; Kefauver, S.C.; Zaman-Allah, M.; Olsen, M.S.; Cairns, J.E. Translating high throughput phenotyping into genetic gain. Trends Plant Sci. 2018, 23, 451–466. [Google Scholar] [CrossRef] [PubMed]
- Blum, A.; Mayer, J.; Gozlan, G. Infrared thermal sensing of plant canopies as a screening technique for dehydration avoidance in wheat. Field Crops Res. 1982, 5, 137–146. [Google Scholar] [CrossRef]
- Amani, I.; Fischer, R.A.; Reynolds, M.P. Canopy temperature depression association with yield of irrigated spring wheat cultivars in hot climate. J. Agron. Crop Sci. 1996, 176, 119–129. [Google Scholar] [CrossRef]
- Reynolds, M.P.; Singh, R.P.; Ibrahim, A.; Ageeb, O.A.A.; Larque-Saavedra, A.; Quick, J.S. Evaluating physiological traits to complement empirical selection for wheat in warm environments. Euphytica 1998, 100, 84–95. [Google Scholar] [CrossRef]
- Reynolds, M.; Dreccer, F.; Trethowan, R. Drought-adaptive traits derived from wheat wild relatives and landraces. J. Exp. Bot. 2007, 58, 177–186. [Google Scholar] [CrossRef]
- Araus, J.L.; Slafer, G.A.; Royo, C.; Serret, M.D. Breeding for yield potential and stress adaptation in cereals. Crit. Rev. Plant Sci. 2008, 27, 377–412. [Google Scholar] [CrossRef]
- Inoue, Y. Remote detection of physiological depression in crop plants with infrared thermal imagery. Jpn. J. Crop Sci. 1990, 59, 762–768. [Google Scholar] [CrossRef]
- O’Shaughnessy, S.A.; Evett, S.R.; Colaizzi, P.D.; Howel, T.A. Using radiation thermography and thermometry to evaluate crop water stress in soybean and cotton. Agric. Water Manag. 2011, 98, 1523–1535. [Google Scholar] [CrossRef]
- Idso, S.B.; Jackson, R.D.; Pinter, P.J.; Reginato, R.J.; Hatfield, J.L. Normalizing the stress-degree-day parameter for environmental variability. Agric. Meteorol. 1981, 24, 45–55. [Google Scholar] [CrossRef]
- Araus, J.L.; Cabrera-Bosquet, L.; Serret, M.D.; Bort, J.; Nieto-Taladriz, M.T. Comparative performance of δ13C, δ18O and δ15N for phenotyping durum wheat adaptation to a dryland environment. Funct. Plant Biol. 2013, 40, 595–608. [Google Scholar] [CrossRef]
- Van Leeuwen, C.; Tregoat, O.; Chone, X.; Bois, B.; Pernet, D.; Gaudillere, J.P. Vine water status is a key factor in grape ripening and vintage quality for red Bordeaux wine. How can it be assessed for vineyard management purposes? J. Int. Sci. Vig. 2009, 43, 121–134. [Google Scholar] [CrossRef]
- Farquhar, G.D.; O’Leary, M.H.; Berry, J.A. On the relationship between carbon isotope discrimination and the intercellular carbon dioxide concentration in leaves. Aust. J. Plant. Physiol. 1982, 9, 121–137. [Google Scholar] [CrossRef]
- Farquhar, G.D.; Richards, R.A. Isotopic composition of plant carbon correlates with water-use-efficiency of wheat genotypes. Aust. J. Plant Physiol. 1984, 11, 539–552. [Google Scholar] [CrossRef]
- Condon, A.G.; Richards, R.A. Broad sense heritability and genotypes-environment interaction for carbon isotope discrimination in field-grown wheat. Aust. J. Agric. Res. 1992, 43, 921–934. [Google Scholar] [CrossRef]
- Yousfi, S.; Serret, M.D.; Voltas, J.; Araus, J.L. Effect of salinity and water stress during the reproductive stage on growth, ion concentrations, ∆13C, and δ15N of durum wheat and related amphiploids. J. Exp. Bot. 2010, 61, 3529–3542. [Google Scholar] [CrossRef] [PubMed]
- Araus, J.L.; Amaro, T.; Casadesus, J.; Asbati, A.; Nachit, M.M. Relationships between ash content, carbon isotope discrimination and yield in durum wheat. Aust. J. Plant Physiol. 1998, 25, 835–842. [Google Scholar] [CrossRef]
- Susstrunk, S.; Robert-Buckley, R.; Swen, S. Standard RGB color spaces. In Proceedings of the Color and Imaging Conference Final Program and Proceedings, Scottsdale, AZ, USA, 16–19 November 1999; Society for Imaging Science and Technology: Springfield, MO, USA, 1999; pp. 127–134. [Google Scholar]
- Gracia-Romero, A.; Vergara-Díaz, O.; Thierfelder, C.; Cairns, J.E.; Kefauver, S.C.; Araus, J.L. Phenotyping Conservation Agriculture Management Effects on Ground and Aerial Remote Sensing Assessments of Maize Hybrids Performance in Zimbabwe. Remote Sens. 2018, 10, 349. [Google Scholar] [CrossRef]
- Farquhar, G.D.; Ehleringer, J.R.; Hubick, K.T. Carbon isotope discrimination and photosynthesis. Annu. Rev. Plant Physiol. 1989, 40, 503–537. [Google Scholar] [CrossRef]
- Yousfi, S.; Kellas, N.; Saidi, L.; Benlakhel, Z.; Chaou, L.; Siad, D. Comparative performance of remote sensing methods in assessing wheat performance under Mediterranean conditions. Agric. Water Manag. 2016, 164, 137–147. [Google Scholar] [CrossRef]
- Arbuckle, J.L. Amos Users’ Guide, Version 3.6; Small Waters Corporation: Chicago, IL, USA, 1997. [Google Scholar]
- Elazab, A.; Bort, J.; Zhou, B.; Serret, M.D.; Nieto-Taladriz, M.T.; Araus, J.L. The combined use of vegetation índices and stable isotopes to predict durum wheat grain yield under contrasting water conditions. Agric. Water Manag. 2015, 158, 196–208. [Google Scholar] [CrossRef]
- Lopes, M.S.; Reynolds, M.P. Stay-green in spring wheat can be determined by spectral reflectance measurements (normalized difference vegetation index) independently from phenology. J. Exp. Bot. 2012, 63, 3789–3798. [Google Scholar] [CrossRef] [PubMed]
- Li, Y.; Chen, D.; Walker, C.N.; Angus, J.F. Estimating the nitrogen status of crops using a digital camera. Field Crop Res. 2010, 118, 221–227. [Google Scholar] [CrossRef]
- Vergara-Díaz, O.; Zaman-Allah, M.; Masuka, B.; Hornero, A.; Zarco-Tejada, P.; Prasanna, B.M.; Cairns, J.E.; Araus, J.L. A novel remote sensing approach for prediction of maize yield under different conditions of nitrogen fertilization. Front. Plant Sci. 2016, 7, 666. [Google Scholar] [CrossRef] [PubMed]
- Jackson, R.D.; Idso, S.B.; Reginato, R.J.; Pinter, P.J., Jr. Canopy temperature as a crop water stress indicator. Water Resour. Res. 1981, 17, 1133–1138. [Google Scholar] [CrossRef]
- Jones, H.G. Irrigation scheduling: advantages and pitfalls of plant-based methods. J. Exp. Bot. 2004, 55, 2427–2436. [Google Scholar] [CrossRef]
- Gutierrez, M.; Reynolds, M.P.; Raun, W.R.; Stone, M.L.; Klatt, A.R. Spectral water indices for assessing yield in elite bread wheat genotypes grown under well irrigated, water deficit stress, and high temperature conditions. Crop Sci. 2010, 50, 197–214. [Google Scholar] [CrossRef]
- Balota, M.; Amani, I.; Reynolds, M.P.; Acevedo, E. Evaluation of Membrane Thermostability and Canopy Temperature Depression as Screening Traits for Heat Tolerance in Wheat; Wheat Special Report No.20; CIMMYT: Mexico, D.F., Mexico, November 1993. [Google Scholar]
- Morgounov, A.; Gummadov, N.; Belen, S.; Kaya, Y.; Keser, M.; Mursalova, J. Association of digital photo parameters and NDVI with winter wheat grain yield in variable environments. Turk. J. Agric. For. 2014, 38, 624–632. [Google Scholar] [CrossRef]
- Zhou, B.; Elazab, A.; Bort, J.; Vergara, O.; Serret, M.D.; Araus, J.L. Low-cost assessment of wheat resistance to yellow rust through conventional RGB images. Comput. Electron. Agric. 2015, 116, 20–29. [Google Scholar] [CrossRef]
- Verhulst, N.; Govaerts, B. The Normalized Difference Vegetation Index (NDVI) GreenSeekerTM Handheld Sensor: Toward the Integrated Evaluation of Crop Management. Part A: Concepts and Case Studies; CIMMYT: Mexico, D.F., Mexico, 2010. [Google Scholar]
- Fischer, R.A.; Rees, D.; Sayre, K.D.; Lu, Z.M.; Condon, A.G.; Larque-Saavedra, A. Wheat yield progress associated with higher stomatal conductance and photosynthetic rate, and cooler canopies. Crop Sci. 1998, 38, 1467–1475. [Google Scholar] [CrossRef]
- Balota, M.; Payne, W.A.; Evett, S.R.; Lazar, M.D. Canopy temperature depression sampling to assess grain yield variation and genotypic differentiation in winter wheat. Crop Sci. 2007, 47, 1518–1529. [Google Scholar] [CrossRef]
- Winter, S.R.; Musick, J.T.; Porter, K.B. Evaluation of screening techniques for breeding drought-resistant Winter wheat. Crop Sci. 1998, 28, 512–516. [Google Scholar] [CrossRef]
- Royo, C.; Villegas, D.; Garcia del Moral, L.F.; Elhani, S.; Aparicio, N.; Rharrabti, Y.; Araus, J.L. Comparative performance of carbon isotope discrimination and canopy temperature depression as predictors of genotypes differences in durum wheat yield in Spain. Aust. J. Agric. Res. 2002, 53, 561–569. [Google Scholar] [CrossRef]
- Clevers, J.G.P.W. A simplified approach for yield prediction of sugar beet on optical remote sensing data. Remote Sens. Environ. 1997, 61, 221–228. [Google Scholar] [CrossRef]
- Cabrera-Bosquet, L.; Molero, G.; Nogués, S.; Araus, J.L. Water and nitrogen conditions affect the relationships of ∆13C and ∆18O to gas exchange and growth in durum wheat. J. Exp. Bot. 2009, 60, 1633–1644. [Google Scholar] [CrossRef] [PubMed]


| GY (T ha−1) | TKW (g) | Kernels m−2 | |
|---|---|---|---|
| Genotypes | |||
| Ain Abid | 2.20 a | 21.73 a | 275.9 a |
| Arz | 2.35 ab | 23.70 b | 298.3 ab |
| Maaouna | 2.35 ab | 24.35 b | 307.9 b |
| Wifak | 2.50 b | 24.83 b | 308.6 b |
| Water regime | |||
| RF | 2.07 a | 22.42 a | 270.6 a |
| SI-1 | 2.29 b | 22.72 a | 308.8 b |
| SI-2 | 2.68 c | 25.83 b | 313.7 b |
| Nitrogen fertilization | |||
| N0 | 2.05 a | 22.60 a | 291.3 a |
| N60 | 2.40 b | 23.43 a | 307.6 a |
| N120 | 2.60 c | 24.93 b | 294.1 a |
| Level of significance | |||
| Genotype (G) | 0.026 | 0.000 | 0.029 |
| Water regime (WR) | 0.000 | 0.000 | 0.000 |
| Nitrogen fertilization (N) | 0.000 | 0.001 | 0.256 |
| G × WR | 0.049 | 0.126 | 0.388 |
| G × N | 0.065 | 0.141 | 0.688 |
| N × WR | 0.070 | 0.110 | 0.840 |
| G × WR × N | 0.801 | 0.050 | 0.863 |
| NDVI | GA | GGA | LC | |
|---|---|---|---|---|
| Genotypes | ||||
| Ain Abid | 0.70 c | 0.88 c | 0.74 d | 46.88 a |
| Arz | 0.64 b | 0.82 b | 0.58 b | 52.32 c |
| Maaouna | 0.57 a | 0.74 a | 0.50 a | 50.04 b |
| Wifak | 0.58 a | 0.81 b | 0.64 c | 50.57 bc |
| Water regime | ||||
| RF | 0.56 a | 0.73 a | 0.52 a | 50.52 b |
| SI-1 | 0.62 b | 0.78 b | 0.60 b | 50.35 ab |
| SI-2 | 0.70 c | 0.93 c | 0.73 c | 49.00 a |
| Nitrogen fertilization | ||||
| N0 | 0.62 a | 0.80 a | 0.58 a | 49.08 a |
| N60 | 0.63 a | 0.82 a | 0.64 b | 50.75 b |
| N120 | 0.63 a | 0.82 a | 0.63 b | 50.03 ab |
| Level of significance | ||||
| Genotype (G) | 0.000 | 0.000 | 0.000 | 0.000 |
| Water regime (WR) | 0.000 | 0.000 | 0.000 | 0.037 |
| Nitrogen fertilization (N) | 0.699 | 0.304 | 0.005 | 0.038 |
| G × WR | 0.071 | 0.073 | 0.381 | 0.144 |
| G × N | 0.729 | 0.423 | 0.562 | 0.438 |
| N × WR | 0.765 | 0.721 | 0.598 | 0.495 |
| G × WR × N | 0.975 | 0.518 | 0.492 | 0.257 |
| CTD (°C) | gs (µmol CO2 m−2 s−1) | δ13C (‰) | |
|---|---|---|---|
| Genotypes | |||
| Ain Abid | 1.92 a | 143.71 a | −24.07 b |
| Arz | 1.48 a | 119.07 a | −24.09 b |
| Maaouna | 1.20 a | 119.51 a | −24.43 a |
| Wifak | 1.07 a | 149.90 a | −24.64 a |
| Water regime | |||
| RF | −0.49 a | 71.18 a | −23.50 c |
| SI-1 | 1.68 b | 95.31 a | −24.19 b |
| SI-2 | 3.07 c | 232.65 b | −25.23 a |
| Nitrogen fertilization | |||
| N0 | 1.67 a | 132.37 a | −24.28 a |
| N60 | 1.40 a | 146.86 a | −24.34 a |
| N120 | 1.19 a | 119.93 a | −24.31 a |
| Level of significance | |||
| Genotype (G) | 0.066 | 0.102 | 0.000 |
| Water regime (WR) | 0.000 | 0.000 | 0.000 |
| Nitrogen fertilization (N) | 0.269 | 0.142 | 0.841 |
| G × WR | 0.743 | 0.689 | 0.371 |
| G × N | 0.307 | 0.963 | 0.502 |
| N × WR | 0.336 | 0.950 | 0.022 |
| G × WR × N | 0.658 | 0.106 | 0.932 |
| Growing Conditions | NDVI | GA | GGA | LC | gs | CTD | δ13C | GY |
|---|---|---|---|---|---|---|---|---|
| SI-2 with N120 | 0.002 ** | 0.089 ns | 0.010 ** | 0.037 * | 0.061 ns | 0.493 ns | 0.308 ns | 0.048 * |
| SI-2 with N60 | 0.000 *** | 0.009 ** | 0.002 ** | 0.043 * | 0.970 ns | 0.564 ns | 0.216 ns | 0.024 * |
| SI-2 without N | 0.003 ** | 0.000 *** | 0.001 *** | 0.008 ** | 0.796 ns | 0.111 ns | 0.112 ns | 0.144 ns |
| SI-1 with N120 | 0.127 ns | 0.650 ns | 0.299 ns | 0.118 ns | 0.624 ns | 0.703 ns | 0.292 ns | 0.279 ns |
| SI-1 with N60 | 0.050 * | 0.109 ns | 0.006 ** | 0.071 ns | 0.000 *** | 0.076 ns | 0.205 ns | 0.708 ns |
| SI-1 without N | 0.129 ns | 0.519 ns | 0.455 ns | 0.883 ns | 0.973 ns | 0.610 ns | 0.027 * | 0.070 ns |
| Rainfed with N120 | 0.064 ns | 0.150 ns | 0.056 ns | 0.035 * | 0.212 ns | 0.738 ns | 0.594 ns | 0.732 ns |
| Rainfed with N60 | 0.034 * | 0.005 ** | 0.034 * | 0.002 ** | 0.416 ns | 0.682 ns | 0.019 * | 0.751 ns |
| Rainfed without N | 0.000 *** | 0.002 ** | 0.001 *** | 0.103 ns | 0.242 ns | 0.519 ns | 0.086 ns | 0.149 ns |
| Vegetation Indices | Correlation Coefficients |
|---|---|
| NDVI vs. GA | 0.77 *** |
| NDVI vs. GGA | 0.73 *** |
| Water status indices | |
| CTD vs. δ13C | −0.57 ** |
| CTD vs. gs | 0.63 ** |
| Vegetation and water status indices | |
| NDVI vs. CTD | 0.63 ** |
| GA vs. CTD | 0.55 ** |
| GGA vs. CTD | 0.54 ** |
| NDVI vs. gs | 0.51 ** |
| GA vs. gs | 0.58 ** |
| GGA vs. gs | 0.55 ** |
| NDVI vs. δ13C | −0.43 ** |
| GA vs. δ13C | −0.49 ** |
| GGA vs. δ13C | −0.44 ** |
| Dependent Variable | Growing Conditions | Variable Chosen | Correlation Coefficients | Final Stepwise Model |
|---|---|---|---|---|
| GY | Irrigation with N120 | CTD | 0.63 *** | 0.24 CTD + 2.14 |
| GY | Irrigation with N60 | δ13C | 0.55 ** | −0.42 δ13C − 7.91 |
| GY | Irrigation without N | No variables were entered into the equation for this treatment | ||
| GY | Rainfed with N120 | CTD | 0.66 *** | 0.09 CTD + 2.27 |
| GY | Rainfed with N60 | NDVI | 0.63 ** | 0.80 NDVI + 2.33 |
| GY | Rainfed without N | No variables were entered into the equation for this treatment | ||
© 2019 by the authors. Licensee MDPI, Basel, Switzerland. This article is an open access article distributed under the terms and conditions of the Creative Commons Attribution (CC BY) license (http://creativecommons.org/licenses/by/4.0/).
Share and Cite
Yousfi, S.; Gracia-Romero, A.; Kellas, N.; Kaddour, M.; Chadouli, A.; Karrou, M.; Araus, J.L.; Serret, M.D. Combined Use of Low-Cost Remote Sensing Techniques and δ13C to Assess Bread Wheat Grain Yield under Different Water and Nitrogen Conditions. Agronomy 2019, 9, 285. https://doi.org/10.3390/agronomy9060285
Yousfi S, Gracia-Romero A, Kellas N, Kaddour M, Chadouli A, Karrou M, Araus JL, Serret MD. Combined Use of Low-Cost Remote Sensing Techniques and δ13C to Assess Bread Wheat Grain Yield under Different Water and Nitrogen Conditions. Agronomy. 2019; 9(6):285. https://doi.org/10.3390/agronomy9060285
Chicago/Turabian StyleYousfi, Salima, Adrian Gracia-Romero, Nassim Kellas, Mohamed Kaddour, Ahmed Chadouli, Mohamed Karrou, José Luis Araus, and Maria Dolores Serret. 2019. "Combined Use of Low-Cost Remote Sensing Techniques and δ13C to Assess Bread Wheat Grain Yield under Different Water and Nitrogen Conditions" Agronomy 9, no. 6: 285. https://doi.org/10.3390/agronomy9060285
APA StyleYousfi, S., Gracia-Romero, A., Kellas, N., Kaddour, M., Chadouli, A., Karrou, M., Araus, J. L., & Serret, M. D. (2019). Combined Use of Low-Cost Remote Sensing Techniques and δ13C to Assess Bread Wheat Grain Yield under Different Water and Nitrogen Conditions. Agronomy, 9(6), 285. https://doi.org/10.3390/agronomy9060285