Article

Conservation of Soil Organic Carbon and Nitrogen Fractions in a Tallgrass Prairie in Oklahoma

by
Alan J. Franzluebbers
1,*,
Patrick J. Starks
2 and
Jean L. Steiner
2,3,†
1
USDA-Agricultural Research Service, 3218 Williams Hall, NCSU Campus Box 7620, Raleigh, NC 27695, USA
2
USDA-Agricultural Research Service, Grazinglands Research Laboratory, 7207 W. Cheyenne Street, El Reno, OK 73036, USA
3
Agronomy Department, Kansas State University, Manhattan, KS 66506, USA
*
Author to whom correspondence should be addressed.
The author is retired.
Agronomy 2019, 9(4), 204; https://doi.org/10.3390/agronomy9040204
Submission received: 14 March 2019 / Revised: 13 April 2019 / Accepted: 18 April 2019 / Published: 20 April 2019
(This article belongs to the Special Issue Grassland Management for Sustainable Agroecosystems)

Abstract

:
Native grasslands in the Great Plains of North America have mostly disappeared in the past century due to agricultural expansion. A grazing study was established on Paleustolls and Argiustolls supporting a remnant, but historically grazed tallgrass prairie in central Oklahoma. Stocking method of beef cattle was differentiated into continuous and rotational treatments (10 sub-paddocks) in 2009 and these treatments continued until present. Soil was sampled in 2009 and 2012 at depths of 0–6, 6–12, 12–20, and 20–30 cm and in 2017 at depths of 0–15 and 15–30 cm. Total, particulate, microbial biomass, and mineralizable C and N fractions were highly stratified with depth, having 2–10 times greater concentration at a depth of 0–6 cm as that at 20–30 cm. Strong associations existed among most of these soil organic C and N fractions, given the large range that resulted from sampling at multiple depths. No discernable differences in soil organic C and N fractions occurred due to stocking method at any sampling time or depth. Evidence for biological nitrification inhibition suggested a mechanism for conservation of available N with less opportunity for loss. In addition, strong association of available N with biologically active C indicated slow, but sustained release of N that was strongly coupled to C cycling. We conclude that stocking method had a neutral effect on conservation of already high antecedent conditions of soil organic C and N fractions during the first 8 years of differentially imposed management.

Graphical Abstract

1. Introduction

Grasslands were historically widespread ecosystems throughout the Great Plains of North America [1]. Both mass conversion of grasslands to cropland and neglect of remaining grasslands reduced their favor on landscapes in the 20th century [2,3]. Since the turn of the new millennium, greater recognition of the importance of grasslands in conserving soil, promoting biodiversity, stabilizing farming communities, and providing a wealth of natural ecosystem services has led to renewed interest in how grasslands function [4,5]. An important aspect of regaining full functionality of grasslands has focused on how livestock are stocked and allowed to graze available forages [6,7,8].
Grazing lands typically have greater soil organic C and N contents than other agricultural land uses, despite often relegated to poorer positions of the landscape [9]. Grasslands are ecosystems with the vast majority of C stored belowground in organic matter [10,11]. However, grazing livestock are an important regulator of how C and N in grasslands are partitioned in the ecosystem [12]. Grazing alters N and P cycling by transforming plant nutrients into microbial-enhanced animal feces and by increasing potential N loss through volatilization and leaching [13,14]. Overgrazing of native rangelands can cause significant loss of soil organic C and greater in situ CO2 emission [15]. Soil organic C and associated biologically active components of microbial biomass and potentially mineralizable C were greater under pasture than under cultivated cropland in the surface 0–20 cm depth in Texas [16]. Across a diversity of studies in the southeastern USA, soil organic C sequestration under pastures was 0.84 ± 0.11 Mg C ha–1 year–1 [17]. Among mature grasslands, the presence of livestock may or may not always lead to changes in soil organic C [5,18].
Grazing of perennial forages stimulates regrowth with subsequent impacts on root turnover and storage of C and N in organic matter [18]. Grazing may also remove sufficient older forage to allow greater rates of photosynthesis and subsequent deposition of C into soil [19]. Stocking rate can be a factor in how much C and N is stored in soil as a result of how rapidly forage can recover from defoliation [20].
Rotational stocking has been recently promoted over continuous stocking to allow forage stands to rest and accumulate larger quantities of biomass more often during the year prior to initiation of grazing by livestock [21]. The objective of rotational stocking is to achieve efficient and more effective defoliation of forages to optimize pasture productivity and persistence [22]. Continuous stocking allows livestock unlimited and uninterrupted access to a pasture for as long as the manager desires. If grazed year-round, continuously stocked pastures often have hay fed to livestock during dormant periods on the same pasture that livestock graze when forage is growing. Under extreme conditions, continuous stocking can lead to dominance of the most grazing-resistant forage and/or predominance of undesirable plant species that livestock do not consume. Significant debate still exists in the scientific community as to if, how, and to what extent rotational stocking methods might improve upon functioning of grazing lands compared with continuous stocking [23,24]. From a research survey comparing farms with and without rotational stocking in Texas, soil organic matter and aggregate stability were greater in multi-paddock systems than in heavy continuous grazing [21]. In the surface 5 cm of soil, soil organic C was significantly greater with high-density rotational stocking than with continuous stocking on a previously degraded rangeland in South Africa [25]. However, among a dozen paired sites in Australia, no differences in soil organic C could be detected between rotational and continuous stocking [26].
Our goal was to contribute to this scientific discourse by documenting ecosystem-relevant effects of stocking method on soil C and N fractions in a temperate, mostly native grassland ecosystem relic in central Oklahoma of the U.S. Great Plains region. Our hypothesis was that rotational stocking would lead to improvements in soil organic C and N fractions relative to continuous stocking in response to greater residual forage mass, surface residue cover, and deeper and more vigorous rooting.

2. Materials and Methods

2.1. Experimental Conditions

The experiment was initiated in 2009 on existing pastures at the Grazinglands Research Laboratory in El Reno, Oklahoma (35°32′46″ N, 98°0′37″ W). Four experimental units were assigned one of two treatments, i.e., continuous and rotational stocking. A total of ~346 ha was included in the study on Norge silt loam (fine-silty, mixed, active, thermic Udic Paleustolls), Pond Creek silt loam (fine-silt, mixed, superactive, thermic Pachic Argiustolls), Kirkland-Pawhuska complex (fine, mixed, superactive, thermic Udertic Paleustolls), and Bethany silt loam (fine, mixed, superactive, thermic Pachic Paleustolls). Soil was sampled in April–May 2009 to a depth of 30 cm and contained 22 ± 4% clay and 31 ± 5% sand. Soil was sampled again in February–March 2012 and June–July 2017. Different sampling times were a consequence of weather and labor availability. Long-term mean annual temperature is 15.5 °C and mean annual precipitation is 801 mm.
The 346 ha area was divided into two experimental units of ~52 ha each that were assigned to continuous stocking and two experimental units of ~91 ha each that were assigned to rotational stocking. Replicates with rotational stocking were further divided into 10 nearly equally sized sub-paddocks. Stocking rate was ~0.25 head ha−1 with cow-calf pairs [27]. Continuous stocking had livestock present from March to October, while rotational stocking had several (1–3) week-long grazing events per year on any particular sub-paddock.

2.2. Soil Sampling and Analyses

In 2009, 40 soil sampling sites were located within each replicate using a stratified sampling design, where the strata were composed of soil mapping units in the area (downloaded from the NRCS Geospatial Data Gateway: https://datagateway.nrcs.usda.gov/GDGOrder.aspx) [27]. Number of sampling sites for a given strata within a field replicate was based on an area weighted average of the soil mapping units. Sampling points within a given strata were randomly located and their positions recorded by a hand-held GPS device. Soil sampling in subsequent years was guided by these GPS coordinates. Soil cores were extracted from sampling locations using a hydraulically operated probe equipped with a 30 cm long barrel and inside diameter of 4 cm. Cores were divided into depth increments (0–6, 6–12, 12–20, and 20–30 cm in 2009 and 2012 and 0–15 and 15–30 cm in 2017), air-dried, and placed in a sealable plastic bag for later processing.
Dried soil was sieved to pass a screen with 4.75 mm openings prior to all analyses. For total organic C and total soil N, a representative 20–30 g subsample was ball-milled to a fine powder and ~1 g of sample was analyzed with dry combustion using a Leco TruSpec on samples collected in 2009 and 2012 and using a Leco TruMac on samples collected in 2017. Using the ball-milled subsample, residual inorganic N was determined from a filtered extract of a 10 g subsample shaken with 20 mL of 2 M KCl for 30 min by salicylate-nitroprusside (NH4-N) and hydrazine reduction (NO3-N) autoanalyzer techniques [28].
All other analyses were determined on coarsely-sieved soil using a standardized laboratory approach according to the following [29]. In all three years of evaluation, two subsamples of soil were incubated in tandem for determination of potential C and N mineralization, soil microbial biomass C, and particulate organic C and N. Two subsamples were weighed into volume-delimited 60 mL glass bottles—two 20 g subsamples in 2009, two 40 g subsamples in 2012, and two 50 g subsamples in 2017. Dried soil was wetted to 50% water-filled pore space after determining the volume of lightly packed soil to the nearest 5 mL. Both subsamples were placed into the same 1 L canning jar along with a screw-cap vial containing 10 mL of 1 M NaOH to trap CO2 and a vial of water to maintain humidity. Jars were incubated at 25 °C for up to 24 days. Alkali traps were replaced at 3 and 10 days of incubation. Evolved CO2-C was determined by titration with 1 M HCl in the presence of excess BaCl2 and vigorous stirring to a phenolphthalein endpoint. At 10 days, one of the subsamples was removed from the incubation jar, fumigated with CHCl3 under vacuum for 1 day, vapors removed, placed into a separate canning jar along with vials of alkali and water, and incubated at 25 °C for 10 more days. Potential C mineralization was calculated from the cumulative evolution of CO2 during 24 days of incubation. Soil-test biological activity was from the flush of CO2 that occurred in the first 3 days of incubation. Basal soil respiration was calculated from the assumed near-linear rate of C mineralization from 10 to 24 days of incubation (i.e., as potential steady-state respiration rate). Potential N mineralization was determined from the difference in inorganic N concentration between 0 and 24 days of incubation. Inorganic N (NH4-N + NO2-N + NO3-N) at the end of 24 days of incubation was determined from the filtered extract of a 10 g subsample of dried (55 °C for ≥2 days) and sieved (<2 mm) soil that was shaken with 20 mL of 2 M KCl for 30 min using salicylate-nitroprusside and hydrazine reduction autoanalyzer techniques. Particulate organic matter was isolated from the dried subsample (55 °C for ≥2 days) that was incubated for microbial biomass C determination. The entire subsample was transferred to a 125 mL Nalgene screw-top bottle, shaken with 0.01 M Na4P2O7 overnight for ~16 h, and the suspension passed over a screen with 0.053 mm openings to collect particulate organic matter. Material on the screen was washed with a stream of water until effluent became clear and transferred to a glass drying vessel. Samples were dried in an oven at 55 °C for 1 day past visual dryness. Dried samples were weighed to determine sand concentration, ball-milled to a fine powder, and analyzed for C and N concentrations with dry combustion.

2.3. Statistical Analyses

Soil C and N properties were analyzed using the general linear model procedure of SAS v. 9.4 for each year separately. Grazing method was the main effect and soil depth increment was considered a repeated measure with a separate error term. Means were separated using least significant difference (LSD) with alpha set at 0.05. In 2012, soil was collected from each of 10 separate paddocks within each of the two field replicates of both treatments. Mean values across the 10 subunits were computed, such that a total of four experimental units with four sampling depths (4 × 4 = 16 observations) was statistically analyzed the same way in 2009 and 2012. Only two depth increments (0–15 and 15–30 cm) were sampled in 2017 for a total of eight observations. In 2012, mean square error from within-paddock variation (i.e., 10 locations within a paddock across 2 treatments and 4 depths) was computed and compared with mean square error from between-paddock variation (i.e., 2 replications across 2 treatments and 4 depths).

3. Results and Discussion

3.1. Total Organic C and N

Total soil N was not affected by grazing management during any year of sampling and at any soil depth, as shown in Table 1. However, total soil N was highly stratified with soil depth, and remained so over time. Concentration of total soil N at the surface depth of 0–6 cm was nearly double that at the 6–12-cm depth and was 2.5–3 times greater than concentration at the 20–30 cm depth. Total soil N concentration of the 0–15 cm depth in 2017 was 1.8–2.0 times greater than at the 15–30 cm depth. These data clearly show that protection of surface soil from erosion is important in preserving N in soil. Within-paddock variation of total soil N was 3.4 times greater than between-paddock variation, suggesting that representative sampling of each paddock from multiple cores was a necessary step in characterizing soil condition.
Total organic C followed a similar pattern of declining concentration with a depth like that of total soil N (data not shown). Soil C:N ratio was greater in the surface 0–6 cm depth than other depths, and this was likely due to deposition of partially decomposed surface residue inputs. In 2009, soil C:N ratio was 15.6 ± 0.4 g g−1 at a depth of 0–6 cm and 13.3 ± 0.5 g g−1 at all lower depths. In 2012, within-paddock variation of total organic C was 3.3 times greater than between-paddock variation.

3.2. Particulate Organic C and N

Grazing management did not significantly affect particulate organic C at any soil depth, as shown in Table 2. Particulate organic C was more stratified with depth than total organic C or total soil N. As a portion of total organic C, particulate organic C was 341 ± 48 g kg−1 at a depth of 0–6 cm in 2009 and 2012 and was 109 ± 20 g kg−1 at depths of 6–30 cm. Such large stratification of particulate organic C with soil depth has been observed previously in managed pastures of Georgia [30]. Similarly, in cropland managed with no-tillage following termination of long-term pasture, the portion of total organic C as particulate organic C was between 300 and 400 g kg−1 at a depth of 0–6 cm, while it was 200 to 300 g kg−1 under conventional tillage [31]. Keeping soil undisturbed and allowing it to accumulate decomposing residues leads to an enrichment of particulate organic matter near the surface. From observations in Georgia, return of residues to the soil surface via dung deposition and trampling with grazing led to greater particulate organic C and portion of total organic C as particulate organic C compared with haying [30]. In the current study, stocking method did not appear to alter the balance between particulate and total organic C.

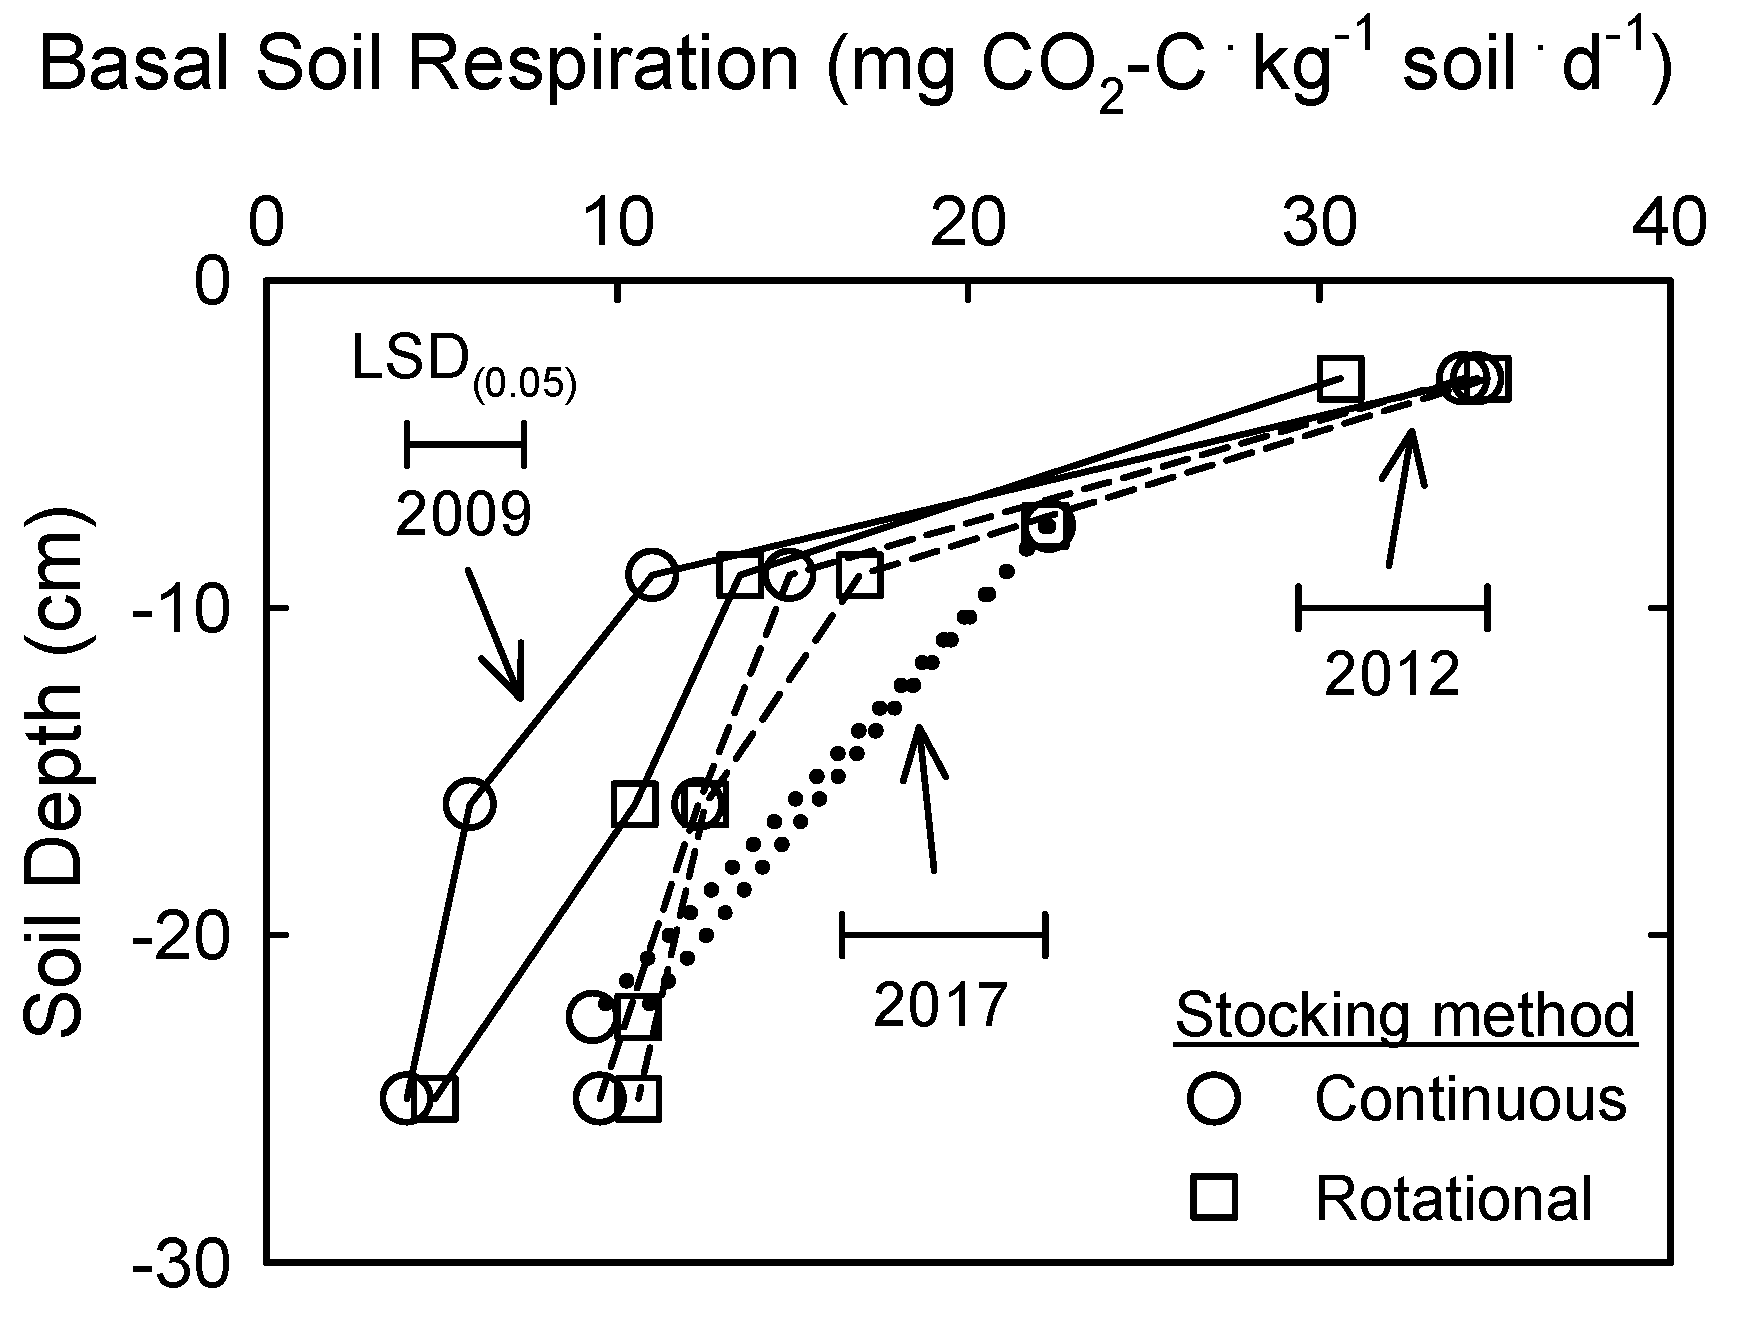
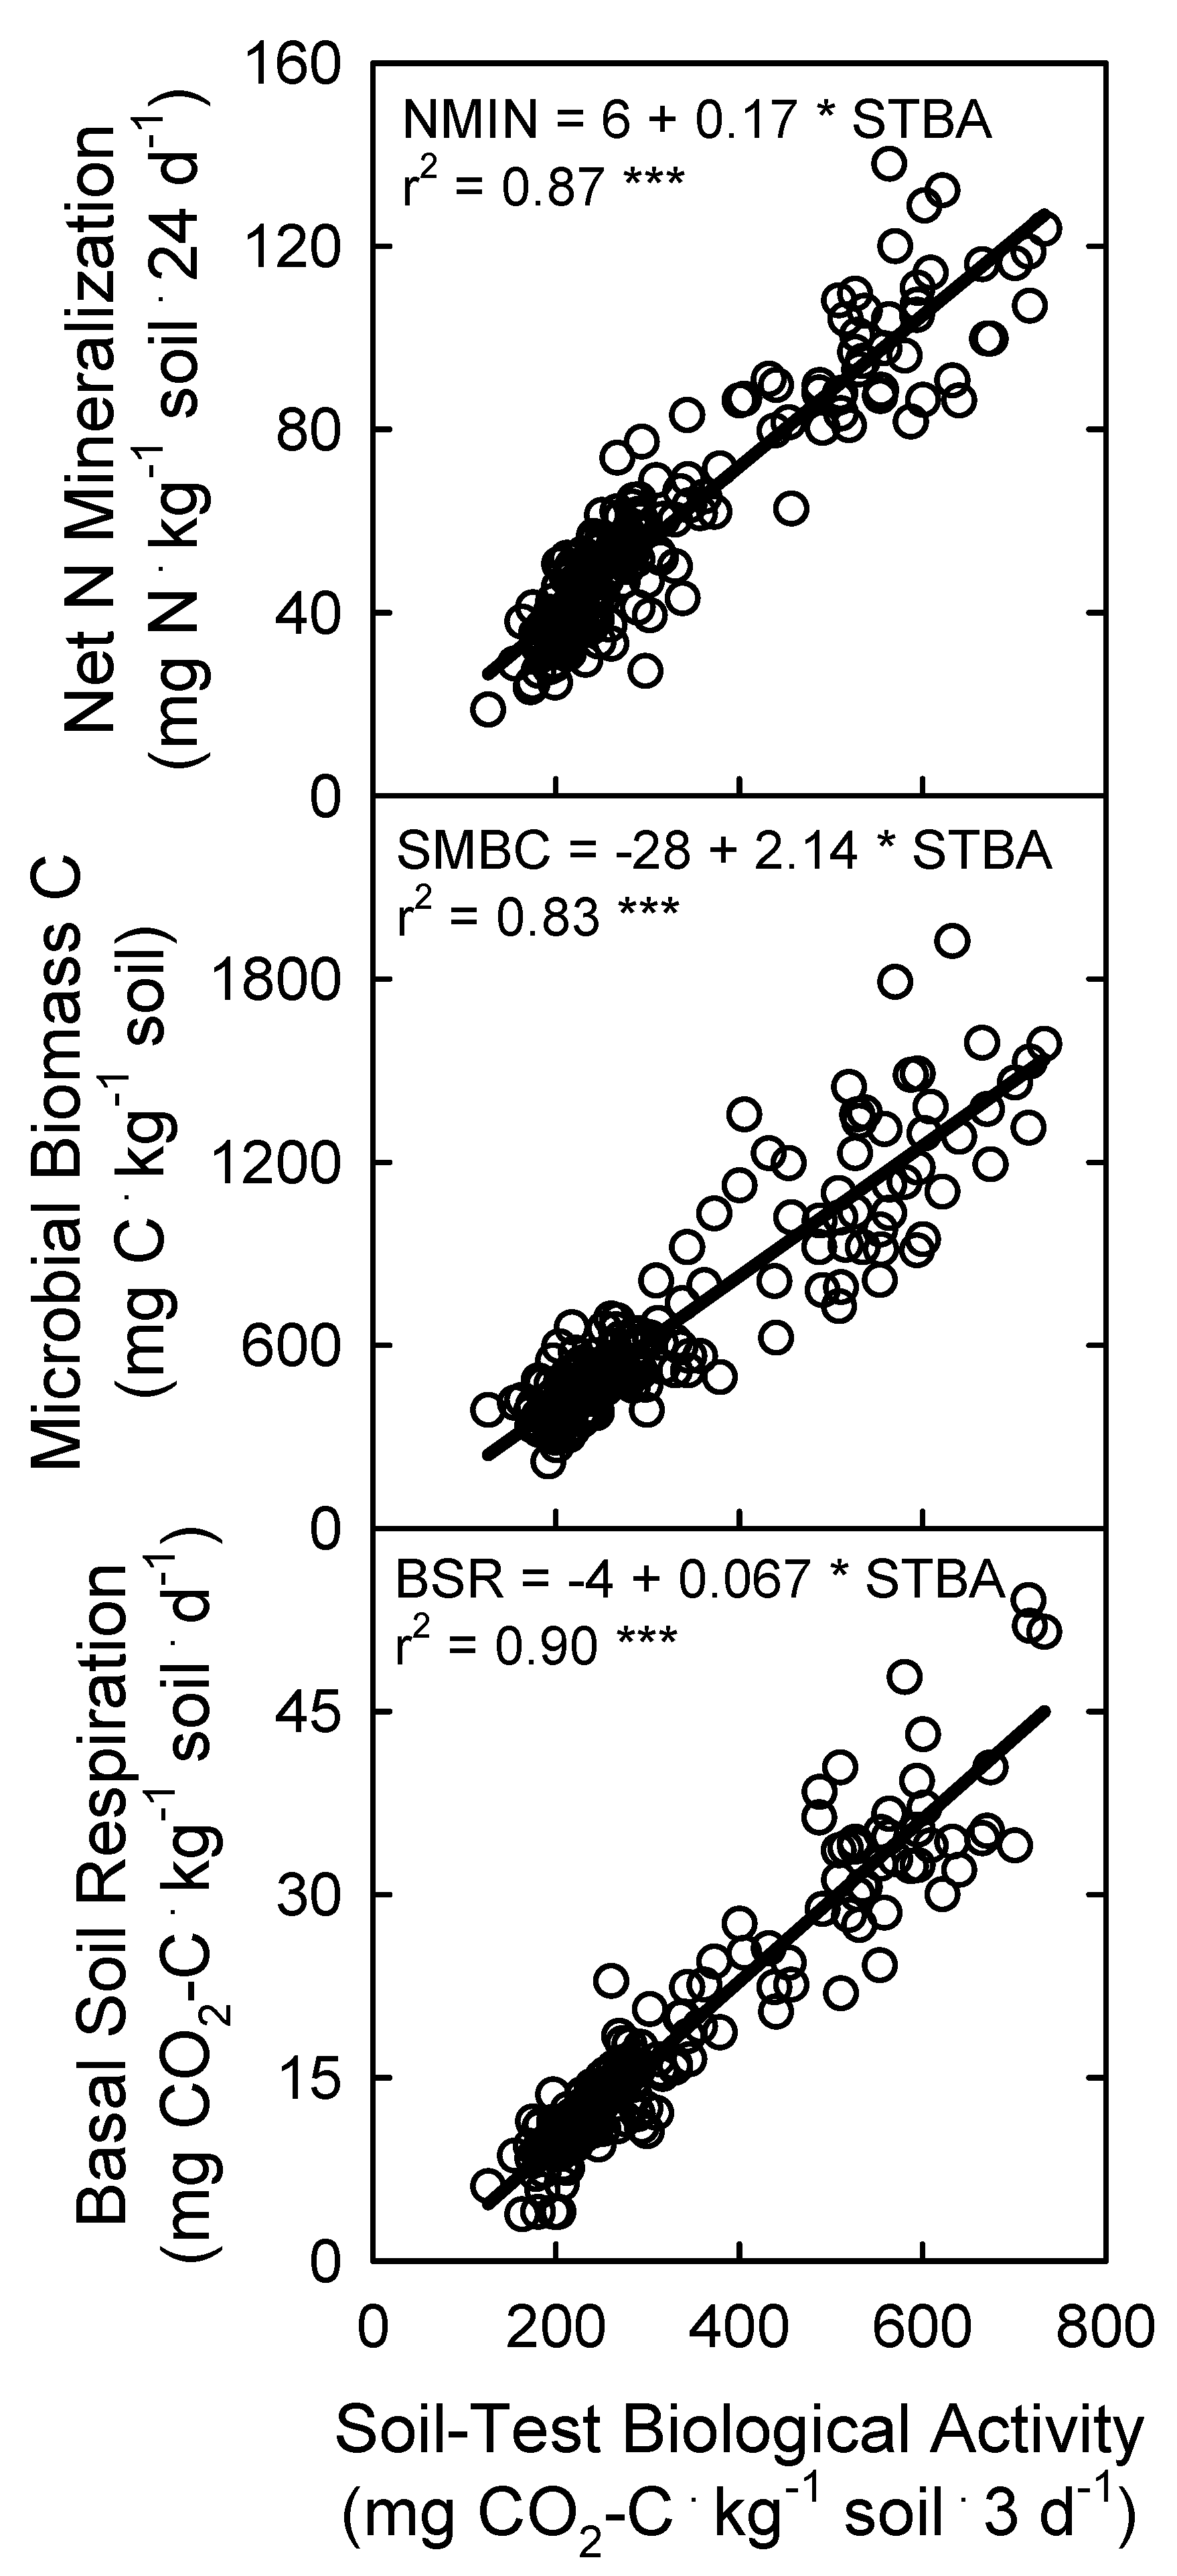
3.3. Soil Microbial Biomass and Activity

Soil microbial biomass C was not affected by grazing management regime in any particular year of sampling, but a shift with time was trending towards greater microbial biomass C near the soil surface with rotational stocking compared with continuous stocking, as shown in Table 3. Although not directly comparable, soil microbial biomass C levels were similar in magnitude as a study with newly developed bermudagrass pasture in Georgia [32]. In 2012, within-paddock variation of soil microbial biomass C was 5.0 times greater than between-paddock variation.
Basal soil respiration was highly stratified with depth, like other soil C and N properties, but was generally not affected by stocking method, as shown in Figure 1. However, at a depth of 12–20 cm in 2009, basal soil respiration was greater under rotational than continuous stocking. The lack of consistency in this effect over time suggests that it may have been an artefact of sampling/analysis technique or random variation within the field. All years of data clearly showed the strong depth stratification, even when changing from narrow soil depth increments to broader depth increments. In 2012, within-paddock variation of basal soil respiration was 3.6 times greater than between-paddock variation.
Soil-test biological activity was not affected by stocking method and was gradually stratified with depth like many other soil C and N properties, as shown in Table 4. Soil-test biological activity was highly associated with soil microbial biomass C, as well as with other indicators of soil microbial activity like basal soil respiration and net N mineralization, as shown in Figure 2. Strong association among these biological indicators has been documented previously [33]. Soil-test biological activity was also highly associated with total soil N (r2 = 0.86, p < 0.001). Soil-test biological activity has recently been suggested as a simple, rapid indicator of biologically derived soil N that can supply greenhouse-grown [34] and field-grown forages [35] with N. Proportional to total soil N, net N mineralization during 24 days of aerobic incubation at standard temperature and water conditions released 40 g N kg−1 total soil N. This would be a considerable amount of N that could supply forage plants with N on an annual basis. Assuming an average bulk density of the surface 12 cm of 1.1 Mg m−3 and using the average total soil N of the surface 12 cm of 2.10 g N kg−1, then this soil would have contained 2767 kg N ha−1. If 40 g N kg−1 soil (4%) were considered mineralizable, then 111 kg N ha−1 could be expected to be mineralized from inherent soil conditions in a growing season. Considering soil from 12–30 cm with bulk density of 1.2 Mg m−3 and 1.09 g N kg−1, then an additional 2360 kg N ha−1 would be present with expected mineralization of 94 kg N ha−1. A total of 205 kg N ha−1 mineralized from organic matter could support 13.7 Mg ha−1 of forage that had an average N concentration of 15 g kg−1. Assuming this forage was consumed and only a small fraction removed in animal carcass, the majority of this N could be effectively recycled year after year. However, significant losses of N could occur through NH3 volatilization from urine deposits, as well as denitrification and leaching if sufficient nitrate were present.

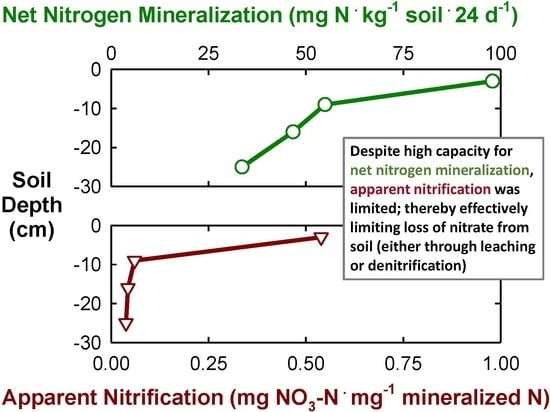
3.4. Residual Inorganic N and Net N Mineralization

Residual inorganic N in soil was predominately in the form of NH4-N and barely detectable in the form of NO3-N, as shown in Table 5. Low residual soil nitrate in this pasture ecosystem would suggest that either rapid plant uptake limited accumulation of nitrate in soil or that nitrification was slow or limited in this soil. Interestingly, evidence for limited nitrification potential was observed during the laboratory incubation, in which apparent nitrification estimates during the 24 day aerobic incubation were only ~50% of mineralized N and declined with soil depth, as shown in Table 6. Nitrification activity is typically high in modern agricultural production systems, but may be much more limited in low-N-input production systems using traditional crop rotations and diversity of crops [36]. Biological nitrification inhibition is a potential mechanism that might have prevailed in this grassland ecosystem, which was dominated by warm-season perennial grasses with relatively low N input. In Brazil under Brachiaria humidicola pasture, very low nitrate accumulation occurred following urine application, suggesting significant biological nitrification inhibition and subsequently reduced N2O emission [37]. Another possibility is that frequently water-limited conditions at this location in Oklahoma may chronically impede nitrifying activity. Whatever the mechanism for this low nitrifying activity, it may be an effective strategy to avoid N loss in an otherwise N limited natural ecosystem that relies on organic matter accumulation and internal N cycling for maintaining productivity.
Further evidence for inhibition of nitrification was from strong net N mineralization that corresponded proportionally to variations in C mineralization, as shown in Figure 2. During the 24 day incubation period, significant accumulation of NH4-N occurred at all depths, averaging 49 ± 14 mg NH4-N kg−1 soil at a depth of 0–6 cm in both 2009 and 2012 and 43 ± 10 mg NH4-N kg−1 soil at depths of 6–30 cm. Significant nitrification occurred at the 0–6 cm depth with additional accumulation of 57 ± 23 mg NO3-N kg−1 soil, but limited nitrification could be detected at depths of 6–30 cm with only 5 ± 6 mg NO3-N kg−1 soil accumulated during the 24 day incubation. Net N mineralization during 24 days of incubation was strongly stratified with soil depth, like many other soil C and N fractions, as shown in Table 7. The soil-handling process of oven-drying prior to rewetting may have altered nitrification potential somewhat, but it was not considered a major factor since apparent nitrification in cropland soils using the same laboratory protocols was 0.92 ± 0.13, 0.71 ± 0.27, and 0.53 ± 0.29 mg NO3-N mg−1 total N mineralized at depths of 0–10, 10–20, and 20–30 cm, respectively [33].

4. Conclusions

Stocking method on tallgrass prairie pasture during an 8 year period had little discernable effect on soil C and N fractions within the surface 30 cm of the soil profile. This may have been due to the lack of recent soil disturbance and high antecedent concentration of soil properties prior to initiation of this study. All soil organic C and N properties were highly stratified with depth. One curious finding was the occurrence of what appeared to be significant biological nitrification inhibition, which may have provided substantial conservation of N for internal cycling of N from soil to forages, and ultimately for livestock protein intake and animal performance, and subsequent deposition back onto pasture with urine and feces. We conclude that in this intermediate period of grassland evaluation, rotational stocking of livestock did not lead to changes in total, particulate, microbial biomass, or mineralizable fractions of C and N as compared with continuous stocking. Of key importance in this study was the preservation of soil properties with both grazing management approaches. We documented strong association among biologically active fractions of soil organic C and N.

Author Contributions

Conceptualization, P.J.S. and J.L.S.; methodology, A.J.F.; formal analysis, A.J.F.; investigation, P.J.S. and J.L.S.; resources, A.J.F., P.J.S., and J.L.S.; writing—original draft preparation, A.J.F.; writing—review and editing, P.J.S. and J.L.S.; supervision, J.L.S.; project administration, P.J.S. and J.L.S.

Funding

This research was a contribution from the Long Term Agroecosystem Research (LTAR) network. USDA-Agricultural Research Service and USDA-National Institute of Food and Agriculture (AFRI Grant 2012-02355 and 2013-69002-23146) provided financial support.

Acknowledgments

We thank Ellen Leonard, Ashtyn Mizelle, and Erin Silva for sound technical support with laboratory analyses. We are grateful for the dedicated field support of G.P. King, D. Walker, and D. Gassen.

Conflicts of Interest

The authors declare no conflict of interest.

References

  1. Stefferud, A. (Ed.) Grass: The 1948 Yearbook of Agriculture; U.S. Govt. Print. Office: Washington, DC, USA, 1948; 892p.
  2. Savory, A.; Butterfield, J. Holistic Management, 2nd ed.; Island Press: Washington, DC, USA, 1999; 616p. [Google Scholar]
  3. Wedin, W.F.; Fales, S.L. (Eds.) Grassland: Quietness and Strength for a New American Agriculture; American Society for Agronomy, Crop Science Society of America, Soil Science Society of America: Madison, WI, USA, 2009; 256p. [Google Scholar]
  4. Franzluebbers, A.J. Ecosystem services from forages. In Cool Forages: Advanced Management of Temperate Forages; Bittman, S., Hunt, D., Eds.; Pacific Field Corn Association: Agassiz, BC, Canada, 2013; pp. 2–6. [Google Scholar]
  5. Sollenberger, L.E.; Kohmann, M.M.; Dubeux, J.C.B.; Silveira, M.L. Grassland management affects delivery of regulating and supporting ecosystem services. Crop Sci. 2019, 59, 441–459. [Google Scholar] [CrossRef]
  6. Briske, D.D.; Derner, J.D.; Brown, J.R.; Fuhlendorf, S.D.; Teague, W.R.; Havstad, K.M.; Gillen, R.L.; Ash, A.J.; Willms, W.D. Rotational grazing on rangelands: Reconciliation of perception and experimental evidence. Rangel. Ecol. Manag. 2008, 61, 3–17. [Google Scholar] [CrossRef]
  7. Franzluebbers, A.J.; Paine, L.K.; Winsten, J.R.; Krome, M.; Sanderson, M.A.; Ogles, K.; Thompson, D. Well-managed grazing systems: A forgotten hero of conservation. J. Soil Water Conserv. 2012, 67, 100A–104A. [Google Scholar] [CrossRef] [Green Version]
  8. Nelson, C.J. (Ed.) Conservation Outcomes from Pastureland and Hayland Practices: Assessment, Recommendations, and Knowledge Gaps; Allen Press, Inc.: Lawrence, KS, USA, 2012; 362p. [Google Scholar]
  9. Franzluebbers, A.J. Grass roots of soil carbon sequestration. Carbon Manag. 2012, 3, 9–11. [Google Scholar] [CrossRef]
  10. Parton, W.J.; Stewart, J.W.B.; Cole, C.V. Dynamics of C, N, P and S in grassland soils: A model. Biogeochemistry 1988, 5, 109–131. [Google Scholar] [CrossRef]
  11. Burke, I.C.; Yonker, C.M.; Parton, W.J.; Cole, C.V.; Flach, K.; Schimel, D.S. Texture, climate and cultivation effects on soil organic matter content in U.S. grassland soils. Soil Sci. Soc. Am. J. 1989, 53, 800–805. [Google Scholar] [CrossRef]
  12. Steinfeld, H.; Wassenaar, T. The role of livestock production in carbon and nitrogen cycles. Ann. Rev. Environ. Resour. 2007, 32, 271–294. [Google Scholar] [CrossRef]
  13. Taboada, M.A.; Rubio, G.; Chaneton, E.J. Grazing impacts on soil physical, chemical and ecological properties in forage production systems. In Soil Management: Building a Stable Base for Agriculture; Hatfield, J.L., Sauer, T.J., Eds.; American Society for Agronomy, Soil Science Society of America: Madison, WI, USA, 2011; pp. 301–320. [Google Scholar]
  14. Soussana, J.-F.; Lemaire, G. Coupling carbon and nitrogen cycles for environmentally sustainable intensification of grasslands and crop-livestock systems. Agric. Ecosyst. Environ. 2014, 190, 9–17. [Google Scholar] [CrossRef]
  15. Abdalla, K.; Mutema, M.; Chivenge, P.; Everson, C.; Chaplot, V. Grassland degradation significantly enhances soil CO2 emission. Catena 2018, 167, 284–292. [Google Scholar] [CrossRef]
  16. Franzluebbers, A.J.; Hons, F.M.; Zuberer, D.A. In situ and potential CO2 evolution from a Fluventic Ustochrept in southcentral Texas as affected by tillage and cropping intensity. Soil Tillage Res. 1998, 47, 303–308. [Google Scholar] [CrossRef]
  17. Franzluebbers, A.J. Achieving soil organic carbon sequestration with conservation agricultural systems in the southeastern United States. Soil Sci. Soc. Am. J. 2010, 74, 347–357. [Google Scholar] [CrossRef]
  18. Hewins, D.B.; Lyseng, M.P.; Schoderbek, D.F.; Alexander, M.; Willms, W.D.; Carlyle, C.N.; Chang, S.X.; Bork, E.W. Grazing and climate effects on soil organic carbon concentration and particle-size association in northern grasslands. Sci. Rep. 2018, 8, 1336. [Google Scholar] [CrossRef] [PubMed]
  19. Gomez-Casanovas, N.; DeLucia, N.J.; Bernacchi, C.J.; Boughton, E.H.; Sparks, J.P.; Chamberlain, S.D.; DeLucia, E.H. Grazing alters net ecosystem C fluxes and the global warming potential of a subtropical pasture. Ecol. Appl. 2018, 28, 557–572. [Google Scholar] [CrossRef] [PubMed]
  20. Wright, A.L.; Hons, F.M.; Rouquette, F.M. Long-term management impacts on soil carbon and nitrogen dynamics of grazed bermudagrass pastures. Soil Biol. Biochem. 2004, 36, 1809–1816. [Google Scholar] [CrossRef]
  21. Teague, W.R.; Dowhower, S.L.; Baker, S.A.; Haile, N.; DeLaune, P.B.; Conover, D.M. Grazing management impacts on vegetation, soil biota and soil chemical, physical and hydrological properties in tall grass prairie. Agric. Ecosyst. Environ. 2011, 141, 310–322. [Google Scholar] [CrossRef]
  22. Sollenberger, L.E.; Agouridis, C.T.; Vanzant, E.S.; Franzluebbers, A.J.; Owens, L.B. Prescribed grazing on pasturelands. In Conservation Outcomes from Pastureland and Hayland Practices: Assessment, Recommendations, and Knowledge Gaps; Nelson, C.J., Ed.; Allen Press, Inc.: Lawrence, KS, USA, 2012; pp. 111–204. [Google Scholar]
  23. Briske, D.D.; Sayer, N.F.; Huntsinger, L.; Fernandez-Gimenez, M.; Budd, B.; Derner, J.D. Origin, persistence, and resolution of the rotations grazing debate: Integrating human dimensions into rangeland research. Rangel. Ecol. Manag. 2011, 64, 325–334. [Google Scholar] [CrossRef]
  24. Teague, R.; Provenza, F.; Kreuter, U.; Steffens, T.; Barnes, M. Multi-paddock grazing on rangelands: Why the perceptual dichotomy between research results and rancher experience? J. Environ. Manag. 2013, 128, 699–717. [Google Scholar] [CrossRef] [PubMed]
  25. Chaplot, V.; Dlamini, P.; Chivenge, P. Potential of grassland rehabilitation through high density-short duration grazing to sequester atmospheric carbon. Geoderma 2016, 271, 10–17. [Google Scholar] [CrossRef] [Green Version]
  26. Sanderman, J.; Reseigh, J.; Wurst, M.; Young, M.-A.; Austin, J. Impacts of rotational grazing on soil carbon in native grass-based pastures in southern Australia. PLoS ONE 2015, 10, e0136157. [Google Scholar] [CrossRef] [PubMed]
  27. Steiner, J.L.; Starks, P.J.; Neel, J.P.S.; Northup, B.; Turner, K.E.; Gowda, P.; Coleman, S.; Brown, M. Managing Tallgrass Prairies for Productivity and Ecological Function: A Long Term Grazing Experiment in the Southern Great Plains, USA; USDA-Agricultural Research Service: Raleigh, NC, USA, 2019.
  28. Bundy, L.G.; Meisinger, J.J. Nitrogen availability indices. In Methods of Soil Analysis, Part 2; Weaver, R.W., Angle, J.S., Bottomley, P.J., Eds.; Soil Science Society of America: Madison, WI, USA, 1994; pp. 951–984. [Google Scholar]
  29. Franzluebbers, A.J.; Stuedemann, J.A. Early response of soil organic fractions to tillage and integrated crop-livestock production. Soil Sci. Soc. Am. J. 2008, 72, 613–625. [Google Scholar] [CrossRef]
  30. Franzluebbers, A.J.; Stuedemann, J.A. Particulate and non-particulate fractions of soil organic carbon under pastures in the Southern Piedmont USA. Environ. Pollut. 2002, 116, S53–S62. [Google Scholar] [CrossRef]
  31. Franzluebbers, A.J.; Stuedemann, J.A. Temporal dynamics of total and particulate organic carbon and nitrogen in cover crop grazed cropping systems. Soil Sci. Soc. Am. J. 2014, 78, 1404–1413. [Google Scholar] [CrossRef]
  32. Franzluebbers, A.J.; Stuedemann, J.A. Bermudagrass management in the Southern Piedmont USA. III. Particulate and biologically active soil carbon. Soil Sci. Soc. Am. J. 2003, 67, 132–138. [Google Scholar] [CrossRef]
  33. Franzluebbers, A.J.; Pershing, M.R.; Crozier, C.; Osmond, D.; Schroeder-Moreno, M. Soil-test biological activity with the flush of CO2: I. C and N characteristics of soils in corn production. Soil Sci. Soc. Am. J. 2018, 82, 685–695. [Google Scholar] [CrossRef]
  34. Franzluebbers, A.J.; Pershing, M.R. Soil-test biological activity with the flush of CO2: II. Greenhouse growth bioassay from soils in corn production. Soil Sci. Soc. Am. J. 2018, 82, 696–707. [Google Scholar] [CrossRef]
  35. Franzluebbers, A.J.; Pehim-Limbu, S.; Poore, M.H. Soil-test biological activity with the flush of CO2: IV. Fall-stockpiled tall fescue yield response to applied nitrogen. Agron. J. 2018, 110, 2033–2049. [Google Scholar] [CrossRef]
  36. Subbarao, G.V.; Yoshihashi, T.; Worthington, M.; Nakahara, K.; Ando, Y.; Sahrawat, K.L.; Rao, I.M.; Lata, J.-C.; Kishii, M.; Braun, H.-J. Suppression of soil nitrification by plants. Plant Sci. 2015, 233, 155–164. [Google Scholar] [CrossRef] [PubMed]
  37. Byrnes, R.C.; Nunez, J.; Arenas, L.; Rao, I.; Trujillo, C.; Alvarez, C.; Arango, J.; Rasche, F.; Chirinda, N. Biological nitrification inhibition by Brachiaria grasses mitigates soil nitrous oxide emissions from bovine urine patches. Soil Biol. Biochem. 2017, 107, 156–163. [Google Scholar] [CrossRef]
Figure 1. Basal soil respiration as affected by stocking method, soil depth, and year of sampling. Least significant difference (p < 0.05) is among all means within a year of sampling.
Agronomy 09 00204 g001
Figure 2. Association of soil-test biological activity to other indicators of soil biology, including basal soil respiration, soil microbial biomass C, and net N mineralization during aerobic incubation. *** indicates significance of association at p < 0.001.
Agronomy 09 00204 g002
Table 1. Total soil N (g N kg−1 soil) as affected by stocking method, soil depth, and year of sampling.
Soil Depth (cm)200920122017 *
ContinuousRotationalContinuousRotationalContinuousRotational
0−63.052.842.572.491.981.82
6−121.551.521.371.38
12−201.231.221.151.160.991.02
20−301.010.971.001.00
LSD (p < 0.05)0.400.080.39
LSD: Least significant difference (p < 0.05) is among all means within a year of sampling. * Sampling in 2017 was 0−15 and 15−30 cm depths.
Table 2. Particulate organic C (g C kg−1 soil) as affected by stocking method, soil depth, and year of sampling.
Soil Depth (cm)200920122017 *
ContinuousRotationalContinuousRotationalContinuousRotational
0–618.916.410.39.94.54.3
6–122.62.92.02.0
12–201.61.71.41.50.91.0
20–301.21.11.11.1
LSD (p < 0.05)4.91.21.4
LSD: Least significant difference (p < 0.05) is among all means within a year of sampling. * Sampling in 2017 was 0–15 and 15–30 cm depths.
Table 3. Soil microbial biomass C (mg C kg−1 soil) as affected by stocking method, soil depth, and year of sampling.
Soil Depth (cm)200920122017 *
ContinuousRotationalContinuousRotationalContinuousRotational
0–6130691511711274719800
6–12647670560588
12–20333410472510260297
20–30383448401389
LSD (p < 0.05)370129193
LSD: Least significant difference (p < 0.05) is among all means within a year of sampling. * Sampling in 2017 was 0–15 and 15–30 cm depths.
Table 4. Soil-test biological activity (mg CO2-C kg−1 soil 3 day−1) as affected by stocking method, soil depth, and year of sampling.
Soil Depth (cm)200920122017 *
ContinuousRotationalContinuousRotationalContinuousRotational
0–6575565535581497475
6–12280297278293
12–20207225235241203210
20–30189174207209
LSD (p < 0.05)7260161
LSD: Least significant difference (p < 0.05) is among all means within a year of sampling. * Sampling in 2017 was 0–15 and 15–30 cm depths.
Table 5. Residual inorganic N (separated into NH4-N and NO3-N components) as affected by stocking method, soil depth, and year of sampling.
Soil Depth (cm)200920122017 *
ContinuousRotationalContinuousRotationalContinuousRotational
Residual soil ammonium (mg NH4-N kg−1 soil)
0–67142423159
6–12891414
12–20147101096
20–3011688
LSD (p < 0.05)823
Residual soil nitrate (mg NO3-N kg−1 soil)
0–6111111
6–121122
12–201111<1<1
20–301111
LSD (p < 0.05)1<11
LSD: Least significant difference (p < 0.05) is among all means within a year of sampling. * Sampling in 2017 was 0–15 and 15–30 cm depths.
Table 6. Apparent nitrification of mineralized N (mg NO3-N accumulation mg−1 mineralized N) as affected by stocking method, soil depth, and year of sampling.
Soil Depth (cm)200920122017 *
ContinuousRotationalContinuousRotationalContinuousRotational
0–60.440.580.570.510.120.15
6–120.250.190.080.05
12–200.120.120.040.040.030.03
20–300.110.090.040.04
LSD (p < 0.05)0.340.140.11
LSD: Least significant difference (p < 0.05) is among all means within a year of sampling. * Sampling in 2017 was 0–15 and 15–30 cm depths.
Table 7. Net N mineralization (mg N kg−1 soil 24 day−1) as affected by stocking method, soil depth, and year of sampling.
Soil Depth (cm)200920122017 *
ContinuousRotationalContinuousRotationalContinuousRotational
0–611012097998982
6–1276655555
12–20465446473338
20–3032373334
LSD (p < 0.05)3573
LSD: Least significant difference (p < 0.05) is among all means within a year of sampling. * Sampling in 2017 was 0–15 and 15–30 cm depths.

