Article

Transcriptome Analysis of Banana (Musa acuminate L.) in Response to Low-Potassium Stress

Hainan Key Laboratory for Sustainable Utilization of Tropical Bioresources, Institute of Tropical Agriculture and Forestry, Hainan University, No.58 Renmin Avenue, Haikou 570228, China
*
Author to whom correspondence should be addressed.
Agronomy 2019, 9(4), 169; https://doi.org/10.3390/agronomy9040169
Submission received: 1 March 2019 / Revised: 23 March 2019 / Accepted: 27 March 2019 / Published: 29 March 2019

Abstract

:
Potassium (K+) is an abundant and important macronutrient for plants. It plays crucial roles in many growth and developmental processes, and growth is inhibited under low −K+ conditions. The molecular mechanisms operating under K+ starvation have been little reported in banana, which is a non-model plant. We conducted a transcriptome analysis of banana (Musa acuminata L. AAA group, cv. Cavendish) in response to low −K+ stress. The phenotypic traits and transcriptomic profiles of banana leaves and roots were compared between low −K+ (LK) and normal −K+ (NK) groups. The phenotypic parameters for the LK group, including fresh and dry weight, were lower than those for the NK group, which suggested that low −K+ stress may inhibit some important metabolic and biosynthetic processes. K+ content and biomass were both decreased in the LK group compared to the NK group. Following ribonucleic acid sequencing (RNA-Seq), a total of 26,796 expressed genes were detected in normal −K+ leaves (NKL), 27,014 were detected in low −K+ leaves (LKL), 29,158 were detected in normal −K+ roots (NKR), and 28,748 were detected in low −K+ roots (LKR). There were 797 up-regulated differentially expressed genes (DEGs) and 386 down-regulated DEGs in NKL versus LKL, while there were 1917 up-regulated DEGs and 2830 down-regulated DEGs in NKR versus LKR. This suggested that the roots were more sensitive to low −K+ stress than the leaves. DEGs related to K+ transport and uptake were analyzed in detail. Gene functional classification showed that the expression of genes regarding ABC transporters, protein kinases, transcription factors, and ion transporters were also detected, and may play important roles during K+ deficiency.

1. Introduction

Potassium (K+) is one of the most abundant and important macronutrients in high-biomass plants, especially in banana plants [1]. It accounts for 2–10% of the total dry weight in plants, and plays key roles in plant growth and development processes, such as osmoregulation, photosynthetic efficiency via balancing gas exchange, pH adjustment, the cotransport of sugars, activating enzymes, and protein biosynthesis [2,3,4]. It has been reported that the concentration of K+ in soil is usually below 1 mM [5]. However, K+ accumulates in plant cells and can reach concentrations of 100 mM [6]. Therefore, many plants experience low −K+ stress during their lives [7]. The low −K+ stress signals can be transducted across the plasma membrane and into the cytosol, and the K+ homeostasis is modulated by K+ channels and transporters, which facilitates plant adaptation to K+-deficient conditions [8]. When faced with low −K+ conditions, the growth rate slows and can even stop, the leaves of most plants become yellow and old leaves display tip-burn, pathogen susceptibility increases, and fruit yield and quality decreases [9].
Efficient K+ uptake and survival under K+-starved conditions are of great importance to plants. Ion uptake and transport in plants occur via a complicated signaling network, with a variety of anions and cations participating in salinity stress tolerance. It has been reported that plants maintain a constant level of K+ via K+ transporters and channels, enabling them to adapt to low −K+ conditions [10]. A variety of K+ transporters and channels have been described in relation to K+ uptake, such as the high-affinity K+ transporter/K+ uptake transporter (HAK/KUP/KT) family, which includes AtHAK1/5 [11], PpHAK2 [12], AtKUP1 [13], and OsHKT2 [14,15], and K+ transporters such as AtAKT1/5 [16] and OsAKT1 [17,18]. These transporters and channels are associated with K+ uptake and maintain K+ homeostasis in plant cells. Low−K+ conditions are a typical form of abiotic stress, and can induce a series of biological responses. Reactive oxygen species (ROS) and plant phytohormones are induced during K+ starvation [19,20]. There have been many studies of the molecular mechanisms that occur under K+ starvation using model plants such as Arabidopsis and rice. However, these mechanisms have little reported in banana as a classical tropical plant.
RNA sequencing (RNA-Seq) is generally used to analyze the gene expression of particular biological subjects under specific conditions [21]. RNA-Seq can be applied to gene expression analysis, differentially expressed gene (DEG) screening, expression pattern analysis of DEGs, and gene ontology (GO) classification. The Banana Genome Hub is a next-generation information system for Musa genomics (http://banana-genome-hub.southgreen.fr). It is an excellent tool for the study of banana biological processes, given that the sequencing of the banana (Musa acuminate L.) genome was completed in 2012 and characterized further in 2016 [22,23].
In the present study, we used RNA-Seq technology to monitor the transcriptomic profiles of banana leaves and roots in response to a low −K+ treatment. We analyzed the functional categorization of DEGs and compared the low −K+ gene expression profiles between leaves and roots.

2. Materials and Methods

2.1. Plant Materials and Low −K+ Stress Treatment

Musa AAA Cavendish (Brazilian banana) tissue-cultured seedlings with four leaves and 10 cm in height were purchased from the DanZhou plantation base company of Hainan Province, China and chosen as the study materials. The seedlings were divided into normal and low −K+ groups with 20 plants in each group. The normal group and treated group were placed in a greenhouse in Hainan Province, China with a temperature of 28–35 °C in summer. The plants were watered by Hoagland’s complete nutrient solution and low-potassium (K+) culture solution every two days, respectively (Supplemental Material 1) for 60 days until symptoms appeared in treated groups. Each group of plants was divided into an aboveground part (leaves and pseudostems) and an underground part (roots), resulting in four different types of sample: normal −K+ leaves (NKL), normal −K+ roots (NKR), low −K+ leaves (LKL), and low −K+ roots (LKR). After collecting, the samples were immediately frozen in liquid nitrogen and stored at −80 °C prior to RNA extraction. The protocols for the use of Hoagland complete culture solution and the low −K+ culture solution are provided in Supplemental Material 1.

2.2. Determination of Phenotypic Traits and Measurement of K+ Content

The experimental banana seedlings were kept under observation and sampled when they displayed clearly evident symptoms. The total number of leaves, the number of symptomatic leaves, the plant height, the aboveground fresh weight, and the underground fresh weight were recorded and measured. The aboveground and underground tissues were then dried at 80 °C for 48 h, and the dry weight was measured. The dried powder was passed through a 0.25-mm aperture sieve. To analyze the K+ content, dry samples were placed into chemical decomposition tubes with a small amount of water, and 8 mL of concentrated sulfuric acid was then added for overnight. The following day, the samples were incinerated in a chemical decomposition furnace at 250 °C for 30 min; then, the temperature was raised to 400 °C until a brownish-black color appeared in the solution, after about 3 h. The solution was cooled, and 10 drops of 30% H2O2 were added and mixed gently before boiling for 5 min. This step was repeated three to five times with the H2O2 gradually being removed until the solution became colorless. The solution was then poured into a 100-mL volumetric flask and diluted to 100 mL with double-distilled water. The K+ concentration was measured with a flame photometer, with three biological and technological replicates used for K+ measurement, and SPSS software (R24.0, IBM, Chicago, IL, USA) and a significant t-test (* p < 0.05, ** p < 0.01) were used to determine the statistical significance.

2.3. RNA-Seq and Bioinformatics Analysis

The RNA-Seq and bioinformatics analysis were entrusted to Shenzhen BGI Tech Company (Shenzhen, China). Six plants of each group were used for RNA extraction with an improved cetyltrimethylammonium bromide (CTAB) method [24]. The quantity and quality of the RNA were done with a spectrophotometer Ultrospec 2100 pro (Amersham Biosciences, Cambridge, UK) and 1% agarose gel electrophoresis. The extracted RNA was first treated with DNase I to degrade any possible DNA contamination. The messenger ribonucleic acid (mRNA) was enriched using oligo (dT) magnetic beads (Invitrogen) according to the manufacturer’s protocol. After mixing with fragmentation buffer, the mRNA was fragmented into short fragments. The first-strand complementary DNA (cDNA) was synthesized using a random hexamer primer and the second-strand cDNA was synthesized by adding buffer, dNTPs, RNase H, and DNA polymerase I. The double-stranded cDNA was purified using magnetic beads. Then, the sequencing adaptors were ligated to the fragments. Finally, the fragments were enriched by polymerase chain reaction (PCR) amplification. The PCR products were measured by quality control (QC) step, and a 2100 Bioanalyzer (Agilent, Santa Clara, CA, USA) and a StepOnePlus Real-Time PCR System (Applied Biosystems Inc., Foster City, CA, USA) were used to qualify and quantify sequences for the sample library. The library products were prepared for sequencing using a HiSeq 2000 system (Illumina, San Diego, CA, USA).
The original image data was transferred into sequence data via base calling, which is defined as raw data or raw reads and saved as a fastq file [25]. Those FASTQ files include the detailed read sequences and the read quality information. In addition, the filtering of raw data is needed to decrease the data noise. After filtering, the remaining reads are called “clean reads” and used for downstream bioinformatics analysis. Clean data were obtained and stored as FASTQ format after filtering by detecting the content of each base to measure the stability of the library and sequencing eligibility. Under the normal circumstances, the nucleotide distribution at each position identifies the content of stable, non-AT or GC separation. Base quality reflects the accuracy, while the sequencing, reagents, sample quality, etc., affect the quality of the base. If the percentage of the bases with low quality (<20) is low, then the sequencing quality of this lane is good. After data quality statistics, clean reads were mapped to reference sequences using Burrows-Wheeler Alignment (BWA) tool [26] and to gene reference using Bowtie [27]. In general, a higher ratio of alignment indicated a closer genetic relationship between the samples and the reference species. The genotype of the reference genome was Musa acuminata (DH-Pahang), and the latest version was improved by a combination of methods and datasets, leading to the release of version 2 of the assembly and gene annotation (https://banana-genome-hub.southgreen.fr) [23]. The process of RNA-Seq and bioinformatics analysis are presented in Figure 1. The raw data of the high-throughput sequence (RNA-Seq) results and processed files have been submitted to the Gene Expression Omnibus (GEO) database of the national center for biotechnology information (NCBI) web site; its accession number is GSE102968.

2.4. Differentially Expressed Genes (DEGs) Screening

In this article, we used RNA-Seq by the FPKM (Fragments Per Kilobase of transcript per Million mapped reads) method to calculate the expression level of the detected genes with the RNASeq by Expectation Maximization (RSEM) software package [28]. The FPKM method is able to eliminate the influence of different gene lengths and sequencing discrepancy on the calculation of gene expression. The formula of the FPKM method is shown as follows: FPKM = (106 C)/(NL/103), which is given to be the expression of gene A; here, C is the number of fragments that are uniquely aligned to gene A, N is the total number of fragments that are uniquely aligned to all genes, and L is the number of bases on gene A. In order to identify the low potassium-responsive genes, the DEGs were analyzed between the normal and treatment groups using p-value < 0.05 and |log2 Ratio| ≥ 1 as thresholds. The significance of the DEGs was determined by using the false discovery rate (FDR) control method to justify the p-value [29].

2.5. Quantitative Real-Time PCR (qRT-PCR) Analysis

To validate the reliability and repeatability of the RNA-Seq results, 15 genes were selected for identification by qRT-PCR assays (three technological replicates of each gene). Detailed information about these genes is provided in Supplemental Material 2. Tissues of six banana seedlings of each group were mixed and used for RNA extraction with the improved cetyltrimethylammonium bromide (CTAB) method [24]. Total RNA was treated with DNase I and RNase-free (Thermo Fisher Scientific, Waltham, MA, USA) to eliminate genomic DNA contamination. For first-strand cDNA synthesis, 1.0 µg of total RNA was used with random and oligo(dT)18 primers (Revert Aid First Strand cDNA Synthesis Kit, #K1621, Thermo Fisher Scientific, Waltham, MA, USA). SYBR® Premix Ex Taq II (Takara, Dalian, China) was used in the PCR reaction system on a 7500 RT-PCR System (Applied Biosystems, Waltham, MA, USA) according to the manufacturer’s protocols. The qRT-PCR was performed using a 20-µL reaction system containing 10 μL of SYBR® Premix Ex Taq II (Takara, Tli RNase Plus, Dalian, China) (2×), 2 μL of cDNA template, 0.8 μL of PCR forward primer (10 μM), 0.8 μL of PCR reverse primer (10 μM), 0.4 μL of ROX reference DyeII (50×), and 6 μL of nuclease-free water. The PCR amplification program was as follows: 50 °C for 2 min, 95 °C for 10 min, followed by 40 cycles of 95 °C for 15 s, and 60 °C for 1 min. The 2−ΔΔCT method was used for qPCR data analysis, in which ΔCT(test) = CT(target, test) − CT(ref, test), ΔCT(calibrator) = CT(target, calibrator) − CT(ref, calibrator), and ΔΔCT = ΔCT(test) − ΔCT(calibrator), and the expression ratio of the experimental and control groups was 2−ΔΔCT. The, primers of the selected genes were designed using Primer Premier 6 (www.premierbiosoft.com). The amplification of Actin1 (GenBank Accession No. AF246288, submitted by National Taiwan University, Taipei, China) was used as an internal reference gene control for data normalization [30].

3. Results

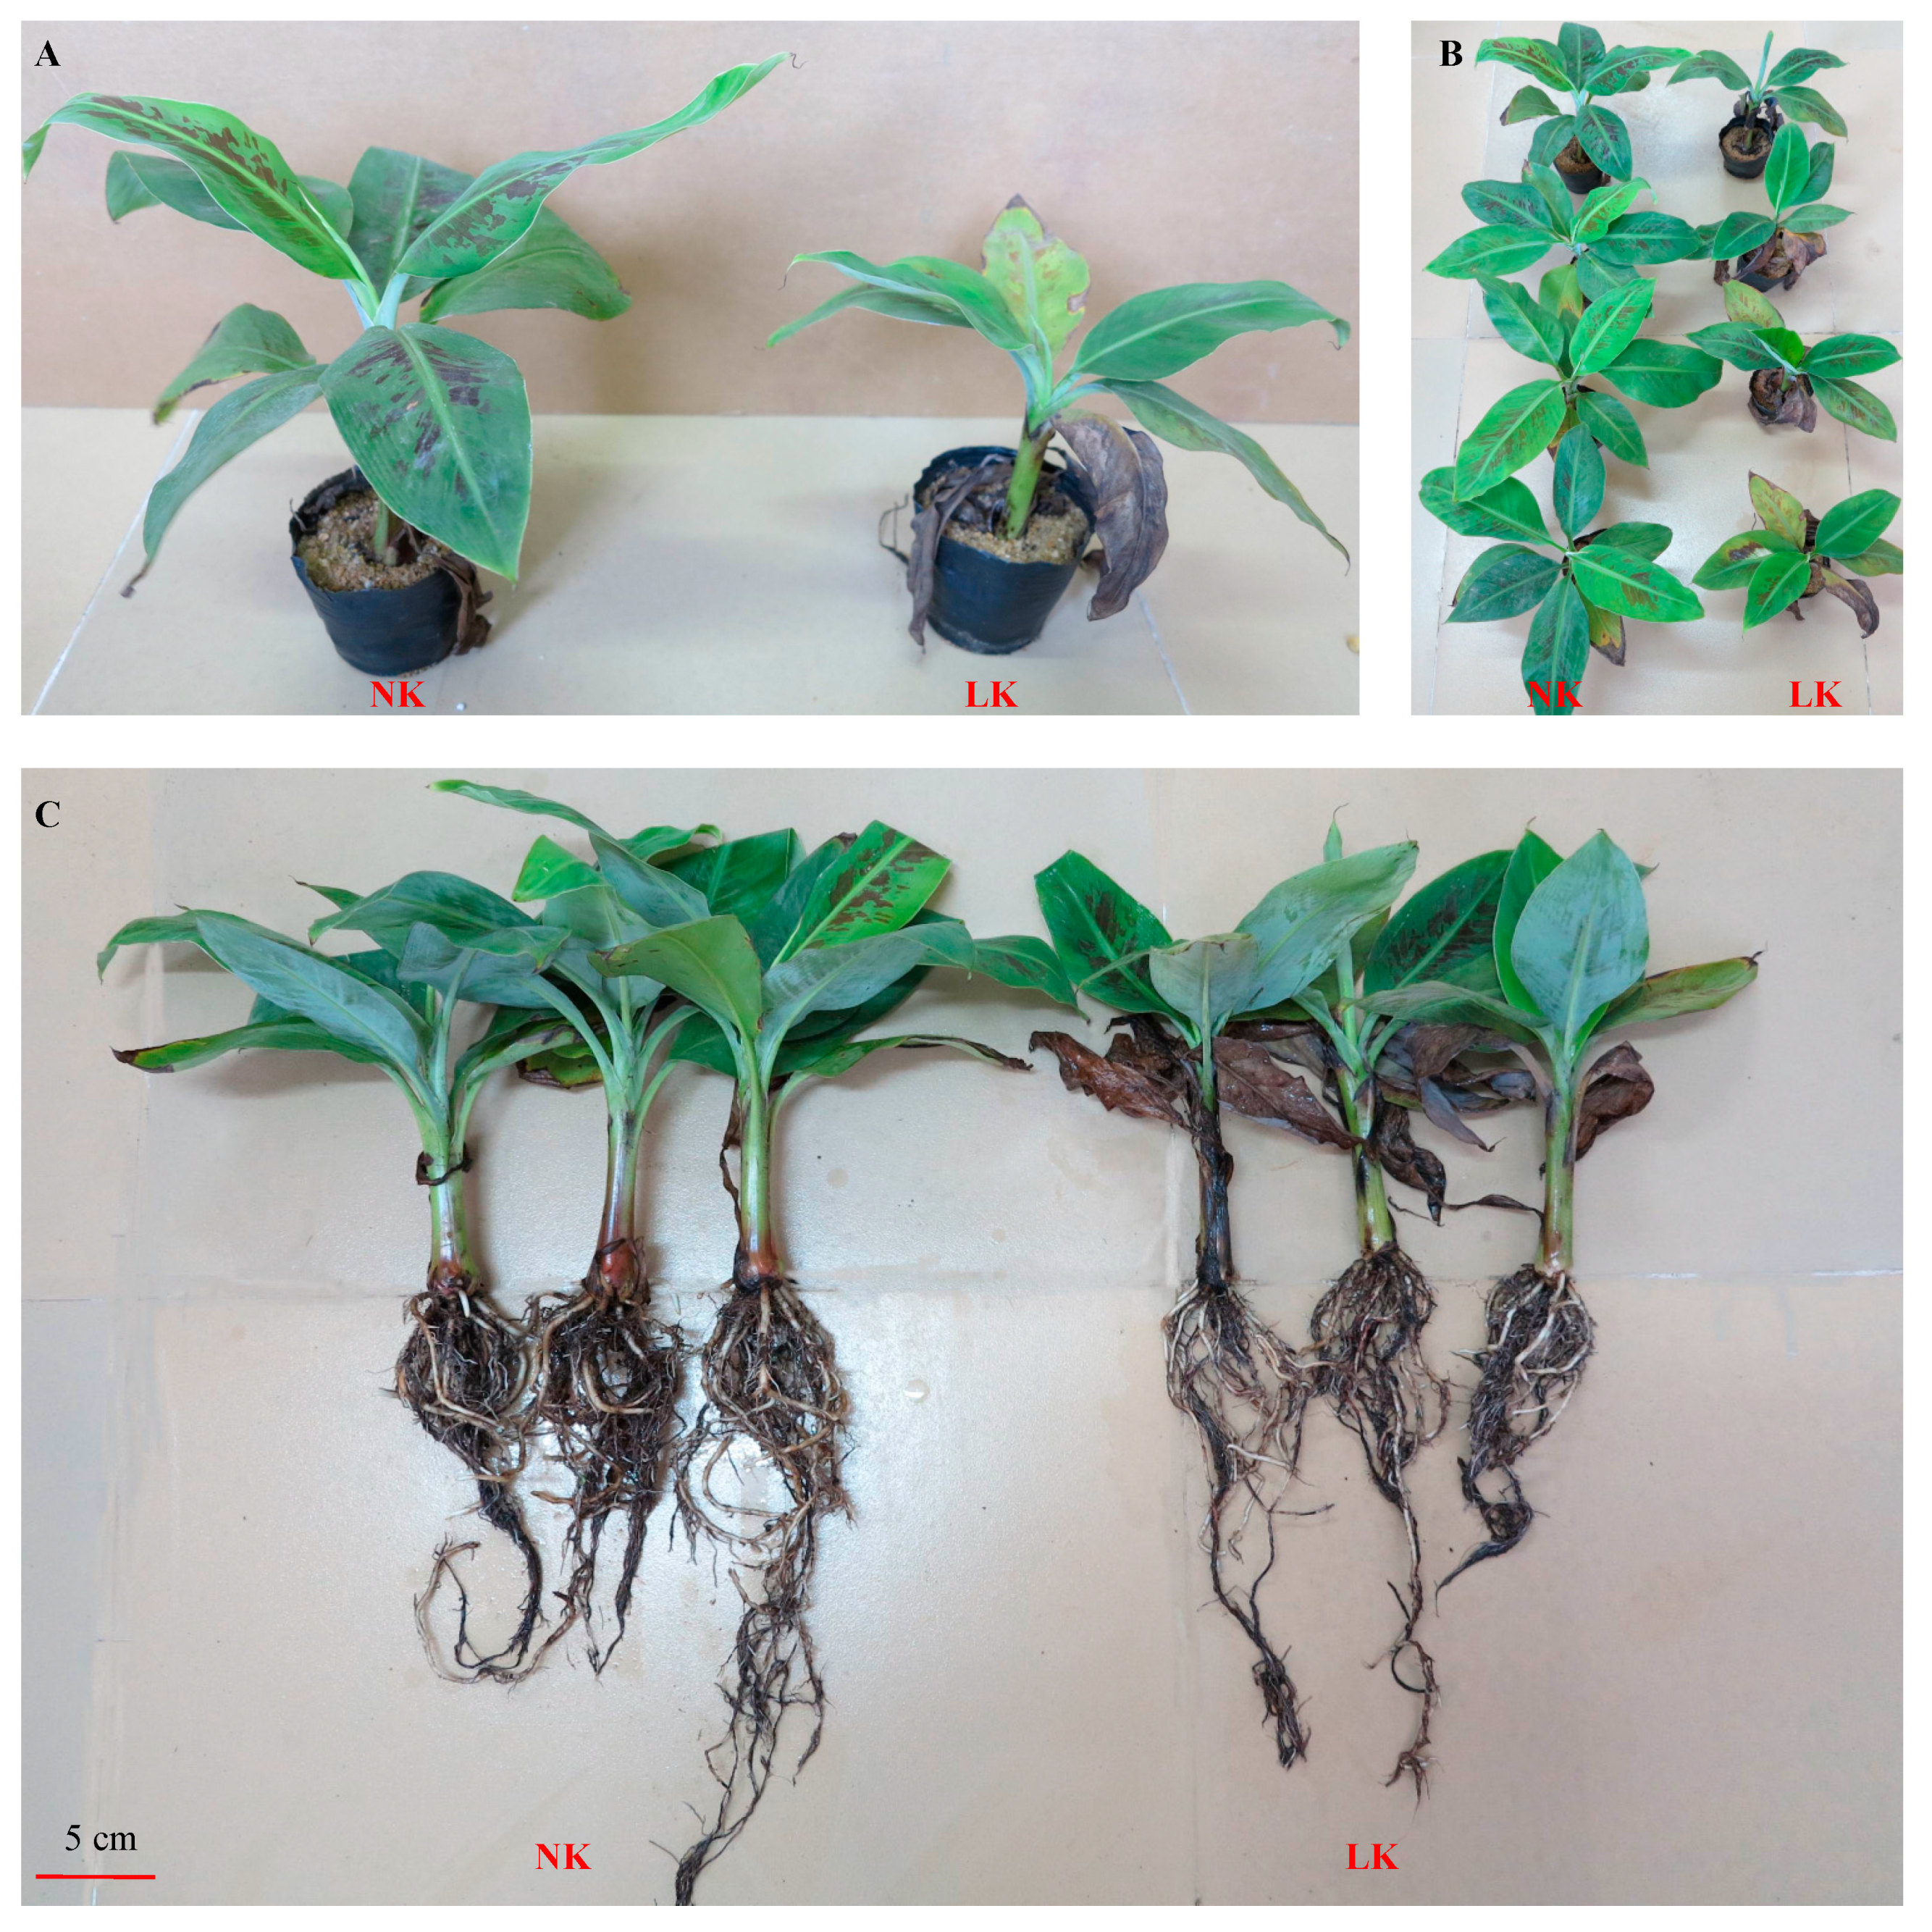
3.1. K+ Deficiency Inhibits the Growth of Banana Seedlings

In the nutriculture experiments with low −K+ stress, at the early stage (20 days), the edges of the leaves of the banana plants in the low −K+ group (LK) were slightly yellow, as though they had been burned, compared with those of the normal −K+ group (NK). However, there were no obvious differences in the phenotypic characteristics of plant height or number of leaves (Table1). After 60 days, the lower leaves of the seedlings in the LK group became yellow, with brown stains, as though boiling water had been poured over them (the red arrow in Figure 2A). Then, the lower leaves became wilted, and the total number of leaves was less than that in the NK group (Figure 2B). The LK plants were thin and short, with a small leaf area and fewer roots (Figure 2C). These symptoms indicated that stress due to K+ deficiency dramatically inhibited the growth and development of banana seedlings.
To investigate the changes between the NK and LK treatments, each plant was divided into an aerial part (leaves and pseudostems) and an underground part (roots). The phenotypic traits of each group were measured, which contained 20 banana seedlings. The phenotypic traits including leaf numbers, plant height, and fresh and dry weights. Spearman analysis was used for correlation analysis of the statistical variables with SPSS software. The results are shown in Table 1.
There were significant differences between the NK and LK treatments in terms of total leaf number and the number of leaves showing symptoms. The fresh and dry weights of the aerial and underground parts in the LK group were significantly less than those in the NK group. This indicated that low −K+ stress significantly inhibited the growth and development of the banana leaf, pseudostem, and root, and led to a decrease in the biomass of banana plants. We also measured the K+ content of the aerial and underground parts of the plants in the NK (NKL and NKR) and LK (LKL and LKR) treatments, respectively. SPSS software was applied to the results (Figure 3), which confirmed that the K+ content in the LK group was significantly lower than that in the NK group, indicating that a restricted K+ supply affected K+ uptake and K+ content in banana tissue. In conclusion, the K+ content and biomass index of banana seedlings decreased under the stress of low −K+ conditions.

3.2. RNA Sequencing, Alignment, and Bioinformatics Analysis in Banana Leaves and Roots

To investigate the differences in gene expression between the normal −K+ (NK) and low −K+ (LK) treatments in the leaves and roots of banana plants, NKL, LKL, NKR, and LKR samples were selected for RNA-Seq. From the four cDNA libraries, a total of 48,767,309 raw reads were generated (Table 2). After the removal of low quality sequences and short reads, 24,209,199 (49.6% of raw data) clean reads were selected for aligned to the banana reference genome. There were 26,796 expressed genes and 33,388 expressed transcripts in NKL, 27,014 expressed genes and expressed transcripts 33,469 in LKL, 29,158 expressed genes and 35,896 expressed transcripts in NKR, and 28,748 expressed genes and 35,380 expressed transcripts in LKR (Table 2).
We analyzed each NK–LK pair with the R package and constructed scatter plots of all the expressed genes, in which different colors were used to represent up-regulated, down-regulated, or non-regulated genes. The DEGs were analyzed between the normal and treatment groups using p-value < 0.05 and |log2 Ratio| ≥ 1 as thresholds. The significance of the DEGs was determined by using the false discovery rate (FDR) ≤ 0.001 to justify the p-value [29]. Figure 4 shows the results, with the x-axis and y-axis representing the log2 value of gene expression. The screening conditions are given in the figure legend (Figure 4).
The genes that were only expressed in NKL, LKL, NKR, or LKR were defined as specifically expressed genes (SEGs). The number of specifically expressed genes in the LK samples was greater than that in the NK samples (Figure 5A); the low −K+ treatment resulted in an increase in the number of specifically expressed genes. There were 797 up-regulated DEGs and 386 down-regulated DEGs in NKL versus LKL, whereas there were 1917 up-regulated DEGs and 2830 down-regulated DEGs in NKR versus LKR (Figure 5B). There were 266 differentially up-reglated genes and 33 differentially down-regulated genes that were common to both leaves and roots (Figure 6). The statistical analysis suggested that these genes may be expressed conservatively in banana and play important roles under low −K+ conditions.
All of the DEGs were mapped to the terms of the gene ontology (GO) database (http://www.geneontology.org), which calculated the gene numbers of each term. Then, the hypergeometric test was used to find the enriched GO terms of DEGs compared to the whole genome. p-Value was calculated by Gene Ontology TermFinder, and corrected by Bonferroni. GO terms whose corrected p-value ≤ 0.05 were defined as prominent enriched GO terms. In leaves, the GO analysis identified 34, 122, and 197 terms, which contained 1472, 1760, and 2495 genes relevant to cellular components, molecular functions, and biological processes, respectively. In roots, there were 100, 224, and 404 terms, which contained 8483, 9038, and 12,541 genes relevant to cellular components, molecular functions, and biological processes, respectively. Genes that had a cluster frequency ≥20% were selected and compared among all of the GO categories in leaves and roots (Figure 7).
In all of the samples of leaves and roots, the GO terms for cells and cell parts were highly represented in the cellular components, catalytic activity was highly represented in the molecular functions, and metabolic processes were highly represented in the biological processes. Interestingly, some GO terms were represented in roots, but not in leaves. These data indicated that the DEGs for cells, catalytic activity, and metabolic processes were most relevant to low −K+ stress.

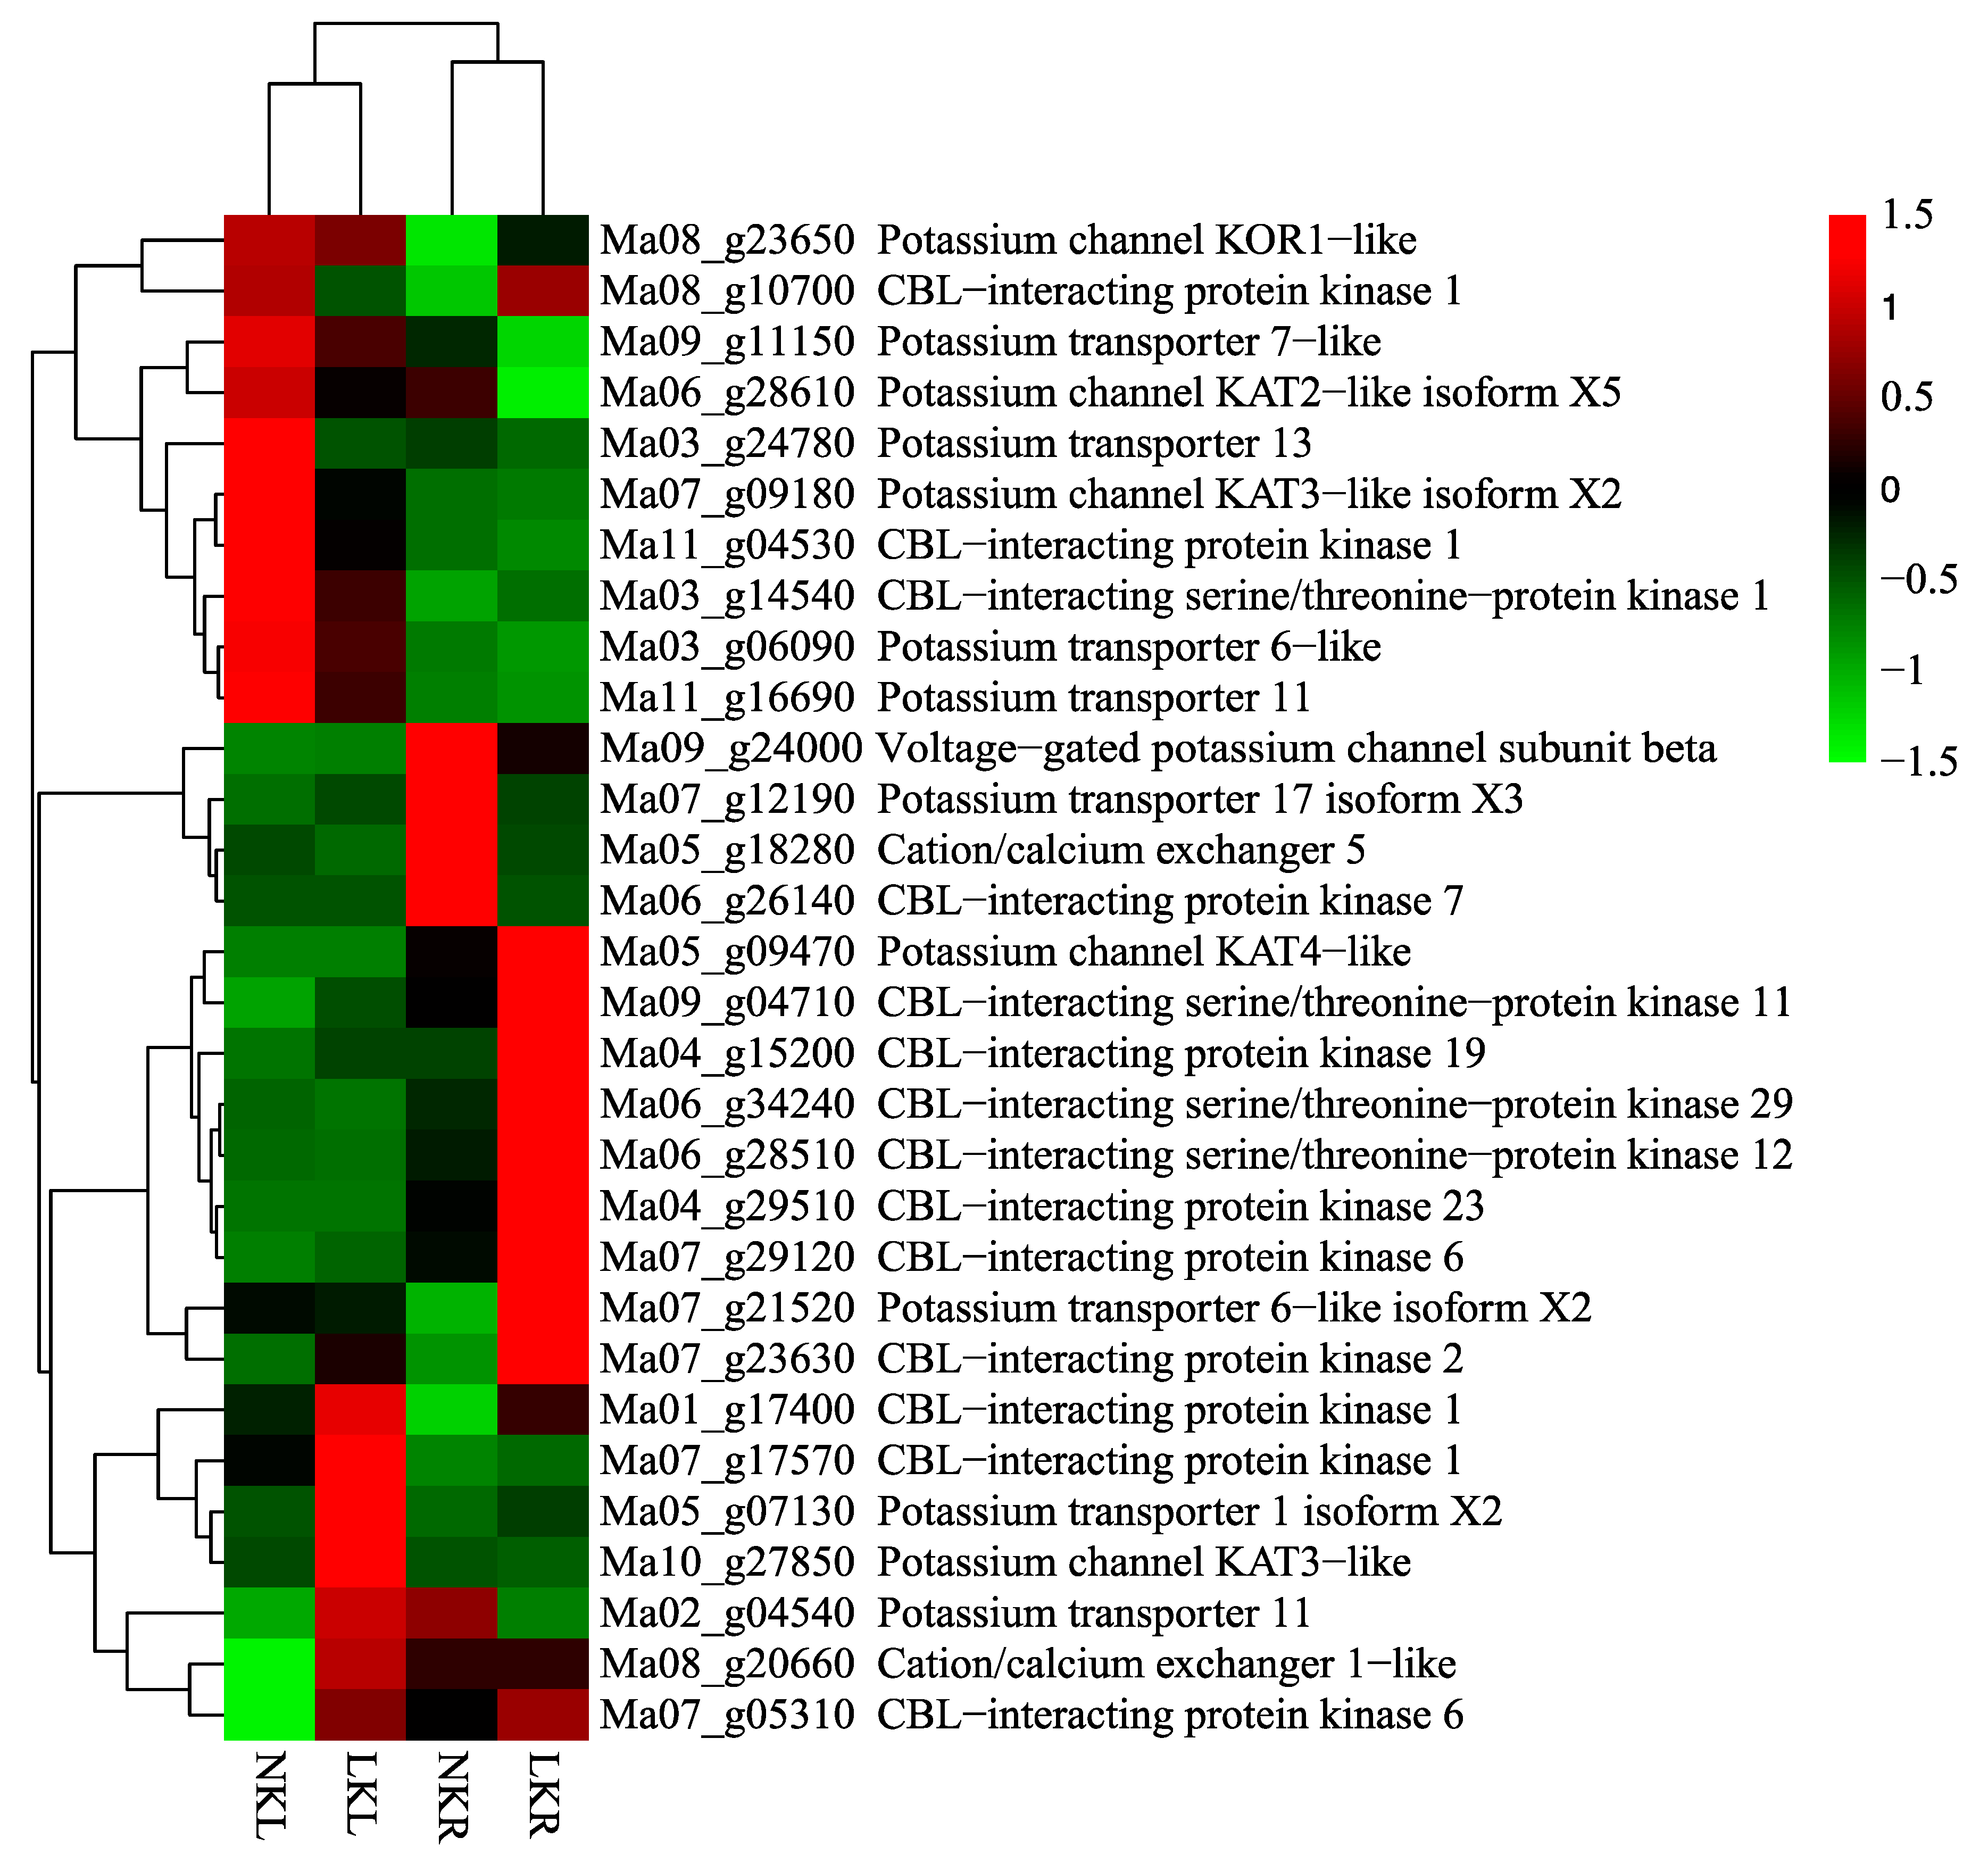
3.3. DEGs Related to K+ Transport and Uptake in Roots and Leaves

In plants, the HAK/KUP/KT system, the active K+ transporter (AKT) family, hyperpolarization-activated cyclic nucleotide-gated K+ channel (HCN channels), cation/Ca2+ exchangers (CCX; also called NCLX), and calcineurin B-like protein (CBL)-interacting protein kinase (CIPK) genes are all associated with K+ transport, uptake, and cellular ionic homeostasis [13,31,32,33,34]. From a combined Kyoto Encyclopedia of Genes and Genome (KEGG), GO, and Blast NR databases analysis, 10 genes (three down-regulated, seven up-regulated) related to K+ in leaves and 21 genes (eight down-regulated, 13 up-regulated) related to K+ in roots were detected (Table 3 and Figure 8). The heatmap was generated by a tool in http://www.omicshare.com/tools/.
Among the DEGs, Ma05_g07130 (K+ transporter 1, isoform X2), which is involved in the K+ uptake protein (KUP) system, was up-regulated by 3.6-fold of the log2 ratio (LKL/NKL) in leaves and by 2.9-fold of the log2 ratio (LKR/NKR) in roots. This indicates that Ma05_g07130 was up-regulated by low −K+ stress in both leaves and roots. It has been reported that AtKUP1 is an Arabidopsis gene encoding a high-affinity K+ transporter [13]. Thus, the identified banana gene Ma05_g07130 may be playing important roles in K+ transport and uptake as an ion transporter.
Previous studies have proven that AtAKT1 plays critical roles in the inward-rectifying channel and K+ uptake, and OsAKT1 represents the dominant salt-sensitive K+ uptake channel in rice roots [17,18,35]. OsAKT5 is necessary for rice to take up K+ and transport it from roots to shoots at low K+-supply levels [36]. PpHAK2 is a possibly K+–H+ symporter or K+/H+ antiporter, and performs the second function of HAK transporters [12]. In our results, we detected three KT-like DEGs (Ma03_g24780, Ma05_g07130, and Ma02_g04540) in leaves, six KT-like DEGs (Ma05_g07130, Ma07_g21520, Ma03_g06090, Ma07_g12190, Ma09_g11150, and Ma11_g16690) in roots, two KAT-like DEGs (Ma07_g09180 and Ma10_g27850) in leaves, and three KAT-like DEGs (Ma08_g23650, Ma05_g09470, and Ma06_g28610) in roots. We also found a probable voltage-gated K+ channel in roots (Ma09_g24000). These DEGs may play important roles in K+ uptake and transport in banana seedlings in response to low −K+ treatment.
As an important cytosolic signaling ion, Ca2+ affects many cellular processes [37]. The cation/Ca2+ exchanger gene superfamily is widely present in microorganisms, animals, and plants [33]. In plants, CCX superfamily genes play important roles in cellular Ca2+ homeostasis, and exchange sodium (Na+) or lithium (Li+) for Ca2+ [34,38]. In this study, two differentially expressed cation/Ca2+ exchanger genes were detected in NKL versus LKL and NKR versus LKR. The first was cation/Ca2+ exchanger 1-like (Ma08_g20660), which was up-regulated 2.4-fold in LKL, and the other was cation/Ca2+ exchanger 5 (Ma05_g18280), which was down-regulated 2.9-fold in LKR. These two genes may play critical roles in maintaining cellular Ca2+ levels and the ionic balance of banana plants during low −K+ conditions.
The Ca2+ ion is a ubiquitous second messenger in plant signal transduction in response to various biotic and abiotic stresses and developmental stimuli [39]. Plants recognize the Ca2+ signal through Ca2+ sensors, such as calmodulins, calmodulin-like proteins (CMLs), CBLs, and Ca2+-dependent protein kinases (CDPKs) [40]. Calcium ion sensors (e.g., CBLs) and their targets (e.g., CIPKs) interact with each other as a CBL–CIPK Ca2+ complex, which activates gene expression downstream of the signal transduction pathway in response to stress conditions [5,41]. It has been reported that the CBL–CIPK complex is related to K+ uptake by the modulation of AKT channels in rice and Arabidopsis thaliana [16,18]. Two CBL/CIPK pairs were identified in grape vine, which could activate the inward K+ channel VvK1.2 [42]. Based on a KEGG pathway analysis and GO function analysis, three up-regulated (Ma07_g17570, Ma07_g05310, and Ma09_g04710) CIPK DEGs and one down-regulated (Ma11_g04530) CIPK DEG were detected in leaves, and nine up-regulated (Ma06_g34240, Ma06_g28510, Ma07_g23630, Ma01_g17400, Ma04_g29510, Ma07_g29120, Ma03_g14540, Ma04_g15200, and Ma08_g10700) CIPK DEGs and one down-regulated (Ma06_g26140) CIPK DEG were detected in roots in this study. We conducted a phylogenetic analysis of these CBL family DEGs in banana leaves and roots by MEGA7.0 (Figure 9). Under low −K+ conditions, these DEGs participate in K+ uptake and transport in banana to a substantial extent.

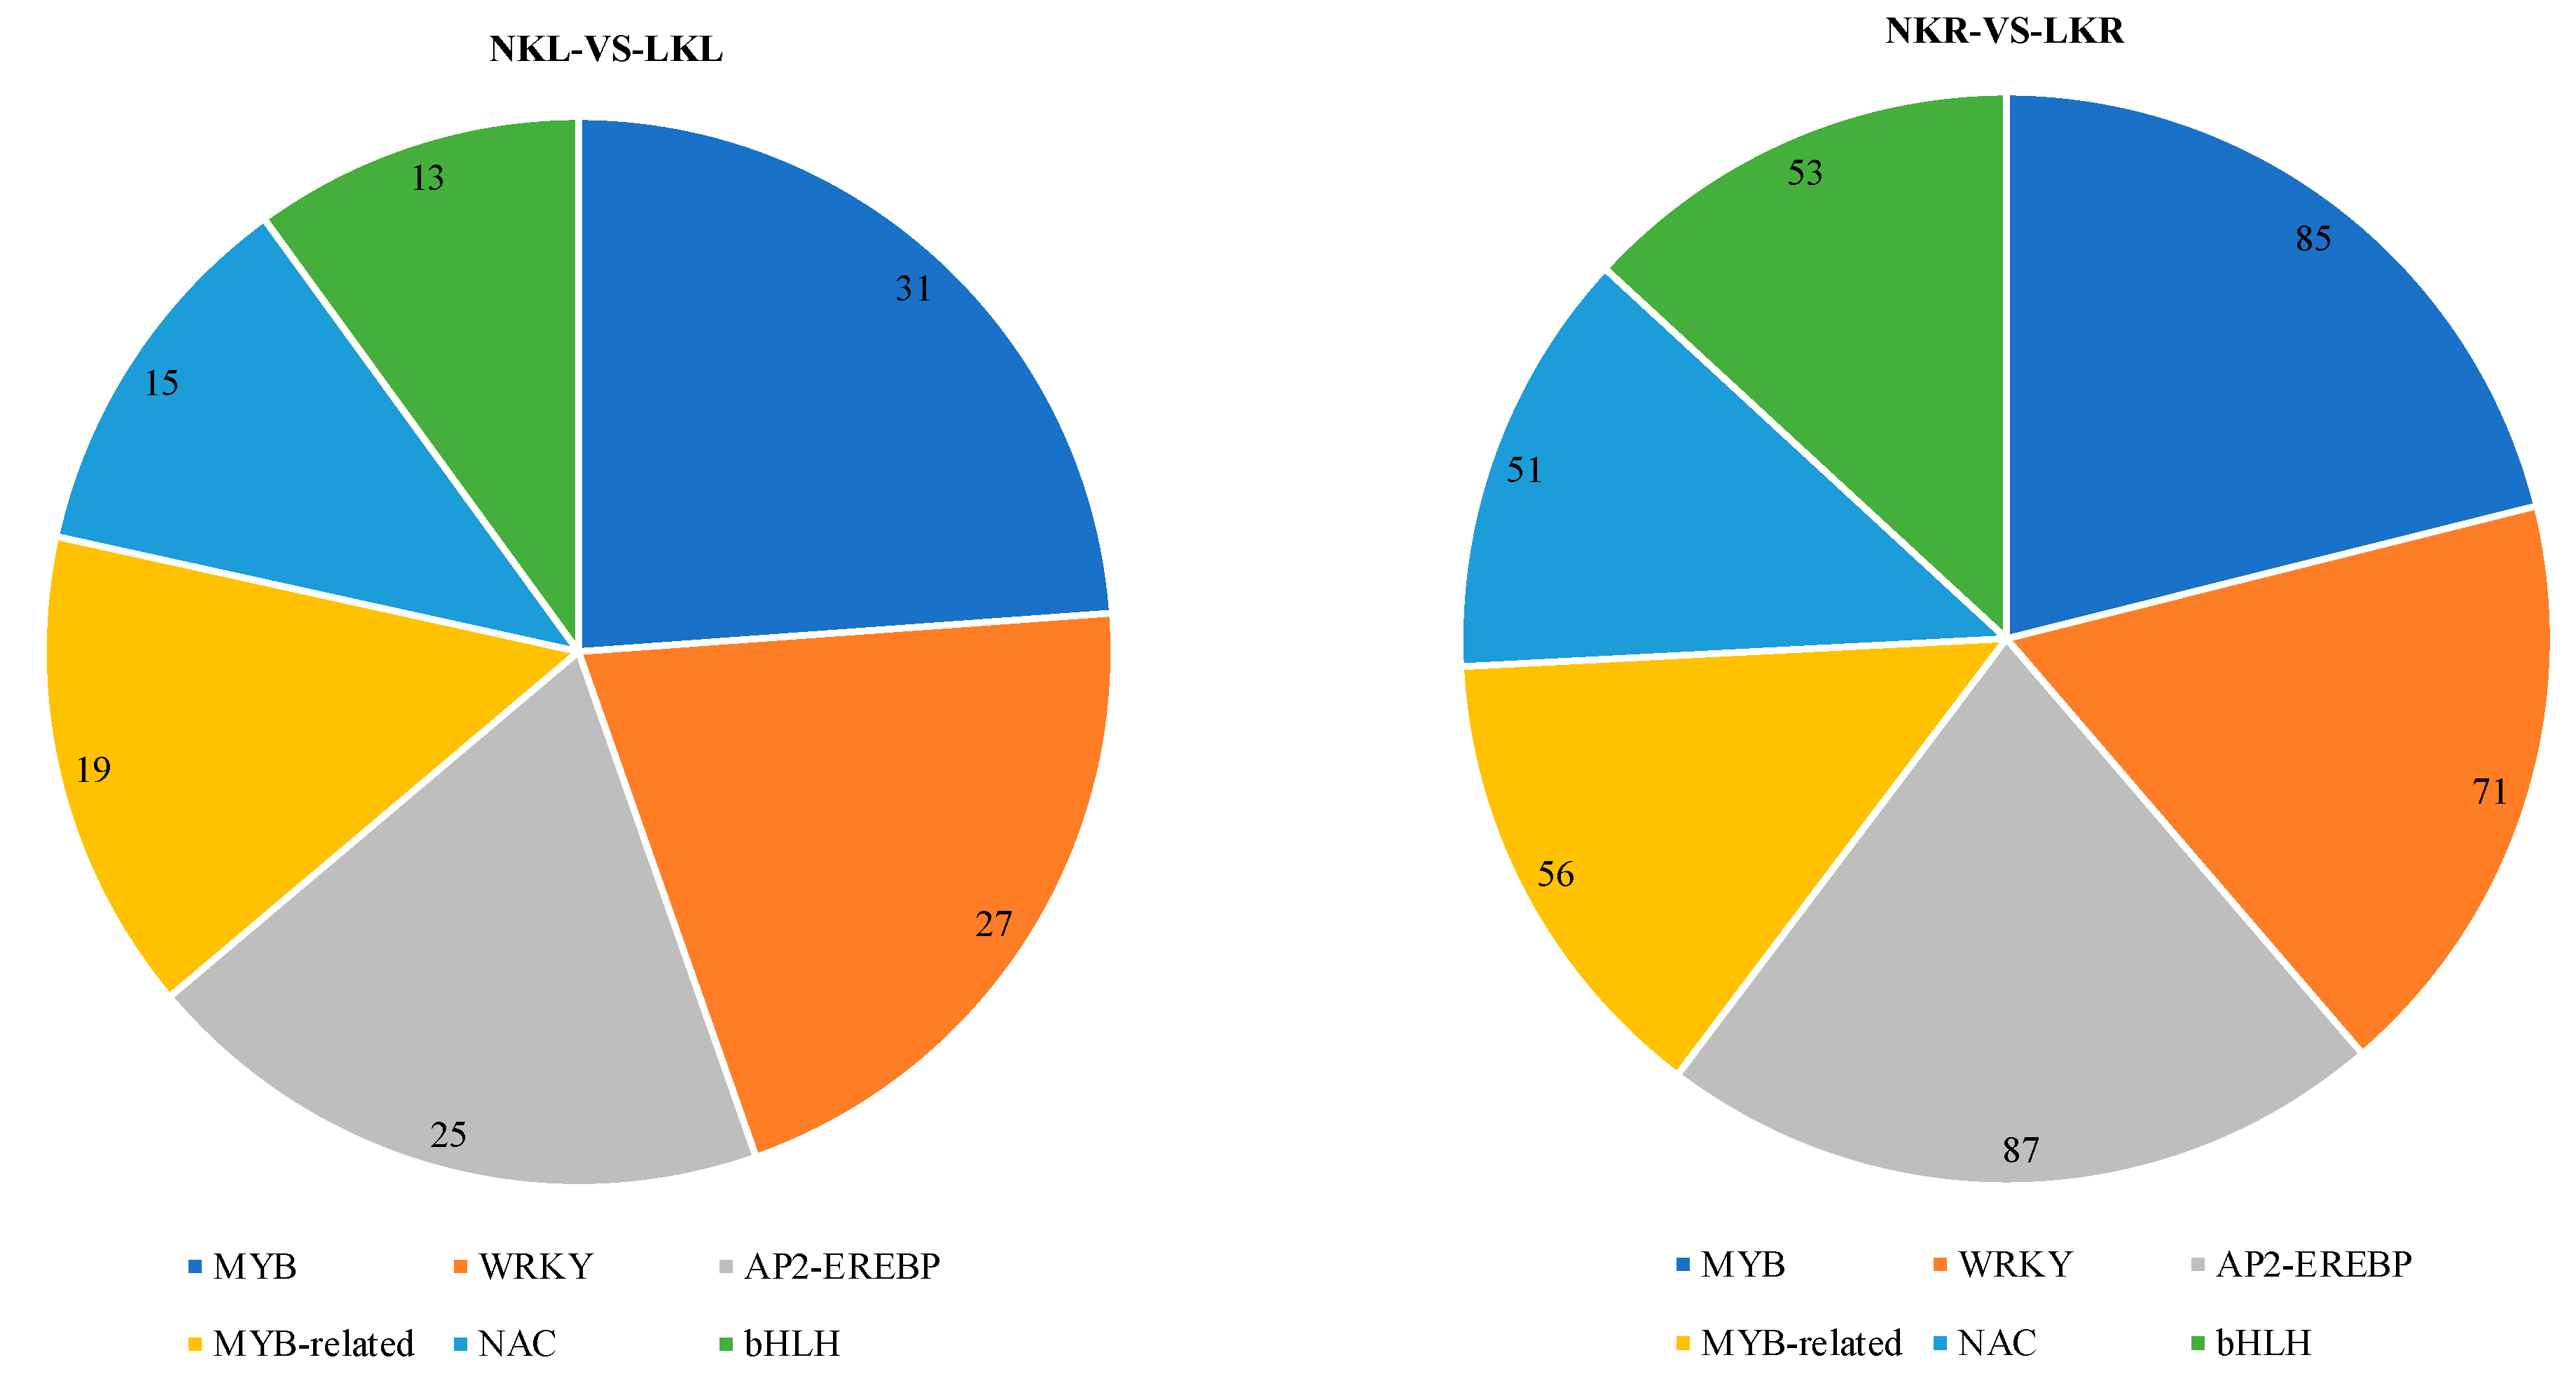
3.4. Transcription Factors (TFs) Analysis in Banana Leaves and Roots

Transporters and channels have important roles in the accumulation of nutrient elements from the soil by plants, and in the maintenance of homeostasis. How the transporters and channels are regulated by upstream transcription factors is of critical importance. Transcription factors are transcriptional regulators in plants and form an integral part of the signaling networks that modulate many plant processes. Transcription factors are proteins that bind to specific DNA sequences or interact with other transcription factor proteins, thereby controlling the transcription rate of genetic information from DNA to mRNA. Previous studies have shown that MYB-type, bHLH, AP2/ERF, NAC, and WRKY transcription factors play important roles in regulating K+, Na+, and phosphate (PO43−) transport and salt tolerance in rice and Arabidopsis thaliana [43,44,45,46,47,48,49]. Our results revealed that genes encoding MYB, MYB-related, bHLH, AP2-EREBP, WRKY, and NAC transcription factors comprised the top six classes of transcription factor genes differentially expressed in banana leaves and roots (Figure 10). These transcription factors may be among the most critical factors affecting the growth and development of banana seedlings under K+-deficient conditions.

3.5. Validation of Gene Expression by qRT-PCR

To validate the reliability and repeatability of gene expression in RNA-Seq, a total of 15 genes were selected randomly for identification by qRT-PCR assays (three technical replicates of each gene). The results of the qRT-PCR analysis for these genes mostly matched the expression patterns found by RNA-Seq analysis (Figure 11), which indicated that the RNA-Seq results were reliable.

4. Discussion

Potassium is the most important and abundant cation in plant cells, playing critical roles in plant physiological function [50]. Reports showed that potassium mainly participates in the electrical neutralization of inorganic and organic anions and macromolecules, pH homeostasis, the control of membrane electrical potential, the regulation of cell osmotic pressure, optimal protein synthesis, and photosynthesis [51]. In addition, as cofactors for many enzymes, K ions participate in many metabolic processes, such as nitrogen (N), sulfur (S), and phosphorus (P) assimilation, pyruvate synthesis, and sugar metabolism [52]. Potassium is taken up by the plant root through the epidermal and cortical cells, and then transported to the shoot and distributed to the leaves [53].
In general, there are two primary signaling pathways that play important roles in regulating K uptake, which include the CBL–CIPK network and ethylene-mediated pathways [54,55]. In the CBL–CIPK pathway, the Ca2+ sensor proteins (CBLs) interact with their target kinases (CIPKs). The balance of the cations was regulated by a number of transporting proteins that are involved in the K+ and Na+ uptake and translocation [31]. The report showed that both ethylene production and the transcription of genes of the ethylene biosynthesis increased when met with low potassium stress [56]. Reactive oxygen species (ROS) have been suggested to be upstream regulators of calcium signaling and participate in low potassium-signaling pathways [57,58]. In addition, ethylene acts upstream of the ROS in response to potassium deprivation by increasing the H2O2 concentrations [55]. Therefore, it is necessary to clarify the molecular mechanisms of K ions’ uptake and transport in the CBL–CIPK network and ethylene-mediated pathways, especially in response to low −K+ conditions.
However, the regulation of potassium in plants is a complicated process that is coordinated with Ca, Na, N, and S ions [6,52]. As is well known, K+ absorption and translocation are mainly mediated by plant K+ transporters and channels [59]. At present, there are mainly three families of ion channels (Shaker, TPK/KCO, and TPC) and three families of transporters (HAK, HKT, and CPA) have been identified as contributing to K and Na ions transport across the plasmalemma and internal membranes [58,60]. Potassium transporters may function in both low-affinity and high-affinity transport as members of the KT/KUP/HAK family [31]. It has been reported that the protein kinase CIPK9 interacts with the calcium sensor CBL3 and plays an important role in K+ homeostasis under low-potassium stress in Arabidopsis [59]. In vivo and vitro experiments showed that the CBL1, CBL8, CBL9, and CBL10, together with a CBL-interacting serine/threonine protein kinase23 (CIPK23) activated a low K+ inducible potassium transporter HAK5 to regulate K+ transport in Arabidopsis [61]. In this data, we also identified 14 differentially expressed CBL-interacting protein kinases genes (Figure 8 and Figure 9) in a low-potassium group of banana plants. Among these genes, two genes (Ma06_g28510 and Ma09_g04710) were annotated to CBL-interacting serine/threonine protein kinases, which may play crucial roles in protein phosphorylation during low-potassium starvation.
Transcription factors (TFs) determine the temporal and spatial features of gene expression by binding to specific promoter sequences that comprise cis-regulatory elements [62]. Treated with low-potassium stress, significantly differentially expressed banana TFs about the MYB and MYB-related family genes were the largest subgroup of all the TFs in banana. It was reported that the AP2/ERF transcription factor RAP2.11 was a component in response to low potassium through regulation of the low-potassium signal transduction pathway via the high-affinity K+ uptake transporter AtHAK5, which was bound to a GCC-box of the AtHAK5 promoter [44]. At present, a total number of 112 DEGs about the AP2-EREBP transcription factors were identified, of which 25 of the DEGs were in banana leaves and 87 of the DEGs were in banana roots.
Transcriptome analysis is a common but excellent technological means to find genes that have participated in a variety of biotic or abiotic stresses in plants. Using RNA-Seq, this study provides important transcriptome information for banana (Musa acuminata L. AAA group, cv. Cavendish) in response to K+ starvation. The transcriptional profiles of banana genes have revealed that many genes are differentially regulated in leaves and roots after low potassium stress. Our data showed important genes that were related to K+ transport and uptake, including genes of the HAK/KUP/KT system, AKT family, CBLs, and so on. These genes were differentially expressed between LK and NK treatments, especially in roots.
Here, we compared the mRNA expression levels of different banana tissues in low-potassium conditions. The expression patterns of mRNA among different tissues revealed that many important DEGs might regulate potassium expression at the transcriptional level. At present, transgenic research is the best method to clarify the functions of a gene. The successful acquisition of transgenic Cavendish bananas with resistance to fusarium wilt tropical race 4 (Foc4) brings a bright future for the study of genes response for K+ stress [63]. Many DEGs encoding protein kinases and ion transporters were simultaneously down/up-regulated in our data, suggesting that they may participate in the responses of banana to K+ deficiency. The data obtained in this study may enable a better understanding of the mechanisms controlling banana K+-deficiency tolerance and will be useful in informing studies of K+ deficiency in other plant species. However, further research is required to validate the functions of the DEGs related to K+ stress.

5. Conclusions

The results of this study suggested that lots of DEGs related to K+ homeostasis participated in the mechanisms for low-potassium tolerance in banana. Although the genome of banana has been sequenced and assembled, genetic expression on the transcription level under low-potassium stress has not been reported in banana. This study main focused on analyzing the DEGs via the bioinformatics method and qRT-PCR assay. Our report provided a basic information for genes regarding transcription levels, and could be used to better understand the function of these genes under low-potassium tolerance.

Supplementary Materials

The following are available online at https://www.mdpi.com/2073-4395/9/4/169/s1, Supplemental Material 1: The protocols of Hoagland complete culture solution and low-potassium (K+) culture solution, Supplemental Material 2: Gene information for quantitative real-time polymerase chain reaction (qRT-PCR) validation.

Availability of Supporting Data

All genes ID number and genes sequence information are available in the Banana Genome Hub (http://banana–gonome-hub.southgreen.fr.). All supportive data and materials generated in this article will be made available on request. Differentially expressed genes (DEGs) and genes for qRT-PCR are listed in Supplemental Material 2. The authors state that all data are necessary for confirming the results and conclusions presented in this article. The raw data of high-throughput sequence (RNA-Seq) results and processed files have been submitted to GEO database of NCBI web site which accession number is GSE102968.

Author Contributions

H.T. conceived the study and participated in the design of all experiments. M.X. performed the qRT-PCR analysis, statistical analysis and drafted the manuscript. C.-B.Z., R.H., Z.Y. and Z.Q. prepared and watered the plant materials. R.X., Y.C. and S.-S.W. carried out the statistical analysis and participated in data analysis and discussion about the experiments. All authors read and approved the final manuscript.

Acknowledgments

This work was supported by the Natural Science Foundation of China (31360364), the Key Scientific Research Program of Hainan Province (ZDZX2013023), the Innovation and Research Project of the General Institutes of Higher Education in Hainan Province (Hys2016-38), and the Doctor and Master Postgraduate Student Social Service Project of Hainan University in 2016 (1ZG8308002002).

Conflicts of Interest

The authors declare that they have no conflict of interest.

References

  1. Doran, I.; Sen, B.; Kaya, Z. The effects of compost prepared from waste material of banana plants on the nutrient contents of banana leaves. J. Environ. Biol. 2003, 24, 437–444. [Google Scholar]
  2. And, D.T.C.; Hanson, J.B. The Mineral Nutrition of Higher Plants. Annu. Rev. Plant Physiol. 1980, 31, 239–298. [Google Scholar]
  3. Leigh, R.A. A Hypothesis Relating Critical Potassium Concentrations for Growth to the Distribution and Functions of this Ion in the Plant Cell. New Phytol. 2010, 97, 1–13. [Google Scholar] [CrossRef]
  4. Jin, S.H.; Huang, J.Q.; Li, X.Q.; Zheng, B.S.; Wu, J.S.; Wang, Z.J.; Liu, G.H.; Chen, M. Effects of potassium supply on limitations of photosynthesis by mesophyll diffusion conductance in Carya cathayensis. Tree Physiol. 2011, 31, 1142–1151. [Google Scholar] [CrossRef] [Green Version]
  5. Luan, S. The CBL-CIPK network in plant calcium signaling. Trends Plant Sci. 2009, 14, 37–42. [Google Scholar] [CrossRef]
  6. Hedrich, R.; Kudla, J. Calcium signaling networks channel plant K+ uptake. Cell 2006, 125, 1221–1223. [Google Scholar] [CrossRef]
  7. Ma, T.L.; Wu, W.H.; Wang, Y. Transcriptome analysis of rice root responses to potassium deficiency. BMC Plant Biol. 2012, 12, 161. [Google Scholar] [CrossRef]
  8. Wang, Y.; Wu, W.H. Regulation of potassium transport and signaling in plants. Curr. Opin. Plant Biol. 2017, 39, 123–128. [Google Scholar] [CrossRef]
  9. Zhang, X.; Jiang, H.; Wang, H.; Cui, J.; Wang, J.; Hu, J.; Guo, L.; Qian, Q.; Xue, D. Transcriptome Analysis of Rice Seedling Roots in Response to Potassium Deficiency. Sci. Rep. 2017, 7, 5523. [Google Scholar] [CrossRef]
  10. Ruan, L.; Zhang, J.; Xin, X.; Zhang, C.; Ma, D.; Chen, L.; Zhao, B. Comparative analysis of potassium deficiency-responsive transcriptomes in low potassium susceptible and tolerant wheat (Triticum aestivum L.). Sci. Rep. 2015, 5, 10090. [Google Scholar] [CrossRef]
  11. Wang, Q.; Guan, C.; Wang, P.; Lv, M.L.; Ma, Q.; Wu, G.Q.; Bao, A.K.; Zhang, J.L.; Wang, S.M. AtHKT1;1 and AtHAK5 mediate low-affinity Na+ uptake in Arabidopsis thaliana under mild salt stress. Plant Growth Regul. 2015, 75, 615–623. [Google Scholar] [CrossRef]
  12. Haro, R.; Fraile-Escanciano, A.; Gonzalez-Melendi, P.; Rodriguez-Navarro, A. The potassium transporters HAK2 and HAK3 localize to endomembranes in Physcomitrella patens. HAK2 is required in some stress conditions. Plant Cell Physiol. 2013, 54, 1441–1454. [Google Scholar] [CrossRef]
  13. Kim, E.J.; Kwak, J.M.; Uozumi, N.; Schroeder, J.I. AtKUP1: An Arabidopsis gene encoding high-affinity potassium transport activity. Plant Cell 1998, 10, 51–62. [Google Scholar] [CrossRef]
  14. Horie, T.; Costa, A.; Kim, T.H.; Han, M.J.; Horie, R.; Leung, H.Y.; Miyao, A.; Hirochika, H.; An, G.; Schroeder, J.I. Rice OsHKT2;1 transporter mediates large Na+ influx component into K+-starved roots for growth. EMBO J. 2007, 26, 3003–3014. [Google Scholar] [CrossRef]
  15. Horie, T.; Brodsky, D.E.; Costa, A.; Kaneko, T.; Lo Schiavo, F.; Katsuhara, M.; Schroeder, J.I. K+ transport by the OsHKT2;4 transporter from rice with atypical Na+ transport properties and competition in permeation of K+ over Mg2+ and Ca2+ ions. Plant Physiol. 2011, 156, 1493–1507. [Google Scholar] [CrossRef]
  16. Caballero, F.; Botella, M.A.; Rubio, L.; Fernandez, J.A.; Martinez, V.; Rubio, F. A Ca(2+)-sensitive system mediates low-affinity K(+) uptake in the absence of AKT1 in Arabidopsis plants. Plant Cell Physiol. 2012, 53, 2047–2059. [Google Scholar] [CrossRef]
  17. Fuchs, I.; Stolzle, S.; Ivashikina, N.; Hedrich, R. Rice K+ uptake channel OsAKT1 is sensitive to salt stress. Planta 2005, 221, 212–221. [Google Scholar] [CrossRef]
  18. Li, J.; Long, Y.; Qi, G.N.; Li, J.; Xu, Z.J.; Wu, W.H.; Wang, Y. The Os-AKT1 channel is critical for K+ uptake in rice roots and is modulated by the rice CBL1-CIPK23 complex. Plant Cell 2014, 26, 3387–3402. [Google Scholar] [CrossRef]
  19. Ashley, M.K.; Grant, M.; Grabov, A. Plant responses to potassium deficiencies: A role for potassium transport proteins. J. Exp. Bot. 2006, 57, 425–436. [Google Scholar] [CrossRef]
  20. Amtmann, A.; Troufflard, S.; Armengaud, P. The effect of potassium nutrition on pest and disease resistance in plants. Physiol. Plant. 2008, 133, 682–691. [Google Scholar] [CrossRef]
  21. Wang, Z.; Gerstein, M.; Snyder, M. RNA-Seq: A revolutionary tool for transcriptomics. Nat. Rev. Genet. 2009, 10, 57–63. [Google Scholar] [CrossRef]
  22. D’Hont, A.; Denoeud, F.; Aury, J.M.; Baurens, F.C.; Carreel, F.; Garsmeur, O.; Noel, B.; Bocs, S.; Droc, G.; Rouard, M.; et al. The banana (Musa acuminata) genome and the evolution of monocotyledonous plants. Nature 2012, 488, 213–217. [Google Scholar] [CrossRef]
  23. Martin, G.; Baurens, F.C.; Droc, G.; Rouard, M.; Cenci, A.; Kilian, A.; Hastie, A.; Dolezel, J.; Aury, J.M.; Alberti, A.; et al. Improvement of the banana “Musa acuminata” reference sequence using NGS data and semi-automated bioinformatics methods. BMC Genom. 2016, 17, 243. [Google Scholar] [CrossRef]
  24. White, E.J.; Venter, M.; Hiten, N.F.; Burger, J.T. Modified cetyltrimethylammonium bromide method improves robustness and versatility: The benchmark for plant RNA extraction. Biotechnol. J. 2008, 3, 1424–1428. [Google Scholar] [CrossRef]
  25. Cock, P.J.; Fields, C.J.; Goto, N.; Heuer, M.L.; Rice, P.M. The Sanger FASTQ file format for sequences with quality scores, and the Solexa/Illumina FASTQ variants. Nucleic Acids Res. 2010, 38, 1767–1771. [Google Scholar] [CrossRef]
  26. Li, H.; Durbin, R. Fast and accurate short read alignment with Burrows-Wheeler transform. Bioinformatics 2009, 25, 1754–1760. [Google Scholar] [CrossRef]
  27. Langmead, B.; Trapnell, C.; Pop, M.; Salzberg, S.L. Ultrafast and memory-efficient alignment of short DNA sequences to the human genome. Genome Biol. 2009, 10, R25. [Google Scholar] [CrossRef]
  28. Li, B.; Dewey, C.N. RSEM: Accurate transcript quantification from RNA-Seq data with or without a reference genome. BMC Bioinform. 2011, 12, 323. [Google Scholar] [CrossRef]
  29. Gul, H.; Tong, Z.; Han, X.; Nawaz, I.; Wahocho, S.; Khan, S.; Zhang, C.; Tian, Y.; Cong, P.; Zhang, L. Comparative Transcriptome Analysis between Ornamental Apple Species Provides Insights into Mechanism of Double Flowering. Agronomy 2019, 9, 112. [Google Scholar] [CrossRef]
  30. Shivani; Awasthi, P.; Sharma, V.; Kaur, N.; Kaur, N.; Pandey, P.; Tiwari, S. Genome-wide analysis of transcription factors during somatic embryogenesis in banana (Musa spp.) cv. Grand Naine. PLoS ONE 2017, 12, e0182242. [Google Scholar] [CrossRef]
  31. Luan, S.; Lan, W.; Chul Lee, S. Potassium nutrition, sodium toxicity, and calcium signaling: Connections through the CBL-CIPK network. Curr. Opin. Plant Biol. 2009, 12, 339–346. [Google Scholar] [CrossRef] [PubMed]
  32. Barros, F.; Dominguez, P.; de la Pena, P. Cytoplasmic domains and voltage-dependent potassium channel gating. Front. Pharmacol. 2012, 3, 49. [Google Scholar] [CrossRef] [PubMed]
  33. Emery, L.; Whelan, S.; Hirschi, K.D.; Pittman, J.K. Protein Phylogenetic Analysis of Ca(2+)/cation Antiporters and Insights into their Evolution in Plants. Front. Plant Sci. 2012, 3, 1. [Google Scholar] [CrossRef] [PubMed]
  34. He, C.; O’Halloran, D.M. Analysis of the Na+/Ca2+ exchanger gene family within the phylum Nematoda. PLoS ONE 2014, 9, e112841. [Google Scholar] [CrossRef] [PubMed]
  35. Hirsch, R.E.; Lewis, B.D.; Spalding, E.P.; Sussman, M.R. A role for the AKT1 potassium channel in plant nutrition. Sciences 1998, 280, 918–921. [Google Scholar] [CrossRef]
  36. Yang, T.; Zhang, S.; Hu, Y.; Wu, F.; Hu, Q.; Chen, G.; Cai, J.; Wu, T.; Moran, N.; Yu, L.; et al. The role of a potassium transporter OsHAK5 in potassium acquisition and transport from roots to shoots in rice at low potassium supply levels. Plant Physiol. 2014, 166, 945–959. [Google Scholar] [CrossRef] [PubMed]
  37. Verkhratsky, A.; Parpura, V. Calcium signalling and calcium channels: Evolution and general principles. Eur. J. Pharmacol. 2014, 739, 1–3. [Google Scholar] [CrossRef]
  38. Li, Z.; Matsuoka, S.; Hryshko, L.V.; Nicoll, D.A.; Bersohn, M.M.; Burke, E.P.; Lifton, R.P.; Philipson, K.D. Cloning of the NCX2 isoform of the plasma membrane Na(+)-Ca2+ exchanger. J. Biol. Chem. 1994, 269, 17434–17439. [Google Scholar]
  39. Sheen, J. Ca2+-dependent protein kinases and stress signal transduction in plants. Sciences 1996, 274, 1900–1902. [Google Scholar] [CrossRef]
  40. Sun, T.; Wang, Y.; Wang, M.; Li, T.; Zhou, Y.; Wang, X.; Wei, S.; He, G.; Yang, G. Identification and comprehensive analyses of the CBL and CIPK gene families in wheat (Triticum aestivum L.). BMC Plant Biol. 2015, 15, 269. [Google Scholar] [CrossRef] [PubMed]
  41. Thoday−Kennedy, E.L.; Jacobs, A.K.; Roy, S.J. The role of the CBL–CIPK calcium signalling network in regulating ion transport in response to abiotic stress. Plant Growth Regul. 2015, 76, 3–12. [Google Scholar] [CrossRef]
  42. Cuellar, T.; Azeem, F.; Andrianteranagna, M.; Pascaud, F.; Verdeil, J.L.; Sentenac, H.; Zimmermann, S.; Gaillard, I. Potassium transport in developing fleshy fruits: The grapevine inward K(+) channel VvK1.2 is activated by CIPK-CBL complexes and induced in ripening berry flesh cells. Plant J. Cell Mol. Biol. 2013, 73, 1006–1018. [Google Scholar] [CrossRef]
  43. He, Y.; Li, W.; Lv, J.; Jia, Y.; Wang, M.; Xia, G. Ectopic expression of a wheat MYB transcription factor gene, TaMYB73, improves salinity stress tolerance in Arabidopsis thaliana. J. Exp. Bot. 2012, 63, 1511–1522. [Google Scholar] [CrossRef] [PubMed]
  44. Kim, M.J.; Ruzicka, D.; Shin, R.; Schachtman, D.P. The Arabidopsis AP2/ERF transcription factor RAP2.11 modulates plant response to low-potassium conditions. Mol. Plant 2012, 5, 1042–1057. [Google Scholar] [CrossRef] [PubMed]
  45. Anastacio, M.M.; Kanter, E.M.; Makepeace, C.M.; Keith, A.D.; Zhang, H.; Schuessler, R.B.; Nichols, C.G.; Lawton, J.S. Relationship between mitochondrial matrix volume and cellular volume in response to stress and the role of ATP-sensitive potassium channel. Circulation 2013, 128, S130–S135. [Google Scholar] [CrossRef]
  46. Baek, D.; Kim, M.C.; Chun, H.J.; Kang, S.; Park, H.C.; Shin, G.; Park, J.; Shen, M.; Hong, H.; Kim, W.Y.; et al. Regulation of miR399f transcription by AtMYB2 affects phosphate starvation responses in Arabidopsis. Plant Physiol. 2013, 161, 362–373. [Google Scholar] [CrossRef]
  47. Chen, Y.; Li, F.; Ma, Y.; Chong, K.; Xu, Y. Overexpression of OrbHLH001, a putative helix-loop-helix transcription factor, causes increased expression of AKT1 and maintains ionic balance under salt stress in rice. J. Plant Physiol. 2013, 170, 93–100. [Google Scholar] [CrossRef]
  48. Hong, J.P.; Takeshi, Y.; Kondou, Y.; Schachtman, D.P.; Matsui, M.; Shin, R. Identification and characterization of transcription factors regulating Arabidopsis HAK5. Plant Cell Physiol. 2013, 54, 1478–1490. [Google Scholar] [CrossRef]
  49. Hichri, I.; Muhovski, Y.; Zizkova, E.; Dobrev, P.I.; Franco-Zorrilla, J.M.; Solano, R.; Lopez-Vidriero, I.; Motyka, V.; Lutts, S. The Solanum lycopersicum Zinc Finger2 cysteine-2/histidine-2 repressor-like transcription factor regulates development and tolerance to salinity in tomato and Arabidopsis. Plant Physiol. 2014, 164, 1967–1990. [Google Scholar] [CrossRef] [PubMed]
  50. Lu, Z.; Pan, Y.; Hu, W.; Cong, R.; Ren, T.; Guo, S.; Lu, J. The photosynthetic and structural differences between leaves and siliques of Brassica napus exposed to potassium deficiency. BMC Plant Biol. 2017, 17, 240. [Google Scholar] [CrossRef] [PubMed]
  51. Cherel, I.; Lefoulon, C.; Boeglin, M.; Sentenac, H. Molecular mechanisms involved in plant adaptation to low K(+) availability. J. Exp. Bot. 2014, 65, 833–848. [Google Scholar] [CrossRef]
  52. Zeng, Q.; Ling, Q.; Fan, L.; Li, Y.; Hu, F.; Chen, J.; Huang, Z.; Deng, H.; Li, Q.; Qi, Y. Transcriptome profiling of sugarcane roots in response to low potassium stress. PLoS ONE 2015, 10, e0126306. [Google Scholar] [CrossRef]
  53. Nieves-Cordones, M.; Aleman, F.; Martinez, V.; Rubio, F. K+ uptake in plant roots. The systems involved, their regulation and parallels in other organisms. J. Plant Physiol. 2014, 171, 688–695. [Google Scholar] [CrossRef]
  54. Yu, Q.; An, L.; Li, W. The CBL-CIPK network mediates different signaling pathways in plants. Plant Cell Rep. 2014, 33, 203–214. [Google Scholar] [CrossRef]
  55. Shin, R.; Schachtman, D.P. Hydrogen peroxide mediates plant root cell response to nutrient deprivation. Proc. Natl. Acad. Sci. USA 2004, 101, 8827–8832. [Google Scholar] [CrossRef] [PubMed] [Green Version]
  56. Jung, J.Y.; Shin, R.; Schachtman, D.P. Ethylene mediates response and tolerance to potassium deprivation in Arabidopsis. Plant Cell 2009, 21, 607–621. [Google Scholar] [CrossRef] [PubMed]
  57. Li, L.; Kim, B.G.; Cheong, Y.H.; Pandey, G.K.; Luan, S. A Ca(2+) signaling pathway regulates a K(+) channel for low−K response in Arabidopsis. Proc. Natl. Acad. Sci. USA 2006, 103, 12625–12630. [Google Scholar] [CrossRef] [PubMed]
  58. Lebaudy, A.; Very, A.A.; Sentenac, H. K+ channel activity in plants: Genes, regulations and functions. FEBS Lett. 2007, 581, 2357–2366. [Google Scholar] [CrossRef]
  59. Liu, L.L.; Ren, H.M.; Chen, L.Q.; Wang, Y.; Wu, W.H. A protein kinase, calcineurin B-like protein-interacting protein Kinase9, interacts with calcium sensor calcineurin B-like Protein3 and regulates potassium homeostasis under low-potassium stress in Arabidopsis. Plant Physiol. 2013, 161, 266–277. [Google Scholar] [CrossRef] [PubMed]
  60. Nieves-Cordones, M.; Al Shiblawi, F.R.; Sentenac, H. Roles and Transport of Sodium and Potassium in Plants. Met. Ions Life Sci. 2016, 16, 291–324. [Google Scholar]
  61. Ragel, P.; Rodenas, R.; Garcia-Martin, E.; Andres, Z.; Villalta, I.; Nieves-Cordones, M.; Rivero, R.M.; Martinez, V.; Pardo, J.M.; Quintero, F.J.; et al. The CBL-Interacting Protein Kinase CIPK23 Regulates HAK5-Mediated High-Affinity K+ Uptake in Arabidopsis Roots. Plant Physiol. 2015, 169, 2863–2873. [Google Scholar] [PubMed]
  62. Liu, W.; Stewart, C.N., Jr. Plant synthetic promoters and transcription factors. Curr. Opin. Biotechnol. 2016, 37, 36–44. [Google Scholar] [CrossRef] [PubMed]
  63. Dale, J.; James, A.; Paul, J.Y.; Khanna, H.; Smith, M.; Peraza-Echeverria, S.; Garcia-Bastidas, F.; Kema, G.; Waterhouse, P.; Mengersen, K.; et al. Transgenic Cavendish bananas with resistance to Fusarium wilt tropical race 4. Nat. Commun. 2017, 8, 1496. [Google Scholar] [CrossRef] [PubMed] [Green Version]
Figure 1. RNA sequencing (RNA-Seq) experimental process and bioinformatics analysis. QC: quality control.
Agronomy 09 00169 g001
Figure 2. Phenotypes of banana seedlings under normal and low-potassium (K+) conditions. The photographs show a comparison of leaves (A,B) and roots (C) between normal −K+ (NK) and low−K+ (LK) treatments. Bar = 5 cm.
Agronomy 09 00169 g002
Figure 3. K+ content of plants under different treatments: normal −K+ leaves (NKL) and low −K+ leaves (LKL) and normal −K+ roots (NKR) and low −K+ roots (LKR). Error bars with different letters indicate significant differences (three technical replicates, p < 0.05).
Agronomy 09 00169 g003
Figure 4. Scatter diagram showing all of the expressed genes. Blue indicates down-regulated genes under the LK treatment, orange indicates up-regulated genes under the LK treatment, and brown indicates non-regulated genes under the LK treatment. Screening conditions: false discovery rate (FDR) ≤ 0.001; abs (log2(Y/X) ≥ 1).
Agronomy 09 00169 g004
Figure 5. (A) Number of specifically expressed genes in different samples; (B) significantly up-regulated and down-regulated genes in the two NK–LK pairs.
Agronomy 09 00169 g005
Figure 6. Venn diagram showing the number of overlapping and non-overlapping genes differentially expressed in leaves and roots.
Agronomy 09 00169 g006
Figure 7. Gene ontology (GO) function analysis of leaves ((A): normal −K+ leaves (NKL) vs. low −K+ leaves (LKL)) and roots ((B): normal −K+ roots (NKR) vs. low −K+ roots (LKR)) of banana seedlings in a low −K+ stress experiment in terms of cellular components, molecular functions, and biological processes.
Agronomy 09 00169 g007
Figure 8. Differentially expressed genes (DEGs) related to K+ transport and uptake in roots and leaves. Red indicates up-regulated expression, while green indicates down-regulated expression.
Agronomy 09 00169 g008
Figure 9. Phylogenetic analysis of differentially expressed genes (DEGs) of the calcineurin B-like protein (CBL) family in banana leaves and roots.
Agronomy 09 00169 g009
Figure 10. The top six classes of transcription factor genes differentially expressed in banana leaves and roots.
Agronomy 09 00169 g010
Figure 11. Validation of gene expression by quantitative real-time polymerase chain reaction (qRT-PCR). (A) Ma02_g01130; (B) Ma08_g01650; (C) Ma06_g32750; (D) Ma01_g16930; (E) Ma04_g36800; (F) Ma09_g07970; (G) Ma04_g25840; (H) Ma03_g32970; (I) Ma06_g17380; (J) Ma10_g00760; (K) Ma03_g30510; (L) Ma01_g00720; (M) Ma10_g03640; (N) Ma11_g22540; (O) Ma10_g09710. The gene expression levels were measured by qRT-PCR and compared with RNA-sequencing (RNA-Seq) results. The histograms represent the fold changes of genes (low K+/normal K+: LK/NK) by qRT-PCR, while the line charts represent gene expression by the log2 Ratio (Fragments Per Kilobase of transcript per Million mapped reads (FPKM) of LK/FPKM of NK) in RNA-Seq. All of the genes selected for qRT-PCR analysis were analyzed in three technological replicates. Bars represent the ± SEΔCт of three replicated experiments (ΔCт(test) = Cт(target, test) − Cт(ref, test). Details of the genes selected for qRT-PCR are provided in Supplemental Material 2.
Agronomy 09 00169 g011
Table 1. Comparison of phenotypic traits between normal −K+ (NK) and low −K+ (LK) treatments.
Total Leaf NumberNumber of Leaves Showing SymptomsPlant Height/cmFresh weight of Aerial Part/gFresh Weight of Underground Part/gDry Weight of Aerial Part/gDry Weight of Underground Part/g
NK7.40 ± 0.821.55 ± 0.6815.12 ± 0.8244.69 ± 4.5621.38 ± 2.966.02 ± 1.313.35 ± 0.47
LK6.20 ± 0.892.00 ± 0.7211.77 ± 1.1326.38 ± 4.5411.67 ± 2.373.08 ± 0.761.67 ± 0.49
Significance levelababababababab
Notice: ab indicates a significant difference; aa/bb indicates no significant difference.
Table 2. RNA sequencing statistics for each sample.
Sample Raw ReadsClean ReadsGenome Map RateExpressed GenesExpressed Transcripts
NKL12,191,78912,121,98084.01%26,79633,388
LKL12,191,89812,108,96984.81%27,01433,469
NKR12,191,77812,121,21982.63%29,15835,896
LKR12,191,84412,087,98081.73%28,74835,380
Total48,767,30924,209,199-111,716138,133
Table 3. Differentially expressed genes (DEGs) related to potassium in leaves and roots.
(A) Differentially Expressed Genes Related to Potassium in Leaves
Gene IDNKL-FPKMLKL-FPKMlog2 Ratio (LKL/NKL)Up–Down-Regulation
(LKL/NKL)
Gene Function Annotation
Ma03_g247802.660.44−2.60DownPotassium transporter 13 [Musa acuminata subsp. malaccensis]
Ma07_g091809.32.77−1.75DownPotassium channel KAT3-like isoform X2 [Musa acuminata subsp. malaccensis]
Ma11_g0453077.0636.94−1.06DownCBL-interacting protein kinase 1 [Musa acuminata subsp. malaccensis]
Ma05_g071301.6620.653.64UpPotassium transporter 1 isoform X2 [Musa acuminata subsp. Malaccensis]
Ma08_g206603.9721.492.44UpCation/calcium exchanger 1–like [Musa acuminata subsp. malaccensis]
Ma02_g045404.9211.51.22UpPotassium transporter 11 [Musa acuminata subsp. malaccensis]
Ma10_g278500.23.224.01UpPotassium channel KAT3–like [Musa acuminata subsp. malaccensis]
Ma07_g1757011.2634.391.61UpCBL-interacting protein kinase 1 [Musa acuminata subsp. malaccensis]
Ma07_g053107.8520.191.36UpCBL-interacting protein kinase 6 [Musa acuminata subsp. malaccensis]
Ma09_g0471038.84861.15UpCBL-interacting serine/threonine-protein kinase 11 [Musa acuminata subsp. malaccensis]
(B) Differentially Expressed Genes Related to Potassium in Root
Gene IDNKR-FPKMLKR-FPKMlog2 Ratio (LKR/NKR)Up–Down-Regulation
(LKL/NKL)
Gene Function Annotation
Ma03_g060905.791−2.53DownPotassium transporter 6-like [Musa acuminata subsp. malaccensis]
Ma07_g121907.81.74−2.16DownPotassium transporter 17 isoform X3 [Musa acuminata subsp. malaccensis]
Ma09_g24000163.1771.21−1.20DownVoltage-gated potassium channel subunit beta [Musa acuminata subsp. malaccensis]
Ma06_g286106.232.73−1.19DownPotassium channel KAT2-like isoform X5 [Musa acuminata subsp. malaccensis]
Ma05_g1828011.85.44−1.12DownCation/calcium exchanger 5 [Musa acuminata subsp. malaccensis]
Ma09_g1115012.075.59−1.11DownPotassium transporter 7-like [Musa acuminata subsp. malaccensis]
Ma11_g166908.554.02−1.09DownProbable potassium transporter 11 [Musa acuminata subsp. malaccensis]
Ma06_g261404.410.001−12.11DownCBL-interacting protein kinase 7 [Musa acuminata subsp. malaccensis]
Ma05_g071300.372.732.88UpPotassium transporter 1 isoform X2 [Musa acuminata subsp. malaccensis]
Ma08_g236501.657.882.26UpPotassium channel KOR1-like [Musa acuminata subsp. malaccensis]
Ma07_g215206.7129.62.14UpPotassium transporter 6-like isoformX2 [Musa acuminata subsp. malaccensis]
Ma05_g0947022.3459.241.41UpPotassium channel KAT4-like [Musa acuminata subsp. malaccensis]
Ma06_g342400.884.472.34UpCBL-interacting serine/threonine-protein kinase 29 [Musa acuminata subsp. malaccensis]
Ma06_g285103.1514.662.22UpCBL-interacting serine/threonine-protein kinase 12 [Musa acuminata subsp. malaccensis]
Ma07_g2363051.84228.132.14UpCBL-interacting protein kinase 2 [Musa acuminata subsp. malaccensis]
Ma01_g174001239.951.74UpCBL-interacting protein kinase 1 [Musa acuminata subsp. malaccensis]
Ma04_g2951024.9474.581.58UpCBL-interacting protein kinase 23 [Musa acuminata subsp. malaccensis]
Ma07_g2912091.26249.131.45UpCBL-interacting protein kinase 6 [Musa acuminata subsp. malaccensis]
Ma03_g1454010.226.641.39UpCBL-interacting serine/threonine-protein kinase 1 [Musa acuminata subsp. malaccensis]
Ma04_g1520026.5766.811.33UpCBL-interacting protein kinase 19 [Musa acuminata subsp. malaccensis]
Ma08_g107005.3812.271.19UpCBL-interacting protein kinase 1 [Musa acuminata subsp. malaccensis]
FPKM: Fragments Per Kilobase of transcript per Million mapped reads; KAT: K+ channel from Arabidopsis thaliana; CBL: calcineurin B-like protein; KOR: K(+)-outward-(KOR) channels.

