Article

An Evaluation of Spelt Crosses for Breeding New Varieties of Spring Spelt

Department of Plant Breeding and Seed Production, University of Warmia and Mazury in Olsztyn, Pl. Łódzki 3, 10-724 Olsztyn, Poland
*
Author to whom correspondence should be addressed.
Agronomy 2019, 9(4), 167; https://doi.org/10.3390/agronomy9040167
Submission received: 27 February 2019 / Revised: 13 March 2019 / Accepted: 26 March 2019 / Published: 29 March 2019
(This article belongs to the Section Crop Breeding and Genetics)

Abstract

:
This study evaluated F5 breeding lines, which were obtained by crossing five parents of spring spelt from different geographical regions characterized by various morphological and performance traits. A total of 11 quantitative traits were analyzed, including six traits relating to yield components, four traits relating to grain quality, and one trait relating to plant height and sensitivity to lodging. The applied clustering method supported the identification of four groups of breeding lines which were presented graphically in a heatmap with dendrogram. Group I contained 33.0% of the breeding lines, and it was most distant from the remaining groups. It was composed of tall plants characterized by high values of yield components, high fat content, and high sensitivity to lodging. Groups III (30.4%) and IV (17.0%) were most similar and were characterized by lower values of yield components, a high content of protein, ash and fiber, and lower sensitivity to lodging. Group II contained 19.6% of the breeding lines, and it was more similar to groups III and IV than group I. Breeding lines with satisfactory performance traits can be selected from each group and used to breed new varieties with the desired traits.

1. Introduction

Spelt (Triticum spelta L. 1753, syn. Triticum aestivum ssp. spelta (L.) Thell. 1918, 2n = 6x = 42, AABBDD) is one of the oldest species/subspecies of wheat, cultivated as far back as 7000–8000 BCE in the Neolithic period. Spelt had probably originated from Southeast Asia and spread to Northern and Central Europe, where it became a staple cereal [1,2,3]. In Poland, spelt, emmer (Triticum dicoccum (Schrank ex Schübler) Thell.) 2n = 4x = 28, AABB), and einkorn (Triticum monococcum L. 2n = 2x = 14, AA) were cultivated 4000 years ago. Spelt had probably originated from multiple crosses between club wheat and hulled tetraploid emmer in the Fertile Crescent region. Spelt spread to Europe, including Austria, Southern Germany, and Switzerland, migrating along the Black Sea coast and the Danube [1,2]. In Europe, spelt replaced einkorn and emmer during the last glacial period, but it was superseded by the threshable bread wheat (T. aestivum) in the 1st millennium CE. Despite the above, spelt continued to be cultivated for centuries and it survived until the modern period as a niche species [3]. In the second half of the 20th century, the interest in spelt was revived on account of its health benefits, high nutritional value, and suitability for breeding programs aiming to develop varieties characterized by high grain quality and high resistance to pathogens. At present, spelt is grown mainly in Germany (80,000–100,000 ha, estimated data), Austria (12,511 ha in 2018), and Switzerland (5454 ha in 2018) [4,5,6]. European varieties of spelt belong to Iberian and Bavarian eco-geographic groups, which could have evolved independently over the centuries [7,8,9].
Winter spelt is the predominant cultivated form of spelt in Europe [10,11,12,13]. A total of 67 spelt varieties, including seven conservation varieties, are listed in the Common Catalogue of Varieties of Agricultural Plant Species (CCA) [14]. There are no native varieties of spelt in Poland. Organic farms grow mainly winter varieties of spelt, including Ostro, Franckenkorn, Schwabenkorn, Oberkulmer Rotkorn, and Zollernspelz, which are listed in the CCA [14]. According to Okoń et al. [15], spelt varieties grown in Poland are characterized by low levels of genetic diversity. However, qualitative and molecular analyses of 28 European varieties of spelt revealed high levels of genetic diversity, with the studied varieties divided into two main groups: Varieties containing the genetic material of bread wheat, and true spelt that does not contain the genetic material of bread wheat [16]. The first Polish variety of spring spelt, Wirtas, was introduced in 2015 [17,18]. Wirtas is characterized by white and awnless spikes with brittle rachis, hulled kernels, long culms, and low resistance to lodging. In a two-year study, the spikelet yield of spring spelt cv. Wirtas was determined at 76.4% and 83.8%, and the dehulled grain yield at 57.8% and 63.0% of that determined in bread wheat in treatments with lower (50 kg N ha−1) and higher (100 kg N ha−1) rates of nitrogen fertilization, which was equivalent to 4.85 t ha−1 and 5.32 t ha−1 spikelets, and 3.67 t ha−1 and 4.00 t ha−1 dehulled grain, respectively. The grain/spikelet weight ratio was 74.8% [18]. Spring spelt cv. Wirtas is characterized by high resistance to adverse biotic and abiotic factors, low nutritional requirements, and high-quality grain that is used in food and feed production. Wirtas is not suitable for high-input farming, but it is popular in organic farms [19]. The Polish National List of Agricultural Plant Varieties (NLI) contains three spelt varieties: The winter variety Rokosz, listed in 2012, and two Polish spring varieties, Wirtas and Kuiavia, listed in 2015 and 2018 [17,20,21]. Polish spelt varieties are also listed in the CCA [14].
Spelt has a unique genetic composition that is easily crossed with bread wheat (Triticum aestivum). For these reasons, spelt is used in breeding programs as a source of important performance traits for breeding modern varieties of bread wheat [22,23,24,25,26]. Traditional crossbreeding by genetic recombination is generally recognized as a safe method of increasing genetic diversity. Screening panels of ancient wheats (obtained from gene banks) and the selection of the best accessions for the production of varieties with satisfactory quality traits constitute a separate research pathway [26]. The authors have initiated a research program entitled “An evaluation of Triticum spelta, T. dicoccum, and T. monococcum collections for variations in grain quality, resistance to Fusarium pathogens and suitability for breeding new varieties adapted to sustainable farming systems” to address the growing interest in spelt in organic farms and the limited number of spelt varieties. The presented study is a part of the above research program which aims to increase the genetic diversity of spring spelt varieties suitable for growing in north-eastern Poland.
The aim of this study is to evaluate F5 breeding lines of spring spelt in terms of yield components, the chemical composition of grain, and lodging tolerance with the use of multivariate two-way joining cluster analysis.

2. Materials and Methods

2.1. Plant Material

The experimental plant material comprised F5 breeding lines of T. spelta (♀) × T. spelta (♂) that were obtained by crossing 5 parents of spring spelt (Table 1). The parents were characterized by high yields, satisfactory chemical composition of grain, and high resistance to spike and kernel infections. In terms of morphology, the parental forms differed mainly in spike structure and color: O11—white and awnless, O13, K17, K18—white and awned, K20—anthocyanin-pigmented and awned. The parents were crossbred in 7 combinations, K17 × O11, O13 × O11, K20 × K18, K20 × K17, K20 × O11, K20 × O13 and K17 × O13, in the greenhouse of the University of Warmia and Mazury in Olsztyn in 2007 in accordance with the standard protocol for the crossbreeding of wheat [27].
F1 generation plants were not selected. The spikelets from all F1 spikes were sown in a field in 2009. Every row represented the F2 progeny of one F1 spike—a total of 172 spelt crosses. The spikes from each row of the F2 generation were harvested separately and sorted. The basic selection criterion was spike weight, and approximately 50% of small and light spikes and spikes infected by fungal pathogens were eliminated. The spikes from each row of the F2 generation were weighed before and after selection. Two spikelets were removed from every selected spike. One spikelet was sown and the other was kept as reserve material. The remaining spikes were threshed with the Wintersteiger LD 180 laboratory thresher, and threshed grained was used in chemical analyses. A total of 46 spelt crosses were selected for further breeding: K17 × O11—6; O13 × O11—7; K20 × K18—8; K20 × K17—6; K20 × O11—7; K20 × O13—7, and K17 × O13—5 (Table 2).
The spikelets from the selected 46 spelt crosses were sown in a field and superior individuals were selected based on the following criteria: Lodging tolerance, grain yield, and/or awnless spikes. A total of 264 individuals were selected from 46 spelt crosses in two cycles to produce 107—F5 breeding lines of spring spelt (Table 2).
Spring wheat cv. Parabola (bread wheat of quality class A—quality bread variety, entered into the NLI in 2006) was used as the reference. The grain characteristics of spelt and spring wheat cv. Parabola are presented in Figure 1.

2.2. Yield Components and Lodging Tolerance

Each F5 breeding line was evaluated for yield-related biometric traits and the chemical composition of grain. The following parameters were measured: Plant height after heading (cm); length of internodes at full maturity (cm); spike length (cm); number of spikelets per spike; spike weight (g); spike density (number of spikelets per 10 cm of rachis); number of kernels per spike; kernel weight per spike (g); grain/spike weight ratio (%); and 1000-kernel weight (g). Each breeding line was represented by 30 plants (culms/spikes).
A total of 30 culms/spices per each F5 breeding line were analyzed. Plant height was measured after heading from the ground to the tip of 30 typical culms. Spikes were threshed manually for biometric measurements.
Spelt breeding line, their parents, and bread wheat cv. Parabola were evaluated for sensitivity to lodging under field conditions on a 1–5 scale (1—no lodging, plants standing erect; 2—plants leaning to 30°, 3—plants leaning from 30° to 60°, 4—plants leaning above 60°, 5—complete lodging, plants flattened on the ground) on two dates during the growing season: (1) After heading, and (2) before harvest. Every group of breeding lines was evaluated for sensitivity to lodging based on median values.

2.3. Chemical Analyses of Grain

The grain was subjected to chemical analyses to determine the content of protein, fat, ash, and fiber on a dry matter basis. Threshed, dehulled, and cleaned spelt grain derived from 30 spikes of different plants was ground in the Cyclotec 1093 laboratory mill (FOSS Analytic AB, Höganäs, Sweden) to produce samples with a 1.0 mm particle size. The analyses were carried out in the Chemical Laboratory of the Department of Plant Breeding and Seed Production of the University of Warmia and Mazury in Olsztyn.
Crude protein content (N × 5.7) was determined according to Kjeldahl’s method using the Büchi System (K-424 digestion unit and B-324 distillation unit, Flawil, Switzerland) according to standard PN-EN ISO 20483:2014 [31]. Crude fat was extracted by the Soxhlet method using the Büchi Extraction System B-811 with petroleum ether according to standard PN-EN ISO 734-1:2008 [32]. Ash content was determined in the Thermostep thermogravimetric analyzer (ELTRA GmBH, Neuss, Germany) according to standard PN-G-04560:1998 [33]. Crude fiber content was determined using the Fibertec 2010 system (FOSS Analytic AB, Höganäs, Sweden) and the Weende method after extraction with 1.25% H2SO4 and 1.25% NaOH [34]. According to standard PN-EN ISO 20483:2014 [31] protein, fat, ash, and fiber content for all breeding lines, parents, and reference cv. Parabola was determined in two replications. The results are expressed in percentage terms on a dry matter basis (% DM).

2.4. Field Experiment

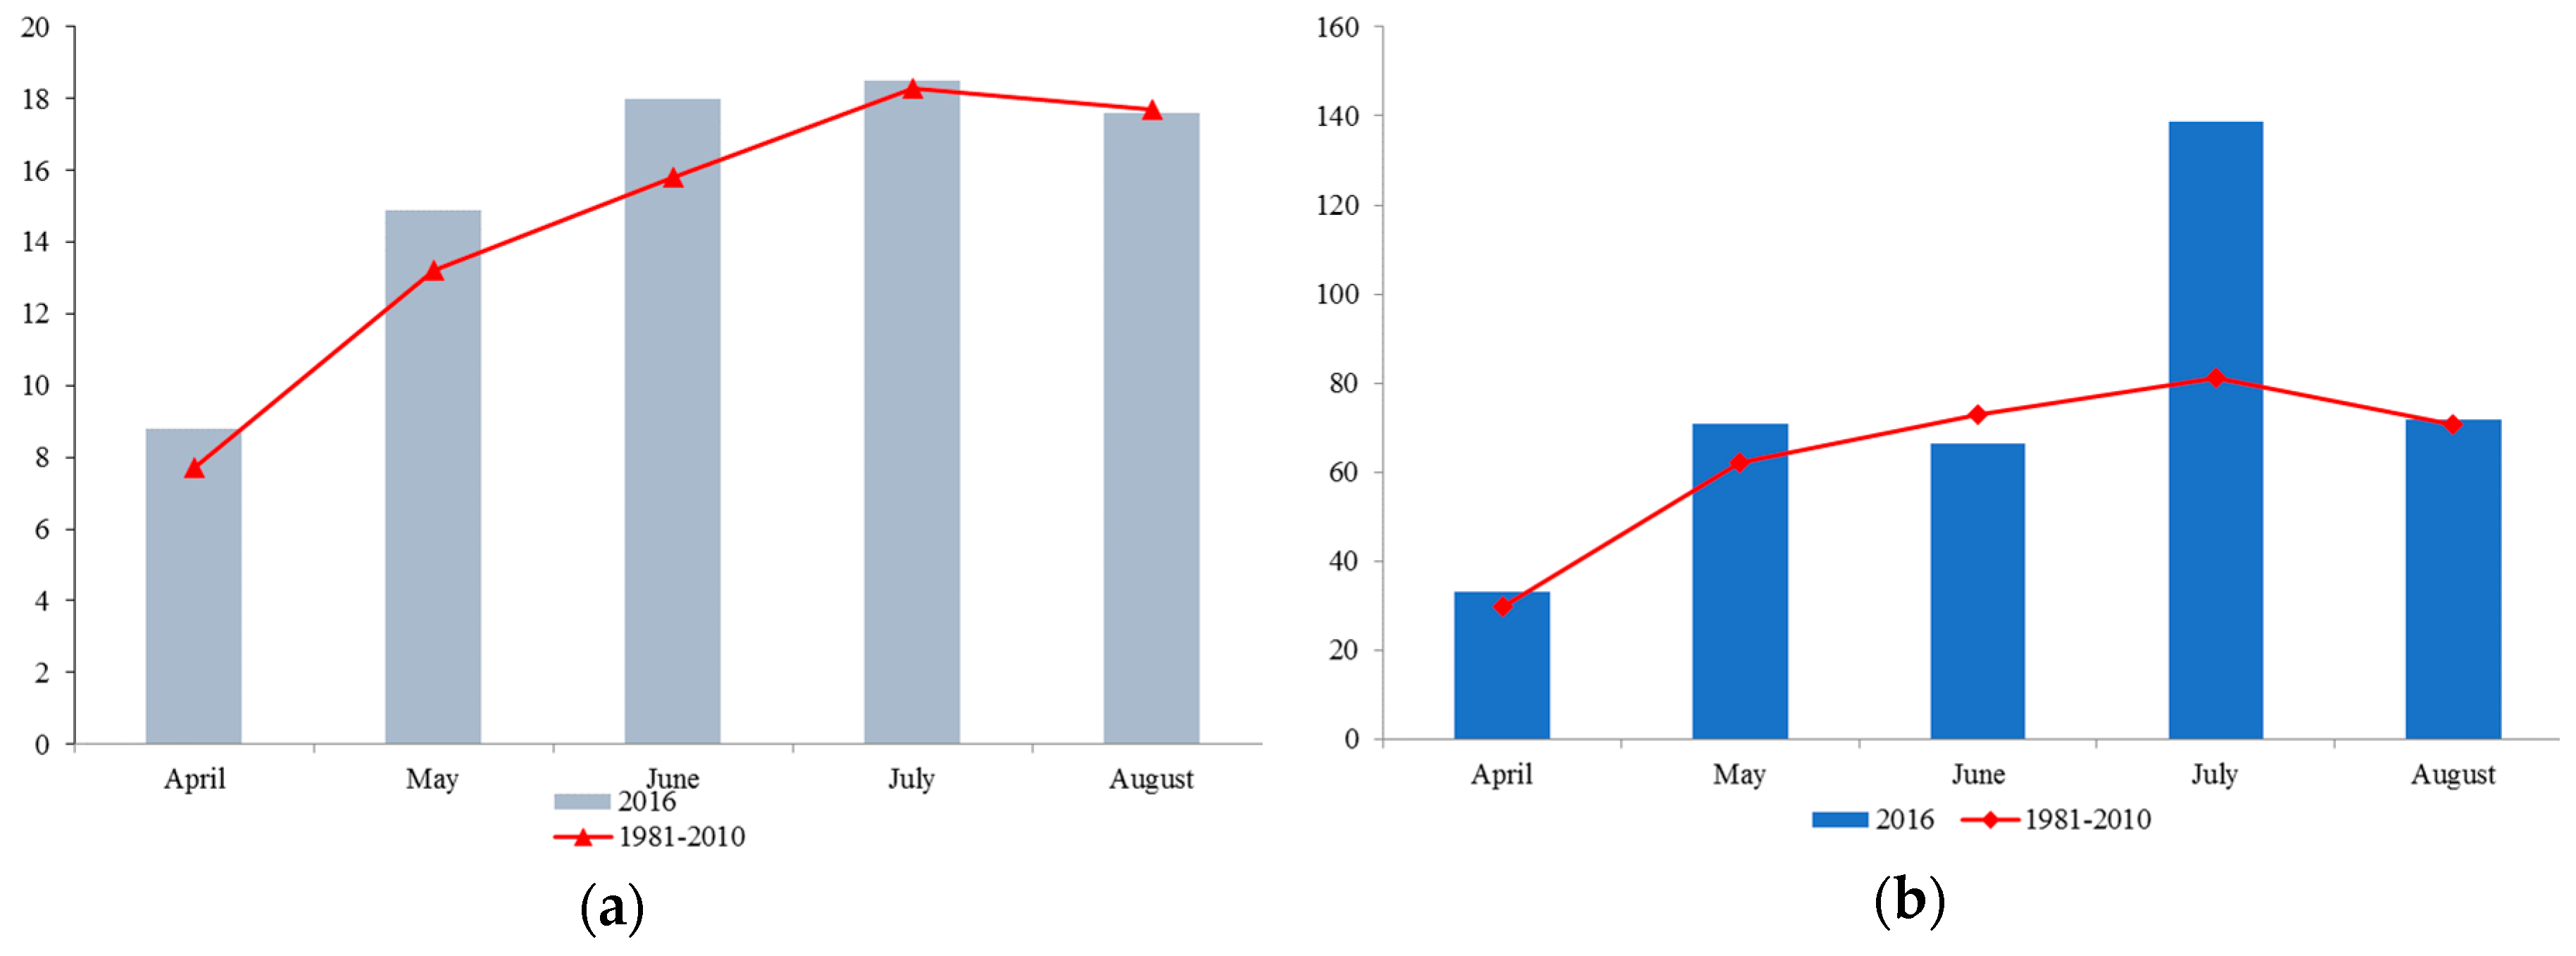
The successive generations of F1, F2, F3, F4, F5 breeding lines, their parents, and bread wheat cv. Parabola (standard cultivar) were sown in a field at the Agricultural Experiment Station in Bałcyny near Ostróda (53°35′49″ N, 19°51′20″ E; 136.9 m a.s.l), which is operated by the University of Warmia and Mazury in Olsztyn. F5 breeding lines were sown 8 April 2016, and were harvested between 21 and 31 August 2016. The average temperature during the growing season of 2016 was similar to the long-term average (Figure 2a). Precipitation levels were characterized by greater variation. Total precipitation during the growing season reached 380.7 mm, with a peak in July, and it exceeded the long-term average (316.8 mm) (Figure 2b). The experiment had a completely randomized design and all breeding lines, parents, and reference cv. Parabola were sown in a single replication. Plot size was 3 m2. Spikelets were sown manually in three rows with 20 cm of spacing between the rows. A single dose of N/P/K fertilizer was applied before sowing at 40/25/80 kg ha−1. Fungicides and growth promoters were not applied. Weeds and pests were controlled chemically.

2.5. Statistical Analysis

The F5 breeding lines of spelt and their parents were evaluated based on 18 quantitative traits: (1) Plant height after heading (cm); (2) length of the first internode (cm); (3) length of the second internode (cm); (4) length of the third internode (cm); (5) length of the fourth internode (cm); (6) length of the fifth (uppermost) internode (cm); (7) spike length (cm); (8) number of spikelets per spike; (9) spike weight (g); (10) spike density; (11) number of kernels per spike; (12) kernel weight per spike (g); (13) grain/spike weight ratio (%); (14) 1000-kernel weight (g); (15) protein content (% DM); (16) fat content (% DM); (17) ash content (% DM); and (18) fiber content (% DM). Cluster analysis was used to group the studied objects (spelt breeding lines) and evaluate multiple traits (variables). Different units of measurement were used in the study, therefore, data had to be standardized.
In the first stage of the analysis, the number of the analyzed traits was reduced. Some of the traits were highly correlated, and they had to be eliminated to avoid collinearity. Highly correlated traits were combined into groups by tree clustering. Ward’s method [35] with a distance measure was used to create 1-r clusters, where r is the coefficient of correlation between variables X and Y. The group of 18 variables was reduced to 11 variables with minimum information loss, which facilitated the interpretation of results. The above approach is not widely used, but it reduces the number of variables as effectively as principal component analysis (PCA) and factor analysis [36].
In the second stage, multivariate two-way joining analysis was used to simultaneously group objects (spelt breeding lines) and variables (traits) to create a logical system of clusters. A heatmap and a dendrogram were developed (heatmap-tree). Every column in the map represents a given trait, and the value of that trait after standardization was mapped with different colors. Every row in the heatmap represents a different spelt breeding line. Heatmap rows were arranged based on the measured distances between the experimental treatments in the dendrogram.
Group means were compared by orthogonal contrast analysis at p < 0.05. All analyses were performed in the Statistica (data analysis software system), version 13 [37].

3. Results

3.1. Characteristics of F2 Spelt Crosses of Spring Spelt

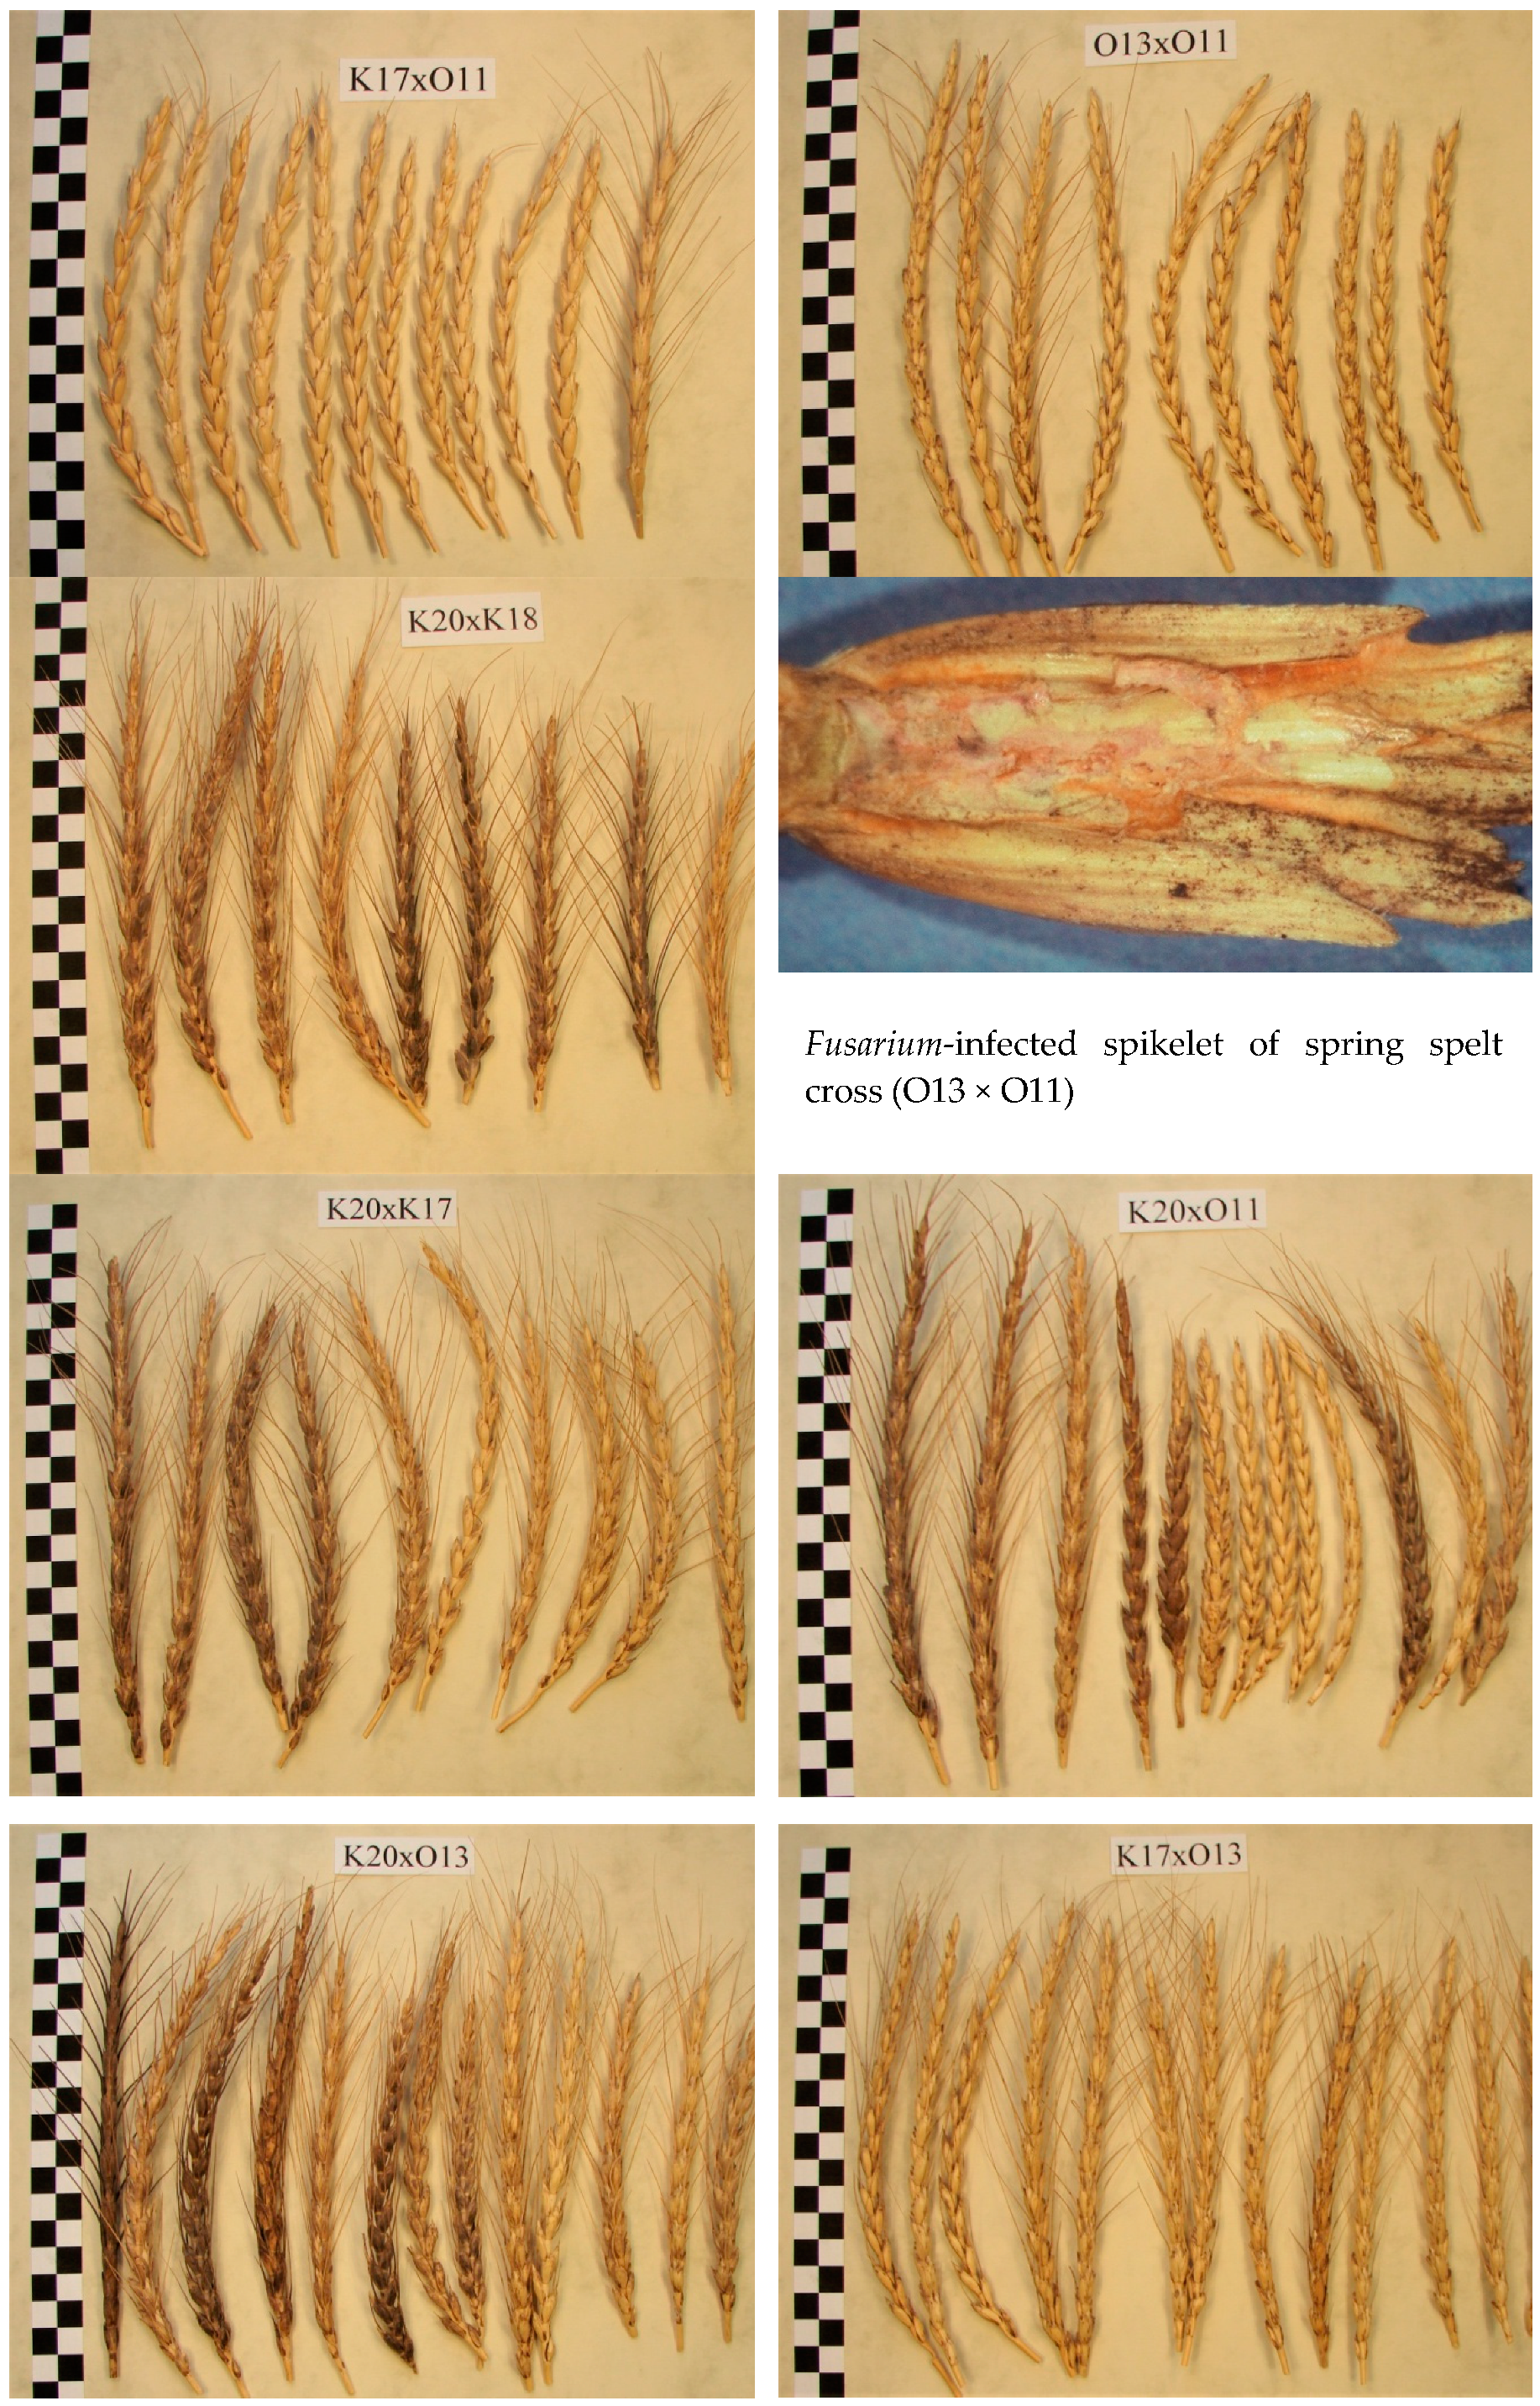
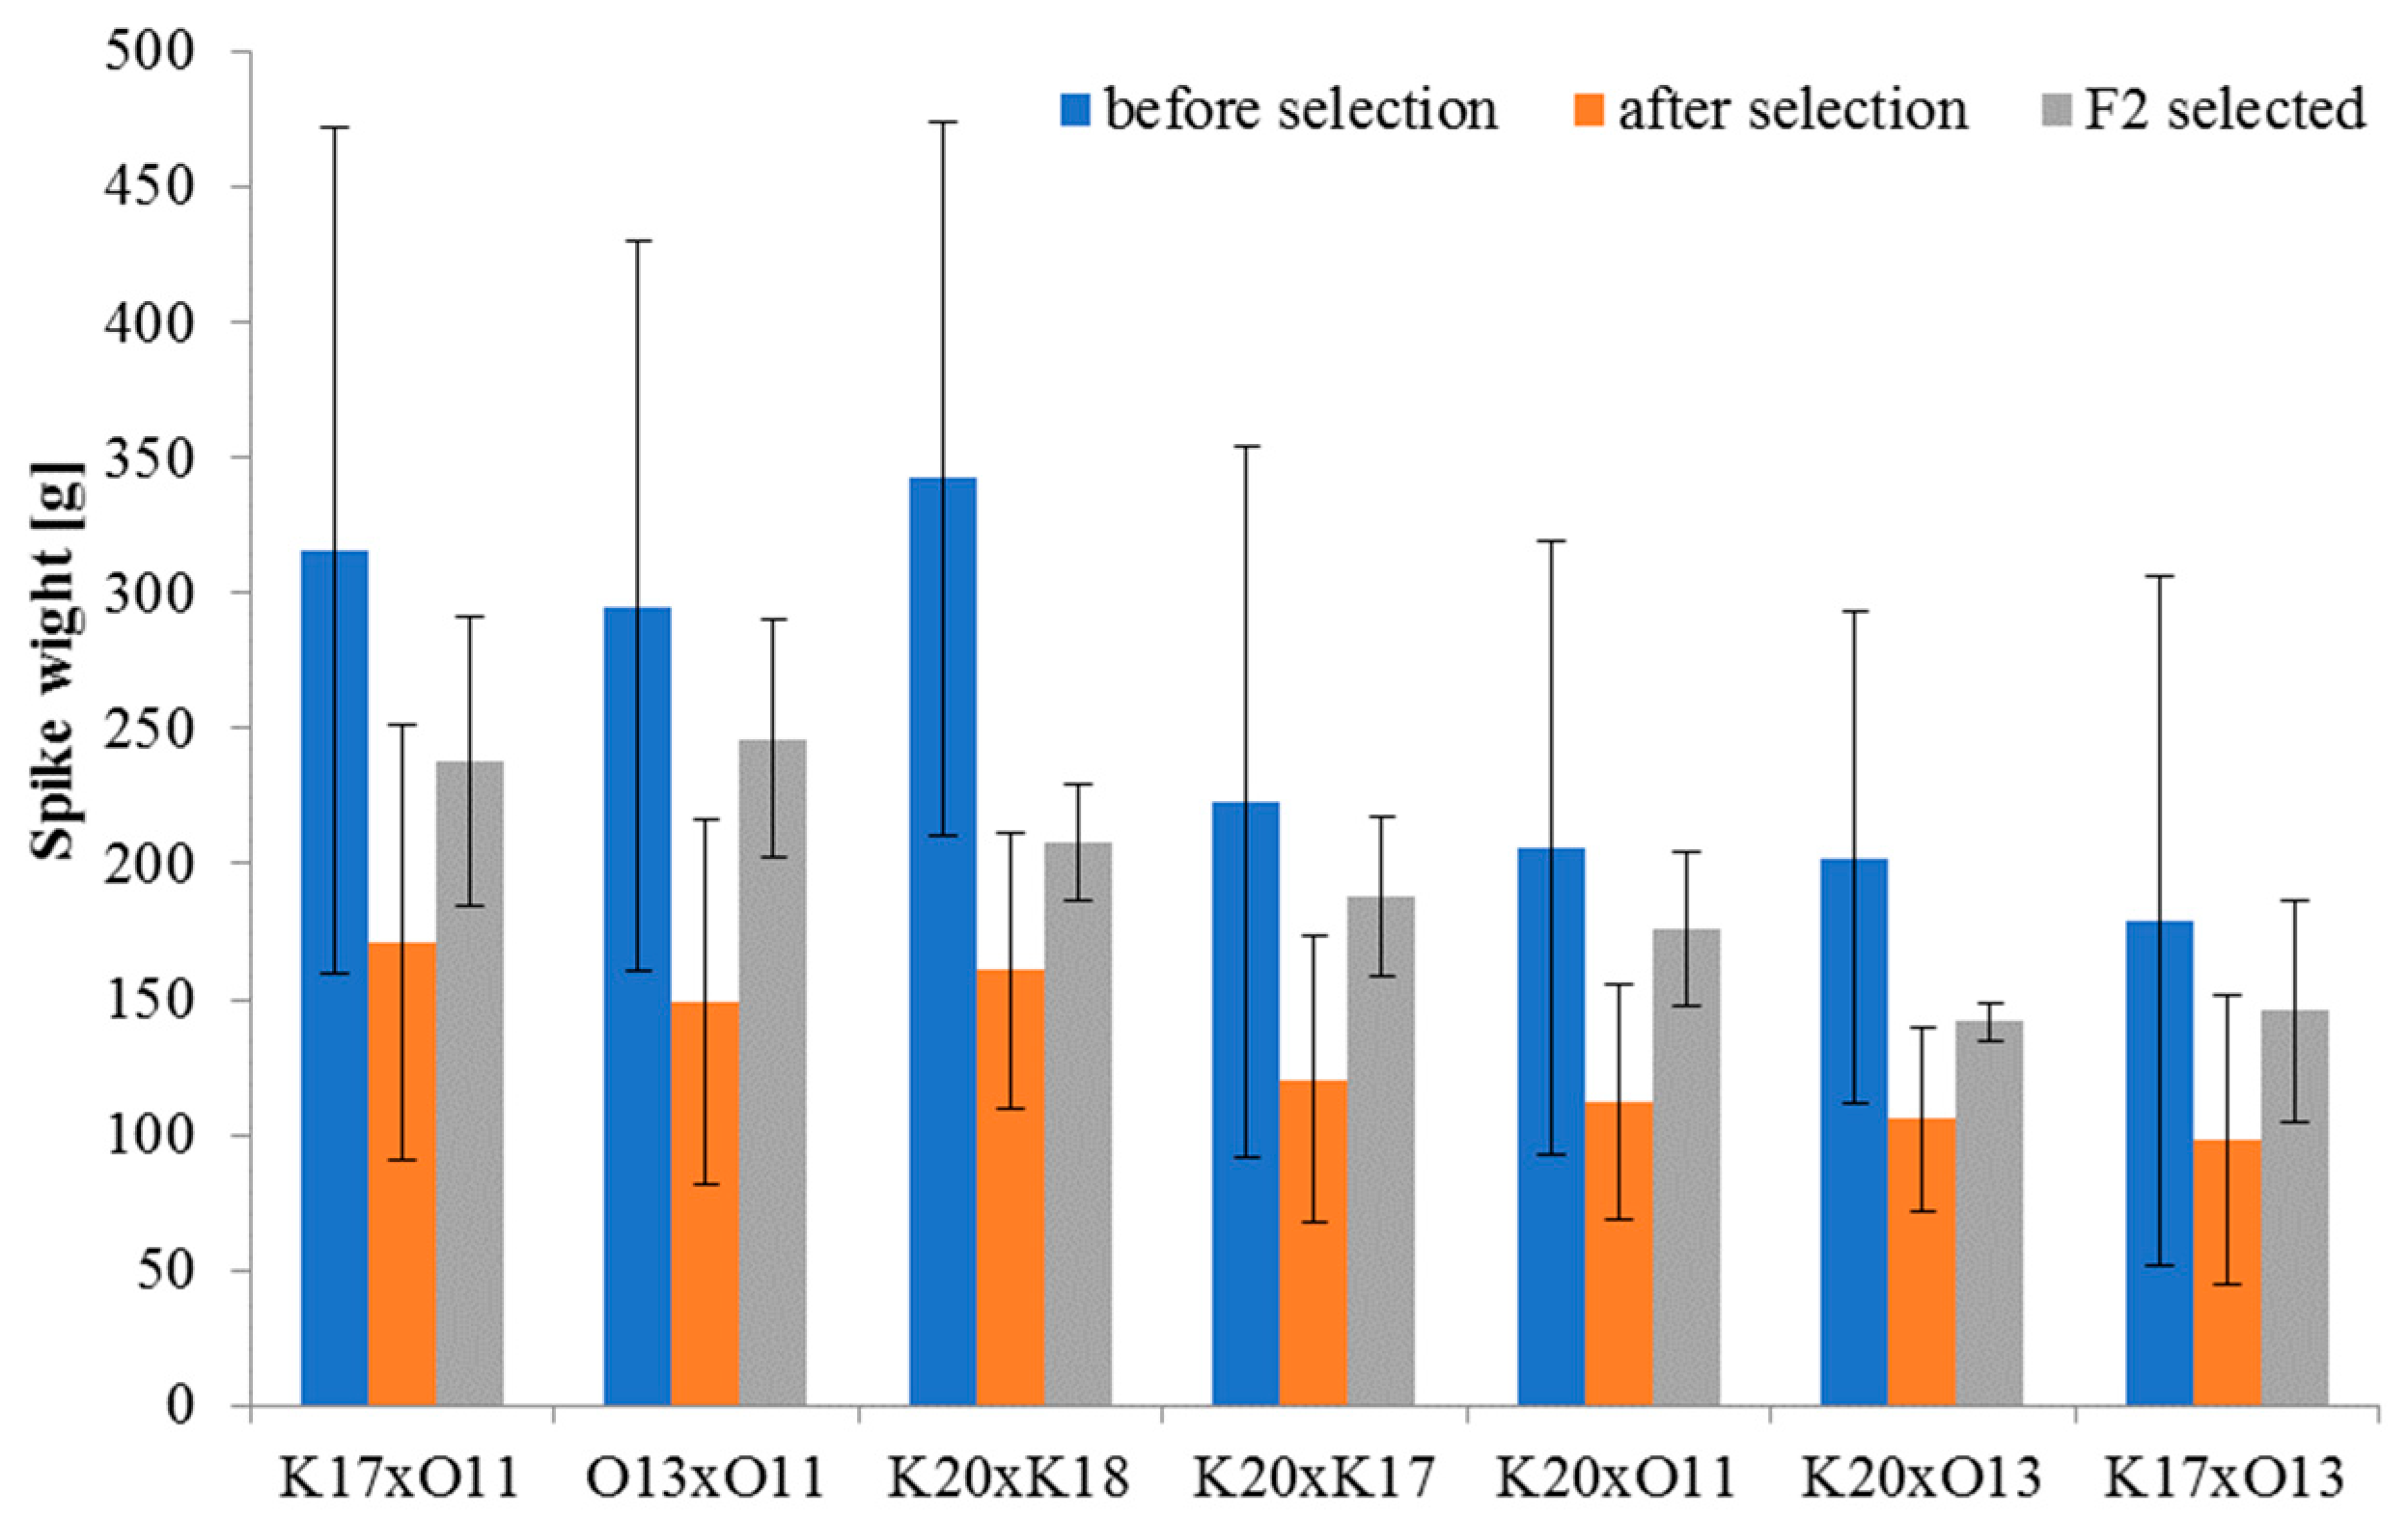
K17 × O11 spelt crosses (n = 14) were obtained by crossing white and awned K17 spelt with white and awnless O11 spelt. In the F2 generation of K17 × O11 spelt crosses, most spikes were awnless and morphologically similar to the O11 paternal form (Figure 3). Spike length ranged from 15 to 19 cm. Spikes had brittle rachis and were easily damaged. Spike weight was determined at 92 to 654 g before selection and 42 to 329 g after selection, with an average of 316 g and 171 g, respectively. K17 × O11 spelt crosses were characterized by the highest average spike weight after initial selection (Figure 4). K17 × O11 spelt crosses were also characterized by the highest average content of ash and crude fiber as well as the second highest average protein content after K17 × O13 spelt crosses (Table 3). A total of six K17 × O11 spelt crosses were selected for further breeding.
O13 × O11 spelt crosses (n = 27) were obtained by crossing white and awned O13 spelt with white and awnless O11 spelt. In F2 spelt crosses, most spikes were awned, white, and morphologically similar to the O13 maternal form (Figure 3). Spike length ranged from 13 to 19 cm. The awnless spikes of the O13 × O11 spelt crosses were significantly heavier than awned spikes. Spike weight was determined at 57 to 570 g before selection and 53 to 300 g after selection with an average of 295 g and 149 g, respectively (Figure 4). Symptoms of severe infection with Fusarium fungi were observed on the spikes of two O13 × O11 spelt crosses (Figure 3). A total of seven spelt crosses were selected for further breeding.
K20 × K18 spelt crosses (n = 29) were obtained by crossing awned K20 spelt with strong anthocyanin pigmentation with awned and white K18 spelt. All spikes of F2 spelt crosses were awned, and most of them were characterized by anthocyanin pigmentation and satisfactory threshability (Figure 3). Spike length ranged from 15 to 21 cm. Spike weight was determined at 69 to 579 g before selection and 50 to 240 g after selection with an average of 342 g and 161 g, respectively (Figure 4). Severe symptoms of Fusarium infection were observed on the spikes of three K20 × K18 spelt crosses. K20 × K18 spelt crosses were characterized by the lowest average content of protein and crude fiber (Table 3). A total of eight spelt crosses were selected for further breeding.
K20 × O11 spelt crosses (n = 37) were obtained by crossing awned K20 spelt with strong anthocyanin pigmentation with white and awnless O11 spelt. In F2 spelt crosses, most spikes were awned and characterized by anthocyanin pigmentation (Figure 3). Spike length ranged from 17 to 22 cm. Spike weight was determined at 30 to 480 g before selection and 30 to 224 g after selection with an average of 206 g and 112 g, respectively (Figure 2). K20 × O11 spelt crosses were characterized by the lowest average ash content and high fat content (Table 3). A total of seven spelt crosses were selected for further breeding.
K20 × O13 spelt crosses (n = 23) were obtained by crossing awned K20 spelt with strong anthocyanin pigmentation with white and awned O13 spelt. The spikes of F2 spelt crosses were awned, and most of them were characterized by anthocyanin pigmentation (Figure 3). Spike length ranged from 10 to 19 cm. Spike weight was determined at 20 to 314 g before selection and 13 to 149 g after selection with an average of 202 g and 106 g, respectively (Figure 4). K20 × O13 spelt crosses were characterized by a moderate content of the analyzed chemical components relative to the remaining spelt crosses (Table 3). A total of seven spelt crosses were selected for further breeding.
K17 × O13 spelt crosses (n = 16) were obtained by crossing white and awned K17 spelt with white and awned O13 spelt. F2 spelt crosses had white and awned spikes (Figure 3). Spike length ranged from 16 to 19 cm. Spike weight was determined at 23 to 370 g before selection and 23 to 198 g after selection with an average of 179 g and 98 g, respectively. K17 × O13 spelt crosses were characterized by the lowest average spike weight before and after selection (Figure 4), as well as the highest average protein content and the lowest fat content (Table 3). A total of five spelt crosses were selected for further breeding.
The spelt crosses selected for further breeding were characterized by the highest spike weight. The average spike weight in all 172 F2 spelt crosses was determined at 255 ± 136 g before selection and 131 ± 59 g after selection, and the average spike weight in the selected 46 spelt crosses was determined at 404 ± 95 g and 193 ± 48 g, respectively. The analyzed spelt crosses were characterized by minor variations in protein and ash content, and the values of the corresponding coefficients of variation were determined at 5.6% and 8.9%. Greater variations were observed in fat and fiber content, and the values of the corresponding coefficients of variation were determined at 14.7% and 16.2%.

3.2. Characteristics of F5 Breeding Lines of Spring Spelt

In 2016, the F5 breeding lines of spring spelt were evaluated under field and laboratory conditions relative to their parents and bread wheat cv. Parabola. The number of F5 breeding lines was as follows: K17 × O11 (n = 27), O13 × O11 (n = 26), K20 × K18 (n = 7), K20 × K17 (n = 13), K20 × O11 (n = 23), K20 × O13 (n = 8), and K17 × O13 (n = 3). The ripening period in July 2016 was characterized by high precipitation, a factor that contributes to lodging.

3.2.1. Plant Height and Sensitivity to Lodging

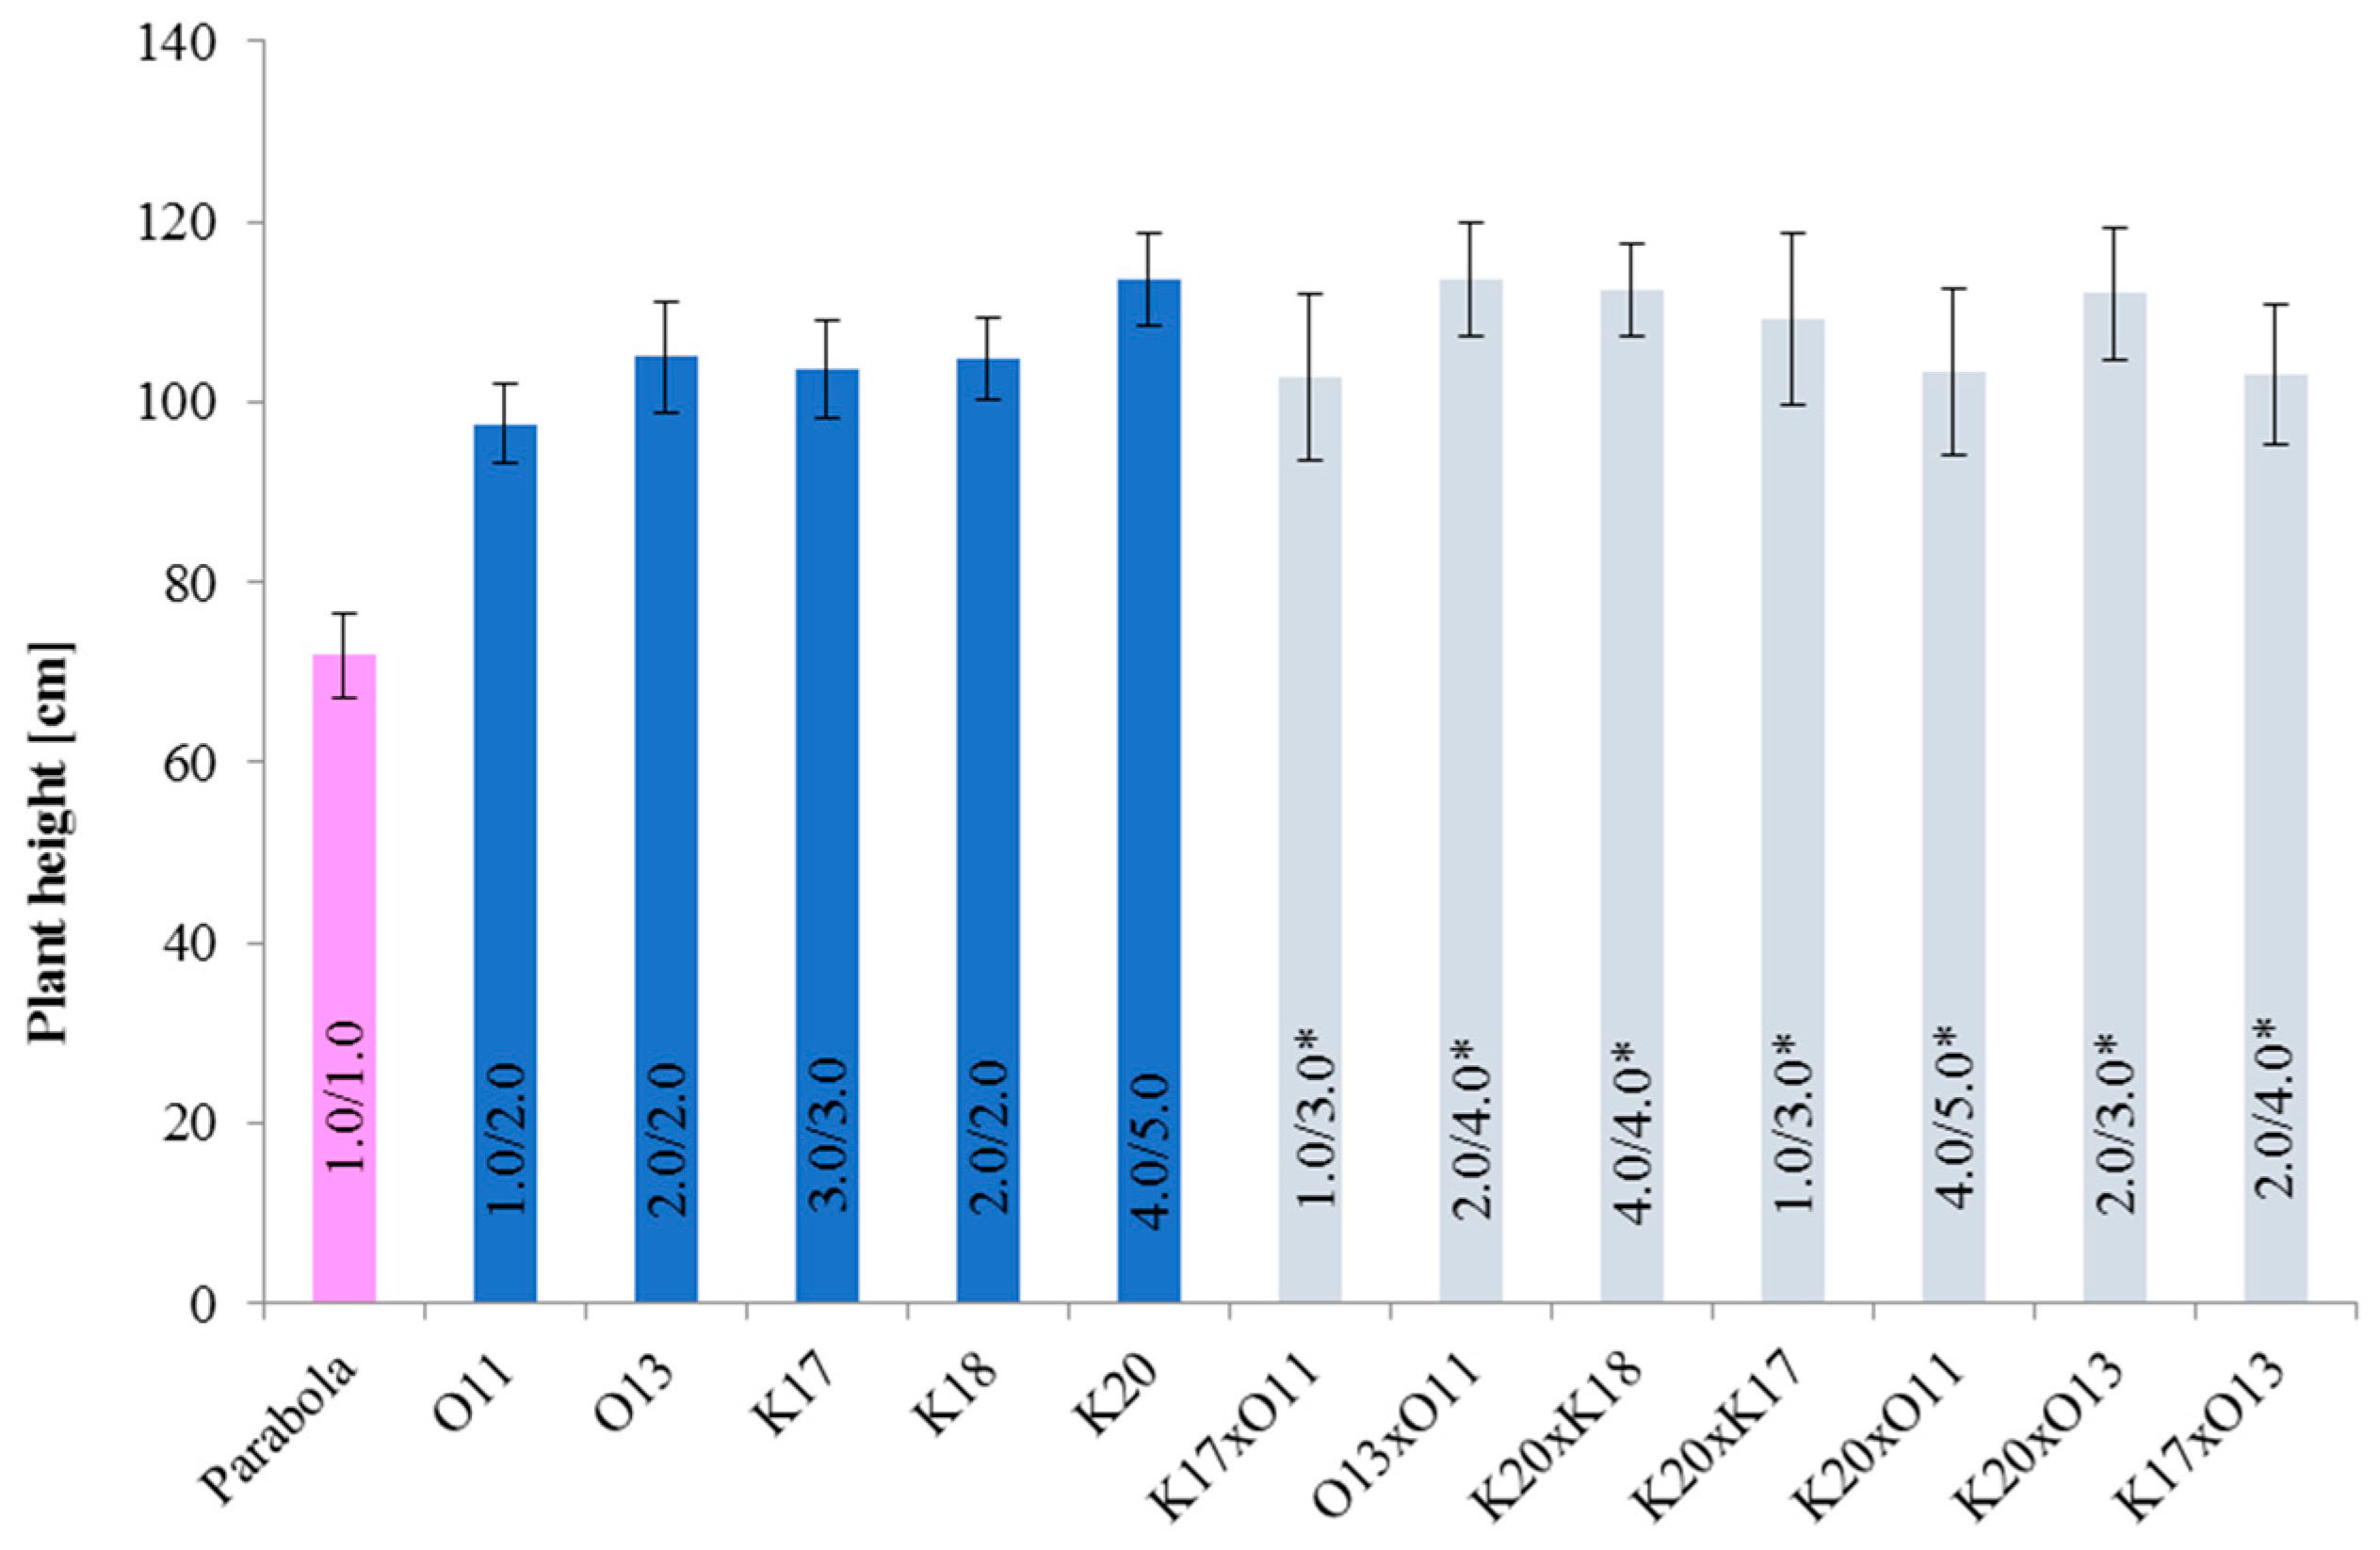
Plant height after heading did not differ considerably between parents. Awnless O11 spelt was characterized by the lowest average height and the lowest sensitivity to lodging. Moderate values of the above traits were noted in awned O13, K17, and K18 spelt. K20 spelt produced the tallest plants which were most sensitive to lodging. The evaluated breeding lines were divided into two height groups: Shorter plants—K17 × O11, K17 × O13, and K20 × O11, and taller plants—O13 × O11, K20 × K18, K20 × O13, and K20 × K17. Breeding lines K17 × O11, K20 × K17, and K20 × O13 were less sensitive to lodging (median value of 3.0 before harvest), whereas K20 × O11 was most sensitive to lodging (median value of 5.0 before harvest) (Figure 5). All types of breeding lines differed in their sensitivity to lodging.
The length of the top internode and the two lower internodes did not vary significantly in the analyzed 107 (Table 2) breeding lines, and it was determined at 56.1 cm in the 5th internode (CV = 6.6%), 23.1 cm in the 4th internode (CV = 8.6%), and 14.2 cm in the 3rd internode (CV = 9.2%). Greater variations were noted in the two lowest internodes at 9.9 cm in the 2nd internode (CV = 13.9%) and 4.4 cm in the 1st internode (CV = 23.5%). The position of the internodes relative to the ground was similar in breeding lines that were most sensitive to lodging: The 1st and 2nd internode were positioned at an acute angle, the 3rd and 4th internode were nearly perpendicular, whereas the top internode deviated from the vertical line in a different plane than the 1st and 2nd internode. In those breeding lines, the culm was also broken above the top node.

3.2.2. Grouping Spelt Breeding Lines and Parents by Cluster Analysis

The cluster analysis produced four groups of spelt breeding lines and their parents with similar values of the 11 analyzed traits: Plant height after heading (cm), spike length (cm), spike density, kernel weight (g), number of kernels, 1000-kernel weight (g), grain/spike weight ratio (%), protein content of kernels (% DM), fat content of kernels (% DM), ash content of kernels (% DM), and fiber content of kernels (% DM).
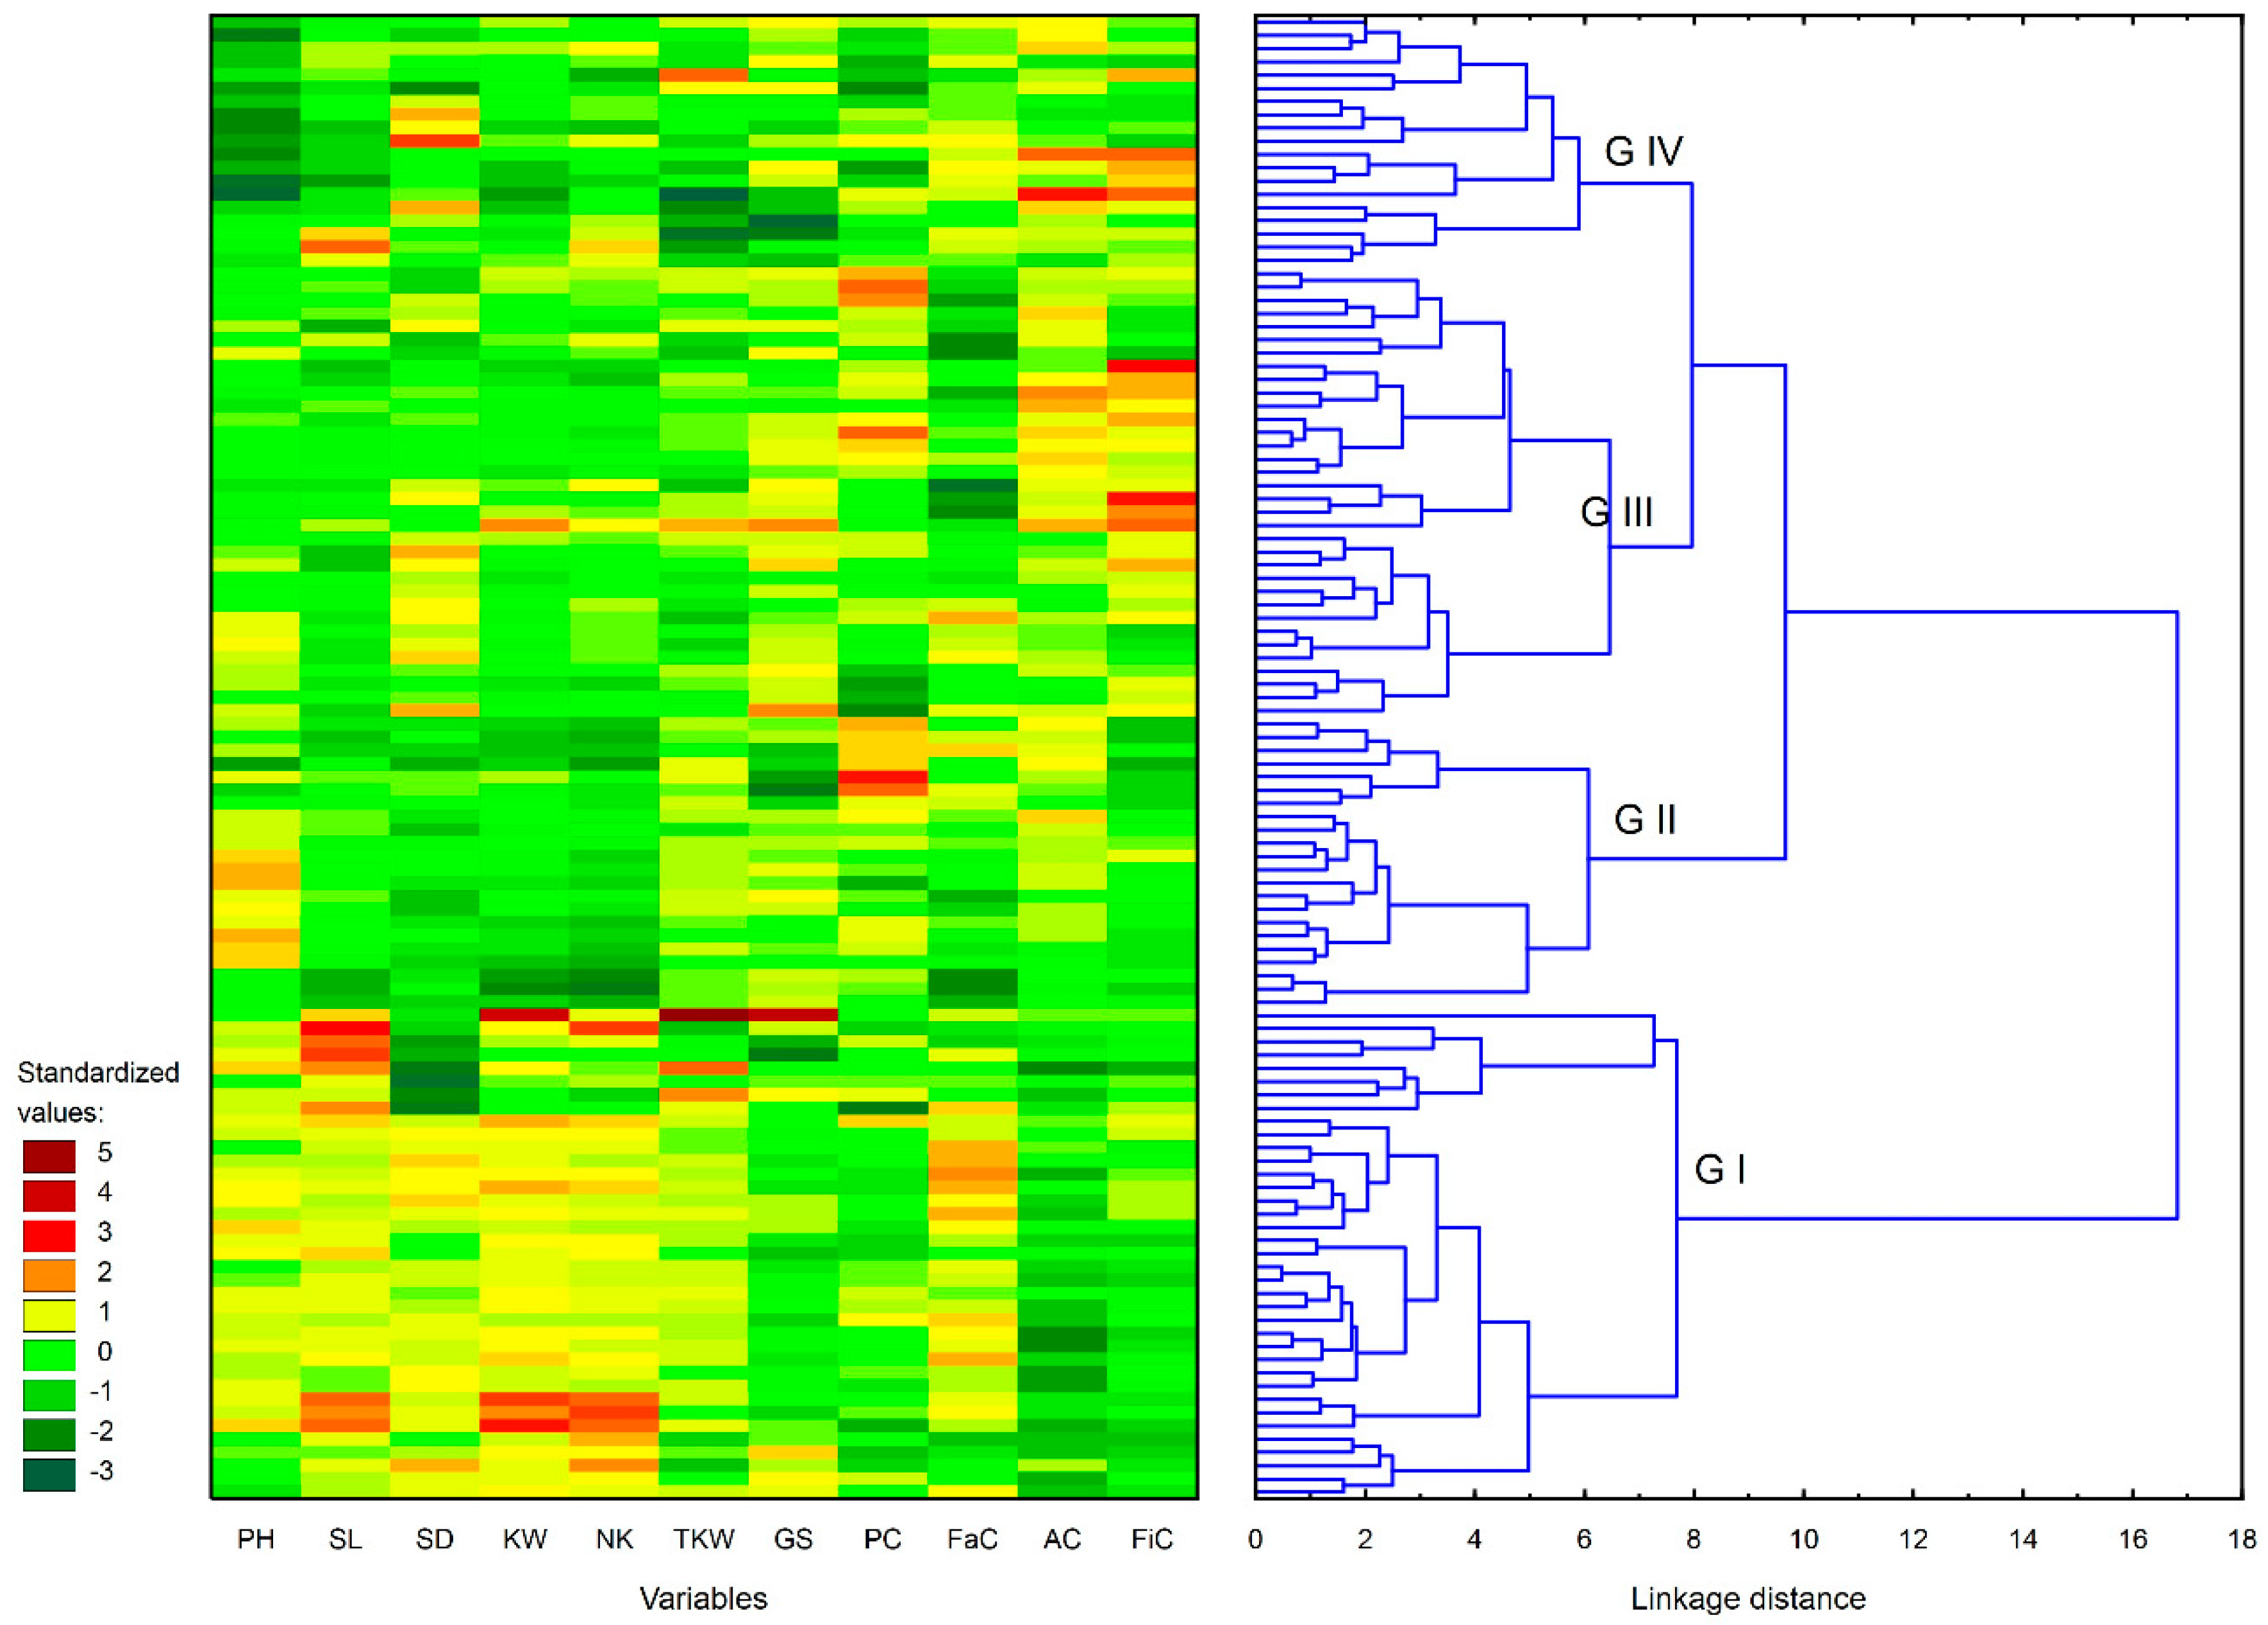
The values of the 11 analyzed traits in the four groups of breeding lines were presented graphically in a dendrogram and a heatmap with the use of the following colors: Green (low value), yellow (medium value), red (high value), as well as intermediate colors (Figure 6).
Group I was most distant from the remaining groups, and it consisted of 35 breeding lines and K18 and K20 parents, which accounted for 33% of the studied objects (Figure 6, Table 4). K20 was the maternal form in all group I breeding lines. Paternal forms were represented by K17 (34.3%), O11 (28.6%), K18 (20.0%), and O13 (17.1%). Group I was characterized by a significantly higher average plant height (111.5 vs. 106.1 cm; p < 0.001), spike length (12.8 vs. 11.4 cm; p < 0.001), kernel weight (1.56 vs. 1.30 g; p < 0.001), number of kernels (31.9 vs. 27.8; p < 0.001), 1000-kernel weight (48.9 vs. 46.8 g; p < 0.001), and significantly higher fat content (2.23 vs. 2.03% DM; p < 0.001) than the remaining breeding lines and parents (Table 5). In comparison with the remaining breeding lines, group I was characterized by significantly lower content of protein (16.60 vs. 17.03% DM; p = 0.033), ash (2.08 vs. 2.30% DM; p < 0.001), and fiber (1.97 vs. 2.17% DM; p = 0.001) (Table 5). Group I breeding lines were highly sensitive to lodging. The frequency of breeding lines most prone to lodging (4 and 5) was determined at 0.41 after heading and 0.68 before harvest. The median values of sensitivity to lodging on a 1–5 scale were determined at 3 after heading and 4 before harvest for group I and at 2 and 3, respectively, for the remaining breeding lines.
Group II consisted of 22 breeding lines where O13 was the dominant maternal form (68.2%) and O11 was the dominant paternal form (81.8%). Group II accounted for 19.6% of all studied objects (Figure 6, Table 4). The average plant height was similar to the group I breeding lines (111.5 cm), whereas significantly lower values were noted for spike length (11.4 vs. 12.8 cm; p < 0.001), spike density (12.6 vs. 13.2; p = 0.001), kernel weight (1.24 vs. 1.56 g; p < 0.001), number of kernels (25.7 vs. 31.9; p < 0.001), and fat content (1.99 vs. 2.23% DM; p < 0.001). The difference in fiber content (1.89 vs. 1.97% DM) was not statistically significant (p = 0.271). Group II breeding lines were characterized by the highest average protein content (17.52% DM) and had significantly higher ash content (2.27 vs. 2.08% DM; p < 0.001) than group I breeding lines (Table 5). Group II breeding lines were sensitive to lodging, and the median values of sensitivity to lodging after heading and before harvest were similar to those noted in group I at 3 and 4, respectively. The frequency of breeding lines most prone to lodging (4 and 5) was determined at 0.14 after heading and 0.73 before harvest.
Group III consisted of 32 breeding lines and two parents—O13 and K17, and it accounted for 30.4% of all studied objects (Figure 6, Table 4). The dominant maternal form was K17 (59.4%), and the dominant paternal form was O11 (96.9%). Group III breeding lines were significantly shorter than group I and group II breeding lines (107.9 cm; p = 0.001). They were characterized by a significantly higher spike density (13.3; p = 0.001), kernel weight (1.34 g; p = 0.001), number of kernels (28.6; p < 0.001), and a significantly higher average fiber content (2.32% DM; p < 0.001) in comparison with group II breeding lines. Ash content (2.32% DM) was similar to group II, and the difference was not statistically significant (p = 0.586) (Table 5). Group III breeding lines were less sensitive to lodging (median value of 2/3). The frequency of breeding lines least prone to lodging (1 and 2) was determined at 0.79 after heading and 0.44 before harvest.
Group IV consisted of 18 breeding lines and parental form O11, and it accounted for 17.0% of the studied objects (Figure 6, Table 4). The dominant maternal forms were K17 (44.4%) and K20 (55.6%), and the dominant paternal form was O11. Group IV breeding lines were characterized by the significantly lowest average plant height (96.5 cm; p < 0.001) and 1000-kernel weight (44.9 g; p < 0.001), and significantly lowest average protein content (16.40% DM; p = 0.004) relative to the remaining groups (Table 5). They resembled group III breeding lines in terms of sensitivity to lodging. The frequency of breeding lines least prone to lodging (1 and 2) was determined at 0.68 after heading and 0.32 before harvest. The median values of sensitivity to lodging were determined at 2 after heading and 3 before harvest.
The applied statistical method of grouping F5 breeding lines and their parents produced four groups with the following characteristics:
The dendrogram (Figure 6) clearly indicates that group I objects were most distant from the remaining groups. Based on the heatmap, the observed differences were attributed mainly to the values of yield component traits. Group III and IV breeding lines were most similar in yield component traits, and they were characterized by a high content of ash and fiber. Despite the presence of highly significant differences, the dendrogram indicates that group II objects were more similar to group III and IV objects than group I objects. Each of the four groups contained distinctive subgroups, which supports the selection of breeding lines with varied performance traits.

4. Discussion

The revived interest in spelt can be attributed to the high nutritional value of its grain, which is rich in protein, macronutrients and micronutrients [38,39,40,41,42,43,44,45], resistance to fungal pathogens [18,46,47,48,49,50,51], and higher adaptability to varied environments and simplified farming systems in comparison to bread wheat [52,53,54]. The milling quality of spelt grain has been recently investigated by Wiwart et al., Rapp et al., and Sobczyk et al. [44,45,55]. The suitability of ancient wheats, including spelt, for the production of functional foods has been discussed by Arzani and Ashraf [26].

4.1. Yield Components

Spelt grain yields are generally 37% lower than bread wheat yields [23]. Spelt grains are tightly enclosed by tough glumes and have to be dehulled before milling to separate the chaff from the grain. Spring cultivars of spelt (CDC Nexon, CDC Origin, CDC Zorba, CDC Silex) registered in 2002–2013 are grown in Canada [56]. The yield of spring spelt cultivars in Eastern Canada was analyzed by Dorval et al. [57]. The average yield of spring spelt spikelets/dehulled kernels in three locations was determined at 4052/2705 kg ha−1 (CDC Origin), 3850/2788 kg ha−1 (CDC Silex), 3705/2715 kg ha−1 (CDC Zorba), and 3200/2504 kg ha−1 (CDC Nexon). CDC Origin was characterized by the highest (34.5%–37.6%) percentage of hulls, and CDC Nexon by the lowest (24.0%–25.8%) percentage of hulls. In spring spelt cv. Wirtas, the percentage of hulls was determined at 25.2% [18].
Yield components (number of kernels, kernel weight, 1000-kernel weight) were most satisfactory in group I breeding lines where K20 was the maternal form. Group I breeding lines were characterized by long, loose, and awned spikes with weak or relatively strong anthocyanin pigmentation. Spike length, spike weight, number of kernels, kernel weight per spike, and 1000-kernel weight were highest in group I, but spike weight (2.11 vs. 2.63 g), kernel weight (1.56 vs. 2.10 g), and the number of kernels (31.9 vs. 41.7) in group I were lower than in bread wheat. In a study of 22 accessions of winter spelt, the average spike weight was determined at 1.75 g (1.1–2.5 g), kernel weight at 0.77 g (0.37–1.08 g), and the number of kernels per spike at 17.2 (10.5–22.7) [58]. In a study of 15 accessions of spring spelt, kernel weight per spike was determined at 1.02 ± 0.29 g, and the number of kernels per spike at 24.2 ± 6.1 [59]. The grain/spike weight ratio was lower in spelt breeding lines than in bread wheat, and it was characterized by a low variation. In the F5 breeding lines, the grain/spike weight ratio ranged from 65.9% to 74.5% with an average of 70.8%, and it was similar to that determined by other authors [18,57,58,59,60,61].

4.2. Chemical Composition of Grain

4.2.1. Protein Content

According to a review article by Escarnot et al. [62], spelt kernels have higher protein content than bread wheat kernels. The weighted average and the range of protein content values in bread wheat and spelt kernels were determined at 14.9% DM (10.9–17.5) and 15.6% DM (9.8–25.5), respectively. Considerable variations in the protein content of spelt and bread wheat kernels were reported by different authors. All analyses were performed using the Kjeldahl method, therefore, the observed variability could be attributed to differences in growing conditions (environment and nitrogen fertilization) and genotype. In a study of 1019 spelt genotypes from various geographic regions, the protein content of kernels exceeded 30% DM. The analyzed parameter was determined at 18.5%–21.8% DM in 20 genotypes with the highest Zn concentration, and it was highly stable in six tested environments [41]. The protein content of spring spelt cultivars grown in Eastern Canada ranged from 14.2% to 15.4% DM [36]. The protein content of spring spelt cv. Wirtas grown in Poland was determined at 13.9% DM in treatments with a low rate of nitrogen fertilizer (N50 kg) and 14.8% DM in treatments with a high rate of nitrogen fertilizer (N100 kg) [17]. The grain of 30 varieties and breeding lines of winter spelt contained 15.80% protein on average (13.92–18.54), and the heritability of this trait was determined at 0.67 [45]. The F5 breeding lines of spring spelt were characterized by high protein content at 16.9% DM on average (14.5%–19.4%). The average protein content of 19 varieties of spring bread wheat included in the Polish NLI was determined at 15.0% DM (13.7%–16.0%) [63]. In the current study, the highest average protein content of 17.5% DM was found in group II breeding lines. In groups I and II, protein content correlated with grain yield. In group I, higher grain yield correlated with lower protein content, whereas in group II, lower grain yield correlated with higher protein content. The protein content of bread wheat negatively correlated with grain yield, which was confirmed by the results of previous research summarized in a review article by Oury et al. [64]. The correlation coefficient between grain yield and protein content, calculated based on average values for varied environmental conditions, ranged from r = −0.37 to r = −0.94. Longin et al. [43] observed a significant negative correlation between grain yield and protein content in bread wheat, durum wheat, spelt, and emmer, where the corresponding values of the correlation coefficient were determined at: −0.87 (p < 0.001), −0.58 (p < 0.05), −0.83 (p < 0.01), and −0.71 (p < 0.01), respectively. Highly significant negative correlations between hulled yield and protein content (r = −0.60, p < 0.001) were observed in 30 contemporary varieties and breeding lines of winter spelt in six locations in Germany [45].

4.2.2. Fat Content

Grain is not a rich source of lipids which make up only around 3% of the kernel. Lipids are more concentrated in the germ and the aleurone than in the endosperm. Most studies of free lipids have shown that spelt is more abundant in fat than bread wheat [62]. The weighted average and the range of fat (free lipids) content values were determined at 2.1% DM (1.1%–3.7%) in bread wheat and 2.5% DM (1.4%–5.2%) in spelt. The grain of the F5 breeding lines differed in fat content. The average fat content and the range of fat content values were determined at 2.09% (1.48%–2.57%) in all breeding lines and at 1.52% DM in bread wheat cv. Parabola. The highest average fat content was noted in group I breeding lines (2.23% DM), whereas the average fat content of 19 spring wheat varieties included in the Polish NLI was higher at 2.70% DM (2.46%–2.89%) [63].

4.2.3. Ash Content

Ash content represents concentrations of minerals that determine the nutritional value of grain. According to numerous studies, spelt grain is a rich source of macronutrients and micronutrients [38,39,40,41,42,43,44,45]. The macronutrient and micronutrient content of four species of spring wheat (einkorn, emmer, spelt, and bread wheat) grown under the same conditions was analyzed by Suchowilska et al. [42]. The ash content of common wheat grain for baking white bread should not exceed 1.7%. Spring wheat grain is generally more abundant in ash than winter wheat grain, and spelt grain contains more ash than bread wheat grain [65,66]. The average ash content of grain was determined at 2.22% DM (1.93%–2.62%) in all breeding lines and at 2.12% in bread wheat cv. Parabola. Group I breeding lines were characterized by the lowest average ash content of 2.08% DM relative to the remaining groups (2.30% DM). The average ash content of spring and winter varieties of bread wheat in the Polish NLI was lower at 1.7% and 1.6% DM, respectively [63]. High ash content delivers health benefits, but it is also responsible for a darker color of flour and inferior technological properties [44].

4.2.4. Fiber Content

Whole wheat grain contains 11.5%–15.5% of total dietary fiber (TDF) on a dry matter basis, and major fiber components make up the cell wall. Crude fiber is a component of dietary fiber, and it contains cellulose, lignin, and hemicelluloses, as well as residues of acid and alkaline hydrolysis. According to Escarnot et al. [62], crude fiber levels are similar in bread wheat and spelt. The weighted average for the crude fiber content of bread wheat grain and spelt grain was determined at 2.4% DM. Shewry and Hey [67] reported higher content of dietary fiber (14.96% DM vs. 11.18% DM) and its fractions (insoluble fiber, soluble fiber, arabinoxylan, and β-glucan) in whole grains of bread wheat than in spelt grain. The average content of crude fiber was lower in F5 breeding lines (2.09% DM) than in bread wheat (2.35% DM). In groups III and IV, crude fiber content was similar to that noted in bread wheat, but in groups I and II, the analyzed parameter was lower than in bread wheat. The above trait was characterized by the highest variation (CV = 14.9%). Winter breeding lines of spelt had a higher average content of crude fiber, i.e., 3.3% DM on average [68].

4.3. Sensitivity to Lodging

Lodging is one of the main causes of annual fluctuations in spelt production. Old landraces and most commercial varieties of spelt are characterized by long and weak culms and, consequently, high risk of lodging [69]. Lodging in cereals crops is a serious problem in agricultural production because it lowers yields, deteriorates qualitative parameters, and obstructs mechanical harvesting [70,71]. Severe yield losses have been reported in different parts of the world due to wheat lodging: 0.73—8.3 t·ha−1 (UK), 1.7 t·ha−1 (Australia), 0.63—7.2 t·ha−1 (north-west Mexico), and 16% (Canada) [71]. In recent decades, the main aim of spelt breeding has been to decrease plant height and minimize lodging. The interest in spelt was revived in the 1970s and 1980s, mainly in Germany, Switzerland, and Belgium, by screening panels of landraces from different gene banks for their agronomic performance. In the above countries, breeding programs focused on the introgression of reduced plant height from different varieties of bread wheat. Bread wheat and spelt crosses were followed by successive backcrossing with different spelt landraces [46]. Oberkulmer Rotkorn, the German cultivar of winter spelt with culms longer than 140 cm, is the reference standard in analyses of sensitivity to lodging. In spelt and bread wheat, a strong positive correlation is noted between plant height and resistance to lodging (r = 0.65, p < 0.001). Despite the above, spelt plants should not be shorter than 100–120 cm [46]. In this study, all F5 breeding lines were prone to lodging. The breeding lines where the tall and high-yielding K20 spelt was the parental form, in particular K20 × O11 (average height of 104.6 cm), were most sensitive to lodging. K17 × O11 and O13 × O11 breeding lines (average height of 102.8 cm and 113.6 cm, respectively) were less prone to lodging. The analyzed breeding lines differed in height and sensitivity to lodging. In wheats, plant height is the most important, but not the only determinant of sensitivity to lodging. Plant height is most highly correlated with lodging, but other parameters have also been found to affect lodging, including the number, length, and thickness of internodes, as well as the stem weight, the anatomical, chemical, and mechanical properties of stems, and root parameters [70,71,72].

5. Conclusions

The applied grouping method supported the identification of four groups of breeding lines with similar yield components and chemical composition of grain. Group I was most distant from the remaining groups. It was composed of tall plants characterized by high values of yield components, high fat content, low fiber content, and high sensitivity to lodging. Groups III and IV were most similar in terms of spike length, spike density, kernel weight, number of kernels per spike, and the content of chemical components in grain, including ash and fiber. These breeding lines are characterized by shorter plants and lower sensitivity to lodging. Group IV comprised of the shortest plants, and it was most similar to group III in terms of yield components, the chemical composition of grain, and sensitivity to lodging. Each of the four groups contained distinctive subgroups, which supported the selection of breeding lines with varied performance traits (high yield components, high grain quality, and lower sensitivity to lodging).

Author Contributions

Conceptualization, D.P. and D.Z.; methodology, D.P. and D.Z.; formal analysis, D.P. and D.Z.; investigation, D.P., Ł.G., W.L. and D.Z.; writing—original draft preparation, D.P. and D.Z.; writing—revision and editing, D.P. and D.Z.; visualization, D.P. and D.Z; supervision, D.P.; project administration, D.P.; funding acquisition, D.P. and D.Z.

Acknowledgments

This paper describes the results of a study carried out by the Department of Plant Breeding and Seed Production of the University of Warmia and Mazury in Olsztyn (topic number 20.610.008–300). The authors would like to thank Elżbieta Suchowilska and Marian Wiwart for crossbreeding the specimens and providing F1 spelt crosses for this study.

Conflicts of Interest

The authors declare no conflicts of interest.

References

  1. Andrews, A.C. The genetic origin of spelt and related wheats. Züchter 1964, 34, 17–22. [Google Scholar] [CrossRef]
  2. Yan, Y.; Hsam, S.L.K.; Yu, J.Z.; Jiang, Y.; Ohtsuka, I.; Zeller, F.J. HMW and LMW glutenin alleles among putative tetraploid and hexaploid European spelt wheat (Triticum spelta L.) progenitors. Theor. Appl. Genet. 2003, 107, 1321–1330. [Google Scholar] [CrossRef]
  3. Nesbitt, M.; Samuel, D. From staple crop to extinction? The archaeology and history of the hulled wheats. In Hulled wheat. In Proceedings of the First International Workshop on Hulled Wheats, Castelvecchio Pascoli, Tuscany, 21–22 July 1995; Padulosi, S., Hammer, K., Heller, J., Eds.; IPGRI: Roma, Italy, 1995; pp. 41–101. [Google Scholar]
  4. Lobiz, R. Urgetreide—Mehr Schein als Sein. Ernährung Fokus 2018, 3, 114–119. [Google Scholar]
  5. Ackerbauflächen je Bundesland: Ernte 2018 (inkl. Bioflächen) 2017–2018: Dinkel. Available online: https://www.ama.at/ (accessed on 12 February 2019).
  6. Produktionsflächen/Surface de Production 2008–2018: Dinkel. Available online: https://www.swissgranum.ch/documens/ (accessed on 12 February 2019).
  7. Dedkova, O.S.; Badaeva, E.D.; Mitrofanova, O.P.; Zelenin, A.V.; Pukhalskiy, V.A. Analysis of intraspecific divergence of hexaploid wheat Triticum spelta L. by C-banding of chromosomes. Russ. J. Genet. 2004, 40, 1111–1126. [Google Scholar] [CrossRef]
  8. Elia, M.; Moralejo, M.; Rodriguez-Quijano, M.; Molina-Cano, J.L. Spanish spelt: A separate gene pool within the spelt germplasm. Plant Breed. 2004, 123, 297–299. [Google Scholar] [CrossRef]
  9. Guzman, C.; Caballero, L.; Martin, L.M.; Alvarez, J.B. Waxy genes from spelt wheat: New alleles for modern wheat breeding and new phylogenetic inferences about the origin of this species. Ann. Bot. Lond. 2012, 110, 1161–1171. [Google Scholar] [CrossRef]
  10. Beschreibende Sortenliste: Winterdinkel 2018. Available online: https://www.bundessortenamt.de (accessed on 12 February 2019).
  11. Österreichische Beschreibende Sortenliste: Winterdinkel 2018. Available online: https://bsl.baes.gv.at/pdf_version (accessed on 12 February 2019).
  12. Liste der Empfohlenen Getreidensorten für die Ernte 2019. Available online: https://www.swissgranum.ch/sortenlisten (accessed on 12 February 2019).
  13. GZPK Biodynamische Pflanzenzüchtung. Available online: https://www.gzpk.ch/kulturen/dinkel (accessed on 12 February 2019).
  14. European Union. Common Catalogue of Varieties of Agricultural Plant Species, 37th ed.; C 13; Official Journal of European Union: Brussels, Belgium, 2019. [Google Scholar]
  15. Okoń, S.; Paczos-Grzęda, E.; Kraska, P.; Kwiecińska-Poppe, E.; Pałys, E. Assessment of genetic similarity of spelt (Triticum aestivum ssp. spelta L.) cultivars based on RAPD markers. Biuletyn IHAR 2009, 252, 35–41. [Google Scholar]
  16. Gulyas, G.; Rakszegi, M.; Bognar, Z.; Lang, L.; Bedö, Z. Evaluation of genetic diversity of spelt breeding materials based on AFLP and quality analyses. Cereal Res. Commun. 2012, 40, 185–193. [Google Scholar] [CrossRef]
  17. Research Center for Cultivar Testing. Polish National List of Agricultural Plant Varieties; Research Center for Cultivar Testing: Słupia Wielka, Poland, 2015. [Google Scholar]
  18. Wiwart, M.; Suchowilska, E.; Packa, D.; Bieńkowska, T.; Rutkowska-Łoś, A. Registration of ‘Wirtas’, a new spring spelt cultivar in Poland. J. Plant Regist. 2016, 10, 271–275. [Google Scholar] [CrossRef]
  19. COBORU. Lista Opisowa Odmian Roślin Rolniczych Rośliny Zbożowe. (Descriptive List of Agricultural Plant Varieties. Cereal crops.); COBORU: Słupia Wielka, Poland, 2018. (in Polish) [Google Scholar]
  20. Research Center for Cultivar Testing. Polish National List of Agricultural Plant Varieties; Research Center for Cultivar Testing: Słupia Wielka, Poland, 2018. [Google Scholar]
  21. Polish National List of Agricultural Plant Varieties. Available online: http://www.coboru.pl/English/index_eng.aspx (accessed on 21 December 2018).
  22. Winzeler, H.; Schmidt, J.E.; Winzeler, M. Analysis of the yield potential and components of F1 and F2 hybrids of crosses between wheat (Triticum aestivum L.) and spelt (Triticum spelta L.). Euphytica 1993, 74, 211–218. [Google Scholar] [CrossRef]
  23. Schmidt, J.E.; Winzeler, M.; Winzeler, H. Analysis of disease resistance and quality characters of F1 hybrids of crosses between wheat (Triticum aestivum L.) and spelt (Triticum spelta L.). Euphytica 1994, 75, 105–110. [Google Scholar] [CrossRef]
  24. Zanetti, S.; Winzeler, M.; Keller, M.; Keller, B.; Messmer, M. Genetic analysis of pre-harvest sprouting resistance in wheat x spelt cross. Crop. Sci. 2000, 40, 1406–1417. [Google Scholar] [CrossRef]
  25. Wiwart, M.; Suchowilska, E.; Lajszner, W.; Graban, Ł. Identification of hybrids of spelt and wheat and their parental forms using shape and color descriptors. Comp. Electron. Agric. 2012, 83, 68–76. [Google Scholar] [CrossRef]
  26. Arzani, A.; Ashraf, M. Cultivated ancient wheats (Triticum spp.): A potential source of health-beneficial good products. Compr. Rev. Food Sci. Food Saf. 2017, 16, 477–488. [Google Scholar] [CrossRef]
  27. Acquaah, G. Breeding wheat. In Principles of Plant Genetics and Breeding, 2nd ed.; John Wiley & Sons, Ltd.: Hoboken, NJ, USA, 2007; pp. 577–590. [Google Scholar]
  28. NCPGR. Plant Breeding and Acclimatization Institute. Available online: http://genbank.ihar.edu.pl (accessed on 21 December 2018).
  29. EWDB. European Wheat Data Base. Available online: http://genbank.vurv.cz/ewdb (accessed on 21 December 2018).
  30. IPK. Leibniz-Institut. Available online: https://www.ipk-gatersleben.de/ (accessed on 21 December 2018).
  31. International Organization for Standardization. Cereals and Pulses. Determination of Nitrogen Content and Calculation of the Crude Protein Content. Kjeldahl Method; PN-EN ISO 20483:2014; International Organization for Standardization: Geneva, Switzerland, 2014. [Google Scholar]
  32. International Organization for Standardization. Oilseed Meals. Determination of Oil Content. Extraction Method with Hexane (or Light Petroleum); PN-EN ISO 734-1:2008; International Organization for Standardization: Geneva, Switzerland, 2008. [Google Scholar]
  33. International Organization for Standardization. Solid Fuels. Determination of Moisture Content, Volatile Parts and Ash with an Automatic Analyzer; PN-G-04560:1998; International Organization for Standardization: Geneva, Switzerland, 1998. [Google Scholar]
  34. Möller, J. Comparing Methods for Fibre Determination in Food and Feed. Available online: https://www.fossanalytics.com (accessed on 12 February 2019).
  35. Ward, J.H. Hierarchical grouping to optimize an objective function. J. Am. Stat. Assoc. 1963, 58, 236–244. [Google Scholar] [CrossRef]
  36. Stanisz, A. Cluster analysis. In Przystępny Kurs Statystyki z Zastosowaniem STATISTICA PL na Przykładach z Medycyny: Analizy Wielowymiarowe; StatSoft Polska: Kraków, Poland, 2007; Tom 3; pp. 113–164. (in Polish) [Google Scholar]
  37. TIBCO Software Inc. Statistica (Data Analysis Software System), Version 13. Available online: http://statistica.io (accessed on 21 December 2018).
  38. Abdel-Aal, E.S.M.; Hucl, P.; Sosulski, F.W. Compositional and nutritional characteristics of spring einkorn and spelt wheats. Cereal Chem. 1995, 72, 621–624. [Google Scholar]
  39. Grela, E.R. Nutrient composition and content of antinutritional factors in spelt (Triticum spelta L.) cultivars. J. Sci. Food Agric. 1996, 71, 399–404. [Google Scholar] [CrossRef]
  40. Piergiovanni, A.R.; Rizzi, R.; Pannacciulli, E.; Della Gatta, C. Mineral composition in hulled wheat grains: A comparison between emmer (Triticum dicoccon Schrank) and spelt (T. spelta L.) accessions. Int. J. Food Sci. Nutr. 1997, 48, 381–386. [Google Scholar] [CrossRef]
  41. Gomez-Becerra, H.F.; Erdem, H.; Yazici, A.; Tutus, Y.; Torun, B.; Ozturk, L.; Cakmak, I. Grain concentrations of protein and mineral nutrients in large collection of spelt wheat grown under different environments. J. Cereal Sci. 2010, 52, 342–349. [Google Scholar] [CrossRef]
  42. Suchowilska, E.; Wiwart, M.; Krska, R. A comparison of macro- and microelement concentrations in the grain of four Triticum species. Plant Soil Environ. 2012, 58, 141–147. [Google Scholar] [CrossRef]
  43. Longin, C.F.H.; Ziegler, J.; Schweiggert, R.; Koehler, P.; Carle, R.; Würschum, T. Comparative study of hulled (einkorn, emmer, and spelt) and naked wheats (durum and bread wheat): Agronomic performance and quality traits. Crop Sci. 2016, 56, 302–311. [Google Scholar] [CrossRef]
  44. Wiwart, M.; Szafrańska, A.; Wachowska, U.; Suchowilska, E. Quality parameters and rheological dough properties of fifteen spelt (Triticum spelta L.) varieties cultivated today. Cereal Chem. 2017, 94, 1037–1044. [Google Scholar]
  45. Rapp, M.; Beck, H.; Gütler, H.; Heilig, W.; Starck, N.; Römer, P.; Cuendet, C.; Uhlig, F.; Kurz, H.; Würschum, T.; et al. Spelt: Agronomy, quality, and flavor of its breads from 30 varieties tested across multiple environments. Crop Sci. 2017, 57, 739–747. [Google Scholar] [CrossRef]
  46. Longin, C.F.H.; Würschum, T. Genetic variability, heritability and correlation among agronomic and disease resistance traits in a diversity panel and elite breeding material of spelt wheat. Plant Breed. 2014, 133, 459–464. [Google Scholar] [CrossRef]
  47. Kema, G.H.J. Resistance in spelt wheat to yellow rust. Euphytica 1992, 63, 225–231. [Google Scholar]
  48. Sulewska, H.; Nita, Z.; Kruczek, A. Variability of grain quality characters among spelt wheat genotypes. Biuletyn IHAR 2005, 235, 65–74. [Google Scholar]
  49. Simon, M.R.; Khlestkina, E.K.; Castillo, N.S.; Börner, A. Mapping quantitative resistance to Septoria tritici blotch in spelt wheat. Eur. J. Plant Pathol. 2010, 128, 317–324. [Google Scholar] [CrossRef]
  50. Mohler, V.; Singh, D.; Singrün, C.; Park, R.F. Characterization and mapping of Lr65 in spelt wheat ‘Altgold Rotkorn’. Plant Breed. 2012, 131, 252–257. [Google Scholar] [CrossRef]
  51. Kolomiets, T.M.; Pankratova, L.F.; Pakholkova, T.M. Wheat (Triticum, L.) cultivars from GRIN collection (USA) selected for durable resistance Septoria tritici and Stagonospora nodorum Blotch. Sel’skokhozyaistvennaya Biol. Agric. Biol. 2017, 52, 561–569. [Google Scholar] [CrossRef]
  52. Rüegger, A.; Winzeler, H. Performance of spelt (Triticum spelta L.) and wheat (Triticum aestivum L.) at two different seeding rates and nitrogen levels under contrasting environmental conditions. J. Agron. Crop Sci. 1993, 170, 289–295. [Google Scholar] [CrossRef]
  53. Andruszczak, S.; Kwiecińska-Poppe, E.; Kraska, P.; Pałys, E. Yield of winter cultivars of spelt wheat (Triticum aestivum ssp. spelta L.) cultivated under diversified conditions of mineral fertilization and chemical protection. Acta Sci. Pol. Agric. 2011, 10, 5–14. [Google Scholar]
  54. Andruszczak, S. Reaction of winter spelt cultivars to reduced tillage system and chemical plant protection. Zemdirbyste 2017, 104, 15–22. [Google Scholar] [CrossRef]
  55. Sobczyk, A.; Pycia, K.; Stankowski, S.; Jaworska, G.; Kuźniar, P. Evaluation of rheological properties of dough and quality of bread made with the flour obtained from old cultivars and modern breeding lines of spelt (Triticum aestivum ssp. spelta). J. Cereal Sci. 2017, 77, 35–41. [Google Scholar] [CrossRef]
  56. Varieties of Crop Kinds Registered in Canada. Available online: http://www.inspection.gc.ca/active/netapp/regvar/regvar_lookupe.aspx (accessed on 21 December 2018).
  57. Dorval, I.; Vanasse, A.; Pageau, D.; Dion, Y. Seeding rate and cultivar effects on yield, yield components and grain quality of spring spelt in eastern Canada. Can. J. Plant Sci. 2015, 95, 841–849. [Google Scholar] [CrossRef] [Green Version]
  58. Sulewska, H. Characterization of 22 spelt (Triticum aestivum ssp. spelta) genotypes relating to some features. Biuletyn IHAR 2004, 231, 43–53. [Google Scholar]
  59. Konvalina, P.; Capouchová, I.; Stehno, Z.; Moudrý, J. Agronomic characteristics of the spring forms of the wheat landraces (einkorn, emmer, spelt, intermediate bread wheat) grown in organic farming. J. Agrobiol. 2010, 27, 9–17. [Google Scholar] [CrossRef] [Green Version]
  60. Lacko-Bartosova, M.; Korczyk-Szabo, J.; Razny, R. Triticum spelta—Specialty grain for ecological farming systems. Res. J. Agric. Sci. 2010, 42, 143–147. [Google Scholar]
  61. Packa, D.; Załuski, D.; Graban, Ł.; Lajszner, W.; Hościk, M. The response of diploid, tetraploid and hexaploid wheats to Fusarium culmorum (W.G. Smith) Sacc. inoculation. Pol. J. Agron. 2013, 12, 38–48. [Google Scholar]
  62. Escarnot, E.; Jacquemin, J.-M.; Agneessens, R.; Paquot, M. Comparative study of the content and profiles of macronutrients in spelt and wheat, a review. Biotechnol. Agron. Soc. 2012, 16, 243–256. [Google Scholar]
  63. Boros, D. The content of nutrients and bioactive components in the grain of common wheat varieties. AgroSerwis 2011, 5, 57–66. (in Polish). [Google Scholar]
  64. Oury, F.X.; Berard, P.; Brancourt-Hulmel, M.; Depatureaux, C.; Doussinault, G.; Galic, N.; Giraud, A.; Heumez, E.; Lecomte, C.; Pluchard, P.; et al. Yield and grain protein concentration in bread wheat: A review and a study of multi-annual data from a French breeding program. J. Genet. Breed. 2003, 57, 59–68. [Google Scholar]
  65. Capouchová, I. Technological quality of spelt (Triticum spelta L.) from ecological growing system. Sci. Agric. Bohemica 2001, 32, 307–322. [Google Scholar]
  66. Cacak-Pietrzak, G.; Gondek, E.; Jończyk, K. Comparison of internal structure and milling properties of spelt and bread wheat from ecological farming. Zeszyty Problemowe PNR 2013, 574, 3–10. [Google Scholar]
  67. Shewry, P.R.; Hey, S. Do “ancient” wheat species differ from modern bread wheat in their content of bioactive components? J. Cereal Sci. 2015, 65, 236–243. [Google Scholar] [CrossRef]
  68. Biel, W.; Stankowski, S.; Jaroszewska, A.; Pużyński, S.; Bośko, P. The influence of selected agronomic factors on the chemical composition of spelt wheat (Triticum aestivum ssp. spelta) grain. J. Integr. Agric. 2016, 15, 1763–1769. [Google Scholar] [CrossRef]
  69. Koutroubas, S.D.; Fotiadis, S.; Damalas, C.A. Biomas and nitrogen accumulation and translocationin spelt (Triticum spelta) grown in Mediterraneum area. Field Crop Res. 2012, 127, 1–8. [Google Scholar] [CrossRef]
  70. Berry, P.M.; Sterling, M.; Spink, J.H.; Baker, C.J.; Sylvester-Bradley, R.; Mooney, S.J.; Tams, A.R.; Ennos, A.R. Understanding and reducing lodging in cereals. Adv. Agron. 2004, 84, 217–271. [Google Scholar]
  71. Khobra, L.; Sereen, S.; Meena, B.K.; Kumar, A.; Tivari, V.; Singh, G.P. Exploring the traits for lodging tolerance in wheat genotypes: A review. Physiol. Mol. Biol. Plants 2019. [Google Scholar] [CrossRef]
  72. Packa, D.; Wiwart, M.; Suchowilska, E.; Bieńkowska, T. Morpho-anatomical traits of two lowest internodes related to lodging resistance in selected genotypes of Triticum. Int. Agrophys. 2015, 29, 475–483. [Google Scholar] [CrossRef]
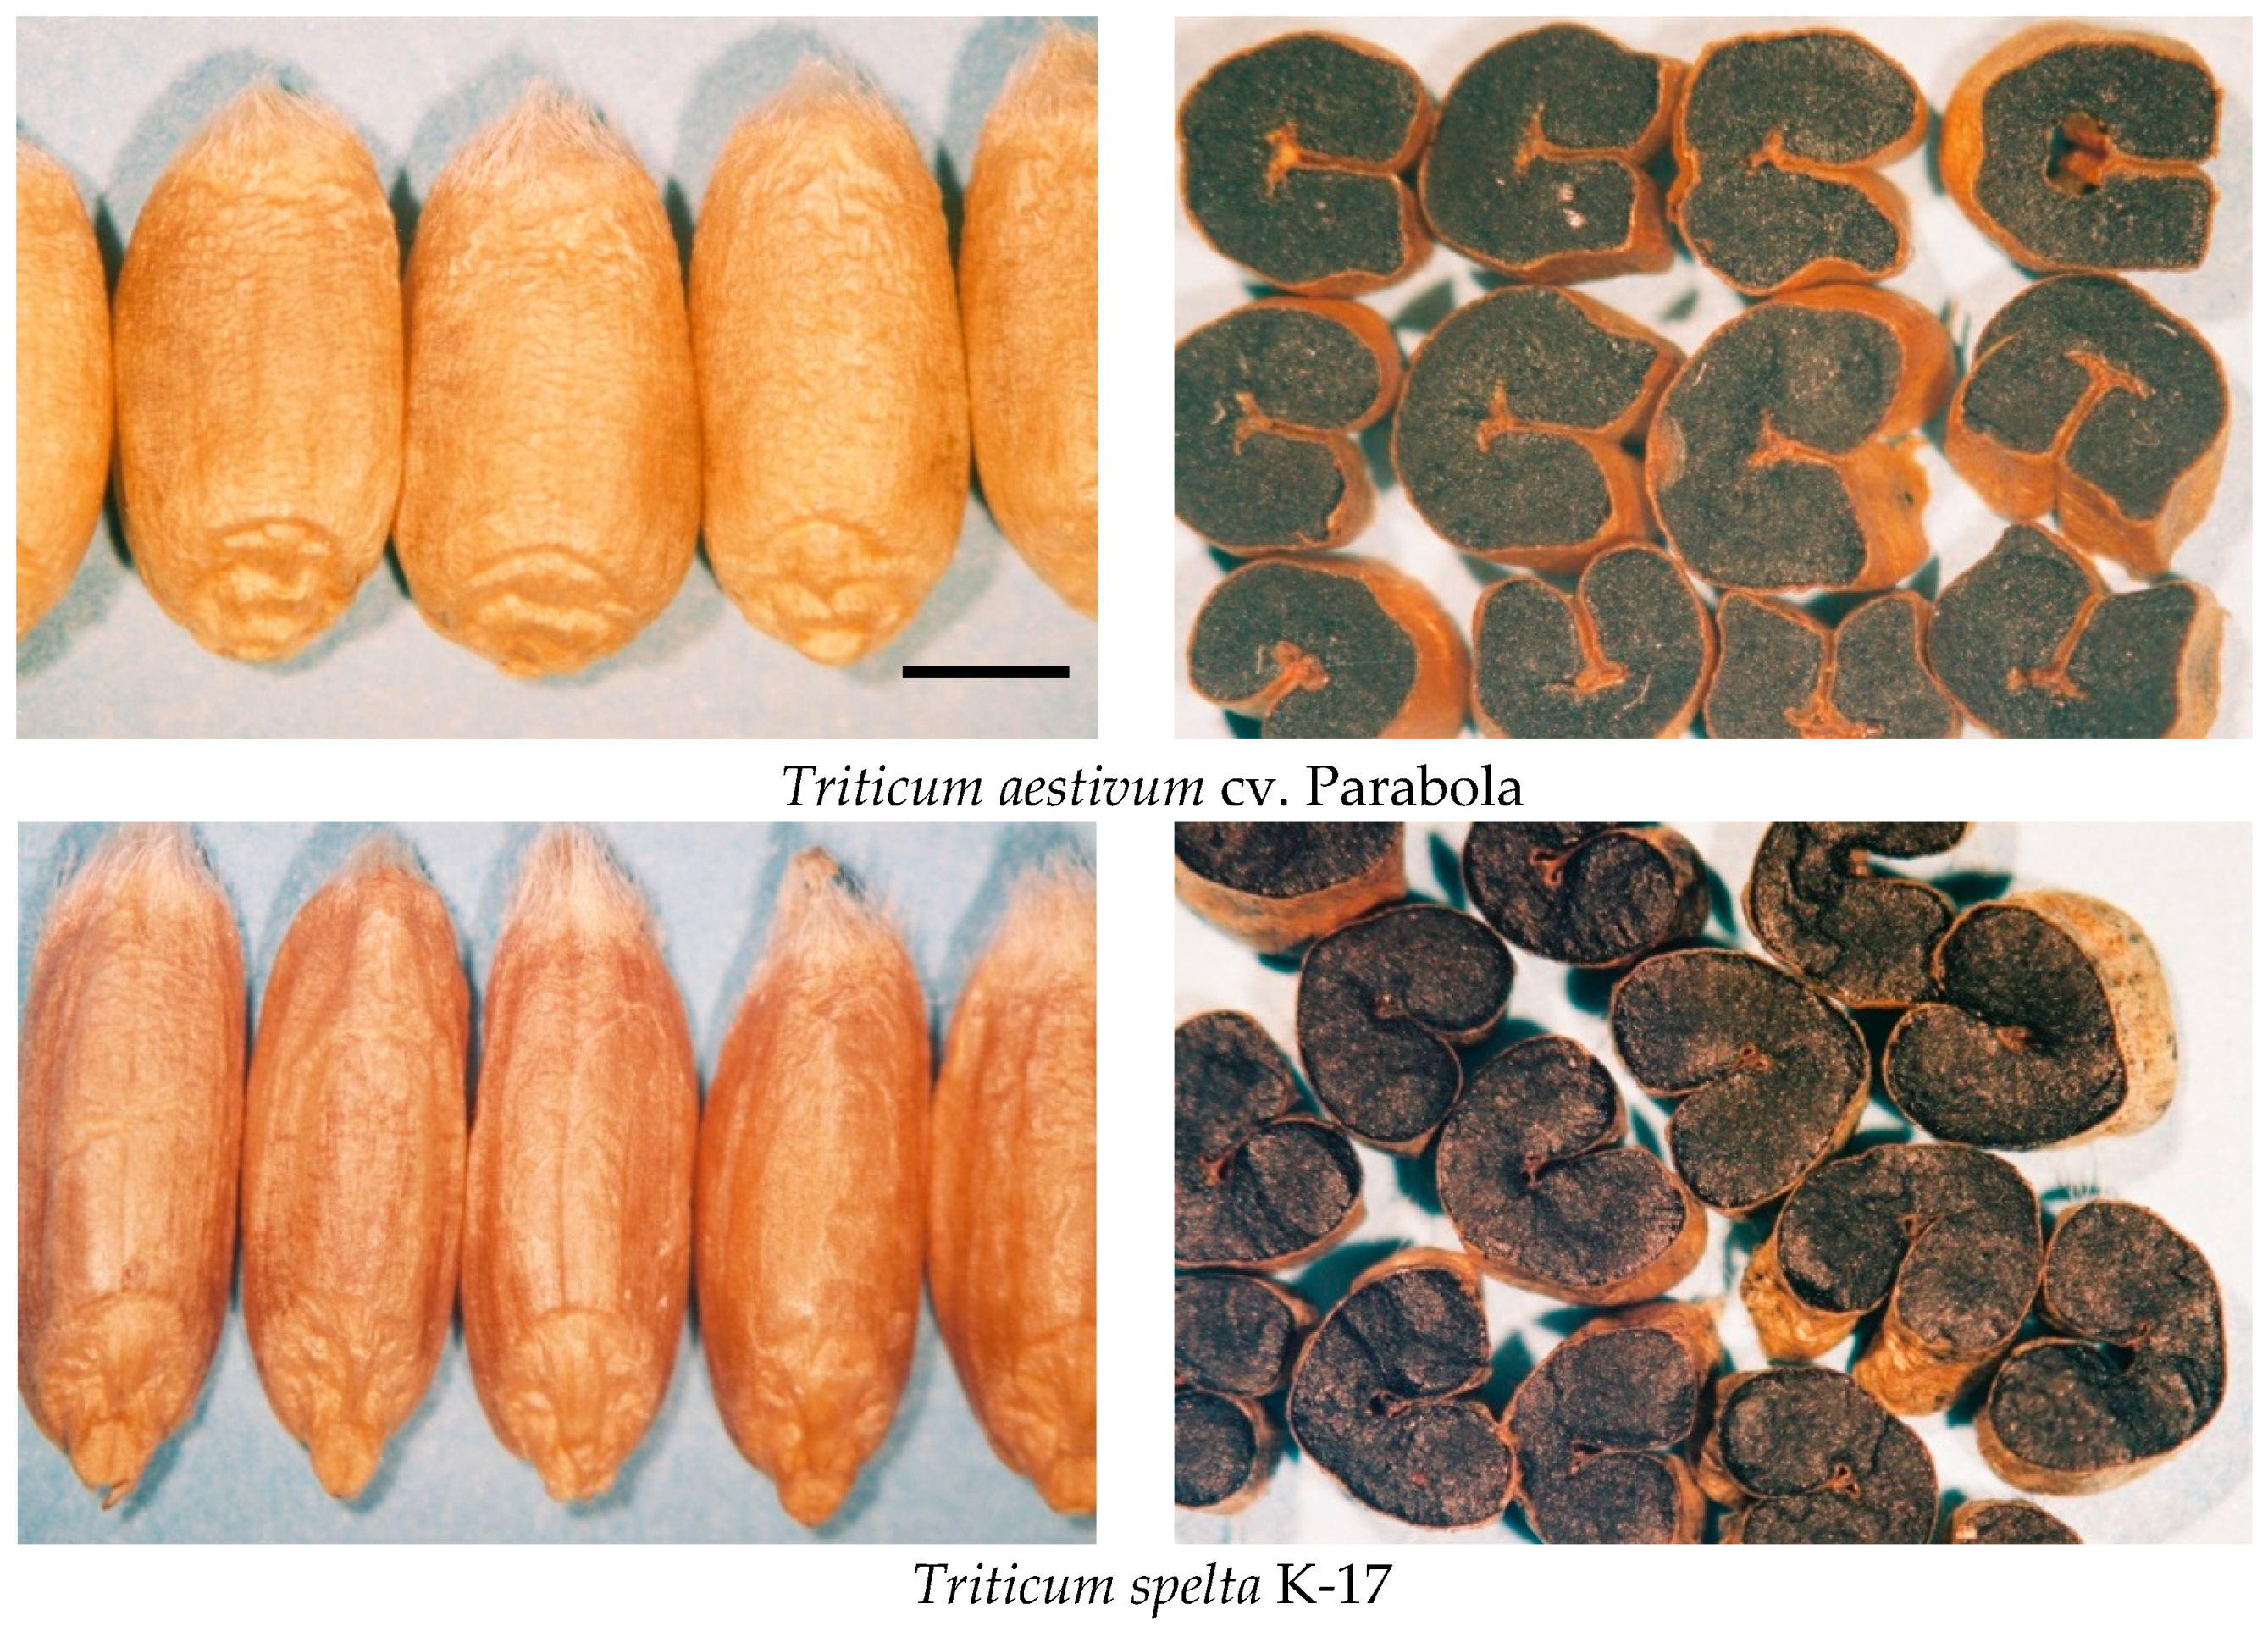
Figure 1. Kernels and kernel cross-sections of bread wheat (Triticum aestivum) cv. Parabola and K17 spelt (Triticum spelta) stained with Lugol’s iodine (scale bar = 2 mm).
Agronomy 09 00167 g001
Figure 2. Weather conditions during the growing season of spring spelt (F5 generation) and the long-term average (1981–2010). Agricultural Experiment Station in Bałcyny operated by the University of Warmia and Mazury in Olsztyn: (a) Average temperature (°C); and (b) total rainfall (mm).
Agronomy 09 00167 g002
Figure 3. Spikes of F2 spelt crosses (scale bar = 1 cm).
Agronomy 09 00167 g003
Figure 4. Average spike weight in all 172 F2 spelt crosses before and after selection and in 46 spelt crosses selected for further breeding (mean ± SD).
Agronomy 09 00167 g004
Figure 5. Plant height in parents, F5 breeding lines of spring spelt, and bread wheat cv. Parabola (mean ± SD) and their sensitivity to lodging on a 1–5 scale (after heading/before harvest) “*”—lodging sensitivity (after heading/before harvest) of seven groups of breeding lines was presented in terms of median values. K17 × O11 (n = 27), O13 × O11 (n = 26), K20 × K18 (n = 7), K20 × K17 (n = 13), K20 × O11 (n = 23), K20 × O13 (n = 8), and K17 × O13 (n = 3).
Agronomy 09 00167 g005
Figure 6. A heatmap and a dendrogram of F5 breeding lines of spring spelt and their parents. Heatmap color gradient: Green—low value, yellow—moderate value, red—high value, with intermediate colors. PH—plant height after heading, SL—spike length, SD—spike density, KW—kernel weight, NK—number of kernels, TKW—1000-kernel weight, GS—grain/spike weight ratio, PC —protein content, FaC—fat content, AC—ash content, FiC—fiber content, GI—group I, G II—group II, G III—group III, and G IV—group IV.
Agronomy 09 00167 g006
Table 1. Characteristics of the parents of Triticum spelta used for crossbreeding in 2007.
Parental FormsVarietyGene BankDesignation/Accession/EWDB NumberRegion of Origin
K17var. arduini (Mazz.) KoernNCPGR Radzików2-1257/PL 21981/EWDB 45624-
K18-IPK Gatersleben-/TRI 17506/EWDB 76243Spain
K20var. caeruleum (Alef.) KoernIPK GaterslebenSchwarzer Bartspelz/TRI 3419/EWDB 62904Germany
O11var. album (Alef.) KoernNCPGR RadzikówSpelz aus Tzari Brod/PL 21805/EWDB 53925-
O13var. arduini (Mazz.) KoernNCPGR RadzikówWeisser Grannen Spelz/PL 21806/EWDB 55245Germany
NCPGR—National Centre for Plant Genetic Resources, Polish Gene Bank, Plant Breeding and Acclimatization Institute—National Research Institute in Radzików http://genbank.ihar.edu.pl [28]; EWDB—European Wheat Database http://genbank.vurv.cz/ewdb [29]; IPK—Institut für Pflanzengenetik und Kulturpflanzenforschung https://www.ipk-gatersleben.de/ [30].
Table 2. Crossing scheme and selection of spring spelt.
YearsSelection CycleGeneration
2007Crossing of spring spelt: K17 × O11; O13 × O11; K20 × K18; K20 × K17; K20 × O11; K20 × O13; K17 × O13
2008FirstF1—collection of all spikes without selection
2009FirstF2—collection, evaluation, selection, and qualification of spelt crosses for further breeding: K17 × O11 14/6; O13 × O11 27/7; K20 × K18 29/8; K20 × K17 26/6; K20 × O11 37/7; K20 × O13 23/7; K17 × O13 16/5, in all 172/46
2011FirstF3—selection, evaluation, and qualification of individuals for further breeding (184)
2013FirstF4—field and laboratory evaluation and qualification for further breeding
2014SecondF3—selection, evaluation, and qualification of individuals for further breeding (from reserve) (80)
2015SecondF4—field and laboratory evaluation and qualification for further breeding
2016First and secondF5—field and laboratory evaluation of selected breeding lines (107) and their parents (5)
Table 3. Content of protein, fat, ash, and fiber (% dry matter) in the kernels of F2 spelt crosses, their parental forms (O11, O13, K17, K18, K20), and bread wheat cv. Parabola (A). The specimens were harvested in 2009.
Protein
(% DM)
Crude Fat
(% DM)
Ash
(% DM)
Crude Fiber
(% DM)
K17 × O11 (n = 14)1)
Mean ± SD16.81 ± 0.841.75 ± 0.152.32 ± 0.181.69 ± 0.21
Min./Max.15.77/18.611.51/1.951.51/1.951.48/2.20
CV (%)5.08.58.012.7
O13 × O11 (n = 27)
Mean ± SD16.29 ± 0.751.58 ± 0.222.17 ± 0.131.55 ± 0.24
Min./Max.14.93/17.851.08/2.051.94/2.421.24/2.09
CV (%)4.613.75.915.2
K20 × K18 (n = 29)
Mean ± SD15.48 ± 0.811.91 ± 0.202.04 ± 0.101.33 ± 0.26
Min./Max.14.08/17.381.53/2.281.80/2.250.77/1.82
CV (%)5.210.74.719.6
K20 × K17 (n = 26)
Mean ± SD16.36 ± 0.742.02 ± 0.242.13 ± 0.121.55 ± 0.23
Min./Max.15.20/18.001.67/2.471.89/2.381.11/1.81
CV (%)4.512.05.614.5
K20 × O11 (n = 37)
Mean ± SD16.03 ± 0.841.99 ± 0.202.01 ± 0.201.47 ± 0.19
Min./Max.14.56/17.701.66/2.491.66/2.531.12/1.91
CV (%)5.29.910.013.0
K20 × O13 (n = 23)
Mean ± SD15.79 ± 0.751.75 ± 0.182.14 ± 0.261.41 ± 0.19
Min./Max.14.80/17.371.20/2.181.79/2.801.12/1.79
CV (%)4.710.012.213.3
K17 × O13 (n = 16)
Mean ± SD16.97 ± 0.951.50 ± 0.222.19 ± 0.131.41 ± 0.19
Min./Max.15.66/18.641.04/1.732.04/2.451.13/1.66
CV (%)5.614.75.813.3
Parents (O11, O13, K17, K18, K20)
Mean ± SD17.20 ± 0.552.20 ± 0.272.32 ± 0.121.81 ± 0.14
Min./Max.16.23/17.931.72/2.562.17/2.521.62/2.07
CV (%)3.212.55.17.9
T. aestivum cv. Parabola
Mean14.351.652.102.29
K17 × O11 (n = 14)1)—(the number of spelt crosses variant is given in brackets).
Table 4. Characteristics of four identified groups after two-way joining analysis.
GroupnParentsCharacteristics
Group I35K18, K20tall plants with satisfactory yield components, lower content of protein, ash, and fiber relative to the remaining groups, high fat content, and high sensitivity to lodging
Group II22-tall plants with unsatisfactory yield components, higher content of protein and ash relative to the remaining groups, lower content of fiber and fat, and high sensitivity to lodging
Group III32O13, K17shorter plants with moderate yield components, high content of protein, ash, and fiber, low fat content, and moderate sensitivity to lodging
Group IV18O11shortest plants with moderate yield components, moderate content of fat, ash, and fiber, lower protein content relative to the remaining groups, and moderate sensitivity to lodging
Table 5. Mean values ± standard deviation (mean ± SD) and coefficients of variation (CV %) of the 11 analyzed traits in F5 breeding lines and their sensitivity to lodging (LO) evaluated in groups I-IV.
GroupPH
1
SL
2
SD
3
KW
4
NK
5
TKW
6
GS
7
PC
8
FaC
9
AC
10
FiC
11
LO
(1–5)
G I
CV (%)
111.5 ± 4.1
3.7
12.8 ± 0.6
4.9
13.2 ± 0.8
6.1
1.56 ± 0.12
7.9
31.9 ± 2.3
7.0
48.9 ± 3.3
6.8
70.5 ± 1.9
2.7
16.60 ± 0.77
4.6
2.23 ± 0.21
9.3
2.08 ± 0.09
4.4
1.97 ± 0.18
9.4
3/4
G II
CV (%)
111.5 ± 7.2
6.5
11.4 ± 0.5
4.4
12.6 ± 0.3
2.6
1.24 ± 0.09
7.6
25.7 ± 1.8
6.9
48.3 ± 1.2
2.5
70.7 ± 1.7
2.4
17.52 ± 0.94
5.3
1.99 ± 0.22
11.0
2.27 ± 0.08
3.6
1.89 ± 0.18
9.3
3/4
G III
CV (%)
107.9 ± 3.9
3.6
11.3 ± 0.4
3.9
13.3 ± 0.5
4.0
1.34 ± 0.09
7.0
28.6 ± 1.7
6.1
46.9 ± 2.1
4.5
71.9 ± 1.2
1.7
17.07 ± 1.01
5.9
1.96 ± 0.23
11.9
2.32 ± 0.09
3.9
2.32 ± 0.32
13.8
2/3
G IV
CV (%)
96.8 ± 5.3
5.5
11.6 ± 0.9
7.6
13.2 ± 0.7
5.3
1.30 ± 0.11
8.2
29.0 ± 2.5
8.5
44.9 ± 3.8
8.5
70.2 ± 2.1
3.0
16.40 ± 0.90
5.5
2.19 ± 0.14
6.2
2.30 ± 0.15
6.4
2.23 ± 0.32
14.6
2/3
G II-IV
CV (%)
106.1 ± 7.8
7.3
11.4 ± 0.6
5.2
13.1 ± 0.6
4.6
1.30 ± 0.10
8.0
27.8 ± 2.4
8.5
46.8 ± 2.7
5.9
71.1 ± 1.8
2.5
17.03 ± 1.03
6.1
2.03 ± 0.23
11.2
2.30 ± 0.11
4.6
2.17 ± 0.34
15.6
2/3
T. aestivum Parabola71.98.817.22.1041.750.079.315.291.522.122.351/1
PH—plant height after heading (cm), SL—spike length (cm), SD—spike density, KW—kernel weight (g), NK—number of kernels, TKW—1000-kernel weight (g), GS—grain/spike weight ratio (%), PC—protein content (% DM), FaC—fat content (% DM), AC—ash content (% DM), FiC—fiber content (% DM), LO 1–5 scale (after heading/before harvest)—sensitivity to lodging of breeding lines in each group was presented in terms of median values.