Article

Effect of Water Supply on Spectral Traits and Their Relationship with the Productivity of Sweet Corns

1
Institute of Horticulture, Szent István University, Gödöllő, H-2100 Gödöllő, Hungary
2
Institute of Agricultural Research and Education Farm, Agrometeorological and Agroecological Monitoring Centre, University of Debrecen, H-4032 Debrecen, Hungary
*
Author to whom correspondence should be addressed.
Agronomy 2019, 9(2), 63; https://doi.org/10.3390/agronomy9020063
Submission received: 18 December 2018 / Revised: 14 January 2019 / Accepted: 29 January 2019 / Published: 31 January 2019
(This article belongs to the Special Issue Agricultural Water Management)

Abstract

:
Three super-sweet corn hybrids (Zea mays L. convar. saccharata) with different ripening characteristics were grown in three water supplies (regularly irrigated, deficit-irrigated, and unirrigated) to examine the spectral reflectance at leaf and canopy levels, leaf area index (LAI) during the stage of development and their relationship with the yield and nutritional quality. Under unirrigated conditions, the plant’s height, diameter, and weight of ears per plants, as well as total carotenoid content of kernels, decreased, SPAD values of leaves, normalized vegetation differential index (NDVI) and LAI were low. The difference in SPAD and LAI was higher between the hybrids during the silking than the tasseling period under water deficiency. Under unirrigated dry conditions, no correlation was found between SPAD, NDVI, and yield. Using deficit irrigation, SPAD measured during tasseling correlated closely with the individual husked ear and the final yields as well as the sugar and carotene contents of kernels. Under this condition, NDVI did not correlate with the yield, but LAI was correlated with the yield and its carotene content. Under deficit irrigated conditions, the 46 to 49 range of SPAD measured during tasseling predicted 23.5 to 26.7 t ha−1 depending on the hybrid, but this range predicted a yield lower by 6.4 to 10.1% during silking.

1. Introduction

The irregular distribution of precipitation ascribed to climate change influences sweet corn production. This results in the need for irrigation. The water demands of corn plants differ depending on their stages of development. During the early stage of development of maize, water scarcity does not decrease the yield [1], but the plants require the most water (80–100 mm) from the tasseling to grain filling periods. The amount of precipitation has a significant influence on the yield [2]. Ear differentiation begins at the six and eight leaf stages of development of sweet corn. A water deficit at this stage results in a reduction in ear length and the number of kernel rows [3]. During tasseling, water deficiency can decrease the yield by 40 to 50% [4]. However, the length of the anthesis-silking interval also has a great effect on the grain yield under drought stress [5]. Traditional sweet corn comprising homozygous gene (sh1) has higher sugar content in the endosperm of the kernel than that of normal field corn. Nevertheless, the kernel quality of these sweet corn varieties declines rapidly after harvest due to the conversion of sugars into starch and moisture loss [6]. The super-sweet varieties (sh2) contain two to three times more sucrose concentration in the fresh kernel and retain higher sugar and moisture concentrations for longer postharvest periods than the traditional sweet corn variety (sh1) [7]. However, these are sensitive to the temperature and water content of the soil that can result in low field emergence and seedling vigour [8].
Precision agriculture requires the use of non-destructive, cost-efficient methods that help farmers to make rapid management decisions, including irrigation for a large yield [9]. Recently, the spread of remote sensing techniques has made it possible to assess the water status of plants during their growth [10]. The leaf photosynthetic capacity of the varieties can be monitored by measuring chlorophyll content and net photosynthetic rate under different environmental and stress conditions [11]. Photosynthetic pigments in the leaves absorb red and blue light in the visible waveband when the reflectance is minimal. As a result of stress factors, the chlorophyll content of leaves changes; therefore, the light absorption of the leaf decreases [12] which results in an increase in light reflectance and a decrease in the photosynthetic activity [13] that finally leads to yield decrease. A portable chlorophyll meter measures the light absorbance or reflectance given by SPAD values (relative chlorophyll content) on the leaf which is used to measure the greenness degree of leaf [14] and detect the drought tolerance of some species [15,16,17].
The degree of spectral reflectance on photosynthetic crop canopy has been detected by vegetation indices using remote sensing techniques. The normalized difference vegetation index (NDVI) is one of the most frequently used vegetative indices for the monitoring of vegetation. NDVI is suited to monitoring plant growth [18] and to detect the presence of abiotic stress [19,20], and it could be used for the selection of genotypes with drought tolerance [21]. A positive correlation was found between the NDVI and the chlorophyll concentration of turf grass [22] and the leaf area index (LAI) of bean [23]. However, the trend of the relationship between NDVI and LAI was determined by water supply conditions [24]. The measurement of SPAD is considered suitable for predicting the expected yield of some plant species, such as maize and rice [25,26], while the relationship between the spectral vegetation index NDVI and yield can be the basis of yield prediction for wheat [27] or beans [24].
The improvement of drought tolerance is an objective for most plant species. The changes in physiological processes through the responses to drought stress can be tracked by the use of remote sensing methods. Understanding their relationship to yield would be advantageous for early selection among genotypes. Changes in the pigment concentration of plants using spectral reflectance measurements have been studied under different degrees of environmental stress. However, their effects on yield and suitability for yield prediction of sweet corn have not been investigated yet.
The objective of this study was to evaluate the change in spectral reflectance at leaf and canopy level in the stages of development of sweet corn and to reveal their relationship to yield and nutritional quality under dry conditions. In addition, the objective was to determine the appropriate stage of development for the prediction of yield.

2. Materials and Methods

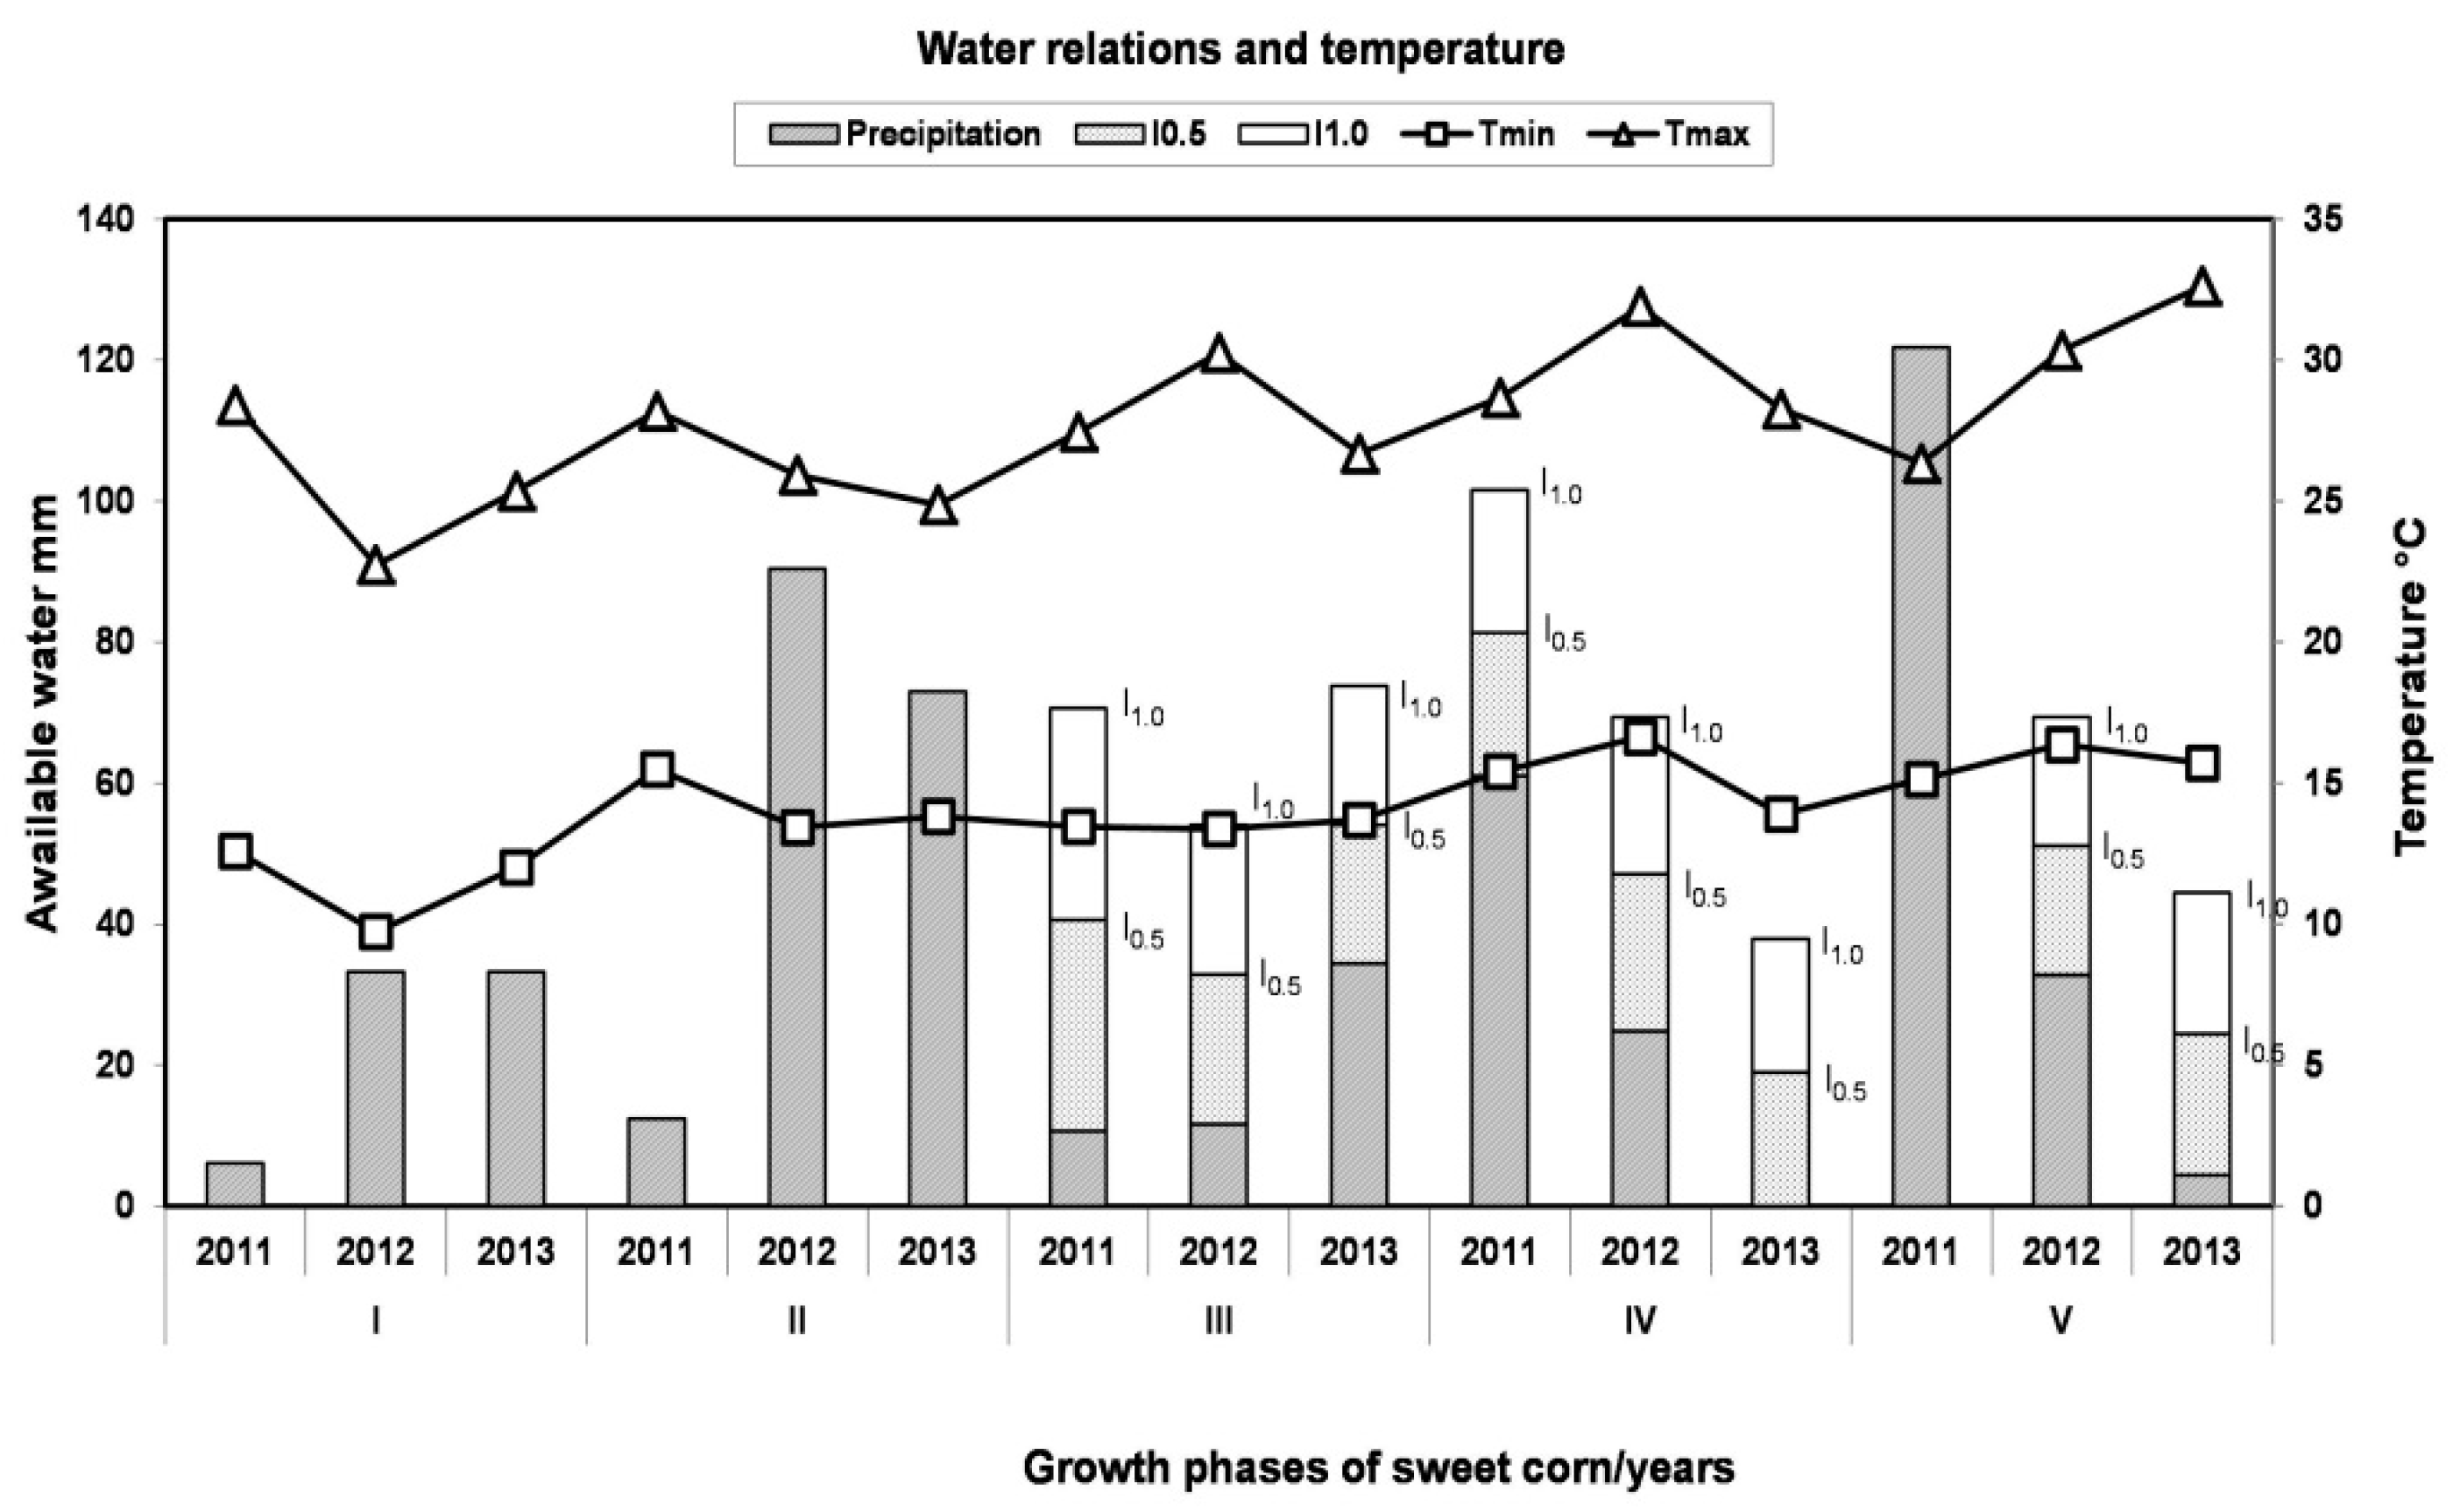
2.1. Experimental Conditions

From 2011 to 2013, the productivity and yield quality of three super-sweet corn hybrids were examined under different water supply conditions in field experiments. The experiments were conducted on sandy loam soil at the Experimental Station of Centre of Agricultural Sciences, the University of Debrecen, Hungary. The super-sweet corn used in the experiments had different ripening times; the GSS 1477 hybrid was middle–early-ripening (74 days), Overland (84 days), and GSS 2259 (87days) represented middle–late and late-ripening hybrids, respectively. The sowing of the hybrids was carried out in two factorial experiments where the main factor was the water supply and the sweet corn hybrids were the second. Each hybrid was arranged in randomized complete block designs with three repetitions. The size of single plots was 8.4 m2 with 60 plant density. The plots comprised four rows each, 3 m long and 2.8 m wide, where the row spacing was 70 cm, and the plant spacing was 20 cm.
Three water supplies were used: I1.0 represented the optimum water supply plots where the loss of evapotranspiration (ET 100%) was replenished, I0.5 treatment where water deficit irrigation was used (i.e., irrigation 50% of I1.0). In unirrigated plots (I0), the plants were grown under rain-fed conditions. The loss of evapotranspiration was determined by the daily weather data from a weather station near the experiments using the method described by Shuttleworth and Wallace [28]. The calculation of the required irrigation water was carried out on the basis of actual evapotranspiration, as described by Allen et al. [29]. Drip irrigation was applied. When the plant produced 6 or 8 leaves, then 10 plants were selected and tagged to measure the SPAD in each plot.

2.2. Measurement of Traits

Measurement on the leaf of selected plants was carried out by SPAD-502 (Minolta UK) portable chlorophyll meter. This equipment measures the ration of the light absorbance in the red and near-infrared region and the given SPAD value. The measurements were taken on both sides of the midrib on the upper third part of the developed leaf for each selected. This means 60 measurements on 10 plants per each plot. The measurements were performed between 10:00 and 14:00 hours at three times; at the 8-leaf stage (ST1), during tasseling (ST2), and during 50% of silking (ST3) in 2012 and 2013.
The green canopy of plants absorbs the large part of the incident visible light and reflects those in the near infrared region. Normalized difference vegetation index (NDVI) expresses the ratio of reflectance of active photosynthetic radiation in visible and near infrared regions of the spectrum [30]. NDVI was measured by GreenSeeker 505 (Hand-Held, Manuel NTech Industries Inc., Ukiah, CA, USA) portable model equipment. This measures the reflected light on the canopy crops at 660 nm (red) and 770 nm (near-infrared) bands. Ten measurements were carried out covering approx. 0.8 m2 in each plot (average of approx. 15–20 samples each) and these were performed between 10:00 and 14:00 hours. The measurements of NDVI were performed at the same stage of development as described for that of SPAD from 2011 to 2013.
The leaf area index (LAI) expresses the growth intensity of crop canopy. The measurements of LAI were performed by a LAI-2000 Plant Canopy Analyzer (LI-COR Inc., Lincoln, Nebraska, USA), and their date was the same as that of NDVI.

2.3. Measurement of Yield

In each plot, the height of 10 selected plants was measured then they were harvested individually. The ears of these plants were classified into two groups: I, the marketable group comprised well-developed and healthy ears with filled kernels along the rows and II, the non-marketable group involved short, abnormal formed ears with unfilled kernels of rows. The ears without husk of marketable group (I) were further evaluated, i.e., the weight, length, and diameter of the ears were measured. The number of rows per ear and number of kernels per row were also counted. Other plants of the plots were harvested and separated to ears and green biomass and weighed.

2.4. Chemical Analysis

Dry matter content of the kernels was determined as described by Shreve et al. [31] and expressed by percentage to fresh weight. The sugar content of kernels was determined by the Luff–Schoorl method [32] given in terms of fresh weight %. The total carotenoids content of the sample was determined with chromatography and was given mg kg−1 as described by Nemeskéri [33].

2.5. Statistical Analysis

Data were evaluated with two-way analysis of variance (ANOVA) (water supply × variety) using SPSS 20.0 for Windows (IBM, Armok, New York, USA). The means of each treatment were compared by Duncan’s Multiple Range Test at p < 0.05 level. Regression analysis was carried out to reveal the relationships among the SPAD, NDVI, LAI, and yield components and nutritional quality of kernel, respectively. Linear, logarithmic, hyperbolic, power, and exponential regression analysis were carried out. The most appropriate regression equation based on the highest correlation coefficient (r) and significant p level was interpreted.

3. Results

The weather was wetter during the year 2011 than in 2012, when 211.9 mm and 182.8 mm of precipitation fell, but precipitation was low (145 mm) in 2013. The available water proved to be different in each stage of development depending on crop years. The ratio of irrigation water was as follows: 2011—I1.0: 32%, I0.5: 16%, 2012—I1.0 40%, I0.5: 20%, 2013—I1.0: 45%, I0.5: 22% of the total available water. During tasseling, precipitation was less in 2012 in comparison with that of 2011 and 2013. Nevertheless, during the silking and grain filling periods, it was satisfactory for the plants in 2011. There was moderate water deficiency (69 mm) in 2012 and severely deficiency (38–45 mm) during the silking period in 2013 (Figure 1). These water relations affected the physiological processes working in the leaf and crop canopy level.

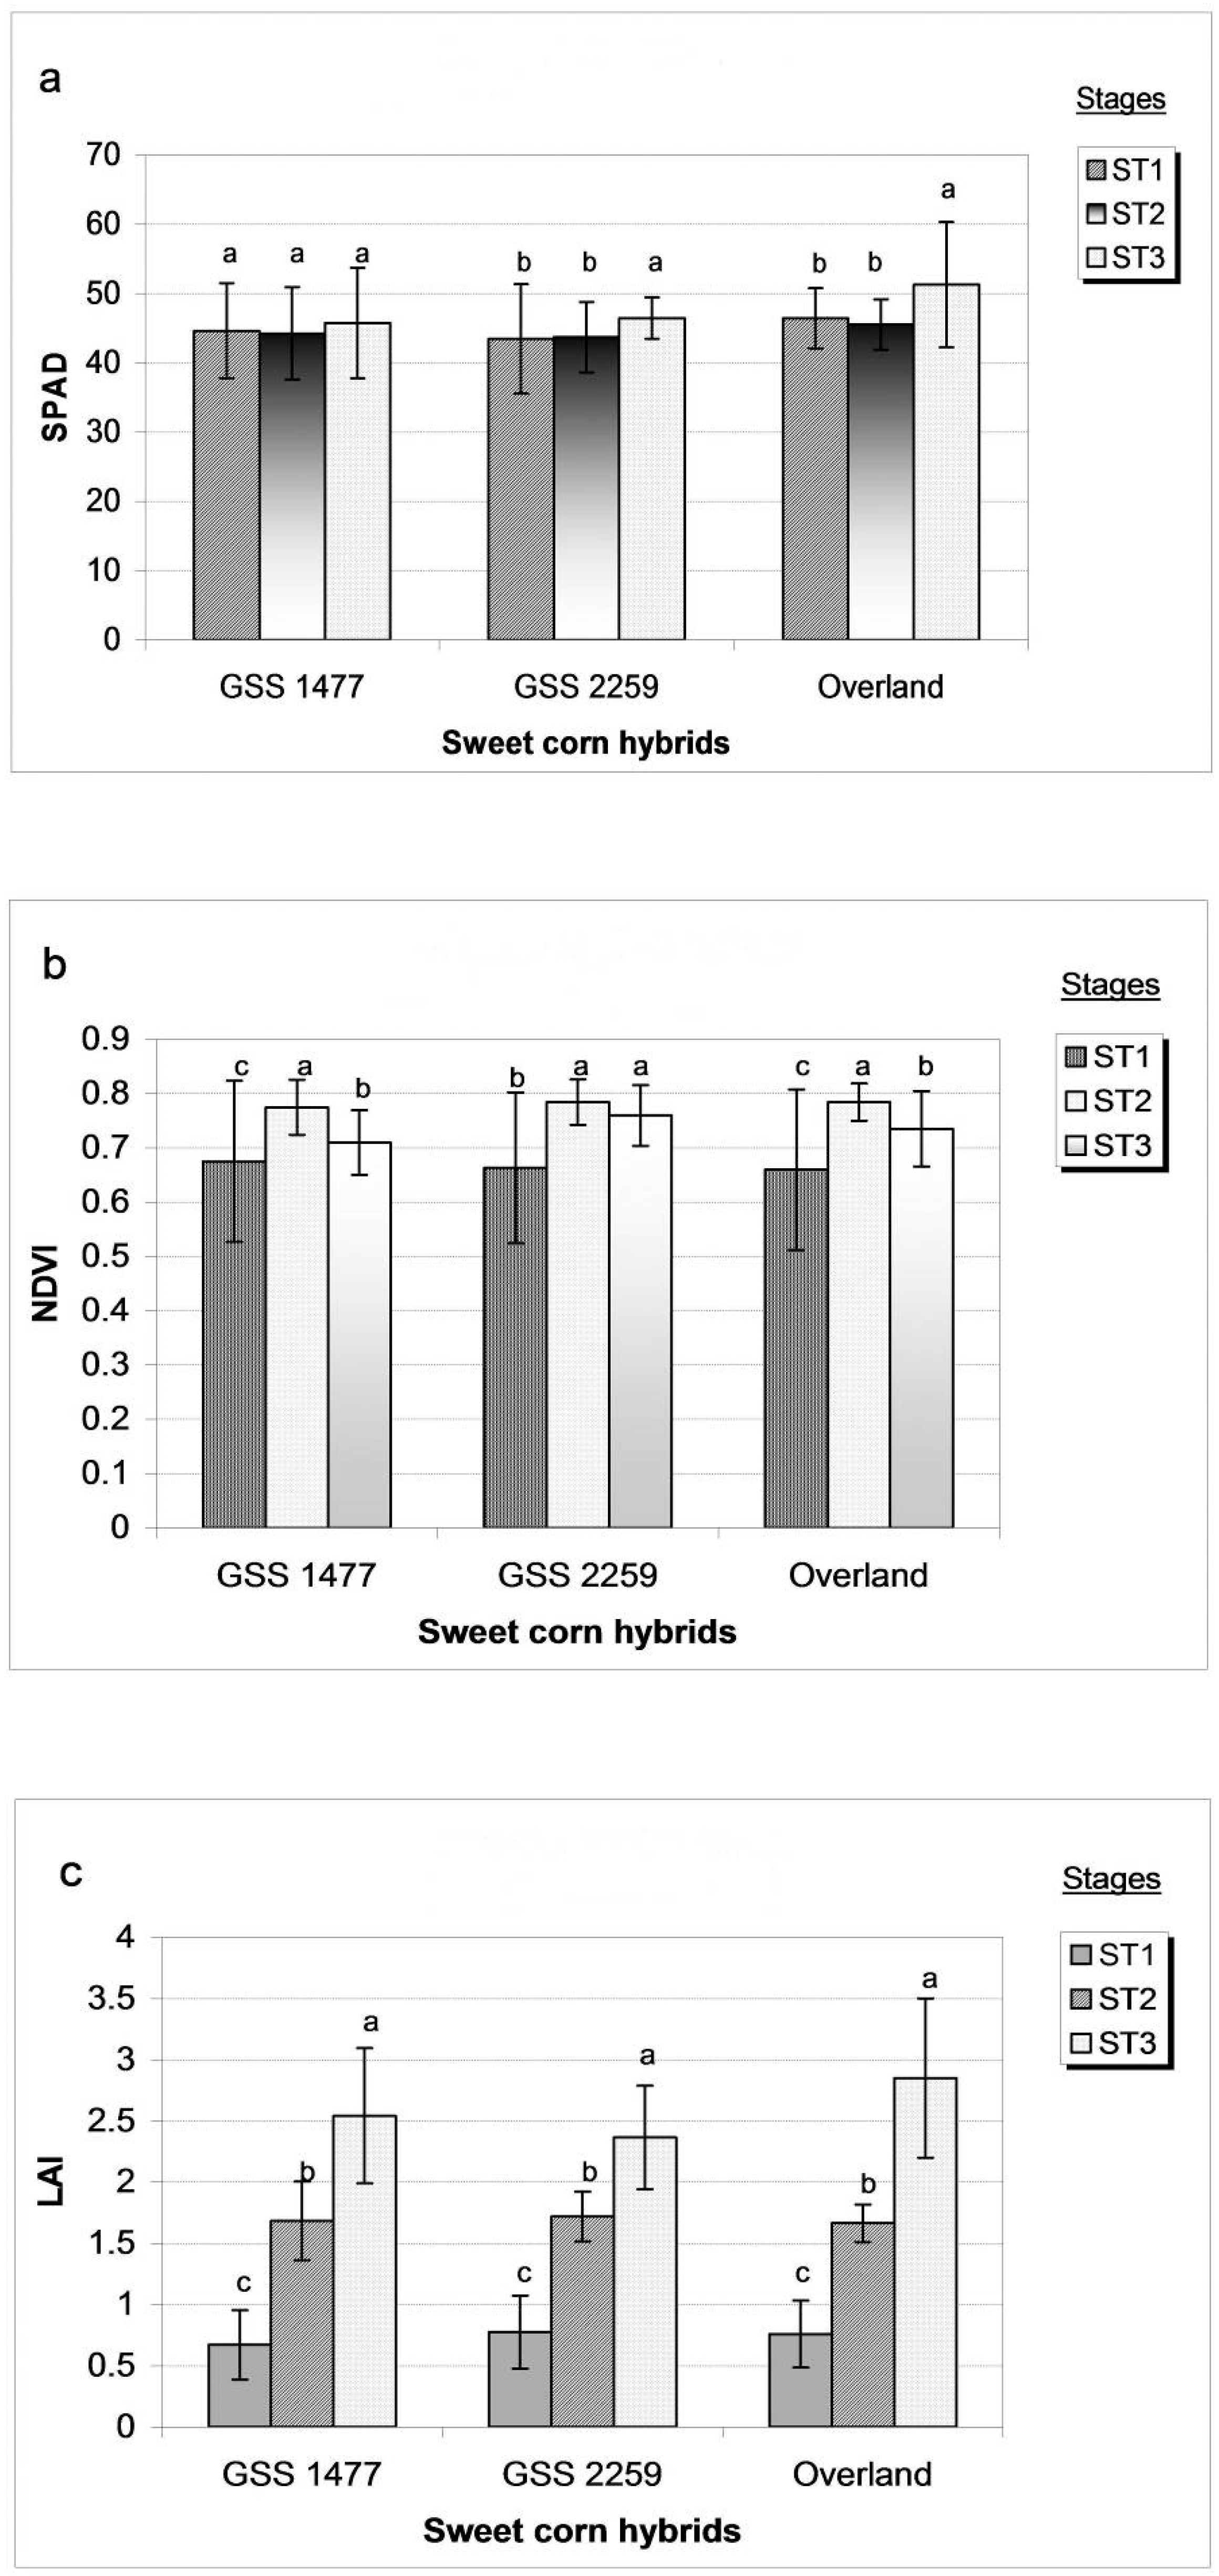
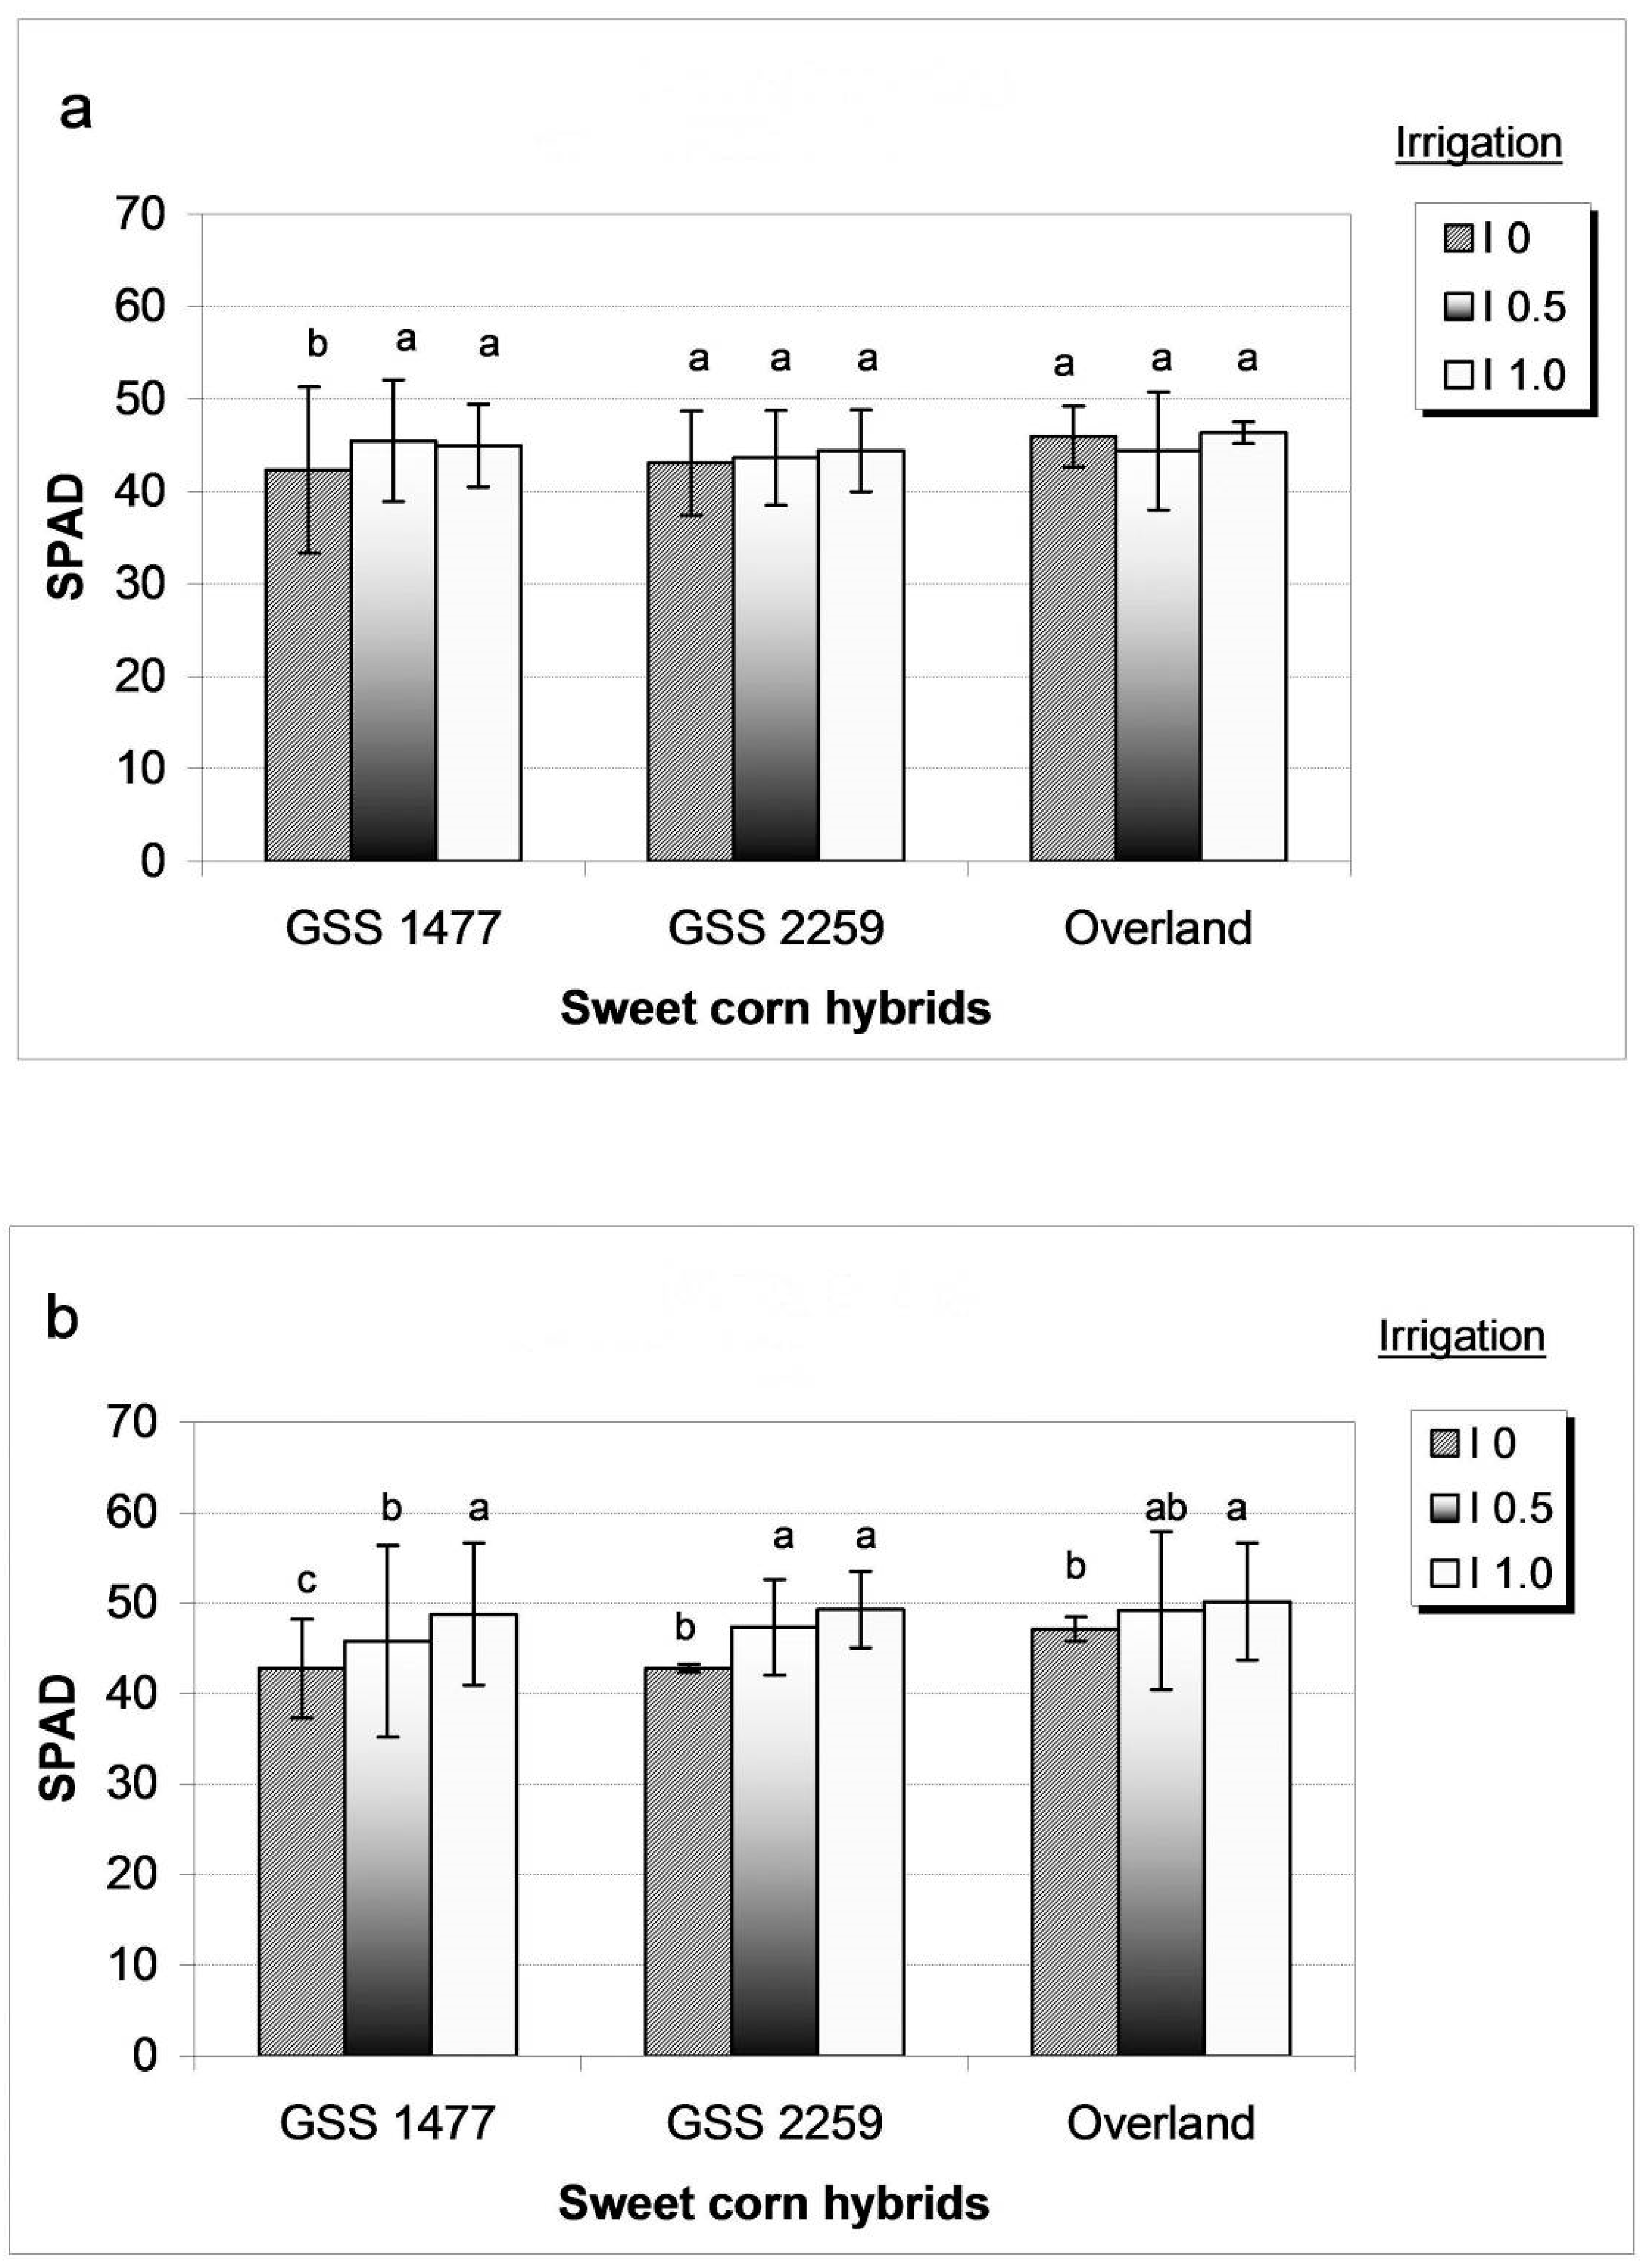
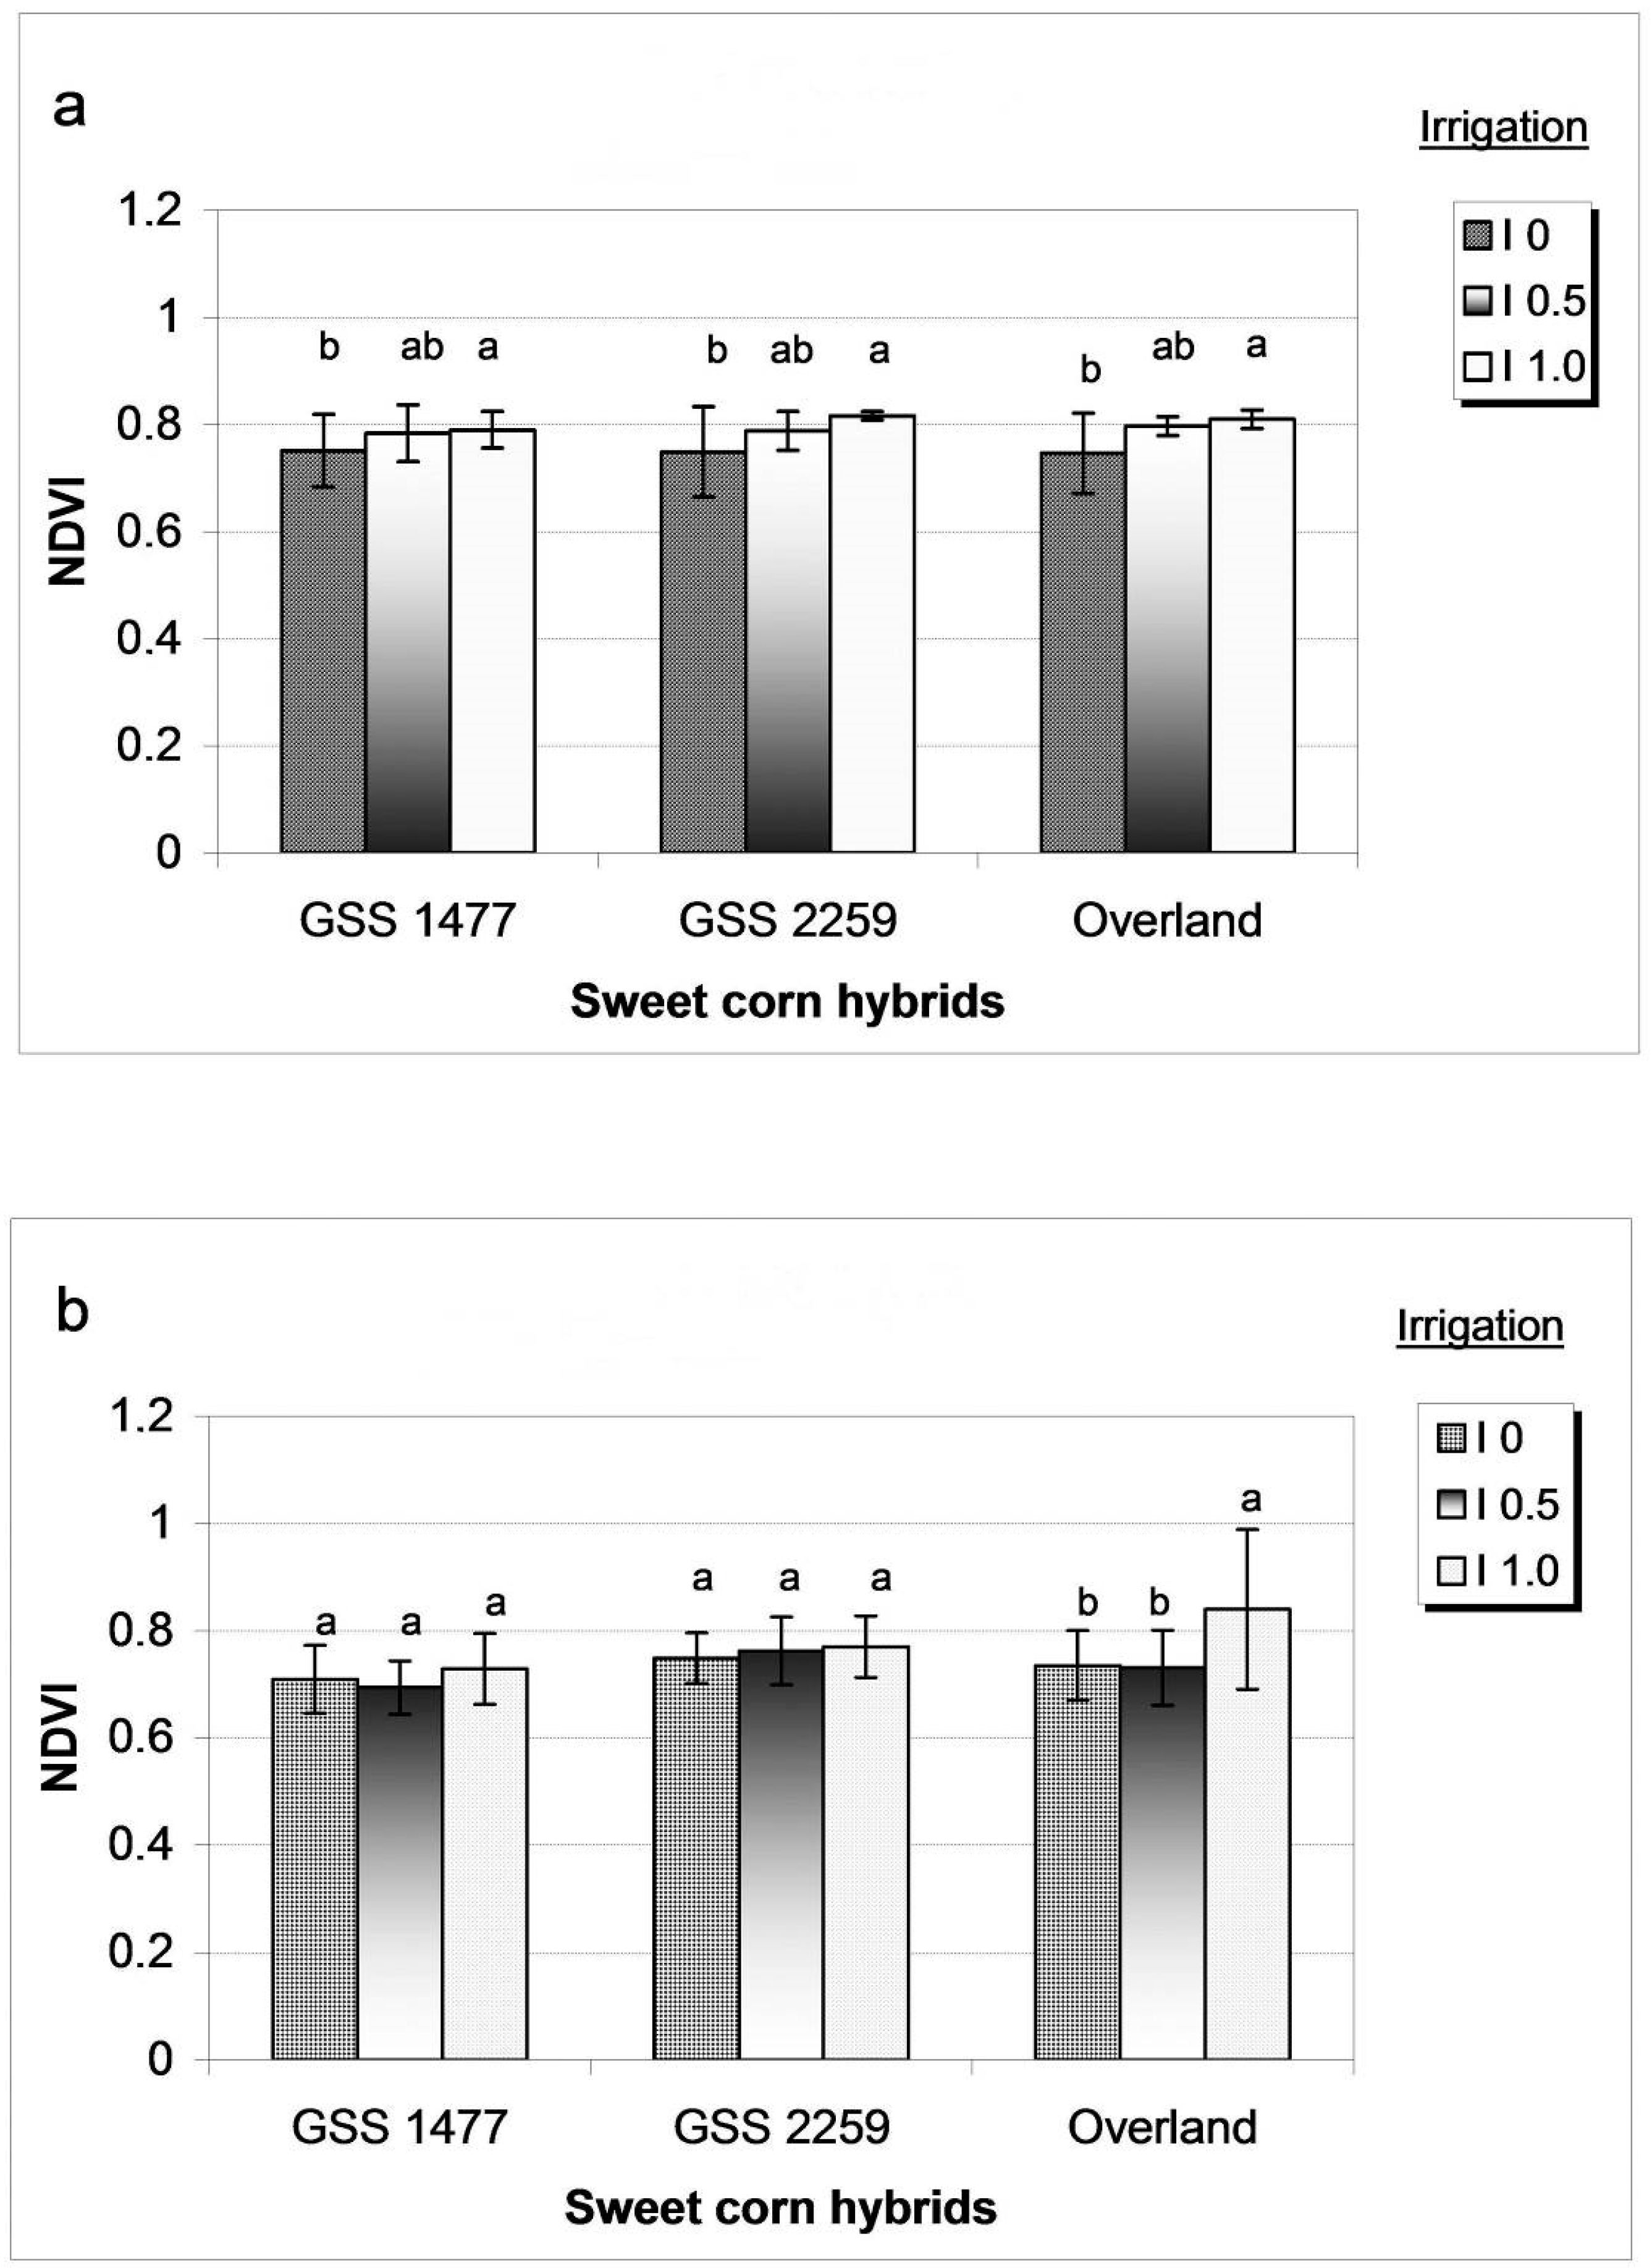
3.1. Effect of Water Supply on Spectral Traits, Yield Quality and Quality

The effects of crop years and irrigation treatments were significant on the SPAD and NDVI, as well as on plant height, the weight of husked ears, and the length and diameter of ears. The effect of crop years was significant on the nutritional quality of corn kernels. In a very dry year (2013), the highest NDVI and smallest SPAD were measured, and there was high carotene content of the corn kernels. In moderately dry 2012, the height of plants and weight of the husked ears were the highest, but the sugar accumulation was the lowest in the kernels (Table 1 and Table 2).
Under unirrigated conditions (I0), the height of plants decreased significantly, and the traits influencing photosynthesis, such as SPAD and NDVI, were low in comparison with the well-irrigated plants, while the extent of LAI was influenced by the water supply of the crop year. Under this growing condition, the plants produced low weight short ears with small diameters, while the dry matter content of kernels increased and carotene content decreased in comparison with the well-watered plants (Table 2). The number of kernels per ear row indicating the degree of fertility was influenced by the weather of crop years, but the number of kernel rows on the ear relating the ear diameter was affected by the water supply conditions. Under moderate water deficiency (I0.5) using deficit irrigation, the plants developed few yields, i.e., individual weight of husked ears in dry 2013 (Table 1). Deficit irrigation (I0.5) did not affect the nutritional quality of sweet corn except in the very dry year (2013) when the dry matter and sugar accumulation in the kernels were significant in comparison with the optimal water supply condition (Table 2).
During the growth of sweet corn, the leaf area index (LAI) increased intensively, and the increase in NDVI was moderate, but the SPAD did not change significantly (Figure 2). During silking, the middle–late and late-ripening sweet corn hybrids had higher SPAD values in comparison with the earlier stages of development, but no change was detected for the middle–early GSS 1477 hybrid (Figure 2a). During tasselling, NDVI reached the highest value, although no differences could be detected between the hybrids. Following this stage, during the silking period, the NDVI decreased significantly, except in the case of the late-ripening GSS 2259 hybrid (Figure 2b). A significant difference in growth of canopy (LAI) between the hybrids was detected during the silking period when Overland had the largest and late-ripening GSS 2259 had the smallest (Figure 2c).
During the generative stages of the hybrids, the spectral reflectance both on leaf and canopy level changed with water supply conditions. Under unirrigated conditions (I0), a significant change in SPAD value was not detected during tasseling except for the middle–early-ripening GSS 1477 hybrid (Figure 3a). However, during silking, the SPAD significantly decreased for all hybrids compared to the optimal water supply (Figure 3b). Under moderate water deficiency (I0.5), the SPAD value did not change during tasseling, but for the middle–early-ripening GSS 1477 hybrid, a significant decrease in the SPAD value of leaves was detected during the silking period (Figure 3b).
During the tasseling period, the NDVI decreased significantly under severe water deficiency (I0) compared to those under optimal water supply conditions and no differences could be detected between the hybrids (Figure 4a). Nevertheless, during the silking period, the water deficit (I0, I0.5) did not affect the NDVI of the hybrids except for the middle–late-ripening Overland (Figure 4b).
During the tasseling period, the late-ripening hybrids responded to water shortage (I0, I0.5) with a decrease in the canopy (LAI) and this was very intensive for the GSS 2259 hybrid (Figure 5a). During silking, the differences in LAI between the hybrids could be detected mainly under moderate water deficiency (I0.5) using deficit irrigation; when LAI of the middle–early and late-ripening hybrids (GSS 1477 and GSS 2259) decreased, but it did not change for Overland, in comparison with the well-watered plants (Figure 5b).

3.2. Relationship between Spectral Traits and Yield

The relationships between the spectral traits including SPAD and vegetation index (NDVI) related to photosynthetic activity and the size of canopy (LAI) measured during generative stages depended on the water supply conditions. Under water shortage (I0, I0.5), a close significant correlation was detected between the SPAD and NDVI during tasseling of sweet corn, although their relationship with the size of canopy (LAI) differed during the generative stages of development (Table 3 and Table 4). A significant negative correlation was found between the SPAD measured during tasseling and the length of the ear (Table 3). However, the tightness and tendency of this correlation were different for the sweet corn hybrids.
Under low rain-fed condition (I0), a significant positive correlation (r = 0.9654) was found between the SPAD and ear length during tasseling for the middle–early GSS 1477 hybrid, but a week negative correlation (r = −0.7792 p < 0.1) was established for the late-ripening GSS 2259 hybrid. Under this condition, the extent of canopy (LAI) better influenced the parameters of ears and husked weight during silking period than the spectral traits (Table 3).
Under moderate water deficiency (I0.5), SPAD measured during both tasseling and silking periods correlated with the morphological attributes of ears, the individual husked ear, and the final yield (Table 4). Under this condition, the canopy spectral reflectance (NDVI) measured during tasseling correlated closely with individual husked ear yield. However, its measurement during both tasseling and silking periods did not influence the final yield. Therefore, NDVI can be used to estimate the only individual ear yield during the tasseling period. According to the correlation shown in Table 4, the largest individual yield can be reached during tasseling by the 49 range of SPAD and 0.79 of NDVI values.
Hereafter, the investigations aimed to determine the period that would be the most suitable for the prediction of yield using spectral traits measured on the individual plant (leaf), or crop canopy. Under low rain-fed condition (I0), the SPAD values of the leaves did not correlate with the yield. During tasseling, the canopy spectral reflectance (NDVI) related to the change in the LAI influenced the yield but did not do so during the silking period. These correlations confirmed that the spectral traits of neither leaf and crop canopy are suitable for the prediction of the yield of sweet corn under severe dry condition (Table 3). Under water deficiency (I0.5), using deficit irrigation, the SPAD measured during the silking period correlated with the LAI and the extent of canopy (LAI) determines the final yield. Therefore, the change in the LAI could affect the reliability of the yield prediction.
During tasseling, when the SPAD ranged from 46 to 49, then 23.5 to 26.7 t ha−1 could be expected, but this range of SPAD measured during silking predicted a lower yield by 6 to 10.1% on the basis of correlations shown in Table 4. However, this can be changed depending on the hybrid. A close significant correlation between the SPAD measured during tasseling (r = 0.7757) and silking (r = 0.9141) was found for the late-ripening GSS 2259 hybrid, and it has also been detected for the middle–late-ripening GSS 1477 hybrid (r = 0.7757 and r = −0.8413, respectively) under moderate water deficiency (I0.5). On the basis of these correlations, a 49 SPAD value measured during tasseling provides a 29.5 t ha−1 of yields, but during the silking period, these values predict an up to 7% lower yield (27.3 t ha−1) for GSS 2259. In the case of the GSS 1477 hybrid a 49 SPAD value measured during tasseling contributes to 26.7 t ha−1 of yield, but during silking, this would predict an up to 17% lower yield. Under the same growing conditions, during tasseling of middle–late-ripening Overland, when SPAD exceeds a value of 46, the husked ear per plant decreases and a high LAI measured during silking (Figure 2 and Figure 5b) predicts a low final yield on the basis of the correlation shown in Table 4.

3.3. Relationship between Spectral Trait and Yield Quality

The sugar and carotene contents of the yield of sweet corns depended on the crop year (Table 2), but the water scarcity of years influencing the physiological processes affected the translocation of assimilates from leaf to kernels. The spectral traits such as SPAD and NDVI measured during tasseling, correlated significantly with the sugar content of the kernels under unirrigated condition (I0) (Table 5). Although the high sugar content of the super-sweet corn hybrids was determined by genetics, a 45 SPAD and 0.77 NDVI measured during tasseling could be able to preserve the high (9.3%) sugar content in the kernels under unirrigated conditions (I0) on the basis of the correlation shown in Table 5.
This time, a smaller crop canopy (1.7 LAI) can provide for the high sugar (10.5%) and carotene contents (0.28 mg kg−1) of the corn kernel, but an increase in the LAI (e.g., 2.1) predicted sugar contents lower by 5% and carotene contents of kernels lower by 21.4%, according to the correlations shown in Table 5. Under moderate water deficiency (I0.5), during tasseling, a negative significant correlation between the SPAD and the sugar content of kernels was found (r = −0.8232 p < 0.01), while it was positive between the NDVI and sugar content of the kernels (r = 0.7972 p < 0.05) (Table 5). Under this growing condition (I0.5), the size of canopy crops (LAI) had a significant influence on the carotene content of corn kernels (r = 0.7317 and r = 0.7095). During the silking period, a low crop canopy (e.g., LAI 1.7) can provide high carotene content (0.31 mg kg−1) but larger 2.1–2.5 LAI result in lower carotene content (0.27–0.25 mg kg−1) in the kernels. On the basis of correlations shown in Table 5, under water shortage (I0.5) a 45 SPAD and 0.78 NDVI values measured during tasseling predict 8.7% of sugar and 0.28 mg kg−1 of carotene content in the kernels if the SPAD does not exceed a value of 48 and the LAI a value of 1.9 during the silking period.
Nevertheless, the result of the yield prediction can be modified by the water stress occurring during the ears development. Under severely dry condition (I0), no correlation between the SPAD and NDVI and yield was found during generative stages (Table 2). Thus, these traits were not suitable to predict the yield of sweet corns in drought. Under water shortage (I0.5), a low (e.g., 46) SPAD value measured during tasseling predicts the actual final yield lower by 1 to 5.7% than the predicted yield but during silking in the 46 to 49 range of SPAD, the difference between them can change from 6.2 to 25.8%. This difference can be attributed to the various ripening and/or water stress tolerance of the sweet corn hybrids. This points to the fact that under deficit irrigated condition during tasseling, the measurement of SPAD could predict more reliably the expected yield of sweet corn hybrids than during silking, as was confirmed by the results in Table 6. The middle–early GSS 1477 hybrid and late-ripening GSS 2259 hybrid responded to deficit irrigation with a decrease in the height and final yield when compared with the optimal water supply condition. The middle–late-ripening Overland showed a low productivity between hybrids. However, its height and biomass yield decreased (5.5% and 9%, respectively) under water deficiency (I0.5), even though the final yield did not change in comparison with the optimal water supply condition. Nevertheless, the dry matter of kernel was increased significantly, and its carotene content decreased by 11.1% in comparison with those of well-watered plants (Table 6).

4. Discussion

Remote sensing techniques are useful tools to monitor the growth and response of the crop to water stress or evaluate the yield [18,25]. Water-stressed sweet corn absorbs less light in the visible region and more light in the near-infrared region of the spectrum than irrigated, i.e., unstressed plants [19]. Others [24] established that the high SPAD values of bean leaves were visually associated with dark-green coloured leaves under severe water deficiency, which could be due to the change of the water and chlorophyll content in the leaves accompanied with decreasing light absorbance in the blue and red region of the spectrum and increasing reflectance for the water-stressed plants.
Maize is considered to be relatively tolerant to water stress in the vegetative stage and very sensitive during the tasseling, silking, and pollination periods [34]. The degree of water stress tolerance of sweet corn hybrids is detected by the change in spectral reflectance on leaf and canopy measured during generative stages of development. It has been reported that the spectral reflectance on the leaf was higher for maize [25], snap beans [24], and green peas [16] under drought stress than under optimal water supply conditions. Others [35] recorded lower chlorophyll content (SPAD unit) for most inbred maize lines under drought stress condition than in the well-watered plants. On the contrary to these statements the results in this study were different; the leaf and canopy spectral reflectance of sweet corn hybrids measured under low rain-fed (I0) condition were lower than under optimal water supply condition (Table 1). However, the responses of hybrids to water deficiency were different during their generative stages of development.
When both leaf and canopy reflectance is low within the photosynthetic active radiation (PAR) from 400 to 700 nm, then photosynthesis is undisturbed [25]. A relatively low spectral reflectance on leaf shown by 40 to 45 SPAD values provided an undisturbed photosynthetic activity until the tasseling period. Therefore, the crop canopy (LAI) and spectral vegetation index (NDVI) increased intensively (Figure 2). During the silking period, the difference in the SPAD between the hybrids was pronounced under different water supply conditions. The highest SPAD values were detected both during the tasseling and silking periods for the middle–late-ripening Overland sweet corn under severe drought (I0). Nevertheless, under water deficiency (I0.5) using deficit irrigation, a larger SAPD value was detected during the silking period than in the tasseling period. As a result of high SPAD, the photosynthetic activity decreased during silking which contributed to a significant decrease in LAI that was shown for the late-ripening GSS 2259 hybrid (Figure 3b and Figure 5b).
In drought, decreasing crop canopy results in a decrease in the water loss of plants, closing stomata and the high stomatal resistance result in the reduction of plant height and a decrease in the diameter and weight of the ears of sweet corn [36]. It has been published that deficit irrigation decreases the length and diameter of ears significantly, the number of kernels per ear, and the final yield of sweet corns [37,38]. In contrast to these reports, our findings showed that although deficit irrigation decreased the height of plants under water scarcity, the size of ear and number of kernels per ear only decreased under severe drought, compared with the optimal water condition (Table 1 and Table 2). Under moderate water deficiency, a strong correlation (r = 0.69) between stomatal resistance measured during tasseling and husked ear yield has been reported [36], but the spectral traits (i.e., SPAD and NDVI) also have considerable influence on the development of individual husked ears. The finding revealed that during tasseling, the expected husked ear per plant could be predicted by both individual measurements on the leaf (SPAD) and on the canopy level with spectral vegetation index (NDVI) and could be used to select genotype with water stress tolerance.
A reliable prediction of yield and quality before harvest would be useful in precision agriculture [9]. Nevertheless, the reliability of the yield prediction is determined by the measurements taken on the leaf or canopy level, the stages of development, and the growing conditions. Spectral vegetation index (NDVI) has been offered to predict the expected yield of some plant species. Strong correlation was found between NDVI and final yield at 15 days after flowering of maize [20], at 54 days after sowing for Pinto bean [10], and during early flowering of cotton [39]. According to the others [25], the relationship between the predicted and actual grain yield was higher when the measurements of spectral reflectance were taken on leaf level than the canopy level. This has been confirmed by our results, wherein the measurement on the leaf expressed by SPAD values was more suitable to predicting both individual ear yield and final yield than that on the canopy level presented by NDVI. However, it could be done only under moderate water shortage (I0.5). Under this growing condition, as long as the SPAD value is low during tasseling (e.g., 46), then the difference between the final and predicted yield is approx. 5.7%, while this can be higher (7–14%) at a 49 SPAD value. Nevertheless, the difference between the final yield and expected yield could be either 6.2 or 25.8% in the range of 46 to 49 SPAD measured during the silking period, depending on the hybrids. This result points to the fact that the spectral reflectance measured on the individual leaf during tasseling is more suitable to predict the yield of sweet corn than those during the silking period under moderate water deficiency.
Water shortage has effects not only on the yield of plants but on their nutritional quality. Under mild and severe water deficit, higher protein and sugar content of kernels were observed than those of well-watered plants [40]. Knowledge of the relationship between the spectral traits and nutritional quality of yield is rather lacking. In drought, a close correlation between the SPAD values measured during pod development of snap beans and dry matter content of the pods has been established but the relationship of SPAD with the protein and fibre content of pods being dependent on crop year [24]. The SPAD measured during silking has been considered to be suitable for the prediction of protein content of maize yield [41]. Nevertheless, the NDVI was not found to be appropriate for the reliable prediction of protein content of grain of barley and wheat [9,42].
According to the results, under water shortage, the nutritional quality of sweet corn kernel can be predicted by the measurement of spectral reflectance on both leaf and canopy level. On the basis of the correlation between the SPAD, NDVI, and the sugar content of kernels, the expected sugar content of yield of sweet corn grown under unirrigated dry condition (I0) can be indicated with 58% and 80% reliability by the measurements during the tasseling period. Nevertheless, their realization will be determined by the LAI results obtained during silking period. Under moderate water deficiency (I0.5), the expected sugar content of kernels of sweet corns can be predicted with 64 and 68% reliability by SPAD and NDVI, respectively, measured during tasseling. However, the LAI seemed to have larger role in the promotion of accumulation of carotene in the corn kernels than spectral traits during silking (Table 5).
The 46 to 49 range of SPAD measured during tasseling provided a reliable prediction of yield, high sugar, and carotene content of kernels of sweet corn hybrids grown under moderate water deficiency which was confirmed by the data shown in Table 6. High leaf spectral reflectance (SPAD) measured during generative stages of development resulted indirectly a decrease in the biomass and low yield and high dry matter content of kernels which was occurred for the Overland variety (Figure 3, Table 6). The late-ripening GSS 2259 hybrid was more sensitive to deficit irrigation than the middle–early GSS 1477 because its higher SPAD value measured during silking (Figure 3) contributed to the decrease by 16.7% of yield, in comparison with the optimal water condition (Table 6).

5. Conclusions

The results proved that the measurement of spectral reflectance on leaf presented by SPAD value was more suitable to predict the expected individual ear yield (i.e., ear yield per plant), final yield, and nutritional quality of sweet corn hybrids than that of canopy level (NDVI). Nevertheless, the reliability of the yield prediction was higher during tasseling than the silking period of sweet corns under moderate water deficiency. The smallest difference between the predicted and actual yield of sweet corn would occur with the measurement of SPAD in the range of 46 to 49 during tasseling. Under unirrigated dry conditions, these spectral traits are not suitable to predict the expected yield, but both SPAD and NDVI measured during tasseling period significantly influenced the sugar content of kernels. These results could also be used for the early selection of genotypes with water tolerance and in the precision plant production.

Author Contributions

E.N.; analyzed the data, wrote the paper, K.M.; designed the experiments, C.R.; performed the experiments, A.C.D.; designed the irrigation schedule, L.H.; corrected and improved the paper.

Funding

This publication was supported by the National Research, Development Innovation Office, Hungary, grant number GINOP -2.2.1-15-2016-00021 Project and the Higher Education Institutional Excellence Program (1783-3/2018/FEKUTSTRAT) awarded by the Ministry of Human Capacities within the framework of water-related researches of Szent István University. The research was financed by the Higher Education Institutional Excellence Programme (20428-3/2018/FEKUTSTRAT) of the Ministry of Human Capacities in Hungary, within the framework of the 4.thematic programme of the University of Debrecen.

Acknowledgments

We would like to thank the seeds for Syngenta Hungary.

Conflicts of Interest

The authors declare no conflict of interest.

References

  1. Kang, S.; Shi, W.; Zhang, J. An improved water-use efficiency for maize grown under regulated deficit irrigation. Field Crop. Res. 2000, 67, 207–214. [Google Scholar] [CrossRef]
  2. Megyes, A.; Rátonyi, T.; Huzsvai, L.; Szabó, G.; Dobos, A.; Sum, O. A műtrágyázás hatása a Dekalb 471 SC kukoricahibrid (Zea mays L.) termésére öntözés nélküli és öntözéses kezelésben. [Effect of fertilizer on yield of Dekalb 471 SC maize hybrid (Zea mays L.) under non-irrigated and irrigated conditions]. Növénytermelés 2000, 49, 307–316. [Google Scholar]
  3. Lejeune, P.; Bernier, G. Effect of environment on the early steps of ear initiation in maize (Zea mays L.). Plant Cell Environ. 1996, 19, 217–224. [Google Scholar] [CrossRef]
  4. Claassen, M.M.; Shaw, R.H. Water deficit effects on corn. II. Grain components. Agron. J. 1970, 62, 652–655. [Google Scholar] [CrossRef]
  5. Edmeades, G.O.; Bolaños, J.; Chapman, S.C.; Lafitte, H.R.; Bänziger, M. Selection improves drought tolerance in tropical maize populations. I. Gains in biomass, grain yield, harvest index. Crop. Sci. 1999, 39, 1306–1315. [Google Scholar] [CrossRef]
  6. Azanza, F.; Klein, B.P.; Juvik, J.A. Sensory characterization of sweet corn lines differing in physical and chemical composition. J. Food Sci. 1996, 61, 253–257. [Google Scholar] [CrossRef]
  7. Szymanek, M.; Tanas, W.; Kassar, H.F. Kernel carbohydrates concentration in sugary-1, sugary enhanced and shrunken sweet corn kernels. Agric. Agric. Sci. Procedia 2015, 7, 260–264. [Google Scholar] [CrossRef]
  8. Douglass, S.K.; Juvik, J.A.; Splittstoesser, W.E. Sweet corn seedling emergence and variation in kernel carbohydrate reserves. Seed Sci. Technol. 1993, 21, 433–436. [Google Scholar]
  9. Barmeier, G.; Hofer, K.; Schmidhalter, U. Mid-season prediction of grain yield and protein content of spring barley cultivars using high-throughput spectral sensing. Eur. J. Agron. 2017, 90, 108–116. [Google Scholar] [CrossRef]
  10. Zhou, J.; Khot, L.R.; Boydston, R.A.; Miklas, P.N.; Porter, L. Low altitude remote sensing technologies for crop stress monitoring: A case study on spatial and temporal monitoring of irrigated pinto bean. Precis. Agric. 2018, 19, 555–569. [Google Scholar] [CrossRef]
  11. Blackburn, G.A. Hyperspectral remote sensing of plant pigments. J. Exp. Bot. 2007, 58, 855–867. [Google Scholar] [CrossRef] [PubMed]
  12. Carter, G.A.; Knap, A.K. Leaf optical properties in higher plants: Linking spectral characteristics to stress and chlorophyll concentration. Am. J. Bot. 2001, 88, 677–684. [Google Scholar] [CrossRef] [PubMed]
  13. Carvalho, R.F.; Takaki, M.; Azevedo, R.A. Plant pigments: The many faces of light perception. Acta Physiol. Plant. 2001, 33, 241–248. [Google Scholar] [CrossRef]
  14. Fanizza, G.; Ricciardi, L.; Bagnulo, C. Leaf greenness measurements to evaluate water stressed genotypes in Vitis vinifera. Euphytica 1991, 55, 27–31. [Google Scholar] [CrossRef]
  15. Zhao, J.; Sun, H.; Dai, H.; Zhang, G.; Wu, F. Difference in response to drought stress among Tibet wild barley genotypes. Euphytica 2010, 172, 395–403. [Google Scholar] [CrossRef]
  16. Nemeskéri, E.; Molnár, K.; Víg, R.; Nagy, J.; Dobos, A. Relationships between stomatal behaviour, spectral traits and water use and productivity of green peas (Pisum sativum L.) in dry seasons. Acta Physiol. Plant. 2015, 37, 1–16. [Google Scholar] [CrossRef]
  17. Nemeskéri, E.; Kovács-Nagy, E.; Sárdi, É. Relationships between the biochemical and spectral traits of leaves and the productivity of apple trees in organic and integrated production systems. Biol. Agric. Hortic. 2017, 33, 97–114. [Google Scholar] [CrossRef]
  18. Stone, P.J.; Wilson, D.R.; Jamieson, P.D.; Gillespie, R.N. Water deficit effects on sweet corn. Part II. Canopy development. Aust. J. Agric. Res. 2001, 54, 115–126. [Google Scholar] [CrossRef]
  19. Genc, L.; Inalpulat, M.; Kizil, U.; Mirik, M.; Smith, S.E.; Mendes, M. Determination of water stress with spectral reflectance on sweet corn (Zea mays L.) using classification tree (CT) analysis. Zemdirbyste 2013, 100, 81–90. [Google Scholar] [CrossRef]
  20. Spitkó, T.; Nagy, Z.; Zsubori, Z.T.; Szőke, C.; Berzy, T.; Pintér, J.; Marton, C.L. Connection between normalized difference vegetation index and yield in maize. Plant Soil Environ. 2016, 62, 293–298. [Google Scholar] [CrossRef] [Green Version]
  21. Romano, G.; Zia, S.; Spreer, W.; Sanchez, C.; Cairns, J.; Araus, J.L.; Muler, J. Use of thermography for high throughtput phenotyping of tropical maize adaptation in water stress. Comput. Electron. Agric. 2011, 79, 67–74. [Google Scholar] [CrossRef]
  22. Bell, G.E.; Howell, B.M.; Johnson, G.V.; Raun, W.R.; Solie, J.B.; Stone, M.L. Optical sensing of turfgrass chlorophyll content and tissue nitrogen. HortScience 2004, 39, 1130–1132. [Google Scholar]
  23. Monteiro, P.F.C.; Filho, R.A.; Xavier, A.C.; Monteiro, R.O.C. Assessing biophysical variable parameters of bean crop with hyperspectral measurements. Sci. Agric. 2012, 69, 87–94. [Google Scholar] [CrossRef]
  24. Nemeskéri, E.; Molnár, K.; Helyes, L. Relationships of spectral traits with yield and nutritional quality of snap beans (Phaseolus vulgaris L.) in dry seasons. Arch. Agron. Soil Sci. 2018, 64, 1222–1239. [Google Scholar] [CrossRef]
  25. Weber, V.; Araus, J.L.; Cairns, J.E.; Sanchez, C.; Melchinger, A.E.; Orsini, E. Prediction of grain yield using reflectance spectra of canopy and leaves in maize plants grown under different water regimes. Field Crop. Res. 2012, 128, 82–90. [Google Scholar] [CrossRef]
  26. Ali, A.M.; Thinda, H.S.; Sharmaa, S.; Varinderpal-Singha. Prediction of dry direct-seeded rice yields using chlorophyll meter, leaf color chart and GreenSeeker optical sensor in northwestern India. Field Crop. Res. 2014, 161, 11–15. [Google Scholar] [CrossRef]
  27. Magney, T.S.; Eitel, J.U.H.; Huggins, D.R.; Vierling, L.A. Proximal NDVI derived phenology improves in-season predictions of wheat quantity and quality. Agric. For. Meteorol. 2016, 217, 46–60. [Google Scholar] [CrossRef]
  28. Shuttleworth, J.W.; Wallace, J.S. Evaporation from sparse crops—An energy combination theory. Q. J. R. Meteorol. Soc. 1985, 3, 839–855. [Google Scholar] [CrossRef]
  29. Allen, R.G.; Pereira, L.S.; Raes, D.; Smith, M. Crop evapotranspiration. In Guidelines for Computing Crop Water Requirements; FAO Irrigation and Drainage; Paper No. 56; FAO: Rome, Italy, 1998. [Google Scholar]
  30. Rouse, J.W.; Haas, R.H.; Schell, J.A.; Deering, D.W. Monitoring vegetation systems in the Great Plains with ERTS. In Third Earth Resources Technology Satellite-1 Symposium; National Aeronautics and Space Administration: Washington, DC, USA, 1973; pp. 309–317. [Google Scholar]
  31. Shreve, B.; Thiex, N.; Wolf, M. NFTA Reference Methods; National Forage Testing Association (NFTA): Omaha, NE, USA, 2006. [Google Scholar]
  32. Determination of sugar: Luff-Schoorl method, method 11:1-GaFTA. Available online: https://www.gafta.com/ write/MediaUploads/Contracts/2014/method_10.1_2014. Pdf (accessed on 31 January 2019).
  33. Nemeskéri, E. Breeding strategy for improvement of colour quality and carotenoid levels in dry pea seeds. Commun. Biometry Crop. Sci. Agrobiol. 2006, 1, 49–55. [Google Scholar]
  34. Fischer, K.S.; Palmer, F.E. Tropical Maize. In The Physiology of Tropical Field Crops; Goldsworthy, P.R., Fischer, N.M., Eds.; Wiley: New York, NY, USA, 1984; pp. 213–248. [Google Scholar]
  35. Chiuta, N.E.; Mutengwa, C.S. Response of yellow quality protein maize inbred lines to drought stress at seedling stage. Agronomy 2018, 8, 287. [Google Scholar] [CrossRef]
  36. Nemeskéri, E.; Molnár, K.; Dobos, A.C.S. Csemegekukorica (Zea mays L. convar. saccharata) sztóma működése, és hatása a növekedésre és terméskomponensekre eltérő vízellátás alatt [Stomatal behaviour and its influence on the growing and yield components of sweet corn (Zea mays L. convar. saccharata]. Növénytermelés 2017, 66, 75–95. [Google Scholar]
  37. Rivera-Hernández, B.; Carrillo-Ávila, E.; Obrador-Olán, J.J.; Juárez-López, J.F.; Aceves-Navarro, L.A. Morphological quality of sweet corn (Zea mays L.) ears as response to soil moisture tension and phosphate fertilization in Campeche, Mexico. Agric. Water Manag. 2010, 97, 1365–1374. [Google Scholar] [CrossRef]
  38. Aydinsakir, K.; Erdal, S.; Buyuktas, D.; Bastug, R.; Toker, R. The influence of regular deficit irrigation applications on water use, yield, and quality components of two corn (Zea mays L.) genotypes. Agric. Water Manag. 2013, 128, 65–71. [Google Scholar] [CrossRef]
  39. Zhao, D.; Reddy, K.R.; Kakani, V.G.; Read, J.J.; Koti, S. Canopy reflectance in cotton for growth assessment and lint yield prediction. Eur. J. Agron. 2007, 26, 335–344. [Google Scholar] [CrossRef]
  40. Ertek, A.; Kara, B. Yield and quality of sweet corn under deficit irrigation. Agric. Water Manag. 2013, 129, 138–144. [Google Scholar] [CrossRef]
  41. Ványiné-Széles, A.; Nagy, J. Effects of nutrition and water supply on the yield and grain protein content of maize hybrids. Aust. J. Crop. Sci. 2012, 6, 381–390. [Google Scholar]
  42. Xue, L.H.; Cao, W.X.; Yang, L.Z. Predicting grain yield and protein content in winter wheat at different N supply levels using canopy reflectance spectra. Pedosphere 2007, 17, 646–653. [Google Scholar] [CrossRef]
Figure 1. Water relations and temperature during the growth of sweet corn; I = from sowing to emergence, II = from emergence to 6–8 leaf stage, III = tasseling, IV = silking, V = from silking to harvesting.
Agronomy 09 00063 g001
Figure 2. Changes in SPAD values (a) and normalized vegetation differential index (NDVI) (b) and leaf area index (LAI) (c) under growth stages (ST1 = eight leaf-aged, ST2 = tasseling, ST3 = silking). The data presented the average of years ± SD. Mean values followed by the different letters are significantly different at the p < 0.05 level.
Agronomy 09 00063 g002
Figure 3. Effect of water supply on SPAD value of leaves (a) during tasseling and (b) during silking of sweet corn. The data presented the average of two dry years ± SD. Mean values followed by the different letters are significantly different at the p < 0.05 level. I1.0 = regularly irrigated I0.5 = moderate water deficit I0 = unirrigated, severe dry conditions.
Agronomy 09 00063 g003
Figure 4. Effect of water supply on NDVI at canopy level (a) during tasseling and (b) during silking of sweet corn. The data presented the average of years ± SD. Mean values followed by the different letters are significantly different at the p < 0.05 level. I1.0 = regularly irrigated I0.5 = moderate water deficit I0 = unirrigated, severe dry conditions.
Agronomy 09 00063 g004
Figure 5. Effect of water supply on LAI (a) during tasseling and (b) during silking of sweet corn. The data presented the average of years ± SD. Mean values followed by the different letters are significantly different at the p < 0.05 level. I1.0 = regularly irrigated I0.5 = moderate water deficit I0 = unirrigated, severe dry conditions.
Agronomy 09 00063 g005
Table 1. Effect of water supply on the spectral traits, leaf area index (LAI) and yield components of sweet corn.
TraitsWater Supply ††201120122013
SPADI1.0-50.47 a44.50 b
I0.5-50.43 a40.74 b **
I0-47.49 a **41.85 b **
NDVII1.00.716 c0.741 b0.773 a
I0.50.695 b0.750 a0.741 a **
I00.654 b **0.733 a **0.745 a **
LAII1.02.18 a1.68 c1.77 bc
I0.51.93 a1.71 b1.50 c †
I01.44 b *1.61 a1.51 b †
Height (cm)I1.0241.94 b253.26 a227.13 b
I0.5225.42 b **239.07 a **214.67 b *
I0191.69 a **199.42 a **201.77 a *
Ears no. plant−1 II1.01.10 a1.08 a1.13 a
I0.51.11 a1.02 a1.13 a
I01.00 ab **1.03 a1.03 a
Ears no. plant−1 III1.01.00 a0.38 c0.56 b
I0.51.00 a0.21 c0.49 b *
I01.00 a0.17 c*0.43 b *
Husked Ear weightI1.0305.61 b332.25 a325.46 a
g plant−1I0.5307.18 b340.21 a307.23 b *
I0274.34 b **301.61 a *302.02 a *
Number of kernelsI1.0723.61 b766.97 a801.44 a
per earI0.5737.33 b785.30 a789.01 a
I0681.20 c *779.29 ab753.67 b *
Mean values in the rows following different letters are significantly different at the p < 0.05 level using Duncan’s multiple range test. * indicates significant differences from the I1.0 at the p < 0.05, ** p < 0.01, † p < 0.1 in the year. I = developed ears, II = undeveloped ears †† I1.0 = regularly irrigated I0.5 = moderate water deficit I0 = unirrigated, serious dry conditions seen in Materials and Methods.
Table 2. Effect of water supply on morphological traits of ears and quality of sweet corn.
TraitsWater Supply ††201120122013
Ear length (cm)I1.025.66 a24.09 b23.07 b
I0.525.13 a23.72 b22.62 b
I023.61 a **23.58 a21.25 b **
Ear diameter (cm)I1.04.95 a5.08 a5.04 a
I0.54.95 a5.14 a4.97 a
I04.73 b **4.82 b *5.02 a
No. of kernels per ear rowI1.039.07 b43.27 a43.68 a
I0.539.58 b44.38 a42.44 a
I040.29 b †43.47 a40.89 b *
No. of kernel rows per earI1.018.56 a17.76 a18.34 a
I0.518.69 a17.76 b18.63 a
I016.93 b **18.02 a18.44 a
DMC%I1.022.57 a22.00 ab20.86 b
I0.522.33 a22.50 a22.62 a *
I023.00 b †22.97 b †24.81 a *
Sugar w/w%I1.09.84 a7.47 b7.60 b
I0.59.27 a6.78 b9.12 a **
I010.15 a6.44 c10.10 a **
Carotene mg kg−1I1.00.255 b0.227 b0.317 a
I0.50.210 b **0.217 b0.311 a
I00.197 b **0.207 b **0.281 a **
Mean values in the rows following different letters are significantly different at the p < 0.05 level using Duncan’s multiple range test. * indicates significant differences from the I1.0 at the p < 0.05, ** p < 0.01 † p < 0.1 in the year. DMC % = dry matter content of kernels †† I1.0 = regularly irrigated I0.5 = moderate water deficit I0 = unirrigated, serious dry conditions seen in Materials and Methods.
Table 3. Correlation coefficients (r) between the spectral traits, LAI and yield of sweet corn under unirrigated (I0) condition.
TraitsStage ††NDVILAIPlant Height cmEar Length cmEar Diameter cmHusked Ear Weight g plant−1Yield t ha−1
SPADST20.8310 ***0.47620.4598−0.6021 **0.32330.49510.4614
ST30.20360.49910.35100.27440.22600.34360.3323
NDVIST2-0.7435 *0.16260.51570.55750.68040.4619
ST3-0.46170.3539−0.50940.29890.5697−0.6837 *
LAIST2 -0.57550.44640.61820.71340.1729
ST3 -0.56770.8423 **0.7351 †0.7982 *0.5117
* p < 0.05 ** p < 0.01 *** p < 0.001 † p < 0.1 †† ST2 = tasseling, ST3 = silking.
Table 4. Correlation coefficients (r) between the spectral traits, LAI and yield of sweet corn under deficit irrigation (I0.5).
TraitsStage ††NDVILAIPlant Height cmEar Length cmEar Diameter cmHusked Ear Weight g plant−1Yield t ha−1
SPADST20.7411***0.30100.2246−0.4933 *0.6233 *0.6150 *−0.6250 **
ST30.26620.777 4***0.3239−0.5614 *0.4880 *−0.6014 **−0.7507 ***
NDVIST2-0.05060.31770.10560.9159 **0.7648 *0.4907
ST3-−0.44020.4876−0.6378 †0.33450.6789−0.4412
LAIST2 -0.6457−0.6511 †0.23150.11540.8068 *
ST3 -0.47890.68560.34060.35960.6328 †
* p < 0.05 ** p < 0.01 *** p < 0.001 † p < 0.1 †† ST2 = tasseling, ST3 = silking.
Table 5. Correlation coefficients (r) between the physiological traits and yield quality of sweet corn under unirrigated (I0) and moderate water deficit (I0.5) conditions.
I0I0.5
TraitsStage ††Dry Matter %Sugar w/w%Total Carotenoids mg kg−1Dry Matter %Sugar w/w%Total Carotenoids mg kg−1
SPADST20.23350.7638 *0.73040.2119−0.8232 **0.8055 *
ST30.42490.49310.48160.16260.7018 *0.7094
NDVIST20.71160.8957 **0.8156 *−0.18210.7972 *0.4305
ST30.41900.36220.7005 *0.8301 *0.09910.5179
LAIST20.34570.48850.38530.28020.58210.7317 *
ST30.54370.8401 *0.9212 **0.2347−0.06770.7095 *
* p < 0.05 ** p < 0.01, †† ST2 = tasseling, ST3 = silking I0.5 = moderate water deficit I0 = unirrigated, serious dry conditions.
Table 6. Effect of water supply on the spectral traits, yield and nutritional quality of sweet corn hybrids.
HybridWater Supply ††SPADNDVILAIPlant Height cmEar Length cmEar Diameter cmHusked Ear Weight g plant−1Yield t ha−1Biomass t ha−1Kernel z
DMC %Sugar w/w%Carotenoids mg kg−1
GSS 1477I1.046.63 b0.73 ab1.78244.50 c26.64 a4.86 b304.67 a27.64 a45.51 b22.54 b9.160.24
I0.544.46 c0.72 c1.61216.70 e26.00 a4.78 c318.55 a24.67 b43.77 b22.75 ab8.650.24
I043.00 d0.71 c1.59177.72 g24.10 c4.71 c286.98 b21.02 c29.21 c23.58 a8.820.22
GSS 2259I1.046.23 b0.75 a1.84260.27 a25.41 b4.97 b315.39 a30.49 a57.74 a22.17 b8.240.28
I0.544.67 c0.74 a1.62252.36 b25.09 b4.99 b302.77 a25.40 b54.56 a22.35 b7.950.26
I043.37 cd0.72 c1.48227.23 d22.39 d4.79 c277.81 b22.56 c40.04 b22.80 b8.360.24
OverlandI1.048.30 a0.74 a1.97220.19 e24.19 c5.10 a308.32 a22.35 c49.11 a20.71c7.500.27
I0.545.55 b0.73 b1.85207.93 f23.65 c5.14 a307.26 a22.17 c44.67 b22.35 b8.570.24
I046.43 b0.71 c1.56174.54 g23.50 c4.80 c271.98 b19.00 d30.33 c24.40 a9.510.22
Data presented are the average of years. Mean values in the columns following different letters are significantly different at the p < 0.05 level using Duncan’s multiple range test. †† I1.0=regularly irrigated I0.5=moderate water deficit I0= unirrigated, serious dry conditions seen in Materials and Methods z DMC % dry matter content of kernels.

