1. Introduction
Xinjiang’s abundant light and heat resources provide high-quality conditions for cotton growth. Cotton has become the most important economic crop in Xinjiang. Its planting area and total output account for 35% and 41% of the country’s totals, respectively [
1]. However, Xinjiang is located in the inland arid area of Northwest China and there is little effective rainfall during the crop growing season. The contradiction between supply and demand of water resources and cotton production is becoming increasingly prominent [
2]. Nitrogen is the most important nutrient element in cotton growth. As an important component of nucleic acids and proteins, nitrogen application can significantly regulate cotton yield. Excessive nitrogen application not only brings a series of problems, such as waste of resources and uncoordinated growth of cotton, it also causes soil salinization in serious cases, which ultimately leads to the decline of quality and yield, and low economic benefit of cotton fields. At present, saline cultivated land in Xinjiang represents 31.10% of the total cultivated area, and the physical and chemical conditions of soil are not ideal [
3]. Therefore, for cotton production in Xinjiang, how to supply water and nitrogen reasonably and efficiently and improve the efficiency of their utilization has become a key technical factor to promote protection of soil and water resources and achieve high quality and yield of cotton in this region.
In recent years, the integrated technology of water and fertilizer for drip irrigation under mulch has developed rapidly, and the coupling effect of crop water and nitrogen under drip irrigation has been studied, achieving useful results. Xie et al. found that insufficient water or high nitrogen supply limited the accumulation of cotton dry matter, leading to early decline of cotton and so lower yield [
4]. Wang et al. found that water–nitrogen interaction significantly affected net photosynthetic rate, transpiration rate, and stomatal conductance of cotton at all growth stages. The optimum irrigation nitrogen rate for cotton in mild saline-alkali soil was 3740 m
3/ha and 754 kg/ha [
5]. Singh et al. showed that for irrigation amount of 0.8–1.0 ET
c (ET
c is the evapotranspiration required for cotton from planting to harvest under sufficient water supply), the yield of cotton increased with the increase of nitrogen application, and the suitable amount of nitrogen application was 200 kg/ha [
6]. Deng et al. found that when the irrigation amount was 3900 m
3/ha and nitrogen application rate was 300 kg/ha, the number of effective bolls and boll weight of cotton increased significantly, yield reached 6992 kg/ha and water use efficiency (WUE) and nitrogen use efficiency (NUE) were 1.45 kg/m
3 and 45.9% [
3], respectively. Wang et al. showed that under full irrigation, leaf area index (LAI), seed cotton yield, and economic benefits were improved with increased irrigation amount. Low irrigation was not conducive to effectiveness of fertilizers, and WUE was at its minimum [
7]. Zhou et al. found that for mature apples, controlling soil moisture to 65%–75% of field capacity and nitrogen application to 20 g/tree was the best combination of water and fertilizer conservation [
8].
Although there are many studies on the water–nitrogen coupling effect in drip irrigation crops, most results show that the best combination of water and nitrogen for the study area comes from the established water and nitrogen treatment. However, due to limited numbers of experimental treatments, the suitable combination of water and nitrogen input is often outside the established treatments, and any single treatment cannot take into account the multiple objectives of improving quality, yield, and WUE and NUE. Hou et al. conducted a quadratic regression analysis of irrigation and fertilizer application; spatial analysis showed that for irrigation of 725–825 mm and nitrogen application of 273.6–355.6 kg/ha, grape yield, quality, and economic benefits could be simultaneously achieved [
9]. Lin et al. established a functional relationship between water and nitrogen input and jujube yield, fruit quality, and economic benefit in an extremely arid area using quadratic regression. Through spatial analysis, the multi-objective of suitable water and nitrogen interval for comprehensive yield, fruit quality, and economic benefit was obtained [
10]. However, there is still a shortage of water and nitrogen management methods for cotton based on multi-objective optimization such as WUE, NUE, yield, and income.
Aiming at comprehensive improvement of WUE, NUE, yield, and economic benefit of cotton, the effect of water and nitrogen regulation on cotton growth and production in northern Xinjiang was studied using the integrated technology of drip irrigation under mulch. The quantitative relationship between water and nitrogen input and WUE, NUE, yield, and economic benefit was established, and the appropriate water and nitrogen management strategy was sought. The results will provide a theoretical basis for effective water and fertilizer management in cotton fields under mulch drip irrigation in northern Xinjiang.
2. Materials and Methods
2.1. Experimental Site
The experimental area is located in Shihezi Irrigation District, Xinjiang, China (84°43′–86°35′ E, 43°21′–45°20′ N) and is a typical temperate inland arid area. The irrigated area is located in the center of the Economic Zone on the northern slope of Tianshan Mountains in Xinjiang and on the southern margin of Junggar Basin with a total area of 1326.15 km
2. Annual average temperature is 7.5–8.2 °C, annual precipitation is 180–270 mm, annual evaporation is 1723–2260 mm, annual sunshine duration is 2318–2770 h, and the annual frost-free period is 147–191 days. Soil physical properties of the 0–60 cm tillage layer in the experimental area are shown in
Table 1, and soil fertility level of this layer is shown in
Table 2.
2.2. Field Experiment Design
The field experiment was conducted in the cotton growing seasons of 2017 and 2018. Three irrigation levels were set—low (I1), medium (I2), and full (I3) irrigation, accounting for 75%, 87.5%, and 100% of ETc, respectively. The three nitrogen application levels were low (N1, 210 kg/ha), medium (N2, 280 kg/ha), and high (N3, 350 kg/ha) nitrogen, accounting for 75%, 100%, and 125% of the local nitrogen application respectively. The nitrogen fertilizer applied was urea (nitrogen content 46.7%). The experiment adopted a completely randomized block design, with nine treatments and three replications per treatment making a total of 27 field experimental plots.
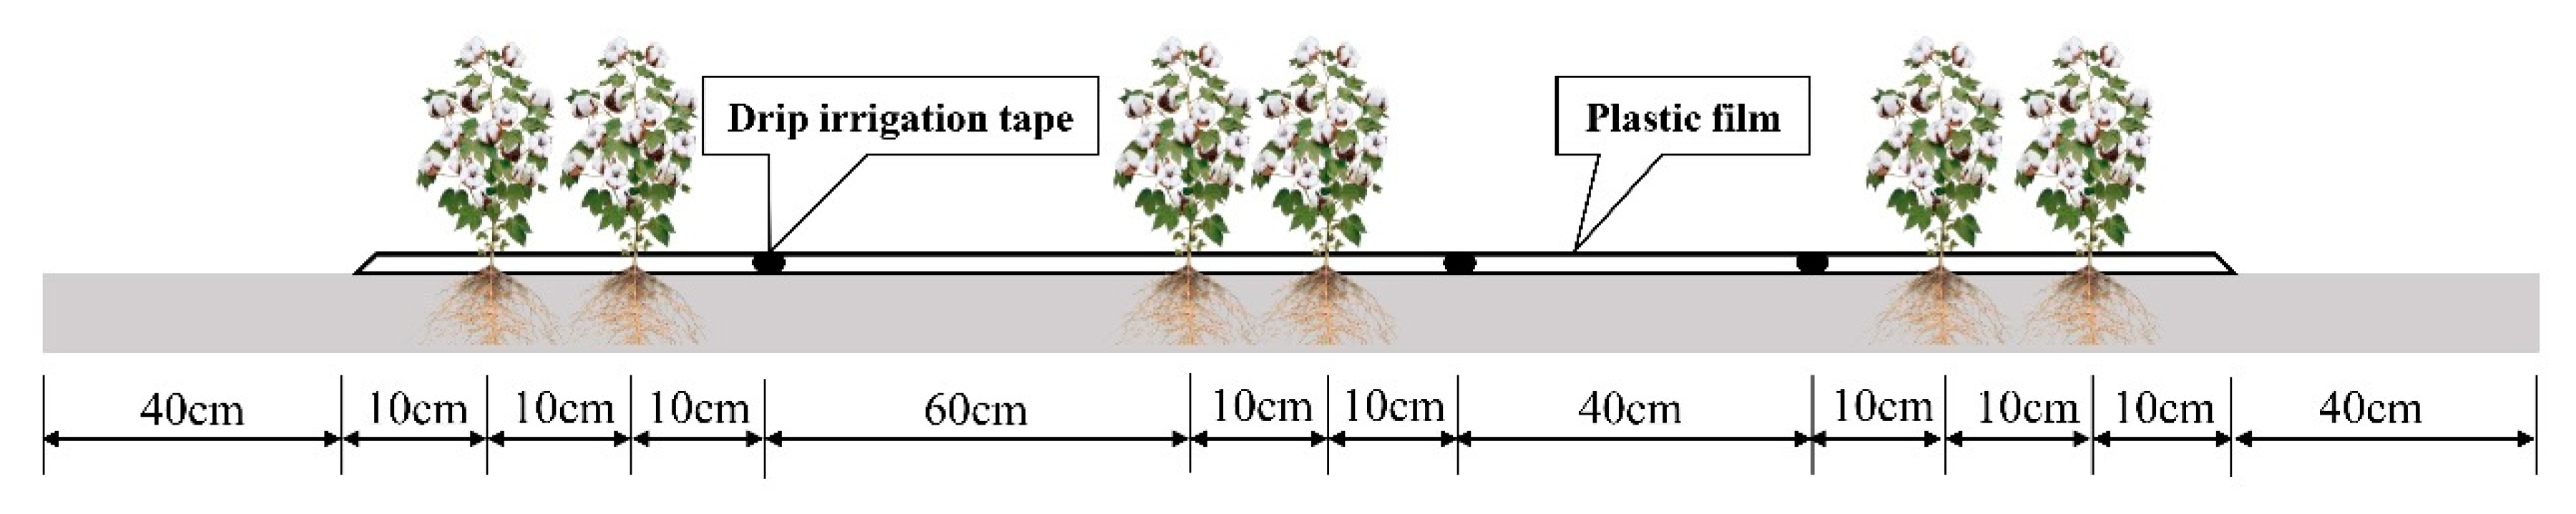
The cotton varieties selected in the experiment were “Chuangza 100” (CZ-100), and the cotton planting pattern was six rows of plants with three irrigation tubes mulched with one plastic film of 1.8 m (
Figure 1). Each plot was 6 m long and 4.4 m wide, with a planting density of 480 plants per plot. Single-wing labyrinth drip irrigation tape was used for irrigation. The diameter of drip irrigation tape was 16 mm, the distance between drip emitters was 0.3 m, and average flow rate of drip emitters was 3.2 L/h. Water meters, ball valves, and fertilizer cans were installed at the beginning of each experimental plot to quantitatively control irrigation and fertilization. Cotton was sown on 22 April 2017 and 25 April 2018, respectively. At the same time, according to the corresponding level of nitrogen application, 30% of nitrogen (10%
15N-urea + 20% conventional urea, nitrogen content of 46.7%.), 100 kg/ha of phosphorus (P
2O
5), and 100 kg/ha of potassium (K
2O) fertilizer were applied in the field as base fertilizer at one time. The remaining 70% of nitrogen fertilizer was applied in the field with water nine times in different growth stages of cotton. The
15N-urea was purchased from Shanghai Research Institute of Chemical Industry, and its abundance was 5.16%.
In the field experiment, cotton water demand was calculated by reference crop evapotranspiration and cotton crop coefficient method. The calculation formulas were as follows:
where,
ETc is water demand of crops in a certain period (mm),
Kc is the crop coefficient corresponding to the growth period and
is the reference crop evapotranspiration for the corresponding period (mm). In this experiment, the
Kc values of seedling, bud, boll, and boll opening stages of cotton were 0.35, 0.76, 1.18, and 0.6, respectively [
11].
Reference crop evapotranspiration (
ET0) was calculated by Penman–Monteith formula recommended by FAO [
12]:
where,
Rn is ground net radiation evaporation equivalent (MJ/m
2/day),
G is soil heat flux (MJ/m
2/day),
γ is a thermometer constant (kPa/°C),
T is average temperature (°C),
V2 is wind speed 2 m above the ground (m/s),
Pa is saturated vapor pressure (kPa),
Pb is the actual vapor pressure (kPa), and Δ is the slope of the temperature-saturated vapor pressure curve (kPa/°C). The parameters in the formula were provided by the Shihezi Meteorological Bureau.
The specific irrigation and nitrogen application settings in the field experiment are shown in
Table 3.
2.3. Monitoring Indicators
2.3.1. LAI
At different growth stages, five cotton plants were randomly selected in each experimental plot to measure the length (L) and width (W) of each leaf with a tape measure. The calculation formula of cotton LAI follows [
13]:
where,
λ is the shape coefficient of cotton leaves (in this experiment,
λ = 1.0 [
14]),
L is blade length (m),
W is blade width (m), and
A is area of land occupied by a single cotton plant (m
2).
2.3.2. Dry Matter Quantity of Cotton
At different growth stages, five cotton plants were randomly selected in each experimental plot, and the plants were separated indoors into roots, stems, leaves, buds, and bolls. The samples were placed in an oven at 105 °C for 30 min, then dried to constant weight at 75 °C, and the dry matter quantity of samples weighed and recorded [
15]. Cotton dry matter per hectare = average dry matter of five cotton plants × planting density per hectare.
2.3.3. Boll Weight and Seed Cotton Yield
Boll weight: During the boll opening stage, 30, 40, and 30 cotton bolls were collected in the upper, middle, and lower parts of each experimental plot. After drying, each boll was weighed and average weight of 100 cotton bolls was taken as the single boll weight.
Yield: During the boll opening stage, the area of length × width = 1.5 m × 4.4 m was selected in each experimental plot, and the cotton plant number and boll number in each area were counted. Cotton yield per area = cotton plant number × boll number × single boll weight. This was converted to yield per hectare [
16].
2.3.4. Cotton Fiber Quality
During the boll opening period, 20 g cotton samples were randomly picked in each experimental plot, and the cotton fiber micronaire value, fiber length, uniformity index, fracture specific strength, and elongation were determined by the Cotton Quality Inspection Center of the Ministry of Agriculture (Urumqi, Xinjiang, China). The cotton fiber detector HVI 1000M 700 was used for testing, and the cotton fiber calibrator HVICC was used for calibration (U.S. Department of Agriculture) [
17,
18].
2.3.5. WUE
In the formula,
Y is seed cotton yield (kg/ha) and
ET is actual water consumption of crops (mm) [
3].
In the formula,
P is precipitation during growth period (mm),
I is irrigation amount (mm), and Δ
W is the change of soil water storage before sowing and after harvesting (mm) [
19]. Before sowing and after harvesting cotton, three locations in each plot were selected to drill soil (0−200 cm) once every 10 cm. The soil moisture content was measured by drying method, and the soil water storage before sowing and after harvesting was calculated [
20].
2.3.6. NUE
The
15N isotope tracer method was used to calculate NUE [
21] with the following formula:
In the formulas, the total nitrogen content of the sample was determined by Kjeldahl method [
22] and
15N abundance was determined by stable isotope mass spectrometer MAT-253 (provided by Institute of Geography and Resources, Chinese Academy of Sciences, Beijing).
2.3.7. Nitrogen Partial Factor Productivity (NPFP)
In the formula,
Y is seed cotton yield (kg/ha) and
NT is the total amount of nitrogen applied (kg/ha) [
20].
2.3.8. Economic Benefit
In the formula,
E is economic benefit,
G is gross profit,
W is the cost of irrigation,
F is the cost of fertilization, and
K is the cost of machinery and materials (all in RMB/ha) [
23].
2.4. Data Processing
The value of each indicator is the average of the data for 2017 and 2018, and the data for each year is the average of three replicates per process. The DPS data processing system (Manufacturer: Zhejiang University, Hangzhou, China) was used for variance analysis (Duncan’s new repolarization method), and MATLAB 2017 (Manufacturer: The company of MathWorks, Natick, Massachusetts, USA) and Origin 2017 (Manufacturer: the company of OriginLab, Northampton, Massachusetts, USA) were used for multiple regression, extremum solution, and drawing graphics.
5. Conclusions
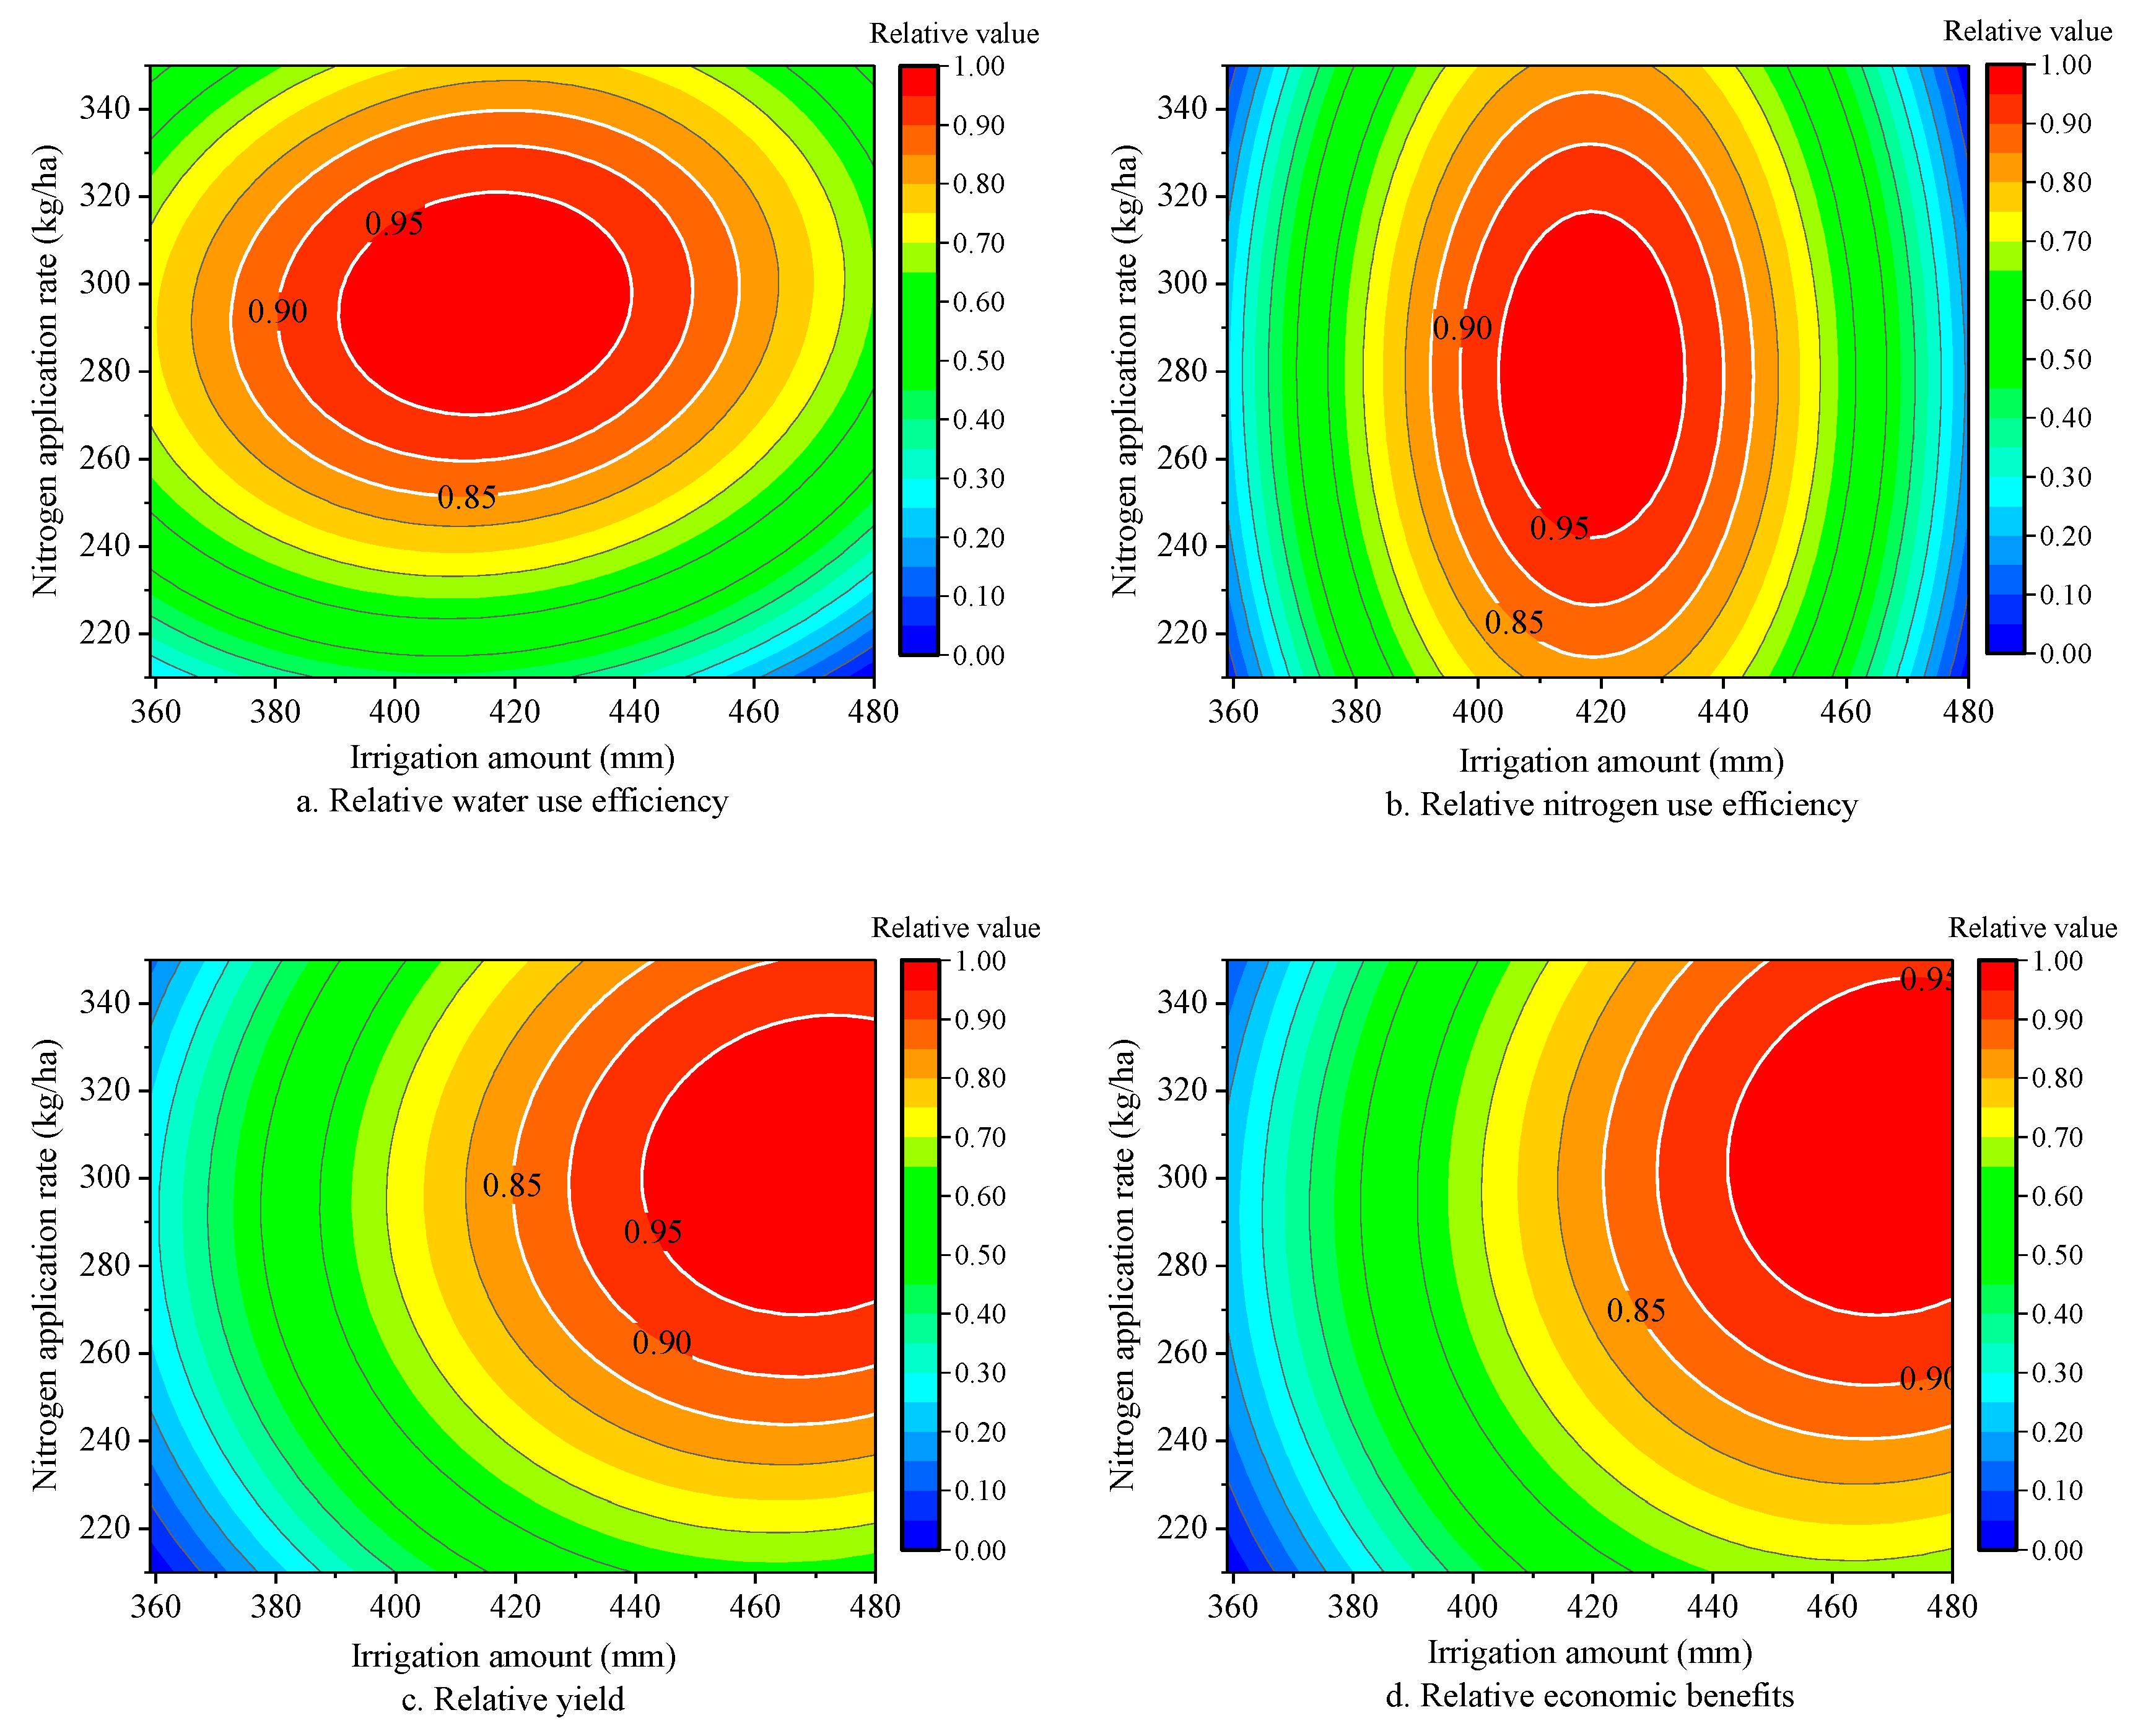
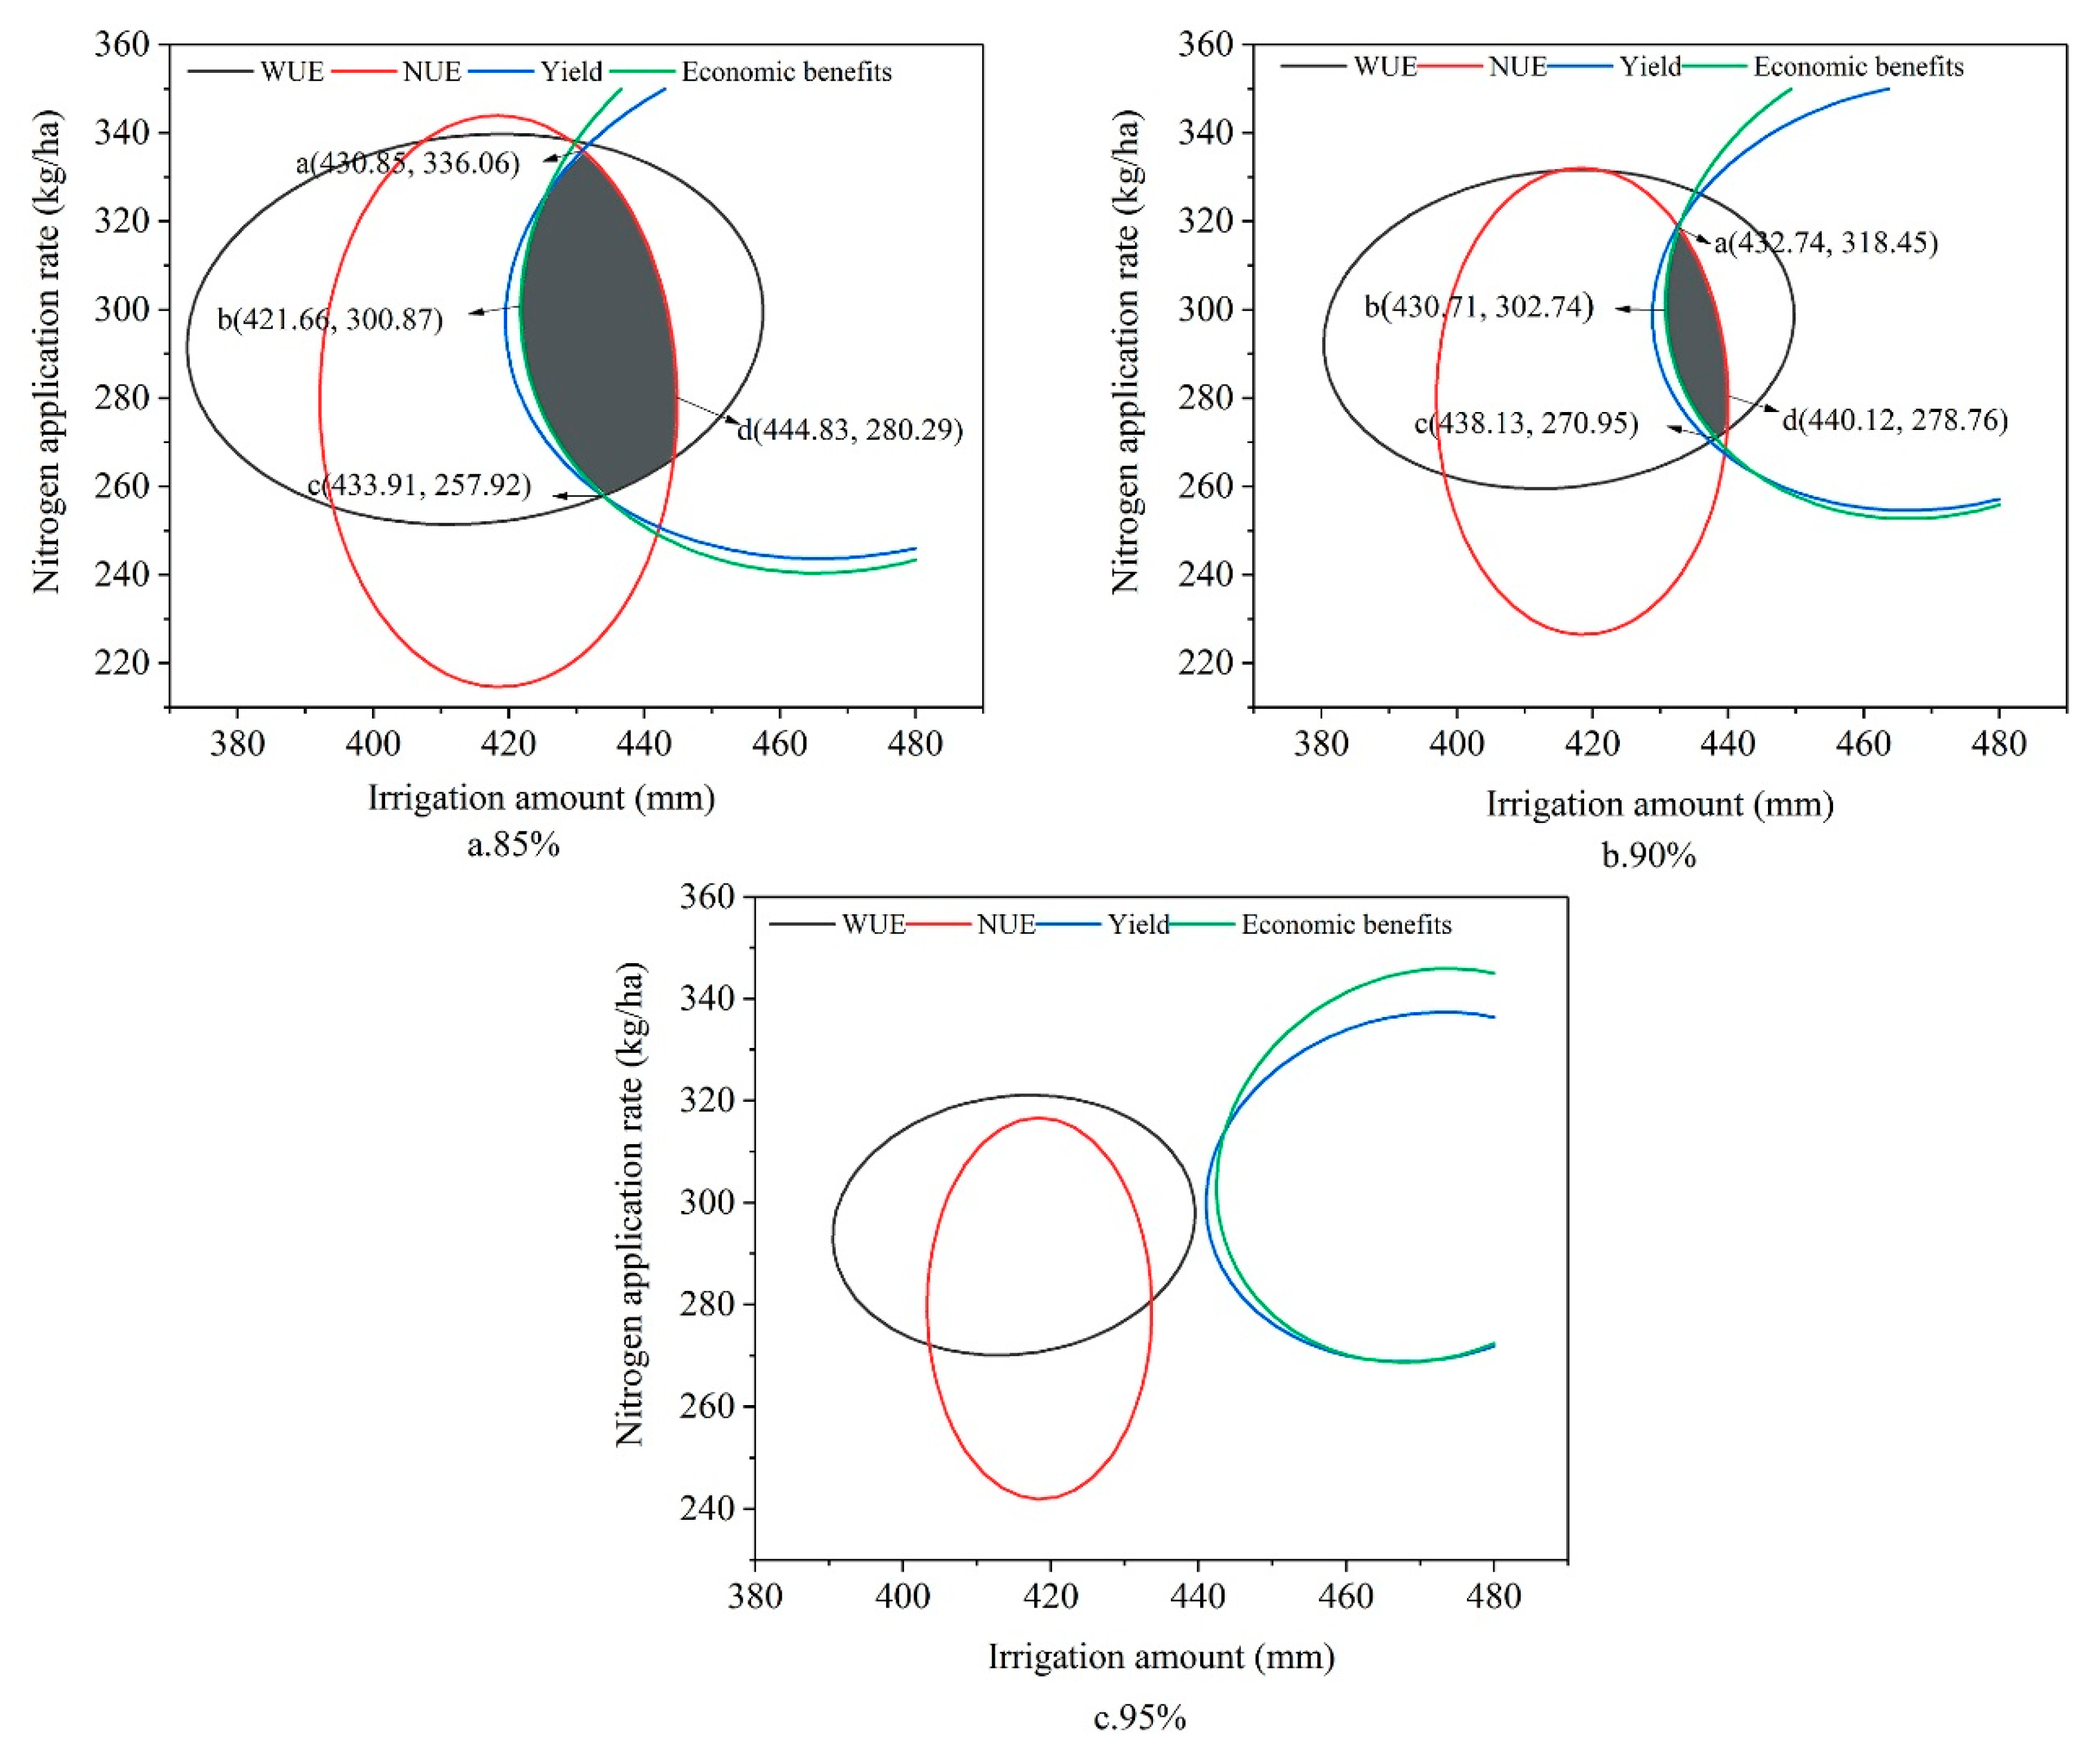
Based on two consecutive years of cotton field experiments, combined with multiple regression and spatial analysis, the quantitative relationship between water and nitrogen input and WUE, NUE, yield, and economic benefits of cotton was established. The conclusions were as follows: The efficient and reasonable water and nitrogen management model in the study area was 430.71–440.12 mm for irrigation and 270.95–318.45 kg/ha for nitrogen application. At these levels, cotton WUE, NUE, yield, and economic benefits could simultaneously exceed 90% of their maxima. These results provide a scientific basis for the effective integrated management of water and fertilizer in cotton fields under mulch drip irrigation in northern Xinjiang.


