Article

Effect of Light Intensity on Rooting and Growth of Hydroponic Strawberry Runner Plants in a LED Plant Factory

1
Key Laboratory of Agricultural Engineering in Structure and Environment in Ministry of Agriculture and Rural Affairs, China Agricultural University, No. 17 Qinghua East Road, Haidian, Beijing 100083, China
2
Texas AgriLife Research and Extension Center at Dallas, Texas A&M University, Dallas, TX 75252, USA
*
Author to whom correspondence should be addressed.
Agronomy 2019, 9(12), 875; https://doi.org/10.3390/agronomy9120875
Submission received: 14 November 2019 / Revised: 2 December 2019 / Accepted: 9 December 2019 / Published: 11 December 2019
(This article belongs to the Special Issue Control of LED Lighting Based on Plant Physiological Principles)

Abstract

:
To rapidly produce strawberry (Fragaria × ananassa Duch. cv. Benihoppe) transplants from cuttings, suitable light intensities for unrooted runner plants at the rooting stage and rooted runner plants at the seedling stage were determined in a plant factory under LED lighting. At the rooting stage, unrooted runner plants at the 3-leaf stage were hydroponically rooted for 6 days under light intensity of 30, 90, 150, and 210 μmol m−2 s−1, respectively. At the seedling stage, rooted runner plants were hydroponically grown for 18 days under light intensity of 90, 180, 270, and 360 μmol m−2 s−1, respectively. The tube LED lights consisting of white and red LED chips were used as sole light source, and photoperiod was controlled as 16 h d−1. The results showed that the maximum root number (7.7) and longest root length (14.8 cm) of the runner plants were found under 90 μmol m−2 s−1 at the rooting stage. Photosynthetic activity in runner plant leaves under 90 μmol m−2 s−1 were higher than that under 30, 150, and 210 μmol m−2 s−1. Higher light intensity at the range of 90–270 μmol m−2 s−1 increased the stomatal conductance of newly formed leaves of rooted runner plants, thus improving the net photosynthetic rate and growth of rooted runner plants at the seedling stage. The crown diameter, shoot and root dry weights, and root to shoot ratio of rooted runner plants increased by 9.7%, 38.8%, 106.1%, and 48.7%, respectively, when the light intensity increased from 90 to 270 μmol m−2 s−1. However, there was no further improvement of runner plant growth under 360 μmol m−2 s−1. Furthermore, no significant difference of increased dry biomass per mole of photons delivered was found between 180 and 270 μmol m−2 s−1. In consideration of transplant quality and economic balance, light intensity of 90 μmol m−2 s−1 at the rooting stage and 270 μmol m−2 s−1 at the seedling stage were suggested for rapidly producing hydroponic strawberry transplants based on unrooted runner plants in the LED plant factory.

1. Introduction

Strawberry (Fragaria × ananassa Duch.) transplants for commercial cultivation are commonly clonally propagated by runner plants around the world. The transplant quality has a marked impact on the yield and quality of the strawberry fruits after transplanting [1]. The strawberry propagation efficiency and the transplant quality are both deeply influenced by various diseases and variable environmental condition in the field [2,3]. In past decade, runner plant propagation in plant factory with artificial lighting has attracted attention among researchers for its advantages of virus-free year-round production [4,5,6,7]. Practically, unrooted runner plants are separated from mother plants and used as cuttings to produce transplants [8,9]. To improve propagation efficiency and uniformity of strawberry transplants in a LED plant factory, He et al. [10] developed a new method of harvesting unrooted runner plants at the 3-leaf stage from a runner chain. High-quality hydroponic strawberry transplants are expected to be rapidly produced by culturing uniform unrooted runner plants in the LED plant factory.
Unrooted runner plants of the strawberry plant can absorb water and nutrition from the mother plant through runners [11]. However, it will become autotrophic, absorbing water and photosynthesizing independently when separated from the runner chain. Normally, light intensity during rooting of vegetative cuttings is purposely kept low to decrease any potential wilting [12]. The adventitious roots of vegetative cuttings are carbohydrate sinks, requiring a supply of carbohydrates from leaves [13]. The moderately high light intensity is beneficial to root development. Olschowski et al. [14] reported that the total root length of Calibrachoa “MiniFamous Neo Royal Blue” cuttings under white LED (4000K) at light intensity of 80 μmol m−2 s−1 was higher than that at 40 μmol m−2 s−1. Unrooted shoot explants derived from in vitro “Festival” strawberry had the higher root number and rooting percentage after being cultured for 30 days under light intensity of 50 μmol m−2 s−1 than 25 μmol m−2 s−1 [15]. Excessive light intensity would damage photosynthetic organs and inhibit photosynthesis and roots [16]. Loach et al. [17] reported that rooting of leafy cuttings of ornamental species grown under fluorescent lights (warm white) were best at light intensity of approximately 90 to 180 μmol m−2 s−1, and inferior at higher light intensity. To our knowledge, little information is available regarding the effect of light intensity on the rooting of unrooted runner plants except that the rooting frequency of “Tochiotome” strawberry cuttings was found to be higher in the dark than that in the light [9].
Biomass accumulation in seedling-plant or rooted cuttings of annual bedding plants tends to be positively correlated with light intensity or daily light integral (DLI) levels during propagation [18,19]. Growth and quality of rooted cuttings of the herbaceous annual plants can be increased by increasing the DLI after callusing under a DLI of 5 mol m−2 d−1 [20,21]. It is well-known that the growth of strawberry runner plants connected with mother plants through runners can be promoted by increasing light intensity [4,5,22]. Miyazawa et al. [23] reported that dry matter accumulation in seed-propagated strawberry seedlings under light intensity of 338 μmol m−2 s−1 was found to be 1.4–1.5 times greater than that under 225 μmol m−2 s−1. It is plausible to suppose that the growth of rooted runner plants can probably be accelerated by increasing the light intensity at the seedling stage if they have developed enough roots to maintain water balance at the rooting stage.
Therefore, the objective of this study was to investigate the effect of light intensity on root development of unrooted runner plants during the rooting stage and growth of rooted runner plants during the seedling stage under LED lighting. The results can be used as a guideline of light environment management to produce strawberry transplants based on unrooted runner plants in the LED plant factory.

2. Materials and Methods

2.1. Propagation of Unrooted Runner Plants

The unrooted runner plants were propagated in an environment-controlled plant factory under LED lighting. Thirty-two strawberry (Fragaria × ananassa Duch. cv. Benihoppe) mother plants, having three leaves and 10 mm of crown diameter, were planted in a vertical hydroponic system consisting of four cultivation beds (120 cm × 90 cm × 7 cm) and one solution tank. Each cultivation bed held eight mother plants in the central region. The standard strength nutrient solution based on the Yamazaki strawberry formula [24] with EC of 0.6–0.8 mS cm−1 and pH of 6.0–6.5 was continuously recirculated (5.5 L min−1) between cultivation beds and the solution tank. The liquid level in the cultivation bed was maintained at roughly 2 cm. The nutrient solution was renewed every 7 days during the experiment. Light intensity of 250 μmol m−2 s−1 and the photoperiod of 16 h d−1 were provided by tube LED lights consisting of white and red LED chips (WR-LED5/1-16W, Beijing Lighting Valley Technology Company, China). Light intensity was measured at the canopy of mother plants by using a portable light meter (LI-250A, LI-COR Biosciences Inc., Lincoln, NE, USA). Spectral distribution of the LED light was measured in wavebands ranging from 300 nm to 800 nm at 15 cm below the light by using a fiber spectrometer (AvaField-2; Avantes Inc., Apeldoorn, The Netherland). The photon flux of LED lighting was composed of 0.1% ultraviolet light (300–399 nm), 24.7% blue light (400–499 nm), 43.6% green light (500–599 nm), 29.7% red light (600–699 nm), and 1.9% far red light (700–800 nm), respectively. Air temperature in the growth chamber was maintained at 25 ± 1 °C/20 ± 1 °C during the photoperiod and dark period, respectively. Average daily relative humidity was controlled at 75 ± 5%. CO2 concentration was maintained at 800 ± 50 μmol mol−1 during photoperiod and without control during dark period.

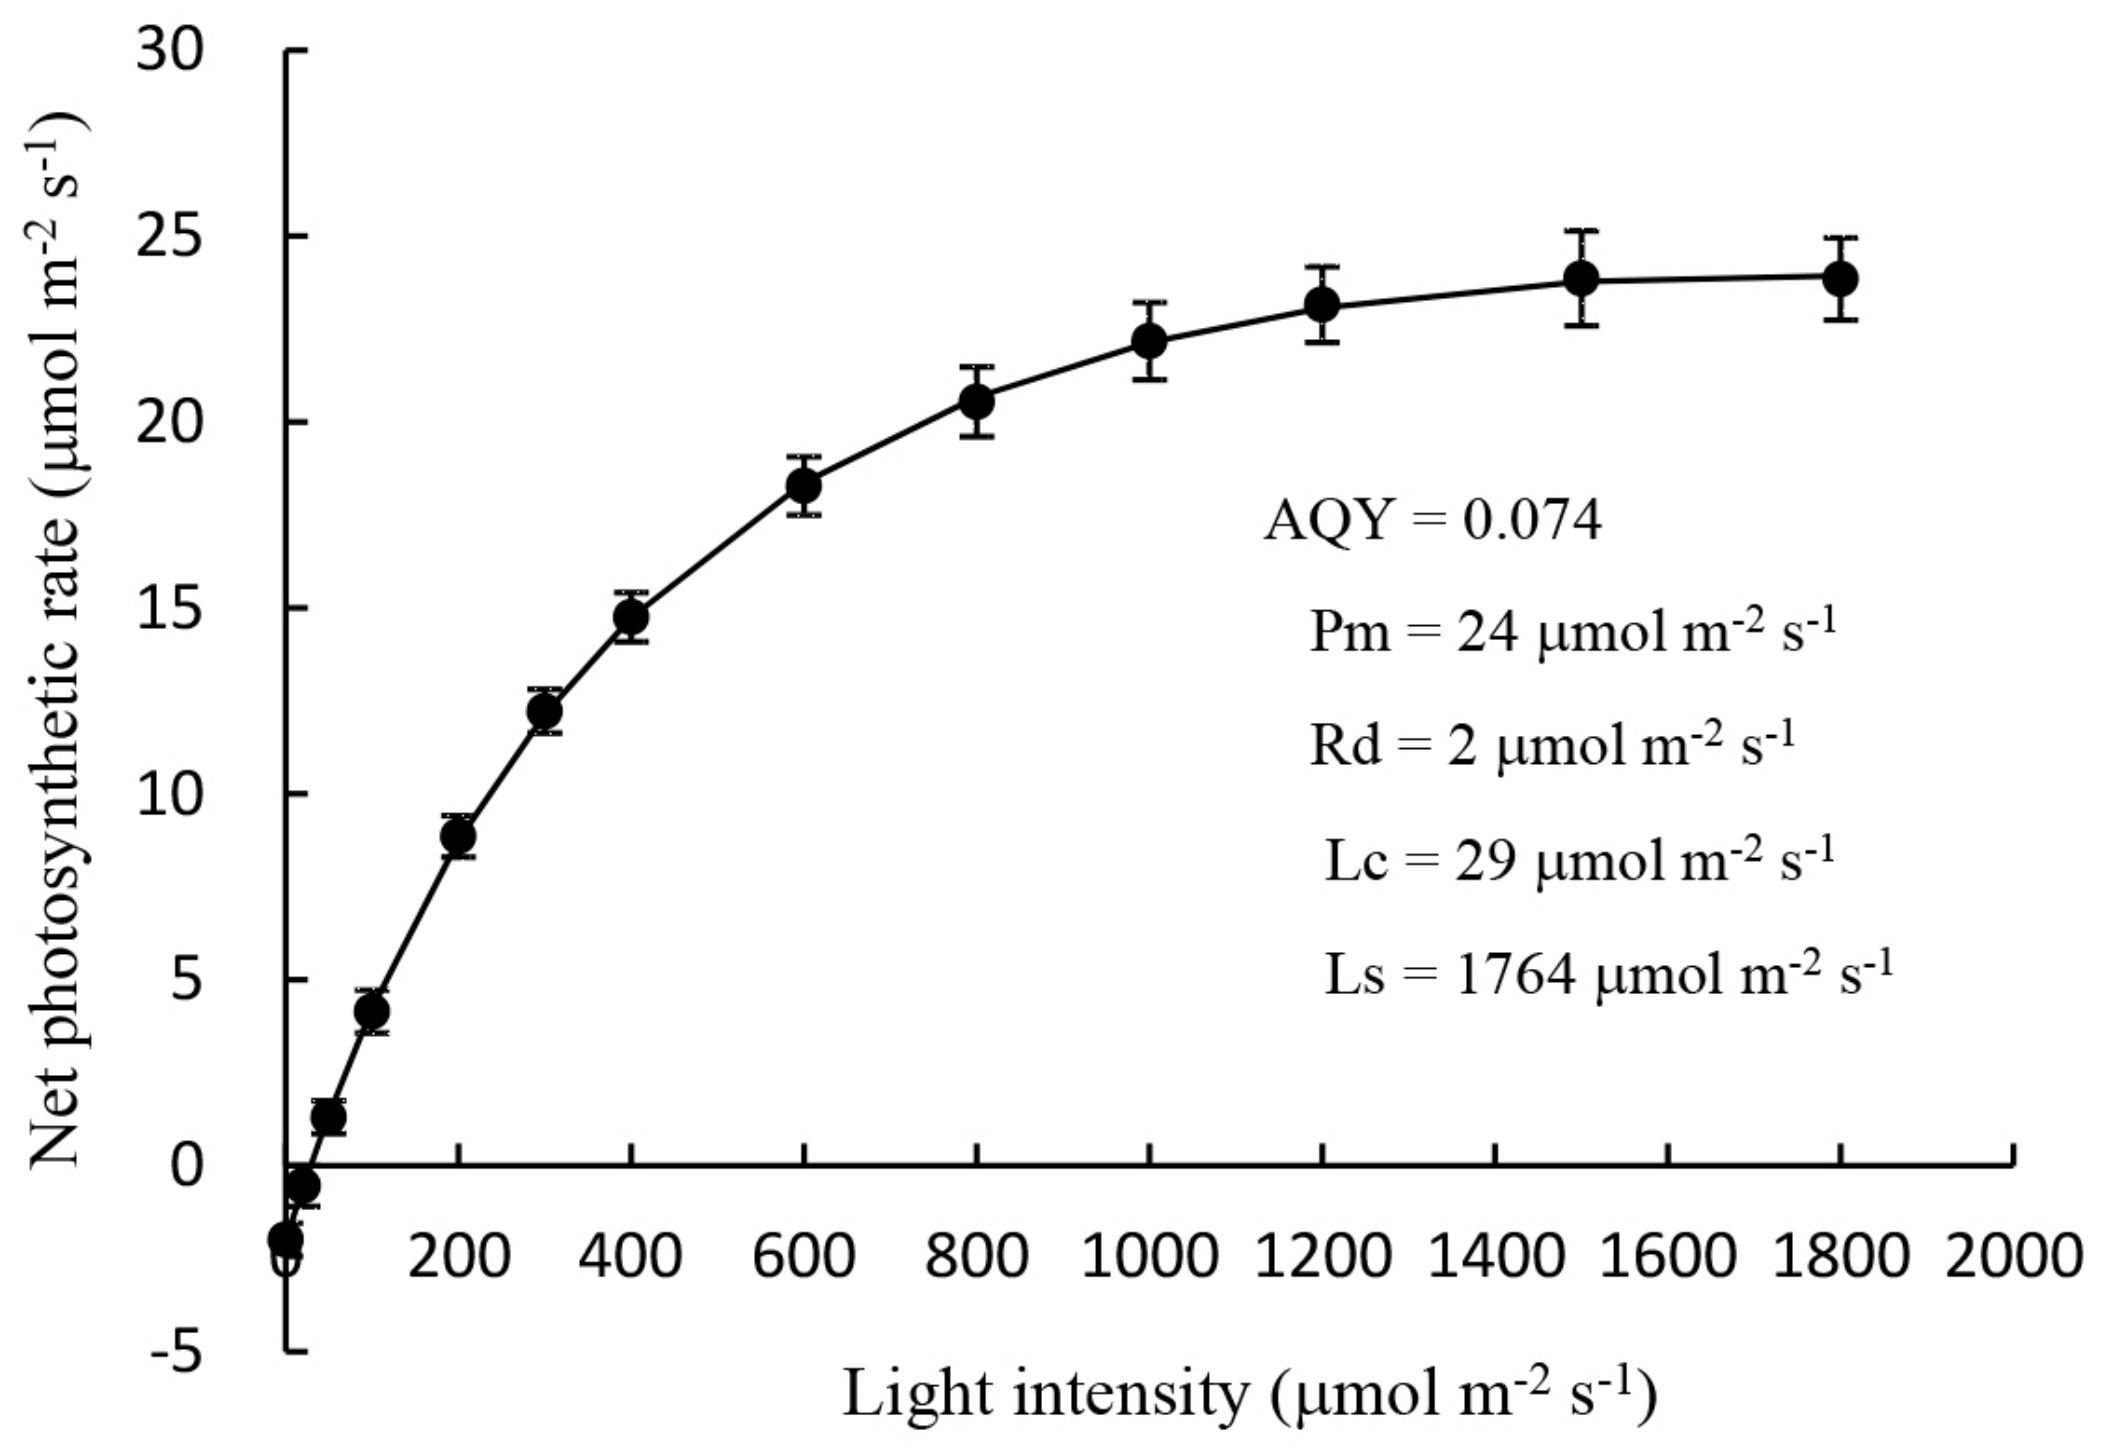
2.1.1. Measurement of the Light Response Curve of Mother Plants

A portable photosynthesis system (LI-6400XT, LI-COR Biosciences Inc., Lincoln, NE, USA) equipped with a leaf chamber with 6400-02B LED light was used to measure the light response curve of mother plants. The measurement was conducted on the middle blade of third newly developed trifoliate leaf numbered from the canopy center of five mother plants. The automatic measurement mode was applied. In the leaf chamber, the light intensity was set as follows: 1800, 1500, 1200, 1000, 800, 600, 400, 300, 200, 100, 50, 20, 0 μmol m−2 s−1, temperature and CO2 concentration were controlled at 25 °C and 800 μmol mol−1, respectively. The modified model of rectangular hyperbola [25] was used to fit the relationship between light intensity and net photosynthetic rate. The apparent quantum yield (AQY), maximum net photosynthetic rate (Pm), rate of dark respiration (Rd), compensation light (Lc), and saturation light (Ls) were calculated according to the model.

2.1.2. Harvest of Unrooted Runner Plants

Runners produced by mother plants horizontally crept on the cultivation bed. The crown of the runner plants did not touch the nutrient solution to prevent it from developing primary roots. The unrooted runner plants at the 3-leaf stage were harvested at 25 days and 35 days after planting the mother plants, by the method described by He et al. [10]. They were used in the rooting and growing experiments, respectively.

2.2. Effect of Light Intensity on Rooting of Unrooted Runner Plants at the Rooting Stage

Thirty-six unrooted runner plants were clamped with sponges (25 mm × 25 mm × 25 mm) and cultured in hydroponic cultivation beds in the LED plant factory for 6 days. The LED lights used for mother plants were utilized as the light source. The compensation light of strawberry leaves was around 30 μmol m−2 s−1 according to the light response curve of the mother plants (Figure 1). Therefore, we set the lowest light intensity of 30 μmol m−2 s−1 for runner plants at rooting stage. Four levels of light intensity at 30, 90, 150, and 210 μmol m−2 s−1 were set at canopy of runner plants by changing the number and location of LED lights. The photoperiod was 16 h d−1. Each treatment consists of nine plants with plant spacing of 8 cm. The half-strength nutrient solution based on the Yamazaki strawberry formula with the EC of 0.3–0.4 mS cm−1 and pH of 6.0–6.5 was applied. The air temperature, relative humidity, CO2 concentration in the LED plant factory were controlled as that described above. The root development, photosynthetic parameters, chlorophyll fluorescence parameters, and chlorophyll content of cuttings were determined at the end of the rooting stage.

2.2.1. Root Development

Six cuttings in each treatment were randomly selected to evaluate the root development. The number of primary roots of each cutting was counted. The length of each primary root was measured using a ruler, and total root length per plant was calculated.

2.2.2. Photosynthetic Parameters

The photosynthetic parameters, including net photosynthetic rate (Pn), transpiration rate (Tr), stomatal conductance (Sc), intercellular CO2 concentration (Ci) were measured using a portable photosynthesis system (LI-6400XT, LI-COR Biosciences Inc., Lincoln, NE, USA) equipped with a leaf chamber with 6400-02B LED light. The water use efficiency (WUE) was equal to the ratio of Pn and Tr [26]. The measurement object is the middle blade of third fully expanded trifoliate leaf numbered from the canopy center of each plant, which was also used for the following measurement of chlorophyll fluorescence parameters and chlorophyll content. In the leaf chamber, light intensity, air temperature, and CO2 concentration in the leaf chamber were set at 300 μmol m−2 s−1, 25 °C, and 800 μmol mol−1, respectively.

2.2.3. Chlorophyll Fluorescence Parameters

The OJIP fast fluorescence induction curves of the leaves were measured using a multi-function plant efficiency analyzer (M-PEA, Hansatech Instruments Ltd., Norfolk, UK). The potential maximum photochemical efficiency of PSII (Fv/Fm) and performance index based on absorption of light energy (PIabs) were calculated according to JIP-Test [27]. The leaves were under dark treatment for 30 min before measurement. The saturated pulsed red light intensity was set to 5000 μmol m−2 s−1 and duration time was 2 s.

2.2.4. Chlorophyll Content

The 50 mg fresh tissues of each leaf was extracted in 10 mL 80% (v/v) acetone for 48 h in the dark. The absorbance of extracting solution at 663 nm and 645 nm were measured by a spectrophotometer (UV-3150, Shimadzu Corporation, Kyoto, Japan). Chlorophyll content was calculated according to Arnon’s equations [28].

2.3. Effect of Light Intensity on Growth of Rooted Runner Plants at the Seedling Stage

Seventy unrooted runner plants were rooted under 90 μmol m−2 s−1 for 6 days by the same method described above. Then the six rooted runner plants were randomly selected to determine the average initial fresh and dry weights. The other sixty-four rooted runner plants were divided equally into four groups under four levels of light intensity at 90, 180, 270, and 360 μmol m−2 s−1 with the photoperiod of 16 h d−1 corresponding to the DLI of 5.2, 10.4, 15.6, and 20.8 mol m−2 d−1, respectively, and cultured for 18 days. The standard strength nutrient solution based on the Yamazaki strawberry formula with the EC of 0.6–0.8 mS cm−1 and pH of 6.0–6.5 was used and renewed every 7 days during the experiment. The growth characteristics, photosynthetic parameters, chlorophyll fluorescence parameters, and chlorophyll content of runner plants were determined at the end of the seedling stage.

2.3.1. Growth Characteristics

Six runner plants in each treatment were randomly selected to evaluate the growth characteristics, including crown diameter, leaf number, fresh and dry weights. A digital vernier caliper was used to measure the crown diameter. The leaf number was determined based on the number of fully expanded trifoliate leaves. The fresh weights of shoot and root were measured, respectively, and then dried in an oven at a temperature of 105 °C for 3 h and subsequent 70 °C until constant weight for measuring dry weights. The root to shoot ratio was calculated based on the dry weight.

2.3.2. Photosynthetic Parameters, Chlorophyll Fluorescence Parameters, and Chlorophyll Content

The photosynthetic parameters, chlorophyll fluorescence parameters, and chlorophyll content of runner plants were determined by the method described above except for the fact that the light intensity in the leaf chamber was set at 400 μmol m−2 s−1 during the measurement of photosynthetic parameters.

2.3.3. Photon Yields of Fresh and Dry Biomass

The photon yields of fresh and dry biomass were determined to evaluate the light use efficiency of runner plants at the seedling stage. The photon yield (PY, g mol−1) means fresh or dry weight increase per mole of photons delivered during the cultivation period, which was calculated as:
P Y = W 2 W 1 × D D L I × N
where W2 (g per plant) is the final fresh or dry weight per runner plant; W1 (g per plant) is the average initial fresh or dry weight of runner plants; D (plants m−2) is the plant density; DLI is the daily light integral at canopy of runner plants; N is days of cultivation at seedling stage.

2.4. Statistical Analysis

Statistical analysis was performed using SPSS 21.0 (IBM, Inc., Chicago, IL, USA). Treatment means were separated by an analysis of variance (ANOVA) followed by Tukey’s multiple range test at p ≤ 0.05 (n = 6). The regression analysis between photon yield and DLI was performed using Microsoft Excel 2013 software (Microsoft Corporation, Redmond, WA, USA).

3. Results and Discussion

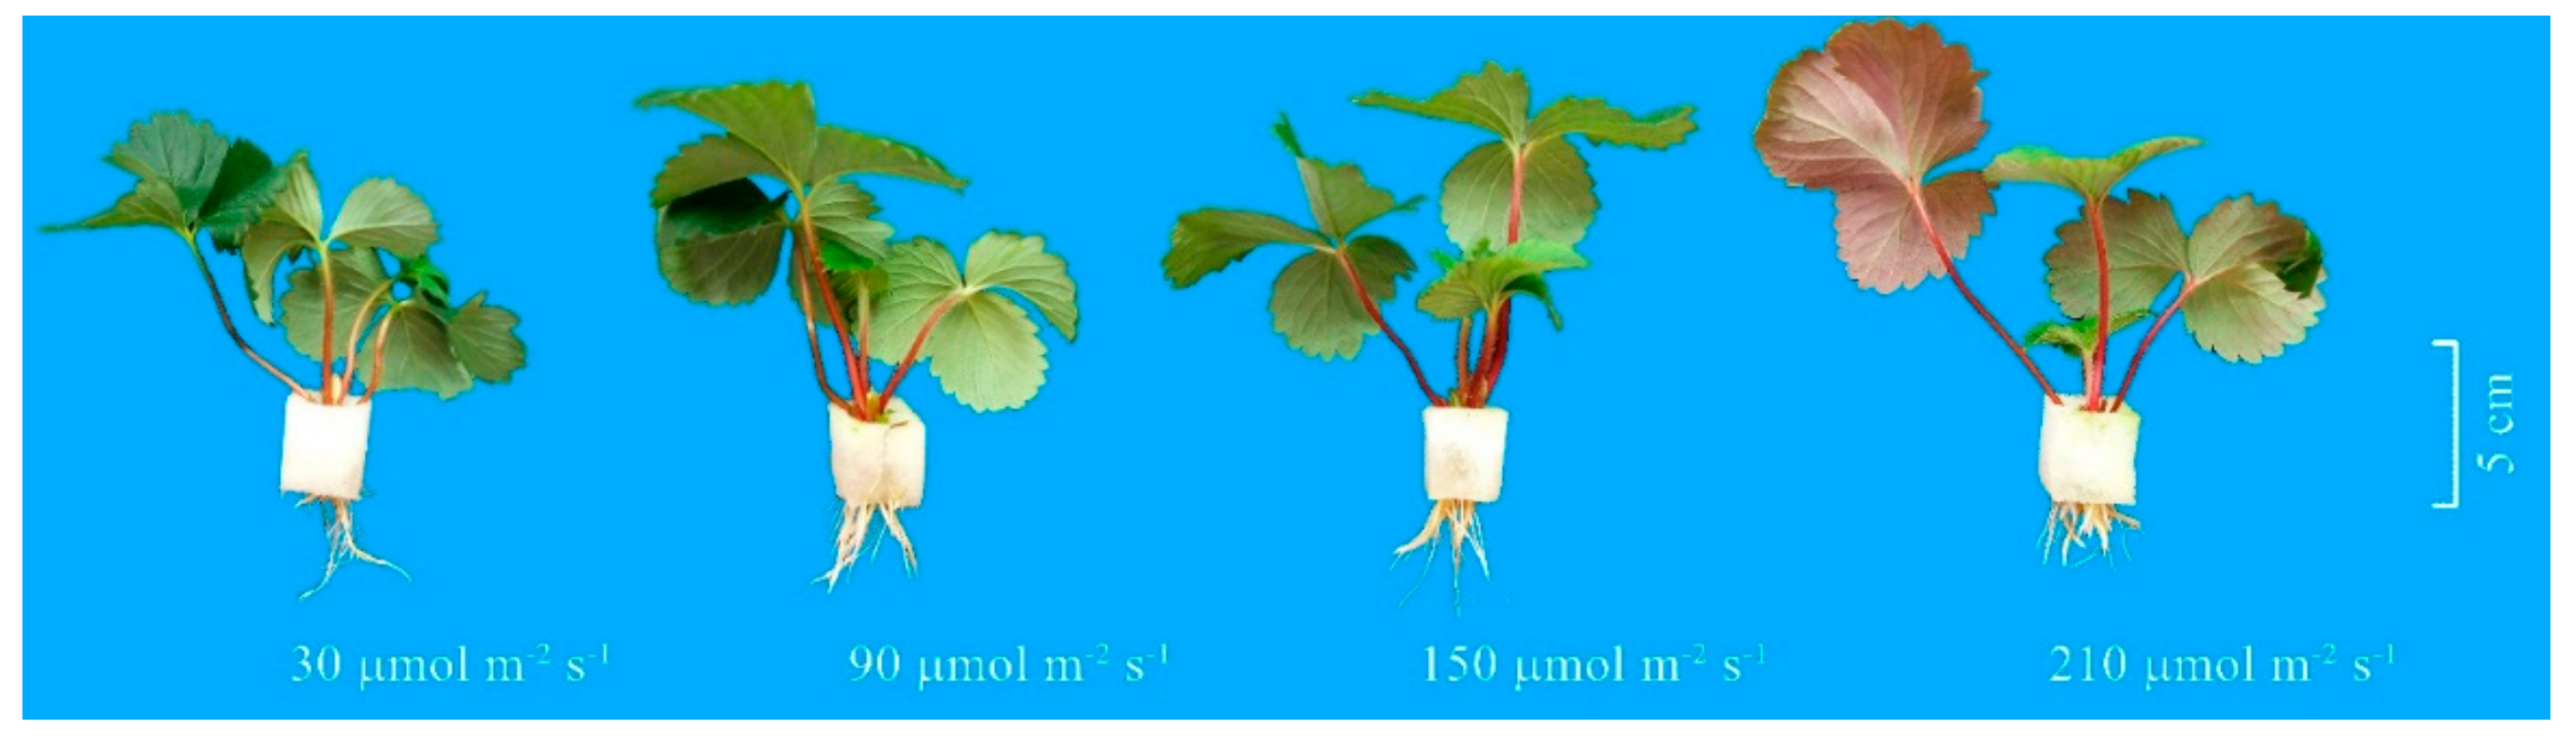
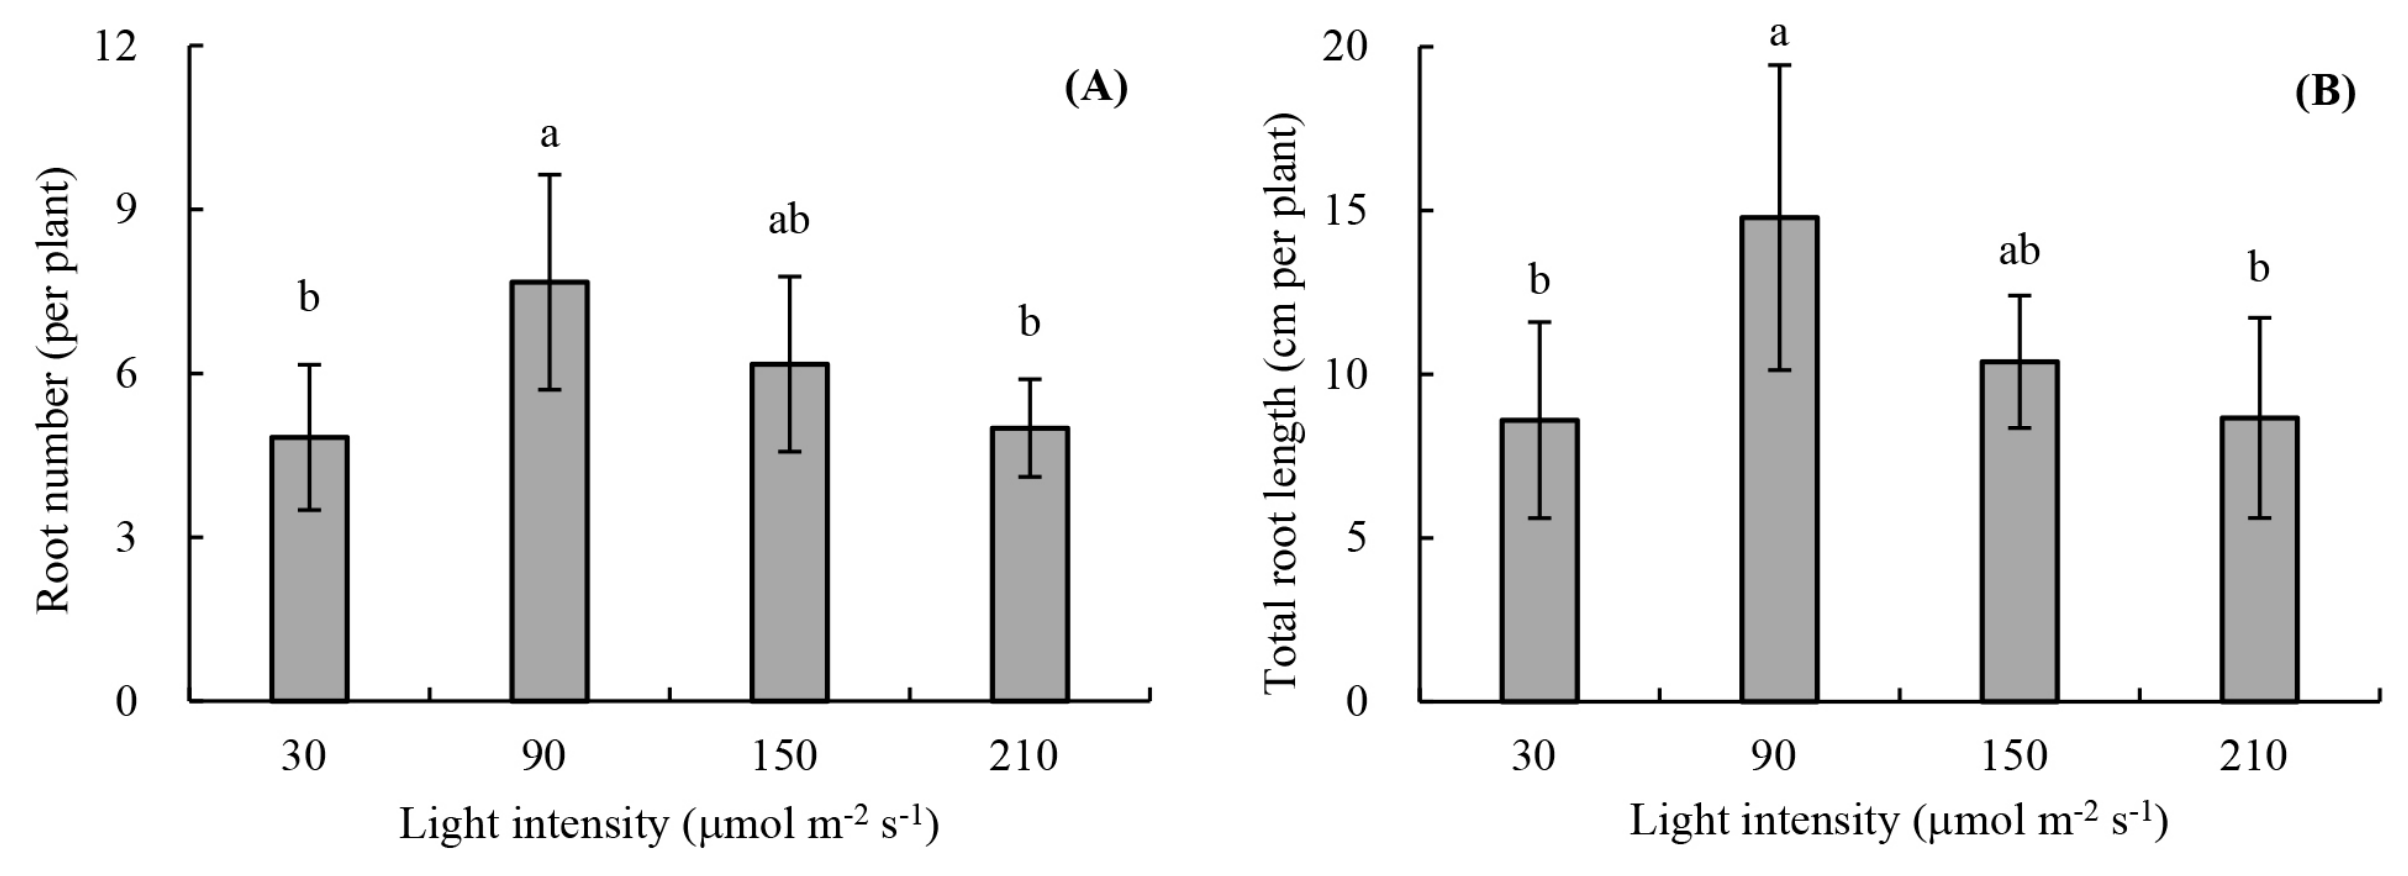
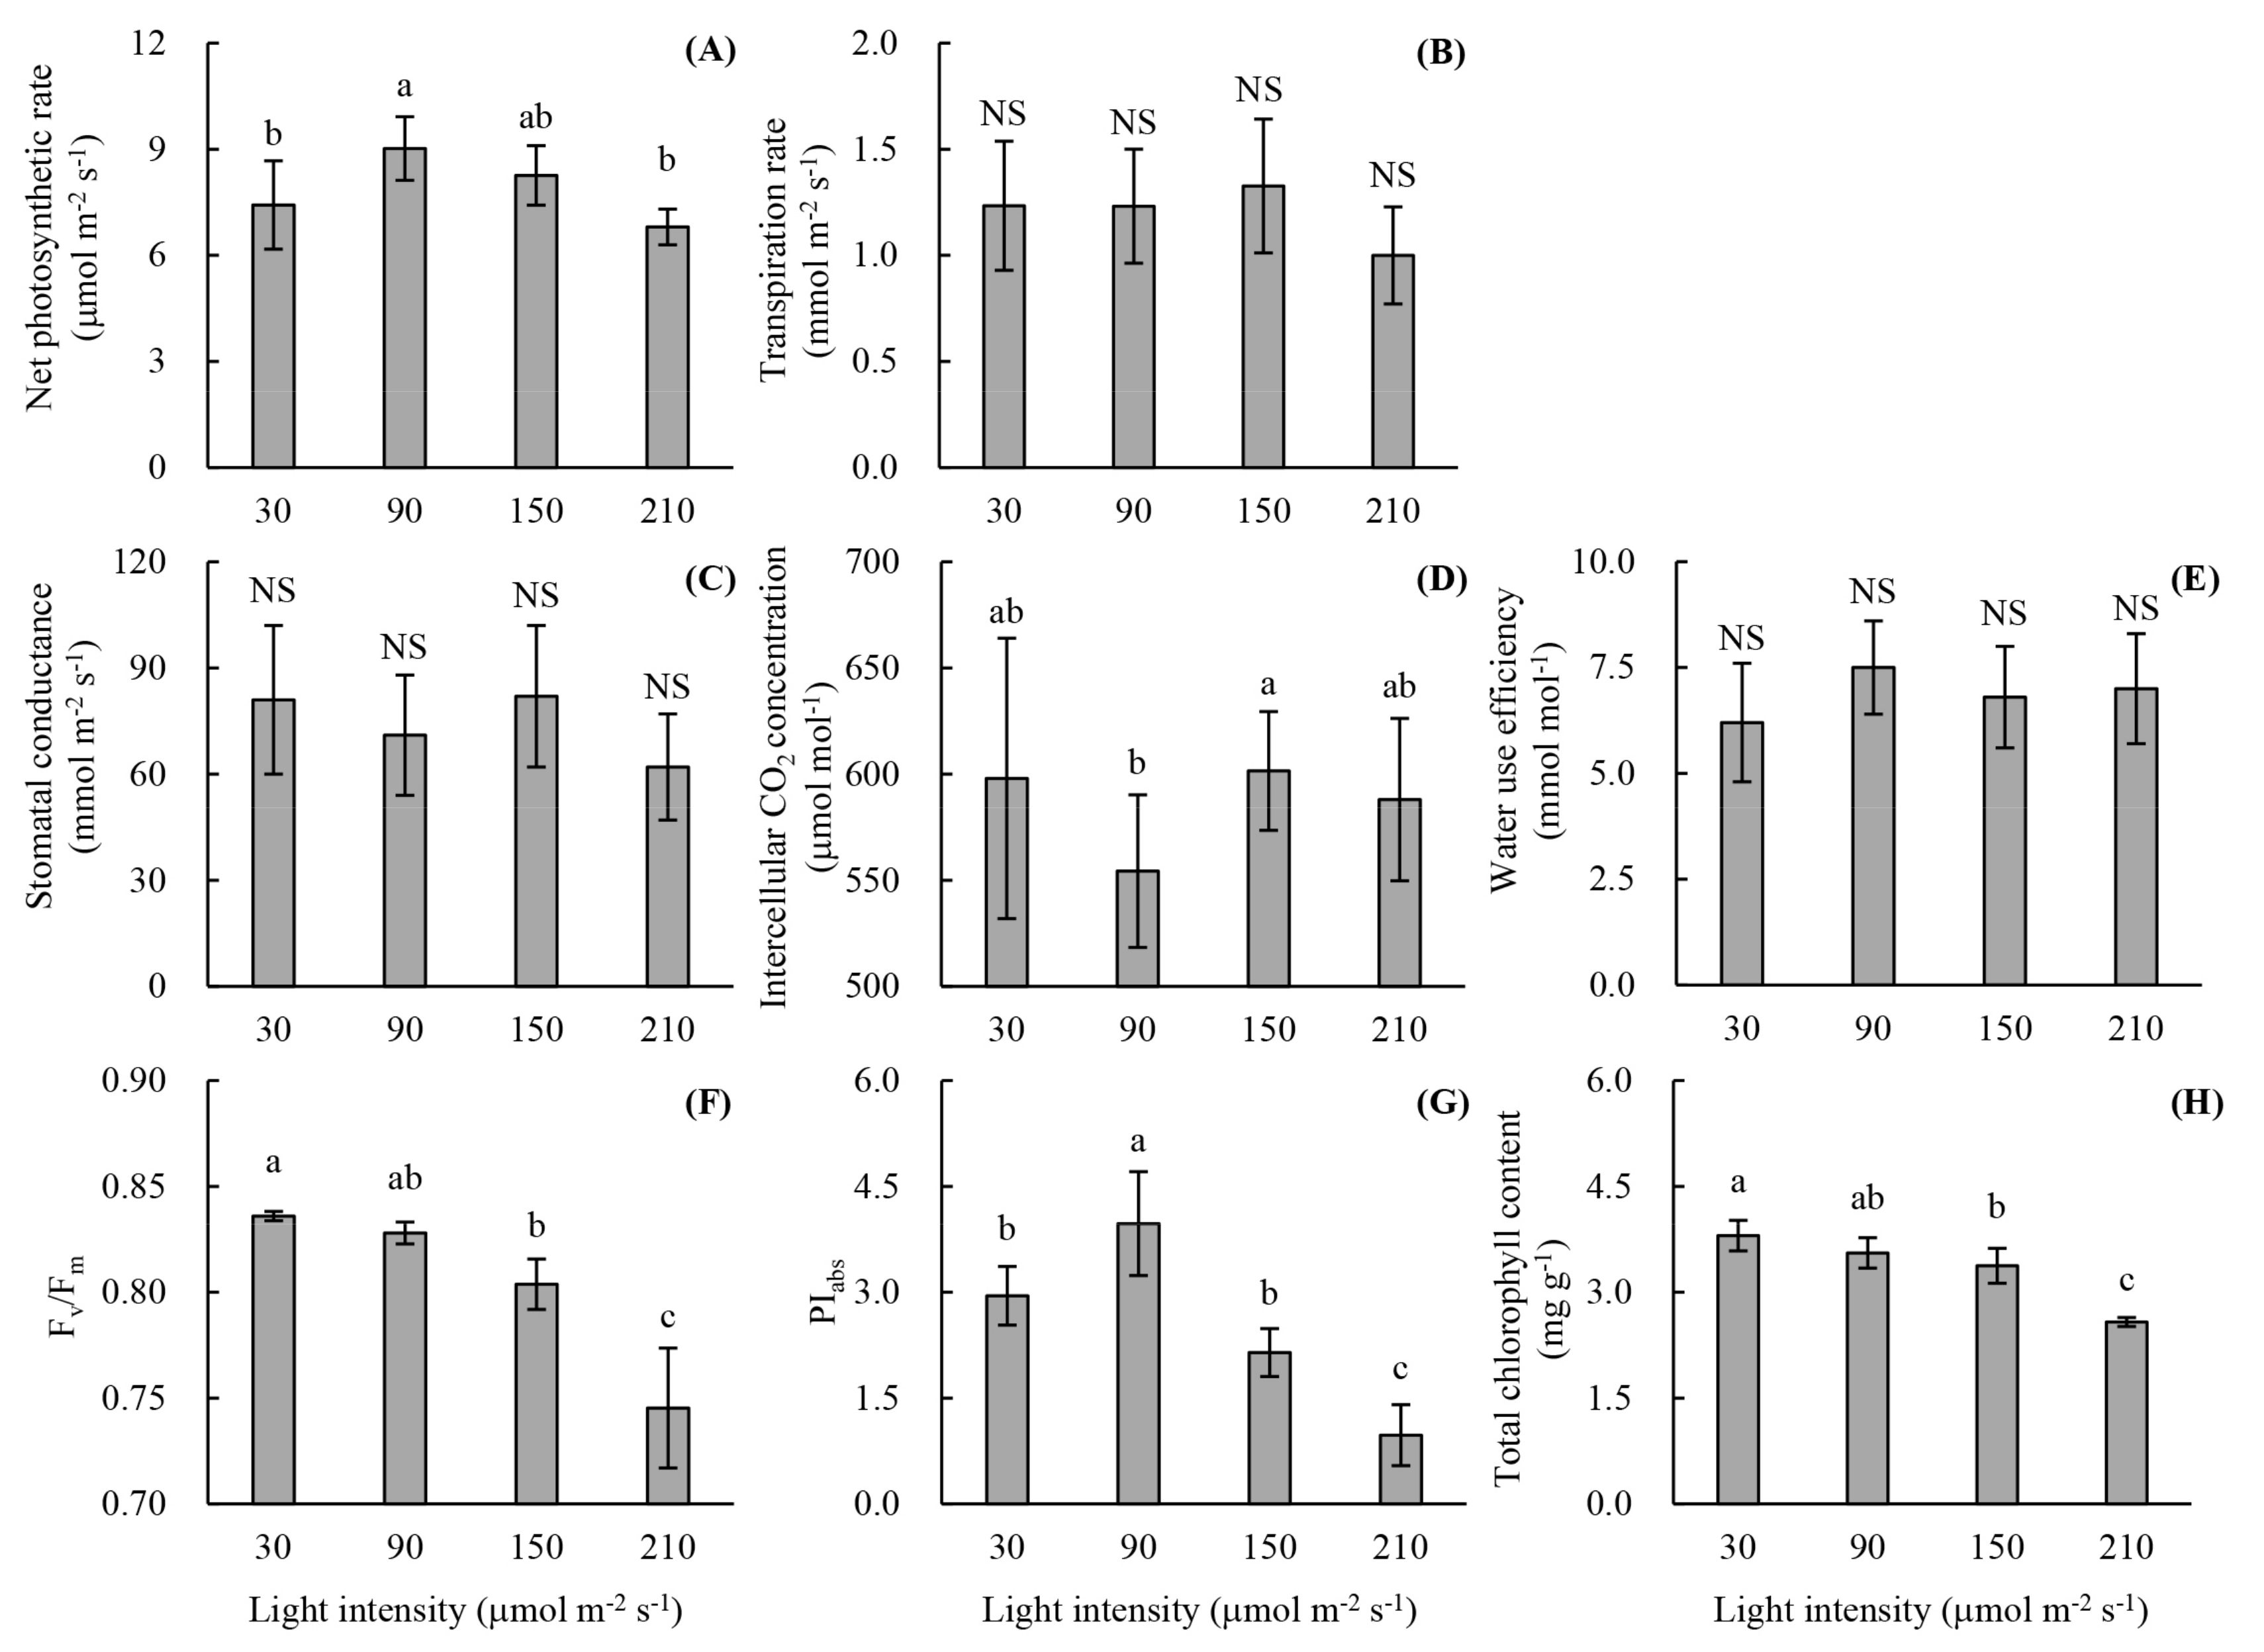
3.1. Root Development and Leaf Photosynthetic Activity of Unrooted Runner Plants as Affected by Light Intensity at the Rooting Stage

Root development of strawberry cuttings was significantly affected by the light intensity. The primary roots of runner plants under 30 μmol m−2 s−1 looked very slender than that under higher light intensity (Figure 2). The root number (7.7) and total root length (14.8 cm) of the runner plants were found to be maximum under 90 μmol m−2 s−1 (Figure 3). Saito et al. [9] reported that the rooting frequency of “Tochiotome” strawberry cuttings was higher in the dark than in the light. However, our results indicated that the root number and total root length of runner plants under 90 μmol m−2 s−1 increased by 58.8% and 71.9%, respectively, compared to that under 30 μmol m−2 s−1. Similar results reported that unrooted shoot explants derived from in vitro “Festival” strawberry had the higher root number and rooting percentage after being cultured for 30 days under light intensity of 50 μmol m−2 s−1 than 25 μmol m−2 s−1 [15]. The developing adventitious roots of vegetative cuttings are carbohydrate sinks, requiring minimum energy for root development [13]. It was reported that the total root length of Calibrachoa “MiniFamous Neo Royal Blue” cuttings under light intensity of 80 μmol m−2 s−1 was higher than that under 40 μmol m−2 s−1 [14]. Root dry weight of Petunia × hybrida cuttings rooted for 16 days increased by 452% as the DLI increased from 1.2 to 3.9 mol m−2 d−1, corresponding to the light intensity from 20 to 68 μmol m−2 s−1 with a photoperiod of 16 h d−1 [29].
Nonetheless, root number of runner plants under 150 and 210 μmol m−2 s−1 decreased by 19.5% and 35.1%, respectively, compared with that under 90 μmol m−2 s−1 (Figure 3A). The total root length of runner plants under 150 and 210 μmol m−2 s−1 decreased by 29.7% and 41.2%, respectively, compared with that under 90 μmol m−2 s−1 (Figure 3B). Similar trends were found in the rooting of leafy cuttings of ornamental species, for example, that rooting of Forsythia × intermedia “Lynwood” and Weigela florida “Variegata” were best under light intensity of 90 and 180 μmol m−2 s−1 but inferior at the higher light intensity [17].
The relationship between root development and light intensity can be explained by the various photosynthetic activity of leaves. The Pn of runner plants under 90 μmol m−2 s−1 were higher than that under 30 μmol m−2 s−1 (Figure 4A). We inferred that the higher light intensity contributed to higher photosynthates and thus promoted root development of runner plants in this study. However, runner plants under 210 μmol m−2 s−1 had a decreased Pn compared to that under 90 μmol m−2 s−1. The purple-red leaves of runner plants were observed under the light intensity of 210 μmol m−2 s−1 (Figure 2). The total chlorophyll content of runner plants under 210 μmol m−2 s−1 decreased by 32.1% compared with that under 30 μmol m−2 s−1 (Figure 4H). The Ci showed an opposite tendency of Pn (Figure 4D). No significant differences in the Tr, Sc, and WUE were found under four levels of light intensity (Figure 4B,C,E). The opposite trend of Pn and Ci indicated that the decreases in Pn of runner plants under 30 and 210 μmol m−2 s−1 were due to the decrease of photosynthetic activity of mesophyll cells, instead of stomatal limitation [30].
The Fv/Fm was used as a stress indicator of strawberry leaves for its sensitivity to early stress responses [31]. No significant difference in Fv/Fm of the leaves of runner plants under 30 and 90 μmol m−2 s−1 was found (Figure 4F); however, it decreased significantly under 150 and 210 μmol m−2 s−1. The PIabs is more sensitive than Fv/Fm, which is a multi-parameter expression involving the three main functional steps of photosynthetic activity [32,33]. PIabs of the leaves of runner plants under 90 μmol m−2 s−1 was higher by 34.6%, 84.6%, and 309.3%, respectively, compared with that under 30, 150, and 210 μmol m−2 s−1 (Figure 4G). The light intensity lower or higher than 90 μmol m−2 s−1 indeed had a negative effect on the photosynthetic activity of leaves in our study. Therefore, rooting of unrooted runner plants can be promoted by increasing light intensity to 90 μmol m−2 s−1.

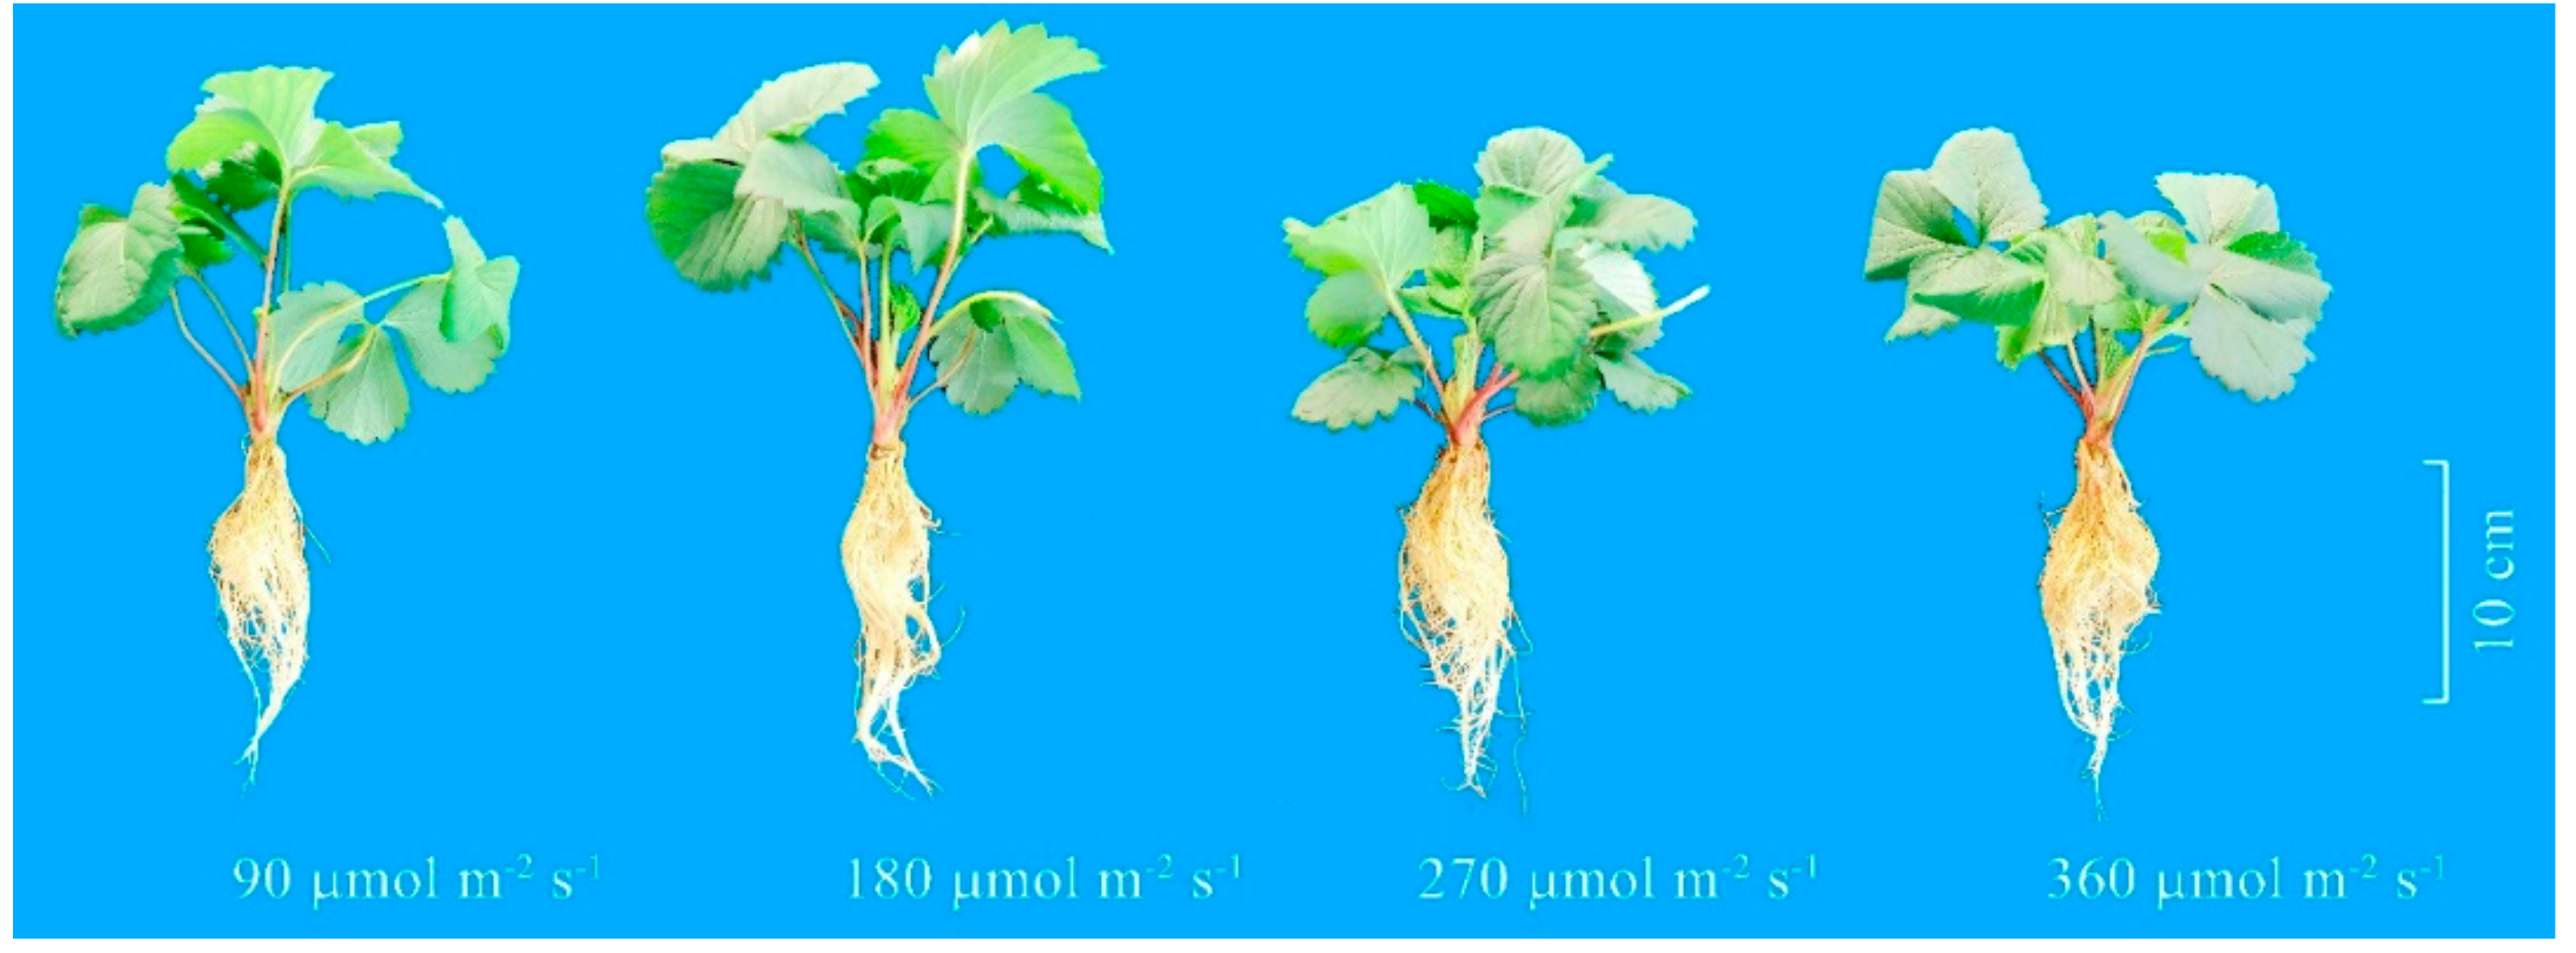
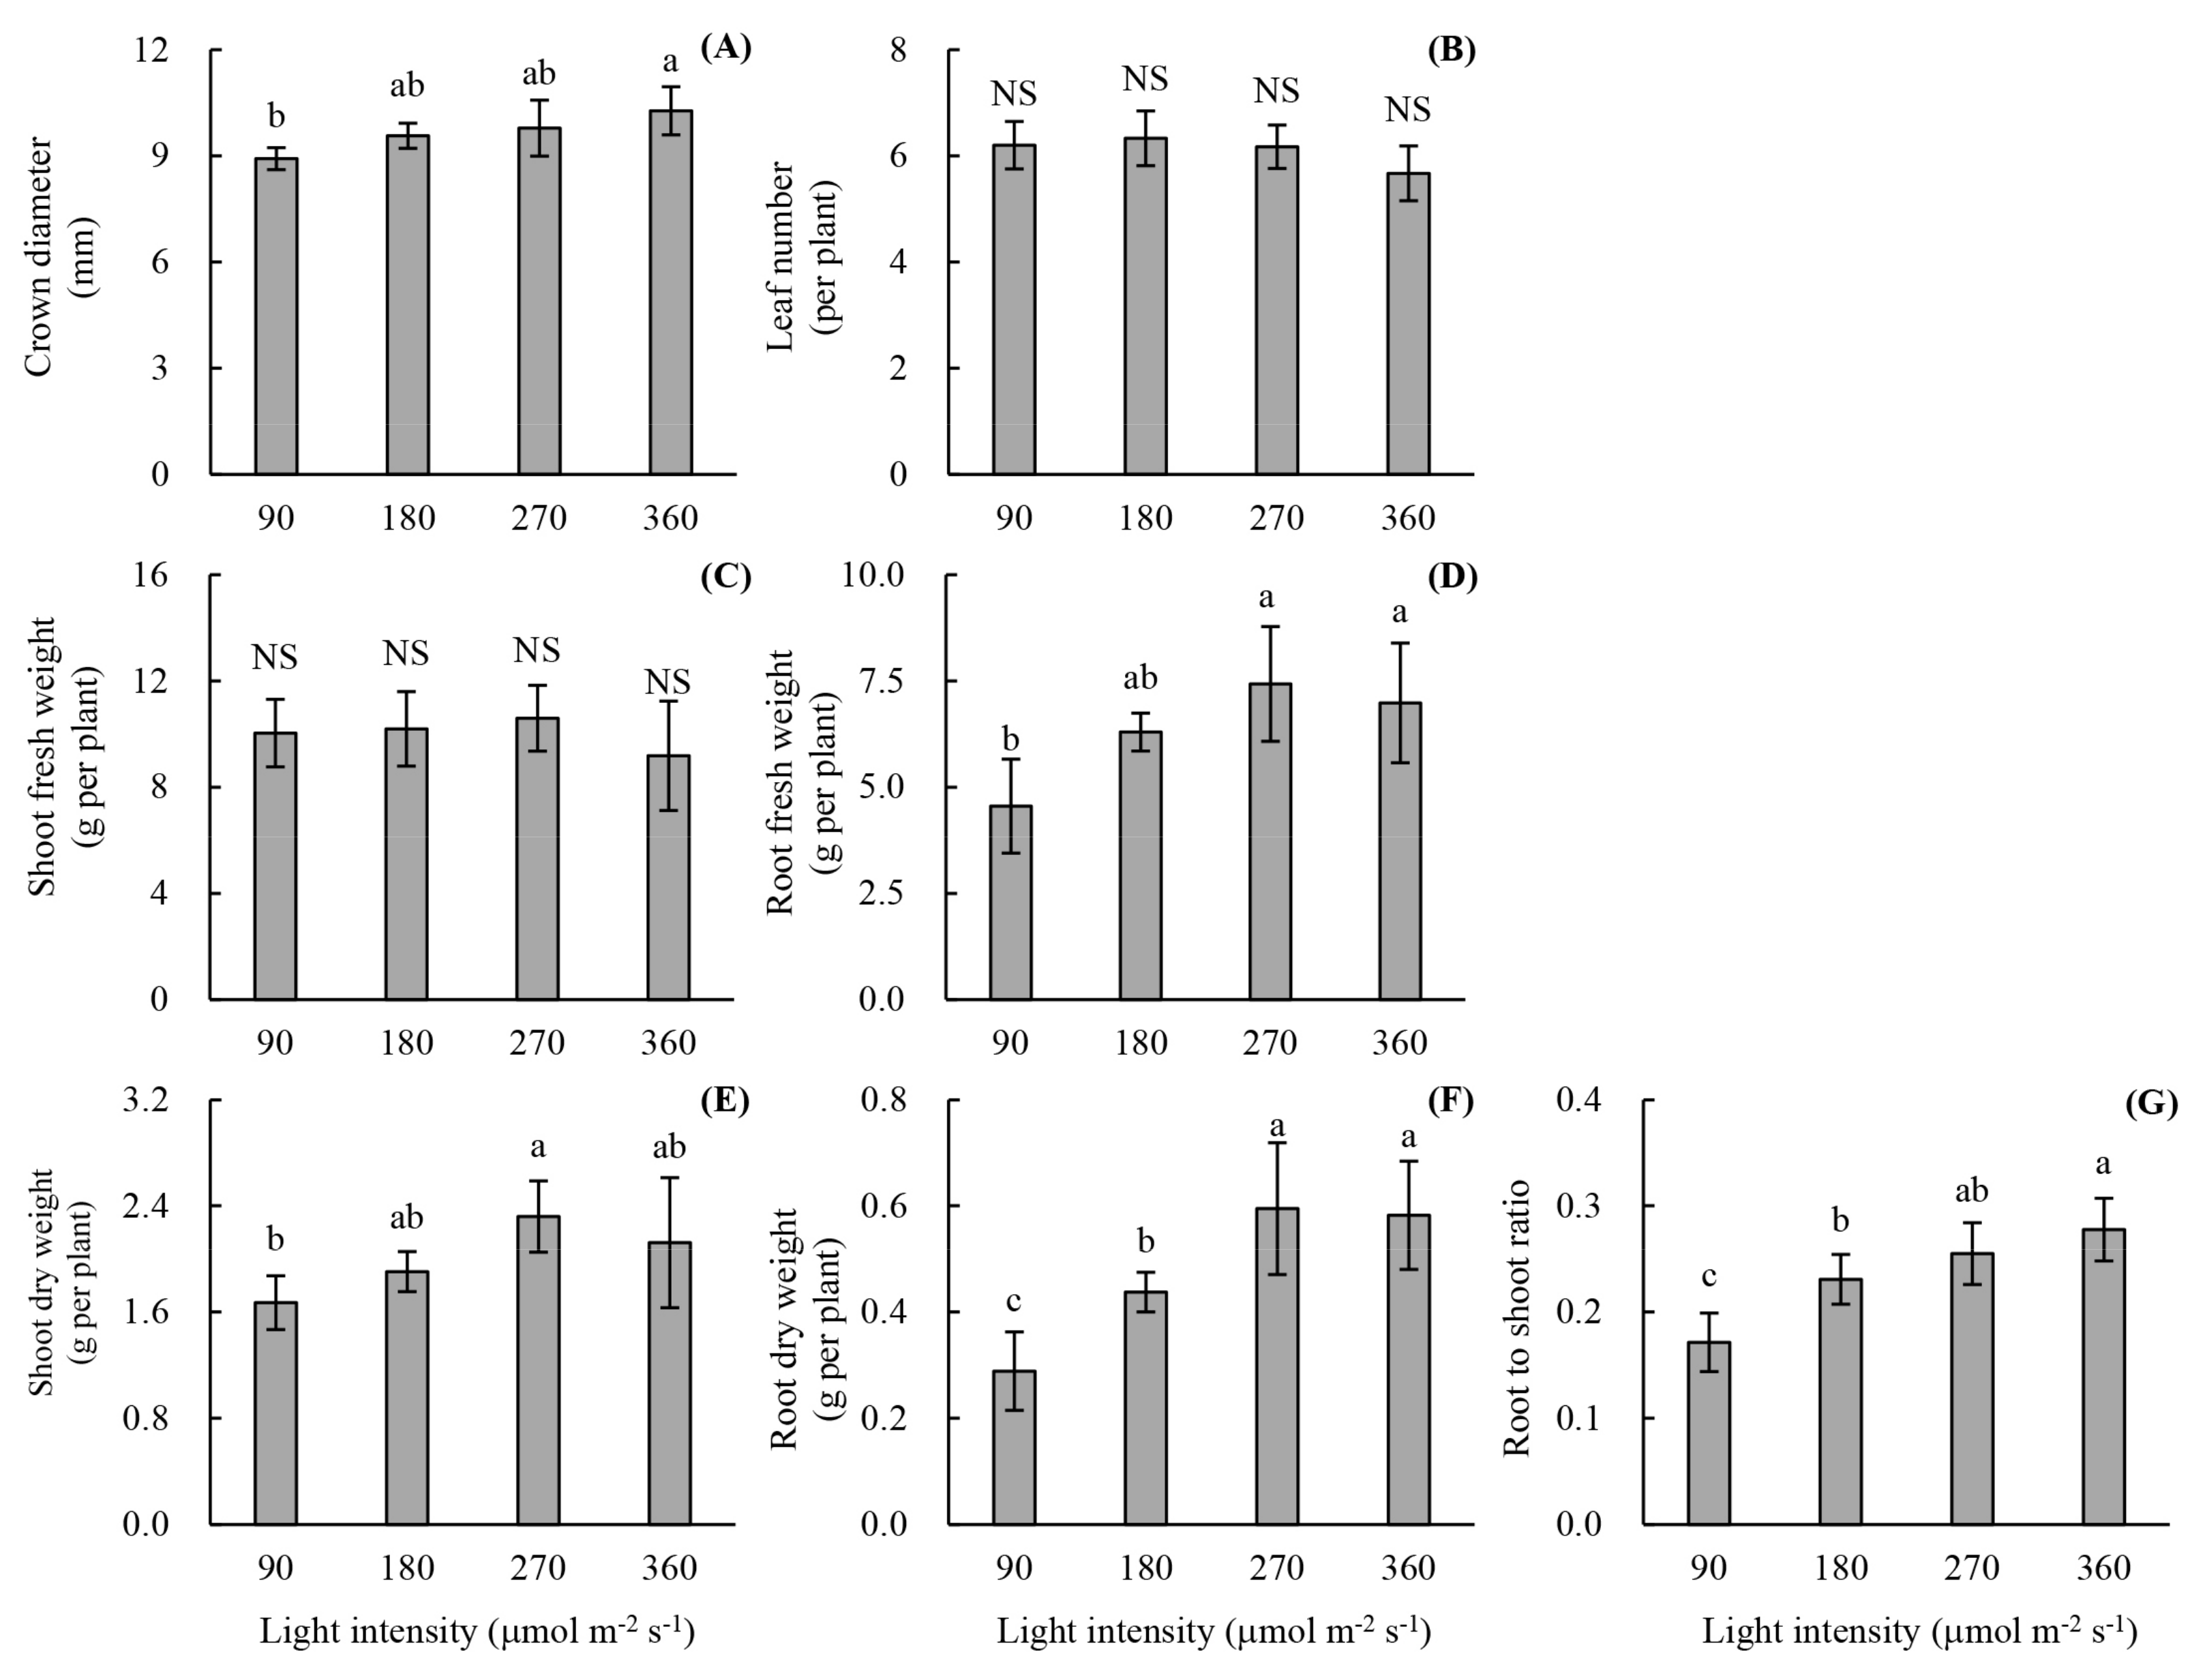
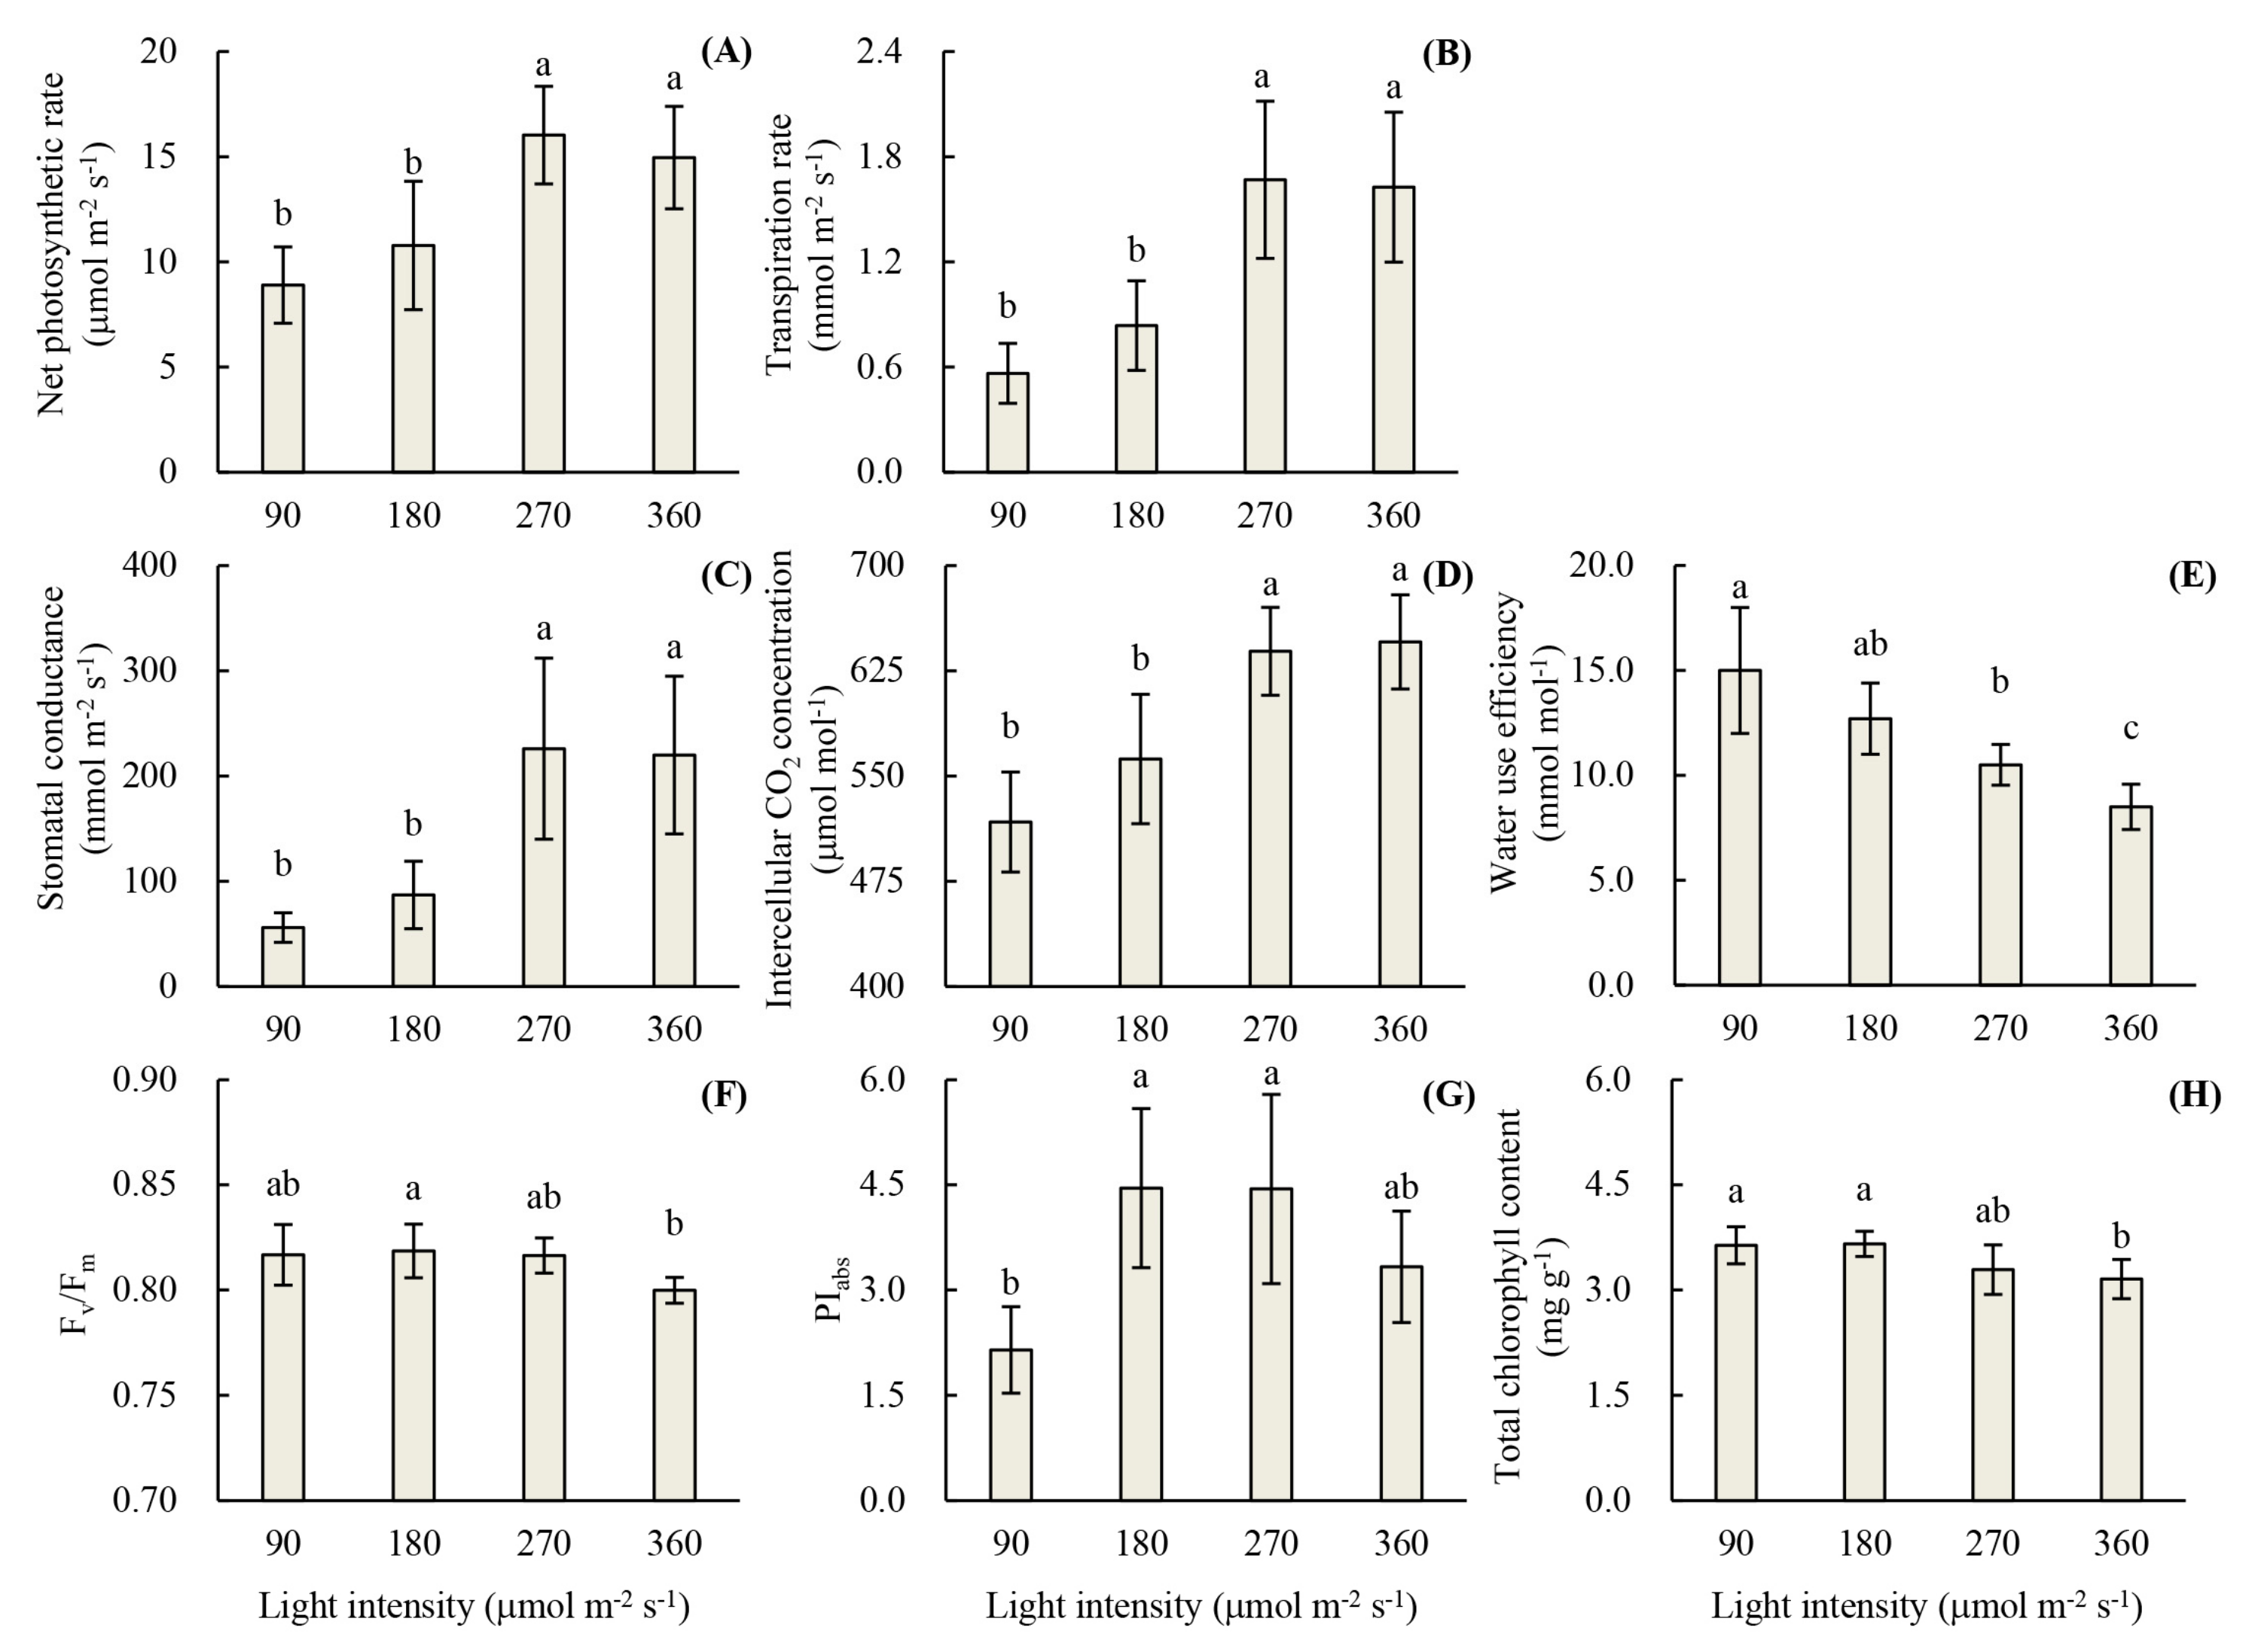
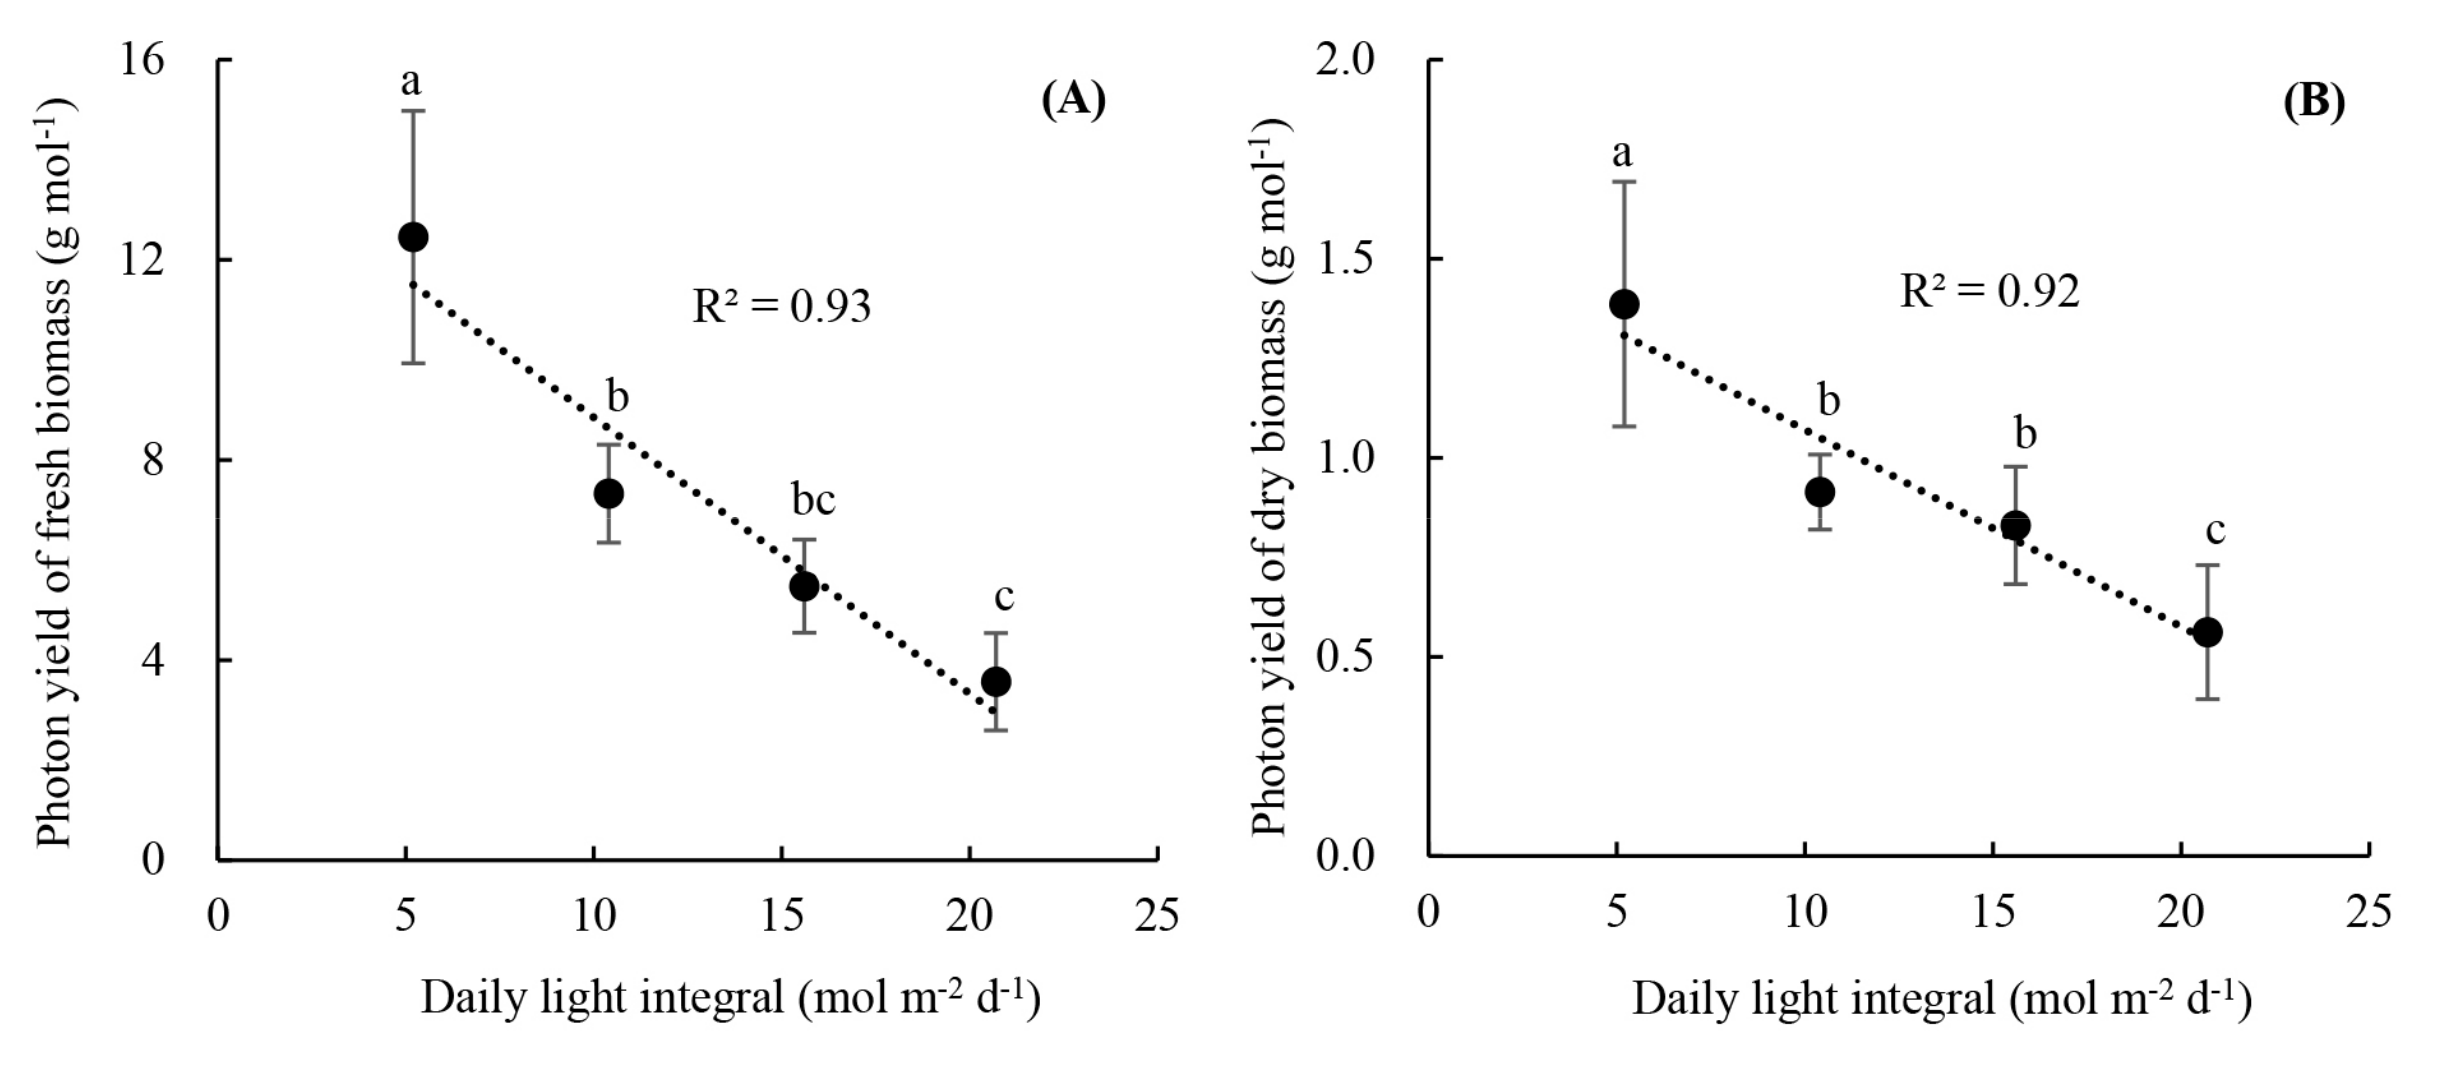
3.2. Plant Growth and Photon Yield of Biomass of Rooted Runner Plants as Affected by Light Intensity at the Seedling Stage

The subsequent growth of rooted strawberry runner plants was significantly affected by light intensity after being rooted for 6 days under 90 μmol m−2 s−1. It was observed that the runner plants grown under 270 and 360 μmol m−2 s−1 were more compact than those under 90 and 180 μmol m−2 s−1 (Figure 5). The crown diameter of runner plants increased by 9.7% when light intensity increased from 90 to 270 μmol m−2 s−1; however, no further increase was observed when light intensity increased to 360 μmol m−2 s−1 (Figure 6A). No significant difference in leaf number was found under the four levels of light intensity (Figure 6B). Runner plants grown under a light intensity of 180–360 μmol m−2 s−1 for 18 days had a crown diameter of approximately 10 mm and 6 leaves, which were big enough to be transplanted for fruit production or to be used as mother plants in runner plants propagation.
The root fresh weight, shoot, and root dry weights of runner plants under 270 μmol m−2 s−1 increased by 63.3%, 38.8%, and 106.1%, respectively, compared with that under 90 μmol m−2 s−1; however, the shoot fresh weight under four levels of light intensity did not show any significant difference (Figure 6C–F). Increased shoot dry weight and invariable shoot fresh weight indicated that the water content of the shoot in runner plants was decreased with an increase of light intensity. This agreed with the result of Nguyen et al. [34], which reported that the water content in both the stems and leaves of coriander was decreased with an increase of light intensity. The root to shoot ratio of runner plants increased with increasing light intensity (Figure 6G). It indicated that more carbohydrates are distributed to the root under higher light intensity, which is therefore in favor of producing a strong transplant [35,36].
The dry biomass accumulation of rooted runner plants grown under 90–270 μmol m−2 s−1 increased with increasing light intensity. Similar results were reported that “Toyonoka” strawberry plants under a higher light intensity (110–122 μmol m−2 s−1) showed higher dry weights than that under a lower light intensity (50–55 μmol m−2 s−1) [5]. Miyazawa et al. [23] reported that dry matter accumulation of seed-propagated strawberry seedlings under a light intensity of 338 μmol m−2 s−1 was 1.4–1.5 times greater than that under 225 μmol m−2 s−1. The higher light intensity resulted in higher DLI, thus enhancing the dry matter accumulation. Currey et al. [20] reported that the growth and quality of rooted cuttings of herbaceous annual plants could be improved by increasing the DLI. After callusing under a DLI of 5 mol m−2 d−1 for 7 days, biomass accumulation in the leaf, stem, and root of geranium, petunia, and new guinea impatiens increased linearly with DLI at 14 days after transfer [21]. Similar trends were also found on the sweet basil and lettuce that were grown in a plant factory [37,38]. Marcelis et al. [39] reported that a 1% increase in the amount of light resulted in a 1% yield increase in greenhouse grown crops. However, a higher light intensity did not show a positive effect on biomass accumulation compared to 270 μmol m−2 s−1 in our study. Similar results on bedding plants were reported by Faust et al. [36] that the total plant dry mass increased at a decreasing rate as DLI increased from 5 to 43 mol m−2 d−1, and the maximum peak point varied with specific species.
The Pn, Tr, Sc, and Ci of runner plants increased with increasing light intensity at 90–270 μmol m−2 s−1 (Figure 7A–D), however, total chlorophyll content showed no significant difference (Figure 7H). These indicated that the lower Pn of runner plants under 90 and 180 μmol m−2 s−1 were due to the limitation of stomata. Although no significant differences of Pn, Tr, Sc, and Ci were found between 270 and 360 μmol m−2 s−1, the mild photoinhibition of rooted runner plants under 360 μmol m−2 s−1 can be found according to the lower Fv/Fm and PIabs of leaves (Figure 7F,G). The WUE of runner plants decreased with increasing light intensity (Figure 7E). It was worth noting that Sc, Tr, and WUE varied in runner plants but not in cuttings. In our study, cuttings were cultured for only 6 days and no new leaf was developed; however, rooted runner plants were cultured for 18 days and three new leaves were developed. The photosynthetic parameters of cuttings were measured on the leaves that have developed before light treatment; however, photosynthetic parameters of rooted runner plants were measured on the new leaves developed under different light intensities. Therefore, the light intensity did not affect the Sc of leaves formed before light treatment; however, the Sc of newly developed leaves under different light treatment increased with increasing light intensity. It was reported that the higher light intensity (350 vs 90 μmol m−2 s−1) increased stomata length, width, and density in cowpea newly developed leaves [40]. The higher light intensity (90 to 270 μmol m−2 s−1) might improve stomata development in newly developed leaves of runner plants, thus increasing the Sc, Ci, Pn, and Tr in this study. We inferred that there may be an inflection point between 270 and 360 μmol m−2 s−1 in regard to promote the stomata development for the reason that no difference of Sc was found between these two intensities.
The concept of photon yield is aimed at assessing the effectiveness of electric light sources for cultivating crops in a plant factory [41]. A higher photon yield indicates a greater efficiency of biomass accumulation when receiving each mole of photons. In our study, the photon yield of fresh and dry biomass of runner plants decreased linearly with the increase of DLI (Figure 8). Our results were similar to those of Yan et al. [38], which showed that light use efficiency of lettuce decreased linearly as DLI increased. It is worth noting that no significant difference in photon yield of dry biomass under DLI of 10.4 and 15.6 mol m−2 d−1 was shown (Figure 8B). Therefore, it is economically the same to culture rooted runner plants under 180 and 270 μmol m−2 s−1 when evaluated by dry biomass increase per mole of photons delivered. Hence, the light intensity of 270 μmol m−2 s−1 is suggested for culturing rooted runner plants in consideration of the higher quality of transplants.

4. Conclusions

Root development of cuttings was best under 90 μmol m−2 s−1 at the rooting stage. The fully developed leaves of cuttings had decreased photosynthetic activity of mesophyll cell after higher or lower light treatment than 90 μmol m−2 s−1. Higher light intensity at the range of 90–270 μmol m−2 s−1 increased the stomatal conductance of newly formed leaves of rooted runner plants, thus improving the net photosynthetic rate and growth of rooted runner plants at the seedling stage. However, there was no further improvement of runner plant growth under 360 μmol m−2 s−1. No significant difference in photon yield of dry biomass was found between 180 and 270 μmol m−2 s−1. Therefore, light intensities of 90 μmol m−2 s−1 at the rooting stage and 270 μmol m−2 s−1 at the seedling stage are recommended for rapidly producing hydroponic strawberry transplants based on unrooted runner plants in the LED plant factory.

Author Contributions

Conceptualization, J.Z. and F.J.; data curation, J.Z.; formal analysis, J.Z.; funding acquisition, D.H.; investigation, J.Z.; methodology, J.Z. and F.J.; project administration, F.J. and D.H.; resources, F.J., D.H., and G.N.; supervision, F.J.; validation, F.J. and D.H.; visualization, J.Z.; writing—original draft, J.Z.; writing—review and editing, F.J., D.H., and G.N.

Funding

This research was funded by the National Key Research and Development Program of China, grant number 2017YFB0403901.

Conflicts of Interest

The authors declare no conflict of interest.

References

  1. Jun, H.J.; Jeon, E.H.; Kang, S.I.; Bae, G.H. Optimum nutrient solution strength for Korean strawberry cultivar ‘Daewang’ during seedling period. Korean J. Hortic. Sci. Technol. 2014, 32, 812–818. [Google Scholar] [CrossRef] [Green Version]
  2. Paulus, A.O. Fungal diseases of strawberry. HortScience 1990, 25, 885–889. [Google Scholar] [CrossRef] [Green Version]
  3. Xu, X.; Wedgwood, E.; Berrie, A.M.; Allen, J.; O’Neill, T.M. Management of raspberry and strawberry grey mould in open field and under protection. A review. Agron. Sustain. Dev. 2011, 32, 531–543. [Google Scholar] [CrossRef] [Green Version]
  4. Kim, S.K.; Jeong, M.S.; Park, S.W.; Kim, M.J.; Na, H.Y.; Chun, C. Improvement of runner plant production by increasing photosynthetic photon flux during strawberry transplant propagation in a closed transplant production system. Korean J. Hortic. Sci. Technol. 2010, 28, 535–539. [Google Scholar]
  5. Wu, C.C.; Hsu, S.T.; Chang, M.Y.; Fang, W. Effect of light environment on runner plant propagation of strawberry. Acta Hortic. 2011, 907, 297–302. [Google Scholar] [CrossRef]
  6. Park, S.W. Establishment of a Propagation System for Strawberry Using a Plant Factory with Artificial Lighting. Ph.D. Thesis, Seoul National University, Seoul, Korea, 2018. [Google Scholar]
  7. Xu, X. Optimizing Environmental Parameters for Precision Indoor Propagation of Day-Neutral Strawberry. Master’s Thesis, North Carolina State University, Raleigh, NC, USA, 2019. [Google Scholar]
  8. Durner, E.F.; Poling, E.B.; Maas, J.L. Recent advances in strawberry plug transplant technology. HortTechnology 2002, 12, 545–550. [Google Scholar] [CrossRef] [Green Version]
  9. Saito, Y.; Imagawa, M.; Yabe, K.; Bantog, N.; Yamada, K.; Yamaki, S. Stimulation of rooting by exposing cuttings of runner plants to low temperature to allow the raising of strawberry seedlings during summer. J. Jpn. Soc. Hortic. Sci. 2008, 77, 180–185. [Google Scholar] [CrossRef] [Green Version]
  10. He, D.X.; Zheng, J.F.; Du, W.F. A New Method for Harvesting Unrooted Runner Plantlets in Strawberry Plug Plant Production. China Patent 201810474655.0 2018. [Google Scholar]
  11. Savini, G.; Giorgi, V.; Scarano, E.; Neri, D. Strawberry plant relationship through the stolon. Physiol. Plant. 2008, 134, 421–429. [Google Scholar] [CrossRef]
  12. Tombesi, S.; Palliotti, A.; Poni, S.; Farinelli, D. Influence of light and shoot development stage on leaf photosynthesis and carbohydrate status during the adventitious root formation in cuttings of Corylus avellana L. Front. Plant. Sci. 2015, 6, 973–985. [Google Scholar] [CrossRef] [Green Version]
  13. Costa, J.; Challa, H. The effect of the original leaf area on growth of softwood cuttings and planting material of rose. Sci. Hortic. 2002, 95, 111–121. [Google Scholar] [CrossRef]
  14. Olschowski, S.; Geiger, E.M.; Herrmann, J.V.; Sander, G.; Grüneberg, H. Effects of red, blue, and white LED irradiation on root and shoot development of Calibrachoa cuttings in comparison to high pressure sodium lamps. Acta Hort. 2016, 1134, 245–250. [Google Scholar] [CrossRef]
  15. Kepenek, K. Photosynthetic effects of light-emitting diode (LED) on in vitro-derived strawberry (Fragaria × ananassa cv. Festival) plants under in vitro conditions. Erwerbs-Obstbau 2019, 61, 179–187. [Google Scholar] [CrossRef]
  16. Lovell, P.H.; Illsley, A.; Moore, K.G. The effects of light intensity and sucrose on root formation, photosynthetic ability, and senescence in detached cotyledons of Sinapis alba L. and Raphanus sativus L. Ann. Bot. 1972, 36, 123–134. [Google Scholar] [CrossRef]
  17. Loach, K.; Gay, A.P. The light requirement for propagating hardy ornamental species from leafy cuttings. Sci. Hortic. 1979, 10, 217–230. [Google Scholar] [CrossRef]
  18. Graper, D.F.; Healy, W. High pressure sodium irradiation and infrared radiation accelerate petunia seedling growth. J. Am. Soc. Hortic. Sci. 1991, 116, 35–438. [Google Scholar] [CrossRef]
  19. Pramuk, L.A.; Runkle, E.S. Photosynthetic daily light integral during the seedling stage influences subsequent growth and flowering of celosia, impatiens, salvia, tagetes, and viola. HortScience 2005, 40, 1336–1339. [Google Scholar] [CrossRef] [Green Version]
  20. Currey, C.J.; Hutchinson, V.A.; Lopez, R.G. Growth, morphology, and quality of rooted cuttings of several herbaceous annual bedding plants are influenced by photosynthetic daily light integral during root development. HortScience 2012, 47, 25–30. [Google Scholar] [CrossRef] [Green Version]
  21. Currey, C.J.; Lopez, R.G. Biomass accumulation and allocation, photosynthesis, and carbohydrate status of new guinea impatiens, geranium, and petunia cuttings are affected by photosynthetic daily light integral during root development. J. Am. Soc. Hortic. Sci. 2015, 140, 542–549. [Google Scholar] [CrossRef] [Green Version]
  22. Park, S.W.; Kwack, Y.; Chun, C. Growth of runner plants grown in a plant factory as affected by light intensity and container volume. Hortic. Sci. Technol. 2017, 35, 439–445. [Google Scholar] [CrossRef]
  23. Miyazawa, Y.; Hikosaka, S.; Goto, E.; Aoki, T. Effects of light conditions and air temperature on the growth of everbearing strawberry during the vegetative stage. Acta Hortic. 2009, 842, 817–820. [Google Scholar] [CrossRef]
  24. Yamazaki, K. Nutrient Solution Culture; Pak-kyo Co.: Tokyo, Japan, 1982; p. 41. [Google Scholar]
  25. Ye, Z.P. A new model for relationship between irradiance and the rate of photosynthesis in Oryza sativa. Photosynthetica 2007, 45, 637–640. [Google Scholar] [CrossRef]
  26. Polley, H.W. Implications of atmospheric and climatic change for crop yield and water use efficiency. Crop Sci. 2002, 42, 131–140. [Google Scholar] [CrossRef] [PubMed]
  27. Srivastava, A.; Strasser, R.J.; Govindjee. Greening of peas: Parallel measurements of 77 K emission spectra, OJIP chlorophyll a fluorescence transient, period four oscillation of the initial fluorescence level, delayed light emission, and P700. Photosynthetica 1999, 37, 365–392. [Google Scholar] [CrossRef]
  28. Arnon, D. Copper enzymes in isolated chloroplasts, phytophenoloxidase in Beta vulgaris. Plant Physiol. 1949, 24, 1–15. [Google Scholar] [CrossRef] [Green Version]
  29. Lopez, R.G.; Runkle, E.S. Daily light integral influences rooting and quality of petunia cuttings. Acta Hortic. 2006, 711, 369–374. [Google Scholar] [CrossRef]
  30. Farquhar, G.D.; Sharkey, T.D. Stomatal conductance and photosynthesis. Ann. Rev. Plant Physiol. 1982, 33, 317–345. [Google Scholar] [CrossRef]
  31. Na, Y.W.; Jeong, H.J.; Lee, S.Y.; Choi, H.G.; Kim, S.H.; Rho, I.R. Chlorophyll fluorescence as a diagnostic tool for abiotic stress tolerance in wild and cultivated strawberry species. Hortic. Environ. Biotechnol. 2014, 55, 280–286. [Google Scholar] [CrossRef]
  32. Appenroth, K.J.; Stöckel, J.; Srivastava, A.; Strasser, R.J. Multiple effects of chromate on the photosynthetic apparatus of Spirodela polyrhiza as probed by OJIP chlorophyll a fluorescence measurements. Environ. Pollut. 2001, 115, 49–64. [Google Scholar] [CrossRef]
  33. Van Heerden, P.D.R.; Strasser, R.J.; Krüger, G.H.J. Reduction of dark chilling stress in N2-fixing soybean by nitrate as indicated by chlorophyll a fluorescence kinetics. Physiol. Plant. 2004, 121, 239–249. [Google Scholar] [CrossRef]
  34. Nguyen, D.T.P.; Lu, N.; Kagawa, N.; Takagaki, M. Optimization of photosynthetic photon flux density and root-zone temperature for enhancing secondary metabolite accumulation and production of coriander in plant factory. Agronomy 2019, 9, 224. [Google Scholar] [CrossRef] [Green Version]
  35. Xu, W.; Cui, K.; Xu, A.; Nie, L.; Huang, J.; Peng, S. Drought stress condition increases root to shoot ratio via alteration of carbohydrate partitioning and enzymatic activity in rice seedlings. Acta Physiol. Plant. 2015, 37, 9–20. [Google Scholar] [CrossRef]
  36. Faust, J.E.; Holcombe, V.; Rajapakse, N.C.; Layne, D.R. The effect of daily light integral on bedding plant growth and flowering. HortScience 2005, 40, 645–649. [Google Scholar] [CrossRef] [Green Version]
  37. Dou, H.J.; Niu, G.H.; Gu, M.M.; Masabni, J.G. Responses of sweet basil to different daily light integrals in photosynthesis, morphology, yield, and nutritional quality. HortScience 2018, 53, 496–503. [Google Scholar] [CrossRef]
  38. Yan, Z.N.; He, D.X.; Niu, G.H.; Zhou, Q.; Qu, Y.H. Growth, nutritional quality, and energy use efficiency of hydroponic lettuce as influenced by daily light integrals exposed to white versus white plus red light-emitting diodes. HortScience 2019, 54, 1737–1744. [Google Scholar] [CrossRef] [Green Version]
  39. Marcelis, L.F.M.; Broekhuijsen, A.G.M.; Meinen, E.; Nijs, E.M.F.M.; Raaphorst, M.G.M. Quantification of the growth response to light quantity of greenhouse grown crops. Acta Hortic. 2006, 711, 97–104. [Google Scholar] [CrossRef]
  40. Tarila, A.G.I.; Ormrod, D.P.; Adedipe, N.O. Stomatal responses of the cowpea (Vigna unguiculata L.) to light intensity. Biochem. Physiol. Pflanzen 1978, 172, 541–545. [Google Scholar] [CrossRef]
  41. Chung, H.Y.; Chang, M.Y.; Wu, C.C.; Fang, W. Quantitative evaluation of electric light recipes for red leaf lettuce cultivation in plant factories. HortTechnology 2018, 28, 755–763. [Google Scholar] [CrossRef] [Green Version]
Figure 1. The light response curve of hydroponic “Benihoppe” strawberry mother plants in the LED plant factory. Vertical bars represent standard deviations (n = 5).
Agronomy 09 00875 g001
Figure 2. Cuttings of the hydroponic “Benihoppe” strawberry rooted under four levels of light intensity in the LED plant factory for 6 days.
Agronomy 09 00875 g002
Figure 3. Root number (A) and total root length (B) of cuttings of the hydroponic “Benihoppe” strawberry rooted under four levels of light intensity in the LED plant factory for 6 days. Letters, a-b indicate significant differences according to Tukey’s multiple range test at p ≤ 0.05 (n = 6). Vertical bars represent standard deviations.
Agronomy 09 00875 g003
Figure 4. Photosynthetic parameters (A–E), chlorophyll fluorescence parameters (F,G), and chlorophyll content (H) of cuttings of hydroponic “Benihoppe” strawberry rooted under four levels of light intensity in the LED plant factory for 6 days. Letters, a-c indicate significant differences and NS indicates nonsignificant differences according to Tukey’s multiple range test at p ≤ 0.05 (n = 6). Vertical bars represent standard deviations.
Agronomy 09 00875 g004
Figure 5. Hydroponic rooted “Benihoppe” strawberry runner plants grown under four levels of light intensity in the LED plant factory for 18 days.
Agronomy 09 00875 g005
Figure 6. Crown diameter (A), leaf number (B), plant weight (CF), and root to shoot ratio (G) of hydroponic rooted “Benihoppe” strawberry runner plants grown under four levels of light intensity in the LED plant factory for 18 days. Letters, a-c indicate significant differences and NS indicates nonsignificant differences according to Tukey’s multiple range test at P ≤ 0.05 (n = 6). Vertical bars represent standard deviations.
Agronomy 09 00875 g006
Figure 7. Photosynthetic parameters (A–E), chlorophyll fluorescence parameters (F,G), and chlorophyll content (H) of hydroponic rooted “Benihoppe” strawberry runner plants grown in the LED plant factory for 18 days. Letters, a–c indicate significant differences and NS indicates nonsignificant differences according to Tukey’s multiple range test at p ≤ 0.05 (n = 6). Vertical bars represent standard deviations.
Agronomy 09 00875 g007
Figure 8. Photon yield of fresh (A) and dry (B) biomass of hydroponic rooted “Benihoppe” strawberry runner plants grown in the LED plant factory for 18 days as affected by DLI. Letters, a-c indicate significant differences according to Tukey’s multiple range test at P ≤ 0.05 (n = 6). Vertical bars represent standard deviations.
Agronomy 09 00875 g008

