Article

Changes in Leaf Structural and Functional Characteristics when Changing Planting Density at Different Growth Stages Alters Cotton Lint Yield under a New Planting Model

1
Key Laboratory of Plant Genetics and Breeding, College of Agriculture, Guangxi University, Nanning 530005, China
2
Plant Breeding Institute, Sydney Institute of Agriculture, School of Life and Environmental Sciences, Faculty of Science, The University of Sydney, Sydney, NSW 2006, Australia
3
Department of Agronomy, University of Agriculture, Peshawar 25000, Khyber Pakhtunkhwa, Pakistan
4
Institute of Nuclear Agricultural Sciences, College of Agriculture and Biotechnology, Zhejiang University, Hangzhou 310058, China
5
Department of Botany, University of Malakand, Chakdara Dir Lower, Malakand, Khyber Pakhtunkhwa 18800, Pakistan
6
Department of Agriculture, University of Swabi, Swabi 23561, Khyber Pakhtunkhwa, Pakistan
*
Author to whom correspondence should be addressed.
Agronomy 2019, 9(12), 859; https://doi.org/10.3390/agronomy9120859
Submission received: 22 October 2019 / Revised: 30 November 2019 / Accepted: 3 December 2019 / Published: 7 December 2019
(This article belongs to the Special Issue Herbaceous Field Crops Cultivation)

Abstract

:
Manipulation of planting density and choice of variety are effective management components in any cropping system that aims to enhance the balance between environmental resource availability and crop requirements. One-time fertilization at first flower with a medium plant stand under late sowing has not yet been attempted. To fill this knowledge gap, changes in leaf structural (stomatal density, stomatal length, stomata width, stomatal pore perimeter, and leaf thickness), leaf gas exchange, and chlorophyll fluorescence attributes of different cotton varieties were made in order to change the planting densities to improve lint yield under a new planting model. A two-year field evaluation was carried out on cotton varieties—V1 (Zhongmian-16) and V2 (J-4B)—to examine the effect of changing the planting density (D1, low, 3 × 10⁴; D2, moderate, 6 × 10⁴; and D3, dense, 9 × 10⁴) on cotton lint yield, leaf structure, chlorophyll fluorescence, and leaf gas exchange attribute responses. Across these varieties, J-4B had higher lint yield compared with Zhongmian-16 in both years. Plants at high density had depressed leaf structural traits, net photosynthetic rate, stomatal conductance, intercellular CO2 uptake, quenching (qP), actual quantum yield of photosystem II (ΦPSII), and maximum quantum yield of PSII (Fv/Fm) in both years. Crops at moderate density had improved leaf gas exchange traits, stomatal density, number of stomata, pore perimeter, length, and width, as well as increased qP, ΦPSII, and Fv/Fm compared with low- and high-density plants. Improvement in leaf structural and functional traits contributed to 15.9%–10.7% and 12.3%–10.5% more boll m−2, with 20.6%–13.4% and 28.9%–24.1% higher lint yield averaged across both years, respectively, under moderate planting density compared with low and high density. In conclusion, the data underscore the importance of proper agronomic methods for cotton production, and that J-4B and Zhongmian-16 varieties, grown under moderate and lower densities, could be a promising option based on improved lint yield in subtropical regions.

1. Introduction

Cotton (Gossypium hirsutum L.) is a natural white fiber and cash crop that is grown globally [1]. The cotton plant is characterized by indeterminate growth habits and shows morphological and physiological adaptation to a wide range of environmental and management practices, including planting density and cultivar. An expanding population necessitates global efforts to increase crop production, especially those fulfilling food and fiber needs. Currently, numerous management practices have been introduced for cotton production systems, but lint production per unit area has remained stagnant [2]. High input costs combined with multiple management and material inputs have threatened cotton productivity. [2]. An efficient agricultural production system characterized by moderate planting density with one-time fertilization under a short growing season can reduce inputs without yield loss [3,4].
Planting density and choice of cultivar are important agronomic practices that have the potential to optimize the canopy photosynthetic rate and crop productivity of any cropping system [5]. Changes in plant architecture and canopy dynamics in response to planting density can have impacts on disease incidence, water use, canopy temperature, and enzymatic activity of assimilate metabolism [6]. Manipulations of planting density in cotton have remarkable impacts on biomass partitioning, nutrient uptake, boll distribution, changes in the light spectrum, and crop production [3,5,7,8], which can influence yield and profits for producers [9]. Plants at high density can minimize evaporation and irrigation frequency, as well as increase the utilization of irrigation water [10,11]. In contrast, high-density planting can slow down leaf appearance and reduce open boll density [12], boll weight, and boll number [7]. It also delays leaf senescence [13] and decreases nitrogen use efficiency and nitrogen recovery efficiency [14]. A planting density of up to nine plants m−2 has been reported to sustain leaf photosynthetic rate and reproductive organ biomass formation by increasing plant potassium uptake at various developmental stages. However, a sowing density of >10 plants m−2 and subsequent shading can result in disease infestation, small boll size, fruit shedding, delayed maturity, and decreased individual plant development [4]. Dense planting can also delay crop maturity by promoting vegetative growth and can substantially depress net photosynthetic rate [4] due to decreased RuBP carboxylase activity and chlorophyll content [15]. High planting density can increase the auxin (IAA) content and enhance auxin polar transport by increasing the expression of the auxin biosynthesis gene (GhYUC5) and the auxin polar transport gene (GhPIN1). It can also inhibit vegetative branching by decreasing IAA, cytokinin, gibberellic acid, and brassinosteroid contents, followed by increased strigolactone content due to differential expression of hormone-associated genes in the tips of vegetative branches [15]. Optimal plant density can ensure healthy plant development by maintaining a core population of plants synchronizing boll number and fiber quality to achieve optimal yield [16].
Leaf morphological and physiological attributes are important players in photosynthetic regulation [4] and can provide a structural framework for gas exchange as well as optimize the photosynthetic function [17]. Cotton leaf surface characteristics, including cuticular thickening, wax layer, and trichomes, play critical roles in the variability of optical properties [18]. Generally, leaves developed under high sunlight can have thicker and smaller leaves with well-developed plastid tissues, greater stomatal density, and smaller granal stacks than shade leaves [19]. Plants under low density planting have a lower chlorophyll content and a higher electron transfer rate and ribulose-1,5-bi-phasphate carboxylase/oxygenase compared with high-density planting [20,21]. Leaves developed under lower density (sun leaves) are tolerant to strong light; conversely, shade leaves have weak photoprotection potential and are more sensitive to high light [17,21].
Studies regarding cotton growth and lint yield in response to diverse populations are common [22,23,24]. However, we are the first to report the effects of changing the planting density on cotton lint yield, leaf structure, chlorophyll fluorescence, and leaf gas exchange characteristics in subtropical regions. The objectives of this study were to investigate leaf structural and functional characteristics in response to different planting densities and varieties. It also explored optimal plant density and variety for improved lint yield in subtropical regions.

2. Materials and Methods

2.1. Plant Material and Experimental Site

Seeds of two cotton cultivars—V1 (Zhongmian-16) and V2 (J-4B)—were procured from the Cotton Research Institute, Chinese Academy of Agricultural Sciences and were grown under field conditions for two years. A replicated two-year (2017 and 2018 growing seasons) field experiment was conducted at Guangxi University, Nanning, China. The soil properties of the experimental field were sandy loam and yellowish, having a pH of 6.5; organic matter of 23.37 mg kg−1; and available nitrogen, phosphorus, and potassium content of 53.24, 77.58, and 6.30 mg kg−1, respectively. The experimental design layout was a balanced split plot with three replications.

2.2. Crop Management and Experimental Design

Before sowing, the experimental field was ploughed, laser leveled approximately three weeks prior, and covered with plastic film to conserve moisture and suppress weed germination. The experiments were designed in a split plot arrangement with three replications of each of the six treatment combinations. Two cotton varieties (V1, Zhongmian-16; V2, J-4B), were randomly allocated to the main plots and three plant population levels (D1, low, 3 × 10⁴; D2, medium, 6 × 10⁴; and D3, dense, 9 × 10⁴ ha−1) were randomized in subplots. By increasing the precision of comparisons, split plot arrangements were adopted. Seeds were sown on 5 June in double rows on each raised plot (3.0 m wide and 11 m long), with a total plot size of 33.0 m2. Each subplot was 11 m long and 1.5 m wide, consisting of four rows with narrow (10 cm) and wide (66 cm) row spaces for a total of eight rows on each main plot. Plant-to-plant spacing was controlled according to the corresponding population level. Crops were irrigated one day after sowing to ensure uniform germination. Cotton seedlings were hand-thinned at the third leaf stage to the target population level for each plot. A basal application of phosphorus (P2O5) at 66 kg ha−1, nitrogen (N) at 170 N kg ha−1, and potash (K2O) at 190 kg ha−1 was applied using superphosphate (12% P2O5), urea (46% N), and potassium chloride (59% K2O), respectively, during the pinhead stage. A plant growth regulator (i.e., mepiquat chloride) at the rate of 0.057 active ingredient ha−1 was sprayed to control vegetative growth. All the necessary field management practices were performed according to crop requirements during the whole crop cycle.

2.3. Data Collection

Data on leaf structure, chlorophyll fluorescence, leaf gas exchange attributes, cotton yield, and yield contributors were recorded for each treatment in three replications. The details of each measurement are given below.

2.4. Yield and Yield Components

To assess cotton yield, fully opened bolls were hand-picked at three times in each treatment. The harvested seed cotton was sun-dried to ≤11% moisture content [16]. The seed cotton was ginned to calculate seed cotton and lint yield. During the second picking, 100 mature bolls were manually picked to calculate single boll mass and lint percentage. Seed cotton yield of 100 bolls was divided by the number of bolls to assess individual boll weight. Lint % was determined using the lint yield of 100 bolls and divided by seed cotton mass.

2.5. Cotton Leaf Structure Attributes

Ten plants in each plot were randomly tagged to measure leaf structure and plant growth characteristics at the boll setting stage. Leaf thickness was determined on 10 fully expanded leaves from the upper part of three plants (functional leaves, i.e., upper fourth leaf). A hand-held micrometer (Mitutoyo Digital Micrometer Model 293-185, Kawasaki, Japan) with a digital display and a clutch that ensured uniform pressure [25] was used for leaf thickness assessment. A 5 × 8 mm leaf section was removed for each treatment. Samples were then added into 10 mL tubes containing 50%, 5%, and 5% alcohol solution, formaldehyde, and glacial acetic acid, respectively. Scanning electron microscopy was performed at Guanxi Medical University using a SUPRA 55VP (Carl Zeiss AG, Oberkochen, Germany). Image software was used to assess cotton leaf stomatal length, width, density, and pore perimeter according to the method reported in [26].

2.6. Chlorophyll Fluorescence Traits

Cotton leaf chlorophyll fluorescence attributes were measured on a fully expanded functional leaf (upper fourth leaf on the main stem) on a sunny day (between 1000 and 1200 h) via a portable mini PAM-2100 fluorometer coupled with a 2030-B leaf (Walz, Germany). Maximum (Fm) and minimum (Fo) fluorescence values of dark-adapted leaves (photosystem II (PSII) centers open) were measured using leaf clips. The maximum and minimum fluorescence values were assessed at 0.5 µmol m−2 s−1 with a frequency of 0.6 kHz and a 0.8 saturating pulse at >8000 µmol m−2 s−1, respectively. Maximum quantum yield of PSII photochemistry (Fv/Fm) was calculated as Fv/Fm = 1 − (Fo/Fm) [27]. The effective quantum yield of PSII photochemistry of light-adapted leaves was determined by ΦPSII (FmF)/Fm [28]. Coefficient of photochemical quenching (qP) was assessed using the formula qP = (FmFs)/(FmFo) [29]. Minimal fluorescence of light-adapted leaves (Fo) was calculated according to the equation Fo’ = Fo/(Fv/Fm + Fo/Fm) done by [28]. Nonphotochemical quenching (NPQ) was recorded according to [6] as NPQ = (FmFm)/Fm, where Fm represents the value of the predawn observations. The electron transport rate (ETR) was assessed using a leaf absorptance of 0.85 and half of the absorbed light was partitioned to each photosystem: ETR = PSII × PPFD × 0.85 × 0.5 [30].

2.7. Leaf Gas Exchange Attributes

At squaring, flowering, peak bloom, and boll setting stages, fully expanded leaves from the upper part of three plants (functional leaves, i.e., upper fourth leaf) were chosen to assess net photosynthetic rate (Pn), stomatal conductance (gs), intercellular CO2 concentration (Ci), and transpiration rate (E). Net rate of photosynthesis was measured from the six functional leaves of three plants in each treatment using a portable infrared gas exchange analyzer (Li-6400, Li-Cor, Lincoln, NE, USA). These observations were made on a clear day between 10:00 a.m. and 12:00 p.m. Beijing time in each experimental unit of four replications. Leaves in each plot followed the following adjustments: PAR, 1800 μmol m−2 s−2; air flow, 389.42 mmol−1 m−2 s−1; water vapor pressure into leaf chamber, 3.13 mbar; leaf temperature, 30 °C; ambient temperature, 33.69 °C; and ambient carbon dioxide concentration, 330–350 mol mol−1.

2.8. Statistical Analysis

All the data were processed using Microsoft Excel 2016. Figures were plotted using Sigma Plot 14.00 software. Analysis of variance was implemented using SAS software (version 8.1, SAS Institute, Cary, NC, USA). The initial combined data showed no interactions with years. Therefore, the data were pooled and presented across the two years. Means of planting density were separated using the least significant difference (LSD) test at the 5% probability level. Both planting densities and cultivars were taken as main factors and fixed effects with cropping season as the repetitive measured factor with a fixed effect. Similarly, the interaction was taken as fixed effects and treatment × replication interaction, which was taken as a random effect. Differences among treatments imply statistical difference (p = 0.05).

3. Results

3.1. Yield and Yield Components

The analysis of variance (Table 1) showed that effects of year, planting density, variety, and their interaction on cotton yield and yield contributors. The year effect was statistically significant, but the differences were not large. Planting density and variety did not affect lint percentage and boll weight. There were 14.5% and 7.1% more bolls m−2 with a 19% and 11.5% higher lint yield in moderate-density crops compared with low- and high-density crops, respectively. Under high-density conditions, a reduction of 9.6% and 2.3% was noted in boll weight and lint percentage, respectively, compared with low- and moderate-density crops. Across the varieties, J-4B produced 6% and 7.8% greater bolls m−2 and lint yield, respectively, compared with the Zhongmian-16 variety (Figure 1A–D). Interaction was significant for density × variety across two years. Cotton plant individual boll weight, boll density m−2, and lint yield were highest under moderate-to-high planting density for J-4B, while under low-density conditions, Zhongmian-16 had a higher boll weight.

3.2. Leaf Structure Attributes

Cotton leaf structural characteristics (e.g., stomatal density, length, width, pore perimeters, and leaf thickness) significantly influenced by planting density and cultivar (Table 2). Under dense crops, leaf stomatal density, length, width, and pores were reduced by 7.1% and 11.7%; 3.3% and 9.3%; and 11.2%, 2.2%, and 7.9% compared with lower- and medium-density crops, respectively. Likewise, J-4B had improved stomatal density, length, width, pores, and leaf thickness by 10.3%, 13.7%, 1.1%, 9.9%, and 10.7%, respectively, compared with the Zhongmian-16 variety. Significant density × variety interaction revealed that, unlike J-4B, increasing planting density reduced stomatal density, length, width, and pore perimeters in Zhongmian-16 during both growing seasons.

3.3. Chlorophyll Fluorescence Traits

During both years, planting densities, varieties, and their interaction had significant impacts on chlorophyll fluorescence traits in different growth stages (Table 3, Table 4 and Table 5). Except the squaring stage, ΦPSII at first bloom, peak bloom, and boll setting stages were increased by moderate-density compared with low- and high-density crops, while the Fv/Fm yield was greater at all growth stages (Table 3). Across the varieties, J-4B had higher ΦPSII and Fv/Fm at peak bloom and boll setting stages than Zhongmian-16, respectively. The interaction between density × variety remained significant for ΦPSII and Fv/Fm at different growth stages. The J-4B variety with moderate crops had greater ΦPSII and Fv/Fm across the years.
Significant variation between planting densities, varieties, and years was found for photochemical quenching (qP) and nonphotochemical quenching (NPQ) of cotton at all growth stages (Table 4). Across densities, medium competitive plants yielded higher qP and NPQ rates. The variety J-4B resulted in higher qP at squaring and boll setting stages, while Zhongmian-16 had higher NPQ rates at first and full bloom stages. The interaction showed that J-4B had a higher qP under moderate density at different growth stages. J-4B had higher values for NPQ at low density compared with Zhongmian-16, followed by moderate density for the same variety at the peak bloom stage.
Significant differences existed between years, densities, and varieties for the ETR at four growth stages (Table 5). Interaction between density × variety revealed substantial variation between varieties to planting density at all growth stages. Increased planting density substantially reduced ETR at all growth stages in both years (Table 5). The low-density plants improved ETR at squaring, first, peak bloom, and boll setting stages, followed by moderate density, while there was a lower ETR in high-density crops. A higher ETR was noted for the variety Zhongmian-16 at squaring, first, and peak bloom stages compared with J-4B; however, J-4B had a higher ETR at the boll setting stage than Zhongmian-16. ETR values were substantially reduced under high density for both varieties. Lower planting density had higher ETR values for Zhongmian-16 or J-4B during both years.

3.4. Leaf Gas Exchange Attributes

Cotton leaf gas attributes were significantly influenced by plant density, variety, and growing year (Table 6 and Table 7). Under moderate-density conditions, net photosynthetic rate (Pn) was increased at all growth stages except squaring, while stomatal conductance (gs) was higher at the first bloom and boll setting stages. Plants under high density had significantly lower Pn and gs compared with low and moderate density (Table 6). J-4B had higher Pn and gs compared with Zhongmian-16 under moderate density. Interaction between density × variety was significant only at full bloom and boll setting for Pn and at the peak bloom stage for gs. J-4B under low-to-moderate planting density had a higher Pn at squaring and first bloom stages, while it was higher in Zhongmian-16 at the peak bloom and boll set stages. A higher gs under moderate planting density was noted in J-4B at the peak stage than Zhongmian-16 at low or high density.
Increasing planting density significantly reduced Ci in cotton leaves for both varieties. Plants with moderate density had higher Ci uptake at first bloom and peak bloom stages compared with low- and high-density crops, respectively (Table 7). Plants under low density resulted in a higher rate of E during first bloom, peak bloom, and boll set stages compared with moderate- and high-density crops, respectively (Table 7). Across the varieties, Zhongmian-16 yielded higher for both Ci uptake and E rates compared with J-4B. Interaction between density × variety remained significant at all growth stages for Ci. The transpiration rate was decreased in both varieties when the planting density increased.

4. Discussion

The current study has provided new data on the common perception that high planting density significantly decreases leaf structural characteristics, such as stomatal density, length, width, pore perimeter, and leaf thickness, as well as functional traits (leaf gas exchange and chlorophyll fluorescence traits), which leads to lint yield loss. However, we found that improved leaf functional and structural traits for J-4B under moderate density had a higher lint yield. Under high-density treatment, reductions in lint yield for Zhongmian-16 were associated with repression in leaf structural and functional attributes, which in turn caused depression in leaf photosynthetic capacity due to nutrient competition. The difference between varieties from changing planting density might be associated with canopy architecture and genetic variation. Therefore, these changes in varieties might have significant impacts on leaf structural and functional attributes and, ultimately, on yield formation.
High planting density responses to cotton lint yield, growth, biomass production, nutrient uptake, and fiber quality have been extensively investigated [3,4,13,
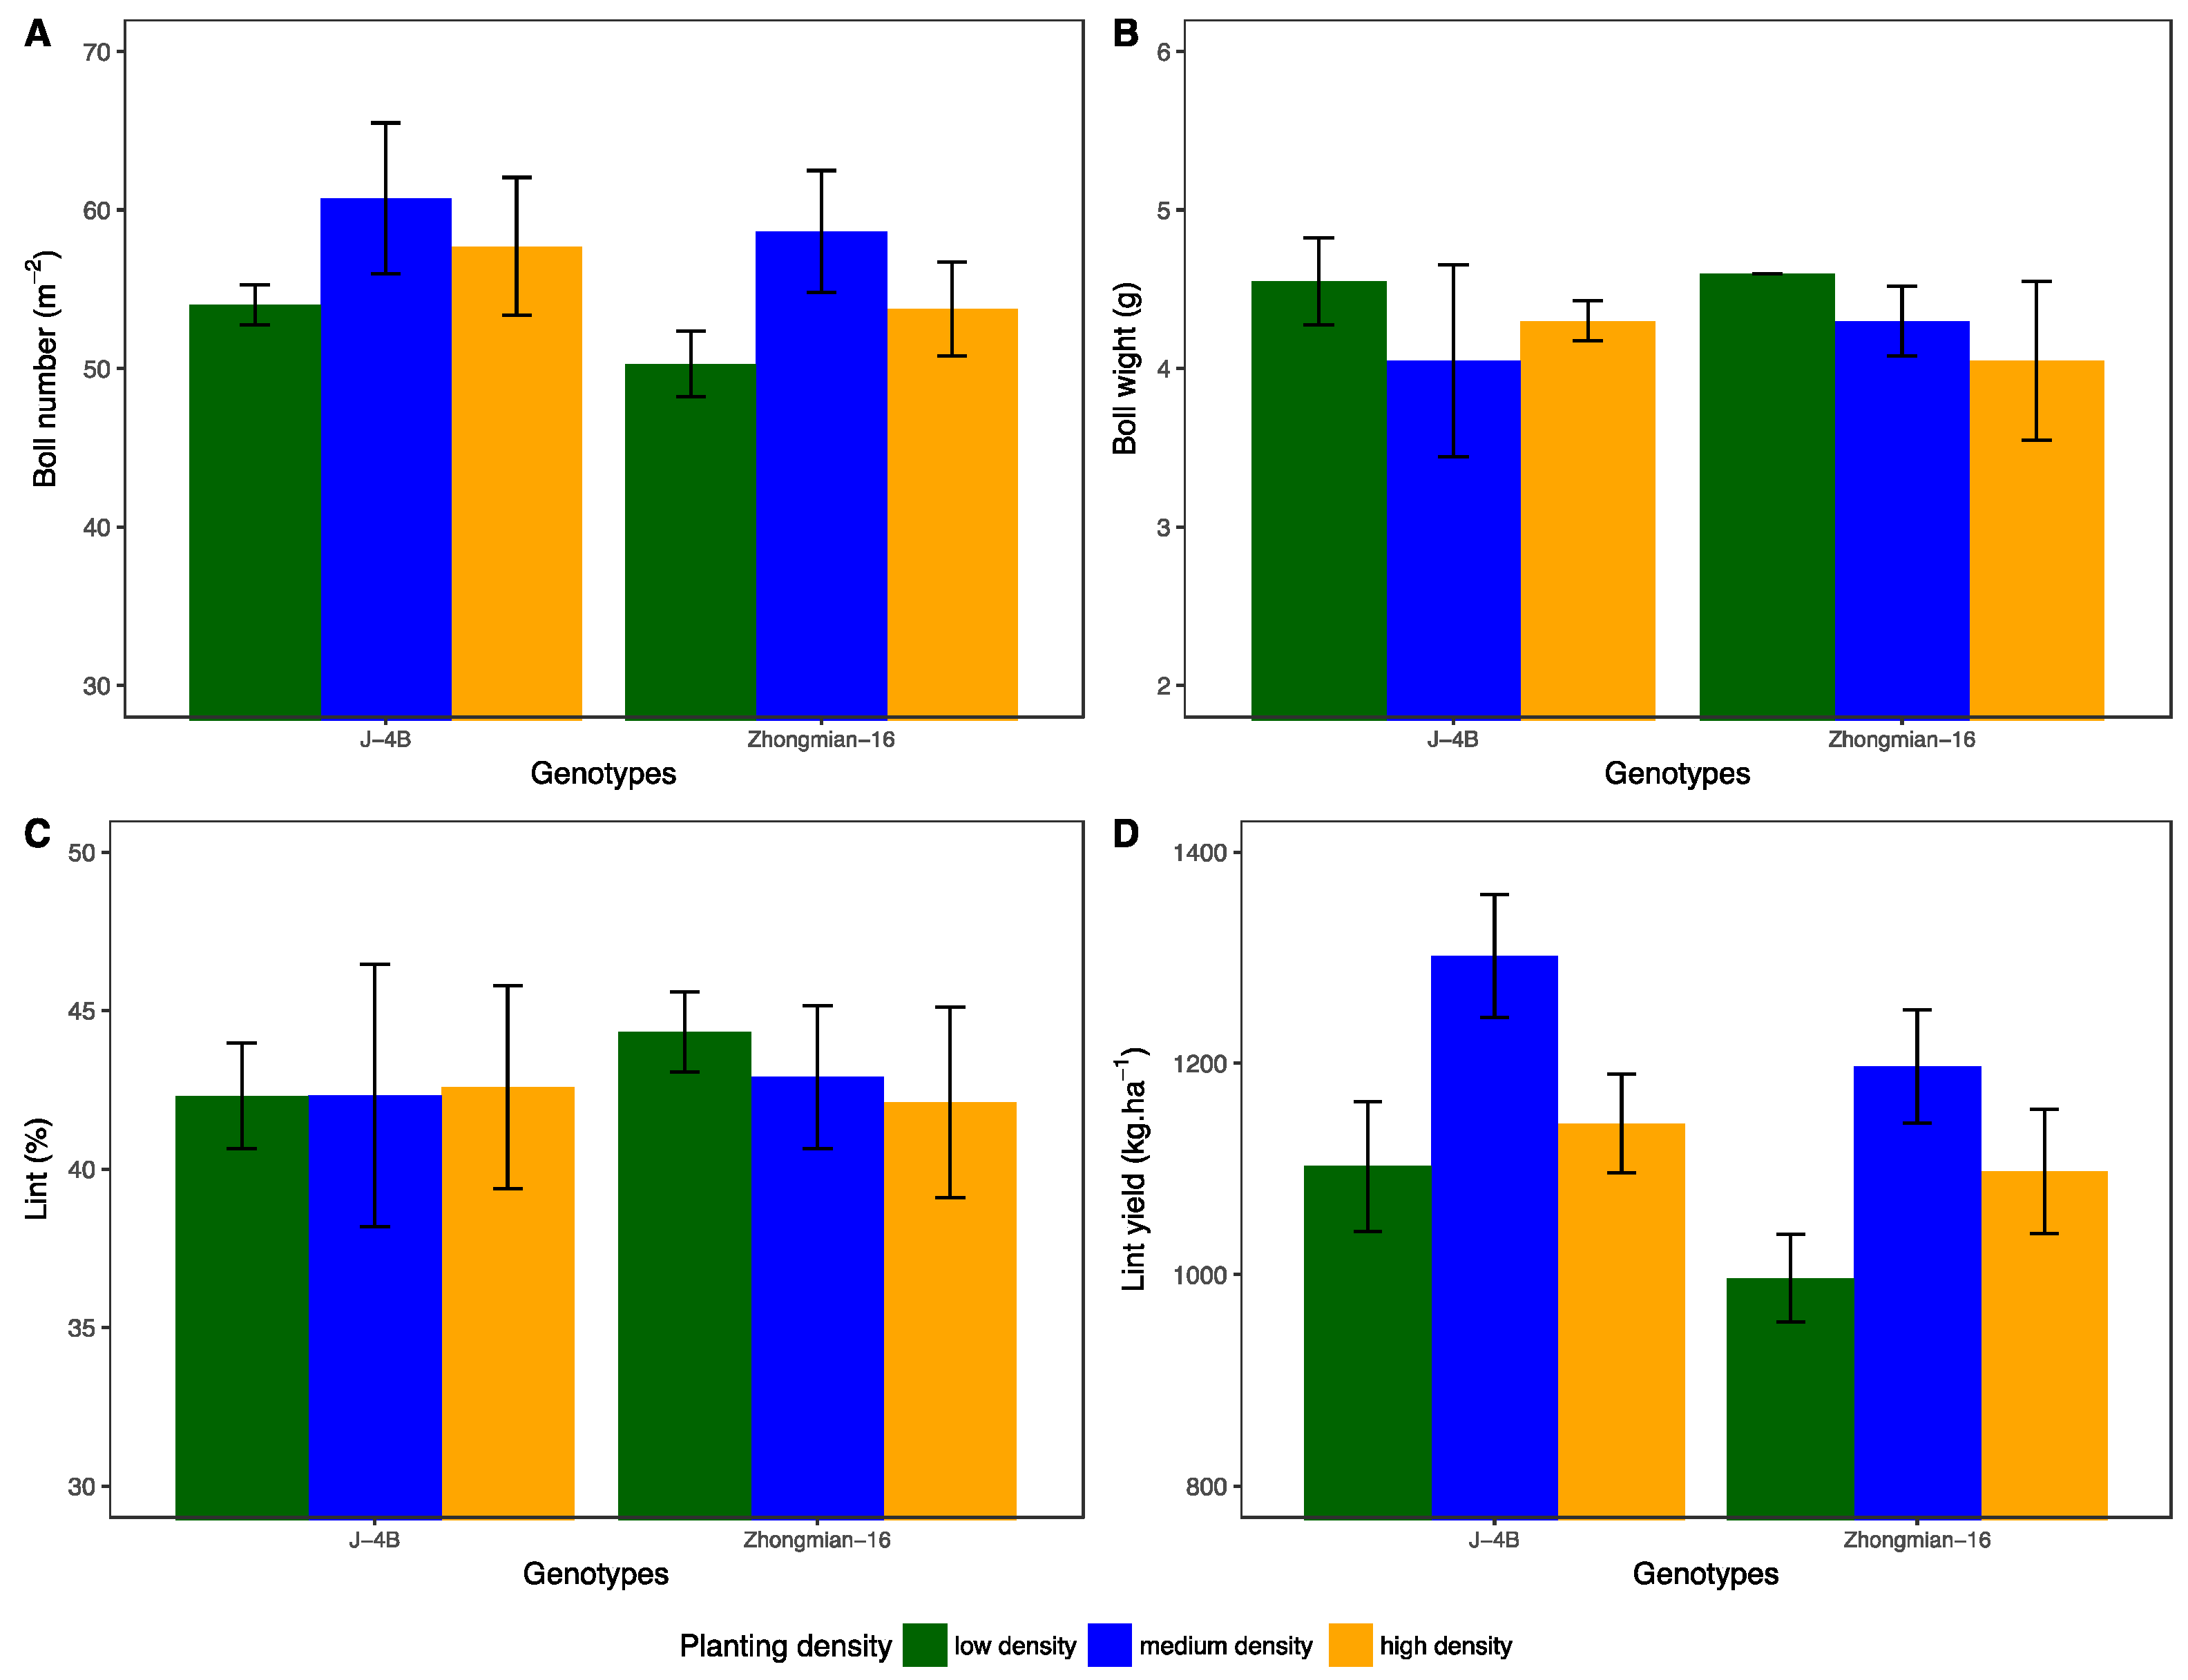
22]. The mechanisms of interplant competitiveness under low-to-high planting density on leaf structure, chlorophyll fluorescence, and leaf gas exchange attributes for optimal cotton lint yield have not yet been reported. Across densities, the moderate population had a higher boll number m−2 with improved lint yield for J-4B compared with Zhongmian-16 across two years. High-density plants substantially reduced yield and yield components in both years, probably due to competition for nutrients. The phenomenon of increased lint yield under moderate density can be associated with improved leaf structural and chlorophyll fluorescence traits and higher leaf photosynthetic capacity, which resulted in higher boll density m-2 compared with other densities.
Moderate density favors dry matter partitioning to the reproductive structures rather than vegetative organs [31] and less fruit shedding compared with denser plants. The reductions in lint yield under high density can be attributed to decreased leaf structural and physiological traits, which were observed in this study. The differences that existed between varieties for yield when changing planting density might be attributable to canopy architecture. Differences in plant canopy architectural traits among varieties have an impact on growth characteristics and lint yield. These data further confirmed that an appropriate selection of variety and optimal density can contribute to successful cotton production. Reducing population density may also have other implications, such as decreased frequency and insecticide inputs per season without any yield loss to increase profit. Moreover, high plant density can substantially depress leaf structural and physiological attributes, which in turn cause a severe yield penalty.
Plants respond to ambient and management interventions via architectural and structural changes. Plant growth and leaf morphological attributes, including stomatal density, size, number of pores, width, length, and leaf thickness features, are pivotal windows regulating leaf photosynthetic capacity [10,25] and offer a structural framework for CO2 exchange and optimization of photosynthetic activities, which in turn can improve crop yield [17]. In this study, high planting density substantially decreased leaf thickness, stomatal density, leaf length, width, and number of stomatal pores. Limitations in these attributes disrupted the photosynthetic capacity of plants by restricting entry of CO2 to the mesophyll through the stomata of leaves, which is extremely responsive to light environments. Thus, the exchange of CO2 by means of stomata might be restricted [32]. Higher stomatal density, thicker leaves, and rapid metabolite transfer between the mesophyll and bundle sheet cells can favor higher leaf photosynthetic capacity [33]. Increasing planting density has been proposed to decrease the stomatal density of wheat leaves [34]. A greater stomatal size can facilitate CO2 distribution into the leaf due to its conductance being proportional to the square of the effective radius of the stomatal pore, resulting in increased stomatal conductance [35]. However, the responses of leaf structural attributes vary under different abiotic stresses in different plant species or varieties [36]. These data suggest that plants under high-density conditions have significantly decreased leaf morphological characteristics, which might be particularly responsible for depressing leaf photosynthetic capacity.
Chlorophyll fluorescence is a nondestructive evaluation of PSII activity. In plant physiology, this technique is commonly used and has become a classical method for crop improvement, screening of beneficial traits, and linking genomic knowledge to phenological response. Due to the sensitivity of PSII to undesirable ambient conditions, this is a useful method for understanding photosynthetic mechanisms and a good indicator of how plants respond to ambient change [37,38].
ΦPSII is a measure of light energy capture efficiency, which reflects the actual primary sunlight energy conversion efficiency of the PSII reaction center [15]. In this study, ΦPSII substantially declined under high-density conditions. Probably, a lower ΦPSII value under high-density conditions did not efficiently convert photon energy to chemical energy; however, this phenomenon needs further exploration. Under shading conditions, a low ΦPSII may be responsible for depressing Pn due to the adjustment in photochemical reaction centers [39], which was observed in our study. The efficient use of limited light energy and the degree of the PSII reaction center openness can increase, resulting in improved energy conversion efficiency. This is associated with the increase of Fv/Fm, ΦPSII, and qP at early shading [40]. The maximal photochemical efficiency of PSII (Fv/Fm) determines the potential quantum efficiency of PSII [41]. In this study, Fv/Fm had higher values under low rather than high planting density, which is consistent with [32], and reductions in Fv/Fm values might be due to the lower values of Fm and increased values of Fo. The ETR is an important chlorophyll fluorescence attribute affected by the external light environment. The rate of ETR declined from low to high density in this study, which corresponds with [40], and shading can significantly decrease ETR values by affecting PSII photochemical reaction centers and consequently diminish the primary stable quinine acceptor of PSII, leading to a decrease in the activity of photosynthetic electron transport efficiency via PSII [27,33]. NPQ can have critical roles in the nonradiative dissipation of surplus light energy [42]. A low-light environment can cause a reduction in NPQ, possibly associated with reduced light energy [32,43]. In this study, a severe decline in NPQ values was noted under high-density compared with low-density crops. This can be explained as the decreased NPQ being associated with the decreased efficiency of photochemical reactions through the reduced fraction of incident light in photochemical energy utilization, which resulted in lower thermal dissipation in PSII [44]. The rate of photochemical quenching (qP) under dense crops showed a substantial reduction compared with low and moderate densities. Probably, a low-light environment can cause reductions in the amount of pigment and the efficiency of photochemical energy conversion, resulting in the depressed quantum yield of PSII and decreased qP. The qP reflects the efficiency of light quantum harvested by PSII to chemical energy and represents the openness degree of the PSII reaction center, and a greater qP results in greater activity of electron transfer in PSII.
Leaf gas exchange traits can play a central role in biomass formation and the prime determination of cotton lint yield [45]. High planting density results in rapid canopy closure and an increase in radiation interception, which reduces weed competition [46], but this impedes leaf gas exchange traits, leading to yield loss [47]. In the current study, cotton leaf gas exchange parameters were substantially depressed under close planting at different growth stages. Accordingly, high-density conditions resulted in reductions in leaf stomatal density, length, width, pores, and leaf thickness, probably due to mutual shading, which may be responsible for depressing stomatal conductance (gs) and CO2 uptake through the stomata, which in turn suppressed the photosynthetic capacity. Plants under high-density conditions can significantly decrease gs and Ci, which can negatively influence the photosynthetic system [38]. The CO2 concentration plays a central role in net photosynthetic rate (Pn), but this varies across species and ambient conditions [48,49]. The gs might respond to alterations in Pn and thus prevents Ci near saturation. The primary function of stomata is to avoid desiccation and enable the passage of CO2. Stomata induce a substantial disruption in the CO2 assimilation rate, which reduces more in C4 than C3 plants. The stomatal limitation of Pn is the role of stomatal resistance to contribute to “resistance” to CO2 uptake and stomatal limitation in spite of a decline in Ci [50]. The higher transpiration (E) rates in low-density conditions may have been due to low mutual shading, which allowed rapid stomata opening. Our data showed that high plant density substantially decreased leaf thickness, stomatal density, width, length, and stomatal pores and resulted in lower Ci and gs, which in turn depressed leaf photosynthetic capacity.

5. Conclusions

In the present study, planting densities and varieties significantly influenced lint yield by affecting leaf stomatal density, thickness, width, length, pore perimeter, leaf gas exchange, and chlorophyll fluorescence characteristics. The J-4B variety in the moderate-density condition produced a higher lint yield due to improved leaf structure, leaf gas exchange, and chlorophyll fluorescence attributes compared with low or high planting densities. Plants at high density substantially depressed leaf stomatal density, thickness, width, length, and pore perimeter, probably due to more competition for nutrients compared with low and moderate planting densities in both varieties. The offset in these attributes further disrupted ΦPSII, Fv/Fm, ETR, and NPQ, which in turn reduced leaf photosynthetic capacity and consequently, lint yield loss. Conclusively, J-4B and Zhongmian-16 grown under medium- and lower-density conditions may be a promising option based on improved leaf structural and functional traits in subtropical regions. Our data will substantially contribute to cotton breeding programs in subtropical environments in the future.

Author Contributions

Conceptualization, A.K. (Aziz Khan) and R.Z.; methodology, A.K. (Aziz Khan); investigation, J.Z., Z.Z., X.K. and A.I.; review and editing, D.K.Y.T. and A.U.; formal analysis, A.K. (Ahmad Khan), K.A. and F.M.; software, M.Z.A., A.B. and S.F.

Funding

We are thankful for the financial supported by National Natural Science Foundation of China (Grant No. 31360348). The supporters did not play any role in the design, analysis, or interpretation of this work and the relevant data.

Conflicts of Interest

The authors declare no conflict of interest.

Abbreviations

PSII, photosystem II; ΦPSII, actual quantum yield of PSII; Fv/Fm, maximal photochemical efficiency of PSII; ETR, electron transport rate; NPQ, nonphotochemical quenching; qP, photochemical quenching; Pn, net photosynthetic rate; gs, stomatal conductance; Ci, intercellular CO2 concentration; E, transpiration rate; HNR, height-to-node ratio; D1, low; D2, moderate; D3, high density; V1, Zhongmian-16; V2, J-4B.

References

  1. Constable, G.A.; Bange, M.P. The yield potential of cotton (Gossypium hirsutum L.). Field Crops Res. 2015, 182, 98–106. [Google Scholar] [CrossRef]
  2. Dai, J.; Dong, H. Intensive cotton farming technologies in China: Achievements, challenges and countermeasures. Field Crops Res. 2014, 155, 99–110. [Google Scholar] [CrossRef] [Green Version]
  3. Khan, A.; Najeeb, U.; Wang, L. Planting density and sowing date strongly influence growth and lint yield of cotton crops. Field Crops Res. 209, 129–135. [CrossRef]
  4. Khan, A.; Wang, L.; Ali, S. Optimal planting density and sowing date can improve cotton yield by maintaining reproductive organ biomass and enhancing potassium uptake. Field Crops Res. 2017, 214, 164–174. [Google Scholar] [CrossRef]
  5. Yao, H.S.; Zhang, Y.L.; Yi, X.P.; Zhang, X.J.; Zhang, W.F. Cotton responds to different plant population densities by adjusting specific leaf area to optimize canopy photosynthetic use efficiency of light and nitrogen. Field Crops Res. 2016, 188, 10–16. [Google Scholar] [CrossRef]
  6. Kalaji, H.M.; Schansker, G.; Brestic, M.; Bussotti, F.; Calatayud, A.; Ferroni, L.; Losciale, P. Frequently asked questions about chlorophyll fluorescence, the sequel. Photosynth. Res. 2017, 132, 13–66. [Google Scholar] [CrossRef] [PubMed] [Green Version]
  7. Dong, H.; Li, W.; Tang, W.; Li, Z.; Zhang, D.; Niu, Y. Yield, quality and leaf senescence of cotton grown at varying planting dates and plant densities in the Yellow River Valley of China. Field Crops Res. 2006, 98, 106–115. [Google Scholar] [CrossRef]
  8. Wherley, B.G.; Gardner, D.S.; Metzger, J.D. Tall fescue photomorphogenesis as influenced by changes in the spectral composition and light intensity. Crop Sci. 2005, 45, 562–568. [Google Scholar] [CrossRef]
  9. Adams, C.; Thapa, S.; Kimura, E. Determination of a plant population density threshold for optimizing cotton lint yield: A synthesis. Field Crops Res. 2019, 230, 11–16. [Google Scholar] [CrossRef]
  10. Yao, H.; Zhang, Y.; Yi, X. Plant density alters nitrogen partitioning among photosynthetic components, leaf photosynthetic capacity and photosynthetic nitrogen use efficiency in field-grown cotton. Field Crop Res. 2015, 184, 39–49. [Google Scholar] [CrossRef]
  11. Antonietta, M.; Fanello, D.D.; Acciaresi, H.A.; Guiamet, J.J. Senescence and yield responses to plant density in stay green and earlier-senescing maize hybrids from Argentina. Field Crop Res. 2014, 155, 111–119. [Google Scholar] [CrossRef]
  12. Sawan, Z.M. Plant density; plant growth retardants: Its direct and residual effects on cotton yield and fiber properties. Cogent Biol. 2016, 2, 1234959. [Google Scholar] [CrossRef]
  13. Luo, Z.; Liu, H.; Li, W.; Zhao, Q.; Dai, J.; Tian, L.; Dong, H. Effects of reduced nitrogen rate on cotton yield and nitrogen use efficiency as mediated by application mode or plant density. Field Crops Res. 2018, 218, 150–157. [Google Scholar] [CrossRef]
  14. Li, P.; Dong, H.; Zheng, C.; Sun, M.; Liu, A.; Wang, G.; Pang, C. Optimizing nitrogen application rate and plant density for improving cotton yield and nitrogen use efficiency in the North China Plain. PLoS ONE 2017, 12, e0185550. [Google Scholar] [CrossRef] [PubMed] [Green Version]
  15. Li, T.; Zhang, Y.; Dai, J.; Dong, H.; Kong, X. High plant density inhibits vegetative branching in cotton by altering hormone contents and photosynthetic production. Field Crops Res 2019, 230, 121–131. [Google Scholar] [CrossRef]
  16. Dong, H.Z.; Kong, X.Q.; Li, W.J.; Tang, W.; Zhang, D.M. Effects of plant density and nitrogen and potassium fertilization on cotton yield and uptake of major nutrients in two fields with varying fertility. Field Crops Res. 2010, 119, 106–113. [Google Scholar] [CrossRef]
  17. Jiang, C.D.; Wang, X.; Gao, H.Y.; Shi, L.; Chow, W.S. Systemic regulation of leaf anatomical structure, photosynthetic performance, and high-light tolerance in sorghum. Plant Physiol. 2011, 155, 1416–1424. [Google Scholar] [CrossRef] [Green Version]
  18. Bondada, B.R.; Oosterhuis, D.M. Comparative Epidermal Ultrastructure of Cotton (Gossypium hirsutum L.) Leaf, Bract and Capsule Wall. Ann. Bot. 2000, 86, 1143–1152. [Google Scholar] [CrossRef]
  19. Anderson, J.M. Photo regulation of the composition, function, and structure of thylakoid membranes. Ann. Rev. Plant Physiol. 1986, 37, 93–136. [Google Scholar] [CrossRef]
  20. Marchiori, P.E.R.; Machado, E.C.; Ribeiro, R.V. Photosynthetic limitations imposed by self-shading in field-grown sugarcane varieties. Field Crops Res. 2014, 155, 30–37. [Google Scholar] [CrossRef]
  21. Naramoto, M.; Katahata, S.I.; Mukai, Y.; Kakubari, Y. Photosynthetic acclimation and photoinhibition on exposure to high light in shade-developed leaves of Fagus crenata seedlings. Flora 2006, 201, 120–126. [Google Scholar] [CrossRef]
  22. Tung, S.A.; Huang, Y.; Hafeez, A.; Ali, S.; Khan, A.; Souliyanonh, B.; Yang, G. Mepiquat chloride effects on cotton yield and biomass accumulation under late sowing and high density. Field Crops Res. 2018, 215, 59–65. [Google Scholar] [CrossRef]
  23. Mao, L.; Zhang, L.; Zhao, X.; Liu, S.; Zhang, S.; Li, Z. Crop growth, light utilization and yield of relay intercropped cotton as affected by plant density and a plant growth regulator. Field Crop Res. 2014, 155, 67–76. [Google Scholar] [CrossRef]
  24. Liao, J.; Ma, F.Y.; Fan, H. Effects of sowing rate on population growth, canopy light distribution and yield of drip irrigated spring wheat. J. Triticeae Crops 2012, 32, 739–742. [Google Scholar]
  25. Pauli, D.; White, J.W.; Andrade-Sanchez, P.; Conley, M.M.; Heun, J.; Thorp, K.R.; Gore, M.A. Investigation of the influence of leaf thickness on canopy reflectance and physiological traits in upland and Pima cotton populations. Front. Plant Sci. 2017, 8, 1405. [Google Scholar] [CrossRef] [PubMed] [Green Version]
  26. Zhou, C.B.; Xie, C. A simple method to quantify the size and shape of stomatal pore. In Proceedings of the 17th International Congress on Photosynthesis Research, Maastricht, The Netherlands, 7–12 August 2016. [Google Scholar]
  27. Genty, B.; Briantais, J.M.; Baker, N.R. The relationship between the quantum yield of photosynthetic electron transport and quenching of chlorophyll fluorescence. Biochim. Biophys. Acta 1989, 1, 87–92. [Google Scholar] [CrossRef]
  28. Oxborough, K.; Baker, N.R. Resolving chlorophyll a fluorescence images of photosynthetic efficiency into photochemical and non- photochemical components-calculation of qP and Fv/Fm without measuring Fo. Photosynth. Res. 1997, 54, 135–142. [Google Scholar] [CrossRef]
  29. Krause, G.H.; Weis, E. Chlorophyll fluorescence and photosynthesis: The basics. Annu. Rev. Plant Biol. 1991, 42, 313–349. [Google Scholar] [CrossRef]
  30. Kromkamp, J.; Barranguet, C.; Penne, J. Determination of microphytobenthos quantum efficiency and photosynthetic activity by means of variable chlrophyll fluorescence. Mar. Ecol. Prog. Ser. 1998, 162, 45–55. [Google Scholar] [CrossRef] [Green Version]
  31. Pettigrew, W.T.; Gerik, T.J. Cotton leaf photosynthesis and carbon metabolism. Adv. Agron. 2007, 94, 209–236. [Google Scholar]
  32. Li, T.; Liu, L.N.; Jiang, C.D.; Liu, Y.J.; Shi, L. Effects of mutual shading on the regulation of photosynthesis in field-grown sorghum. J. Photochem. Photobiol. B Biol. 2014, 137, 31–38. [Google Scholar] [CrossRef] [PubMed] [Green Version]
  33. Szczepanik, J.; Minchin, P.E.H.; Sowiński, P. On the mechanism of C4 photosynthesis intermediate exchange between Kranz mesophyll and bundle sheath cells in grasses. J. Exp. Bot. 2008, 59, 1137–1147. [Google Scholar]
  34. Xiao, Y.; Tholen, D.; Zhu, X.G. The influence of leaf anatomy on the internal light environment and photosynthetic electron transport rate: Exploration with a new leaf ray tracing model. J. Exp. Bot. 2016, 67, 6021–6035. [Google Scholar] [CrossRef] [PubMed] [Green Version]
  35. Xu, Z.; Zhou, G. Responses of leaf stomatal density to water status and its relationship with photosynthesis in a grass. J. Exp. Bot. 2008, 59, 3317–3325. [Google Scholar] [CrossRef] [Green Version]
  36. Liu, S.; Liu, J.; Cao, J.; Bai, C.; Shi, R. Stomatal distribution and character analysis of leaf epidermis of jujube under drought stress. J. Anhui Agric. Sci. 2006, 34, 1315–1318. [Google Scholar]
  37. Stirbet, A.; Lazár, D.; Kromdijk, J. Chlorophyll a fluorescence induction: Can just a one-second measurement be used to quantify abiotic stress responses. Photosynthetica 2018, 56, 86–104. [Google Scholar] [CrossRef]
  38. Murchie, E.H.; Lawson, T. Chlorophyll fluorescence analysis: A guide to good practice and understanding some new applications. J. Exp. Bot. 2013, 64, 3983–3998. [Google Scholar] [CrossRef] [Green Version]
  39. Chen, B.L.; Yang, H.K.; Ma, Y.N.; Liu, J.R.; Lv, F.J.; Chen, J.; Zhou, Z.G. Effect of shading on yield, fiber quality and physiological characteristics of cotton subtending leaves on different fruiting positions. Photosynthetica 2017, 55, 240–250. [Google Scholar] [CrossRef]
  40. Zhong, X.M.; Shi, Z.S.; Li, F.H.; Huang, H.J. Photosynthesis and chlorophyll fluorescence of infertile and fertile stalks of paired near-isogenic lines in maize (Zea mays L.) under shade conditions. Photosynthetica 2014, 52, 597–603. [Google Scholar] [CrossRef]
  41. Singh, S.K.; Badgujar, G.; Reddy, V.R.; Fleisher, D.H.; Bunce, J.A. Carbon dioxide diffusion across stomata and mesophyll and photo-biochemical processes as affected by growth CO2 and phosphorus nutrition in cotton. J. Plant Physiol. 2013, 170, 801–813. [Google Scholar] [CrossRef]
  42. Zhao, W.Q.; Meng, Y.L.; Chen, B.L.; Wang, Y.H.; Li, W.F.; Zhou, Z.G. Effects of fruiting-branch position, temperature-light factors and nitrogen rates on cotton (Gossypium hirsutum L.) fiber strength formation. Sci. Agric. Sin. 2011, 48, 3721–3732. [Google Scholar]
  43. Dai, Y.; Shen, Z.; Liu, Y.; Wang, L.; Hannaway, D.; Lu, H. Effects of shade treatments on the photosynthetic capacity, chlorophyll fluorescence, and chlorophyll content of Tetrastigmahemsleyanum Diels Gilg. Environ and Exp. Bot. 2009, 65, 177–182. [Google Scholar] [CrossRef]
  44. Guo, C.J.; Qi, W.M.; Yi, Z.; Long, W.Y. Effects of shading on photosynthetic characteristics and chlorophyll fluorescence parameters in leaves of Hydrangea macrophylla. Chin. J. Plant Ecol. 2017, 41, 570–576. [Google Scholar]
  45. Zahoor, R.; Dong, H.; Abid, M.; Zhao, W.; Wang Zhou, Y.Z. Potassium fertilizer improves drought stress alleviation potential in cotton by enhancing photosynthesis and carbohydrate metabolism. Environ. Exp. Bot. 2017, 137, 73–83. [Google Scholar] [CrossRef]
  46. Yao, H.; Zhang, Y.; Yi, X.; Zuo, W.; Lei, Z.; Sui, L.; Zhang, W. Characters in light-response curves of canopy photosynthetic use efficiency of light and N in responses to plant density in field-grown cotton. Field Crops Res. 2016, 203, 192–200. [Google Scholar] [CrossRef]
  47. Riar, R.; Wells, R.; Edmisten, K.; Jordan, D.; Bacheler, J. Cotton yield and canopy closure in North Carolina as influenced by row width, plant population, and leaf morphology. Crop Sci. 2013, 53, 1704–1711. [Google Scholar] [CrossRef]
  48. Wang, J.; Chen, Y.; Wang, P.; Li, Y.S.; Wang, G.; Liu, P.; Khan, A. Leaf gas exchange, phosphorus uptake, growth and yield responses of cotton cultivars to different phosphorus rates. Photosynthetica 2018, 56, 1414–1421. [Google Scholar] [CrossRef]
  49. Ku, S.; Edwards, G. Oxygen inhibition of photosynthesis. II. Kinetic characteristics as affected by temperature. Plant Physiol. 1977, 59, 991–999. [Google Scholar] [CrossRef] [Green Version]
  50. Farquhar, G.D.; Sharkey, T.D. Stomatal conductance and photo- synthesis. Annu. Rev. Plant Physiol. 1982, 33, 317–345. [Google Scholar] [CrossRef]
Figure 1. Cotton (in response to different planting densities and cultivars: (a) boll number (m-2); (b) boll weight (g); (c) lint (%); (d) lint yield (kg.ha-1) Values are the sum of three independent replicates. Error bars correspond to confidence interval at p = 0.05.
Agronomy 09 00859 g001
Table 1. Summary of mean square (MS) values from analysis of variance (ANOVA) for cotton yield and yield contributors.
Source of VarianceYearDensityVarietyDensity × Variety
Bolls number (m−2)20.59 *170.7 **96.13 **2.995 **
Boll weight (g)2.402 **0.640 **0.003 ns0.190 **
Lint (%)121.5 **3.001 ns4.448 ns4.749 ns
Lint yield (kg ha−1)50,400 **123,003 **65,451 **3561 **
Different values obtained from ANOVA represent * significant at p < 0.05, ** significant at p < 0.01 and ns: nonsignificant.
Table 2. Cotton leaf structural attributes as influenced by planting density and cultivars.
TreatmentPlant Height (cm)Stomatal Density (mm−2)Stomata Length (µm)Stomata Width (µm)Stomatal Pore Perimeter (µm)Leaf Thickness (µm)
Year (Y)
 Year 201766.9a28.8a146.3a20.8a28.3a143.0a
 Year 201845.6b20.1b125.3b14.3b20.9b106.6b
Density (D)
 D1 (low)57.0a25.3a144.9a18.3a25.6a128.9a
 D2 (moderate)56.1ab24.7a134.6b18.1a24.8b124.5b
 D3 (high)57.0a23.3b127.9c16.3a23.4c121.0c
Varity (V)
 V1 (Zhongmian-16)59.1a23.3b129.2b17.7a23.1b117.9b
 V2 (J-4B)53.5b25.6a142.4a17.5a26.2a131.7a
Source of variance
 Y4091 **689.8 **4001 **381.1 *485.47 **11916.8 *
 D5.53 *12.83 **878.3 **15.55 ns0.422 **3.10 **
 V276.39 **48.22 *1579 **0.358 *89.30 *1717.6 **
 D × V744.18 **256.9 **8971 **208.6 **201.59 *6219.4 **
Values within columns followed by the same letter are statistically insignificant at the 0.05 level. ** significant at p < 0.01 and * significant at p < 0.05. ns: nonsignificant.
Table 3. Quantum and maximum quantum yield of photosystem II (PSII) of cotton cultivars under varied planting densities.
TreatmentSquaringFirst BloomPeak BloomBoll Set
Quantum yield (ΦPSII)
Year
 Year 2017 0.37b0.57a0.57a0.55a
 Year 20180.43a0.51b0.48b0.38b
Density (D)
 D1 (low)0.40a0.53b0.49b0.46b
 D2 (moderate)0.40a0.57a0.58a0.52a
 D3 (high)0.40a0.52b0.50b0.43c
Variety (V)
 V1 (Zhongmian-16)0.38a0.52a0.48b0.52a
 V2 (J-4B)0.41a0.56a0.56a0.56a
Source of variance
 Y0.034 **0.029 **0.07 **0.260 **
 D0.008 ns0.010 * 0.025 **0.038 **
 V0.007 ns0.009 ns0.053 **0.072 **
 D × V0.010 ns0.007 ns0.038 **0.017 *
Maximal quantum yield (Fv/Fm)
Year
 Year 2017 0.79a0.78a0.78a0.73a
 Year 20180.44b0.70b0.76b0.59b
Density (D)
 D1 (low)0.62b0.76a0.78a0.67b
 D2 (moderate)0.63a0.76a0.78a0.70a
 D3 (high)0.59c0.71b0.75b0.62c
Variety (V)
 V1 (Zhongmian-16)0.59a0.74a0.77a0.63b
 V2 (J-4B)0.62a0.74a0.77a0.69a
Source of variance
 Y1.123 **0.057 **0.004 **0.161 **
 D0.006 **0.008 **0.004 **0.023 **
 V0.008 ns0.001 ns0.003 ns0.036 *
 D × V0.008 ns0.017 *0.004 ns0.016 ns
Values within columns followed by the same letter are statistically insignificant at the 0.05 level. * indicate significant at p < 0.05, ** significant at p < 0.01 and ns: nonsignificant.
Table 4. Photochemical and nonphotochemical quenching of cotton cultivars under varied planting densities.
TreatmentSquaringFirst BloomPeak BloomBoll Set
Photochemical quenching (qP)
Year
 Year 20170.63a0.78a0.75a0.7a
 Year 20180.64a0.69b0.61b0.6b
Density (D)
 D1 (low)0.64b0.74b0.65b0.63b
 D2 (moderate)0.60c0.83a0.73a0.79a
 D3 (high)0.66a0.64c0.65b0.58c
Variety (V)
 V1 (Zhongmian-16)0.62a0.70b0.68a0.63b
 V2 (J-4B)0.65a0.77a0.67a0.70a
Variance
 Y0.002 ns0.078 **0.156 **0.137 **
 D0.009 **0.109 **0.023 **0.148 **
 V0.008 ns0.036 **0.002 ns0.048 **
 D × V0.001 ns0.029 **0.016 *0.034 **
Nonphotochemical quenching (NPQ)
Year
 Year 20171.07a1.78a1.86a1.33a
 Year 20180.82b0.64b0.97b0.95b
Density (D)
 D1 (low)1.06a1.39a1.91a1.24a
 D2 (moderate)0.98b1.21b1.26b1.15b
 D3 (high)0.77c1.04c1.08c1.04c
Variety (V)
 V1 (Zhongmian-16)0.94a1.25a1.55a1.18a
 V2 (J-4B)0.94a1.17b1.28b1.10a
Source of variance
 Y0.555 **10.856 **7.124 **1.355 **
 D0.257 **0.374 **2.277 **0.128 **
 V0.001 ns0.051 **0.699 **0.049 ns
 D × V0.007 ns0.002 ns0.613 **0.004 ns
Values within columns followed by the same letter are statistically insignificant at the 0.05 level. ** significant at p < 0.01 and * significant at p < 0.05. ns: nonsignificant.
Table 5. Electron transport rate (ETR) of cotton cultivars at different planting densities.
TreatmentSquaringFirst BloomPeak BloomBoll Set
Year
 Year 2017118.7b168.0a167.6a166.3a
 Year 2018136.3a162.2b130.9b109.9b
Density (D)
 D1 (low)140.7a172.8a156.2a156.0a
 D2 (moderate)125.0b162.3b147.7b131.4b
 D3 (high)116.8c160.3c143.8c126.9c
Variety (V)
 V1 (Zhongmian-16)129.9a167.1a151.9a133.9b
 V2 (J-4B)125.0b163.2b146.6b142.3a
Source of variance
 Y2770 **301.6 **12115 **28685 **
 D1769 **538.1 **478.7 **2940
 V216.1 **126.2 **261.4 **641.8 **
 D × V34.08 **113.9 **50.60 **930.1 **
Values within columns followed by the same letter are statistically insignificant at the 0.05 level. ** significant at p < 0.01 and ns: nonsignificant.
Table 6. Net photosynthetic rate (Pn) and stomatal conductance (gs) of cotton cultivars at varied planting densities.
TreatmentSquaringFirst BloomPeak BloomBoll Set
Photosynthesis (Pn (μmol (CO2) m−2 s−1))
Year
 Year 201725.5a27.0a32.3b35.9a
 Year 201826.0a26.8a32.5a35.7b
Density (D)
 D1 (low)25.8a26.4b31.9c34.8c
 D2 (moderate)25.5b27.7a33.3a36.8a
 D3 (high)25.9a26.2b32.1b35.8b
Variety (V)
 V1 (Zhongmian-16)25.6a26.6b32.1b35.6b
 V2 (J-4B)25.9a27.2a32.7a36.1a
Source of variance
 Y2.576 ns0.276 ns0.681 **0.123 **
 D0.735 **5.623 **6.544 **11.56 **
 V0.664 ns3.453 *3.901 **1.823 **
 D × V0.323 ns0.948 ns7.696 **3.399 **
Stomatal conductance (gs (mol (H2O) m−2 s−1))
Year
 Year 20170.49a0.58a0.45a0.33a
 Year 20180.49a0.55a0.44a0.32a
Density (D)
 D1 (low)0.48a0.54b0.46a0.31b
 D2 (moderate)0.49a0.61a0.46a0.35a
 D3 (high)0.49a0.55b0.42a0.33ab
Variety (V)
 V1 (Zhongmian-16)0.45a0.55b0.43b0.32b
 V2 (J-4B)0.48a0.58a0.46a0.34a
Source of variance
 Y0.001 ns0.005 ns0.003 ns0.006 ns
 D0.003 ns0.027 **0.006 ns0.044 *
 V0.004 ns0.017 **0.019 ns0.064 **
 D × V0.004 ns0.016 ns0.008 **0.006 ns
Values within columns followed by the same letter are statistically insignificant at the 0.05 level. ** significant at p < 0.01 and * significant at p < 0.05. ns: nonsignificant.
Table 7. Intercellular CO2 concentration (Ci) and transpiration rate (E) of cotton cultivars under different planting densities.
TreatmentSquaringFirst BloomPeak BloomBoll Setting
Intercellular CO2 concentration (Ci (μmol (CO2) m−2 s−1))
Year
 Year 2017246.0a274.6a167.6a243.2a
 Year 2018243.8b271.6b164.9b239.3b
Density (D)
 D1 (low)248.7a272.2c164.8b242.2a
 D2 (moderate)244.0b274.7a167.9a242.1a
 D3 (high)241.9c272.4b165.9b239.4b
Variety (V)
 V1 (J-4B)245.9a274.6a166.9a241.5a
 V2 (Zhongmian-16)243.9b271.6b165.5b240.9b
Source of variance
 Y42.25 **81.00 **64.00 **132.25 **
 D145.63 **21.948 **28.89 **29.84 **
 V37.21 **0.0004 **17.64 **2.89 **
 D × V16.74 **8.703 **25.40 **56.12 **
Transpiration rate (E (mmol (H2O) m−2 s−1))
Year
 Year 20176.8a9.1a6.6a4.6a
 Year 20186.7b9.1b6.5b4.4b
Density (D)
 D1 (low)6.6c9.3a6.7a4.4a
 D2 (moderate)6.7b9.1b6.5b4.4b
 D3 (high)6.8a9.0c6.1c4.4b
Variety (V)
 V1 (J-4B)6.68b9.21a6.48b4.52a
 V2 (Zhongmian-16)6.82a9.05b6.68a4.29b
Source of variance
 Y2770 **0.007 **301.6 **28685 **
 D1769 **0.203 **538.1 **2940 **
 V216.0 **0.226 **126.2 **641.8 **
 D × V34.10 **0.139 **113.9 **930.1 **
Values within columns followed by the same letter are statistically insignificant at the 0.05 level. ** significant at p < 0.01 and ns: nonsignificant.

