Article

Response of Annual Weeds to Glyphosate: Evaluation and Optimization of Application Rate Based on Fecundity-Avoidance Biomass Threshold Criterion

1
Departamento de Sistemas de Producción Vegetal- Malezas, Facultad de Ciencias Agrarias, Universidad Nacional de Rosario, Zavalla, Santa Fe 2123, Argentina
2
Monsanto, Pergamino 2700, Argentina
3
Global Change and Photosynthesis Research, USDA-ARS, Urbana-Champaign, IL 61801, USA
4
University of Arkansas, Fayetteville, AR 72704, USA
5
Agricultural University of Athens, Athens GR-11875, Greece
6
ORISE, Global Change and Photosynthesis Research, USDA-ARS, Urbana-Champaign, IL 61801, USA
*
Author to whom correspondence should be addressed.
Agronomy 2019, 9(12), 851; https://doi.org/10.3390/agronomy9120851
Submission received: 8 November 2019 / Revised: 1 December 2019 / Accepted: 3 December 2019 / Published: 5 December 2019
(This article belongs to the Special Issue Weed Management & New Approaches)

Abstract

:
The increased availability and high adoption rate of glyphosate-tolerant crops have selected for several glyphosate-resistant weed species. The response of representative weed species to glyphosate was assessed to provide insights and tools for optimizing glyphosate use for economic, agronomic and environmental reasons. Anoda cristata, Chenopodium album, Digitaria sanguinalis, Eleusine indica and Portulaca oleracea were grown outdoors in pots containing commercial potting medium. An increasing dose of glyphosate was applied to these species at three growth stages. Weed response was evaluated visually compared to the nontreated control and shoot dry weights were recorded. Fecundity was also determined. Based on visual evaluations, the dose of glyphosate required to attain 90% control of the species tested exhibited an application rate margin up to 28.5-fold compared to recommended rate, denoting a potential for rate optimization. Except for A. cristata, the recommended dose of glyphosate could be reduced by 30%–60% and still achieve 90% or greater control. The order of species sensitivity, based on effective dose 50 (ED50 )values, was E. indica > C. album > D. sanguinalis > P. oleracea > A. cristata. The ratio of ED90/ED50 was constant, indicating that increasing the glyphosate dose 8.7-fold would reduce weed biomass 1.8-fold. In most cases, the fecundity-avoidance biomass threshold (i.e., the maximum allowable weed biomass for herbicide application in order to prevent weed seed production and dispersal) for glyphosate was below the ED90 value. Complimentary measures such as fecundity-avoidance biomass threshold will improve herbicide evaluation procedures and preserve the effectiveness of herbicides, including glyphosate, on sensitive species, an important issue particularly when action to reduce herbicide resistance development is highly required.

1. Introduction

Weed management programs relying primarily on a single herbicide with the same mechanism of action, promote the evolution of herbicide-resistant weeds [1]. The continuous and widespread use of glyphosate, for example, since the introduction of glyphosate-resistant (GR) crops in the early ’90s has contributed greatly to the evolution of GR weeds [2,3,4]. Glyphosate [N-(phosphonomethyl)glycine] is a foliar-applied, non-selective, systemic herbicide that has been used extensively throughout the world over the past thirty years [5]. It inhibits the biosynthesis of aromatic amino acids, i.e., phenylalanine, tryptophan and tyrosine, which in turn leads to plant metabolic disruptions through the inhibition of protein and secondary product biosynthesis [6,7].
Glyphosate, following the use of residual herbicides, enabled the exponential increase of no-till systems, which improve soil and water conservation in extensive agricultural production systems worldwide [8]. In these systems, glyphosate is used to knock down vegetation during the fallow period or prior to crop planting and it is usually tank-mixed with a soil-active herbicide such as metsulfuron-methyl, atrazine or other preemergence herbicides for residual weed control.
The adoption of transgenic crops worldwide was reported at 185 million ha in 2016, of which more than 80% of the fields has been planted with herbicide-resistant crops; mostly cotton (Gossypium hirsutum L.), maize (Zea mays L.), soybean (Glycine max (L.) Merr.) and canola (Brassica spp.), almost all being GR [9,10]. USA, Argentina, Brazil, Canada, China and Paraguay are the countries that have the highest adoption of GR technology [9,10]. Despite the significant economic [11] and environmental benefits to agriculture such as reductions in soil disturbance, environmental pollution and cost of food production [12,13] the overuse of glyphosate has exerted unprecedented selection pressure on weed populations, resulting in the evolution of GR weeds [4]. Nevertheless, GR weeds are not yet a problem in many parts of the world, including Argentina where this research was conducted, and actions can be taken to achieve the economic, agronomic and environmental sustainability of the glyphosate in these areas [3,4].
Regarding glyphosate sustainable use one way that it can be achieved is by establishing criteria to improve the accuracy of how glyphosate efficacy is evaluated; usually through the development of dose-response curves that enable the determination of the optimum rate for individual weed species [14,15,16]. Dose-response experiments are widely used to evaluate herbicide effectiveness [14,17,18]. Values describing the growth response of a weed to an herbicide are often estimated from the dose-response curves, and these are used to compare differential susceptibility across weed populations or species. A reference value most commonly used is ED50, the herbicide rate that reduces plant growth by 50%. Sandral et al. [19] used log-logistic dose-response curves to estimate and compare ED50 values of five herbicides applied to subterranean clover (Trifolium subterraneum L.). Carlson and Burnside [20] also compared ED50 estimates to determine the relative sensitivity of several species to the application of four herbicides including glyphosate.
The effectiveness of an herbicide based on assessment of visible control, compared to a nontreated control, allows for a qualitative evaluation of herbicide efficacy [21]. Nevertheless, little information is provided on potential weed fecundity associated with the herbicide treatment [22]. The long-term impact of an herbicide program on weed population dynamics is related to the reduction in weed seed production potential associated with the herbicide treatments [22]. Recurrent selection, especially with reduced herbicide rates, results in high risk of evolution of herbicide resistance [23]. Most common weed species have high fecundity outputs coupled with viable and dormant seeds [24] and the use of low herbicide rates could cause a fast buildup of the seedbank [25].
Glyphosate and GR crops have significantly facilitated the improvement of weed management and production practices through higher efficacy and simplification of weed control [26]. However, glyphosate is no longer broadly effective as it once was, hence the renewal of weed management approaches is required [26]. Integrated weed management approaches, for example, are needed that will allow the continued use of glyphosate as a tool for weed management. Glyphosate use is valuable because abandoning glyphosate would reverse the progress that has been made toward practicing conservation agriculture. It is therefore imperative to develop means of preserving the remaining utility of glyphosate and to delay the development of herbicide resistance on new herbicide resistance technologies involving glufosinate, 2,-D and dicamba.
Glyphosate at the recommended rate is effective on the majority of broadleaf and grass weeds species when applied at 1–2 tillers for grass weeds or 5–7 cm for broadleaf species, but we hypothesized that a higher rate may be required to control plants at later growth stages depending on the weed species. Furthermore, including weed fecundity assessment is vital in evaluating the efficacy of herbicide treatments. It has been reported that herbicide rotation alone cannot prevent the development of herbicide resistant weeds [4,26]. Complementary measures such as fecundity-avoidance biomass threshold, i.e., the maximum allowable weed biomass for herbicide application in order to prevent weed seed production and dispersal, need to be included in the herbicide efficacy evaluation procedures and weed management programs.
Therefore, our objective, using glyphosate dose-response curves, was to re-assess the evaluation process of herbicide efficacy. In addition, based on these assessments, to recommend ways to optimize application rate margins based on key weed species, selected growth stages, and fecundity-avoidance biomass threshold. This approach could assist in preserving the effectiveness of successful herbicides such as glyphosate on sensitive weed species, an issue that is still of great importance. In addition, this approach can be applied on automated weed control and robotics technology for targeted rate-species specific applications.

2. Materials and Methods

2.1. Experimental Set-Up

Seeds of Anoda cristata, (L.) Schltdl. (crested anoda), Chenopodium album L. (lambsquarters), Digitaria sanguinalis (L.) Scop. (large crabgrass), Eleusine indica (L.) Gaerth (goosegrass) and Portulaca oleracea (L.; purslane) were collected from local weed populations from GR soybean fields nearby university experimental station, located in Zavalla, Pampa, Argentina (33°1′ S, 60°53′ W). Based on previous surveys at 5000 points-quadrats in more than 300 fields these species were the most frequent [27,28]. Seed samples before the initiation of the experiments were stored in sealed vials at 5 °C and were sown in a 3 L plastic pot containing a commercial potting mix. Once established, weed seedlings were thinned to three per pot and were grown outdoors under a temperature range of 18–32 °C. The plants were watered as needed.

2.2. Herbicide Application

Glyphosate as isopropylamine salt (600 g ae L−1) was applied at 0, 0.24, 0.48, 0.96, 1.92 and 3.84 kg ae ha−1; with each rate logarithmically increased from a rate that caused no observable injury to a rate that caused severe damage or death as preliminary data had indicated (results not shown). Glyphosate was applied using a RDS knap-sack sprayer equipped with a hand-held boom with four TeeJet 8002 flat fan nozzles (TeeJet Technologies, Springfield, IL, USA) calibrated to deliver 140 L ha−1 at an operating pressure of 30 kPa at three weed growth stages (Table 1a,b). Average air temperature during herbicide application was 18.1 (±0.4 °C), 21.0 °C (±1.5 °C), 20.7 °C (±0.1 °C) and 19.0 °C (±1.8 °C) and relative humidity was 78.1% (±8.3%), 86.7% (±5.0%), 85.4% (±0.5%) and 86.4% (±6.2%) for the four trials, respectively. Wind speed was less than 1 km h−1 or 0 force in Beaufort wind scale.

2.3. Experimental Design and Data Collection

Each weed species was treated as an independent trial in a two-factor factorial design with the factors being the growth stage (i.e., three growth stages were defined for herbicide application) and application rate, in a randomized complete block design with four replications. Each species/trial was conducted four times (runs) across two growing seasons (a and b). Runs 1a and 2a were conducted in late spring, whereas runs 1b and 2b in late summer. The shoot tissue of two plants per pot were harvested 14 days after treatment (DAT), after the evaluation of weed control, which was conducted using a 0–100 scale. The shoot tissues were oven-dried at 110 °C for 72 h. and weighed. Weed response to glyphosate was expressed as dry weight relative to the nontreated plants and as % control relative to the nontreated plants.
The third plant was left in the pot until maturity, usually three to four weeks after treatment. At maturity, the plants were harvested, dried, weighed and threshed manually for seed collection. Seeds were separated from debris using meshes of various size-openings and/or a blower. The number of seeds per plant for A. cristata was determined by counting all the cleaned seeds. The total seed production per plant of P. oleracea was estimated using a linear regression model generated with the data for seed number and seed weight of four subsamples containing 10, 50, 100 and 150 seeds each. For D. sanguinalis and E. indica, the total seed production per plant was estimated by counting the seeds from 10 randomly selected spikes of each plant. Seed number per plant was expressed as % of the nontreated control.

2.4. Models Used and Data Analysis

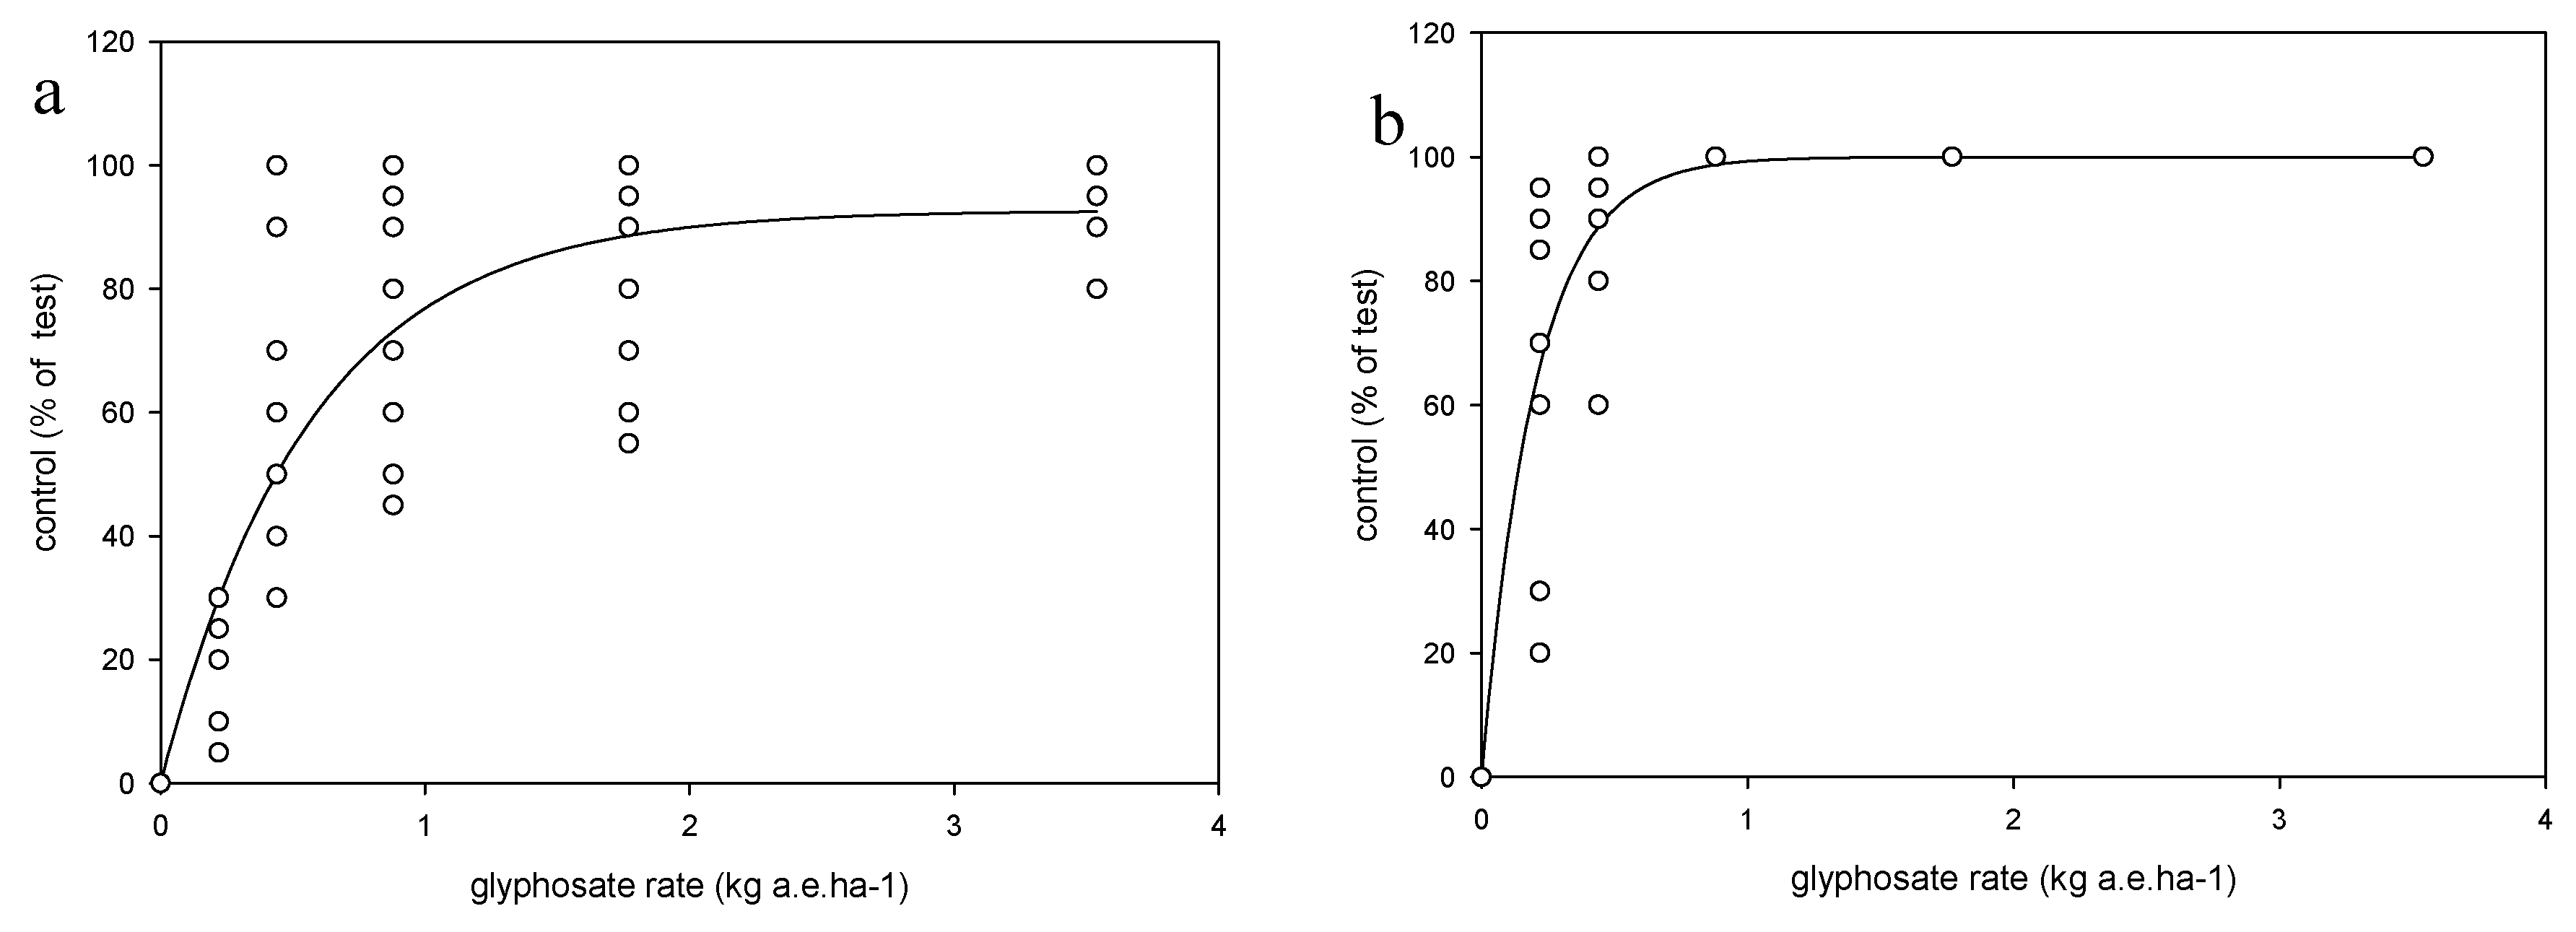
Exponential models (Equation (1)) for each species were fitted to the weed control ratings at 14 DAT:
y = a (1 − bx),
where y = percentage control rating; x = application rate (kg ae ha−1) and a and b = model parameters.
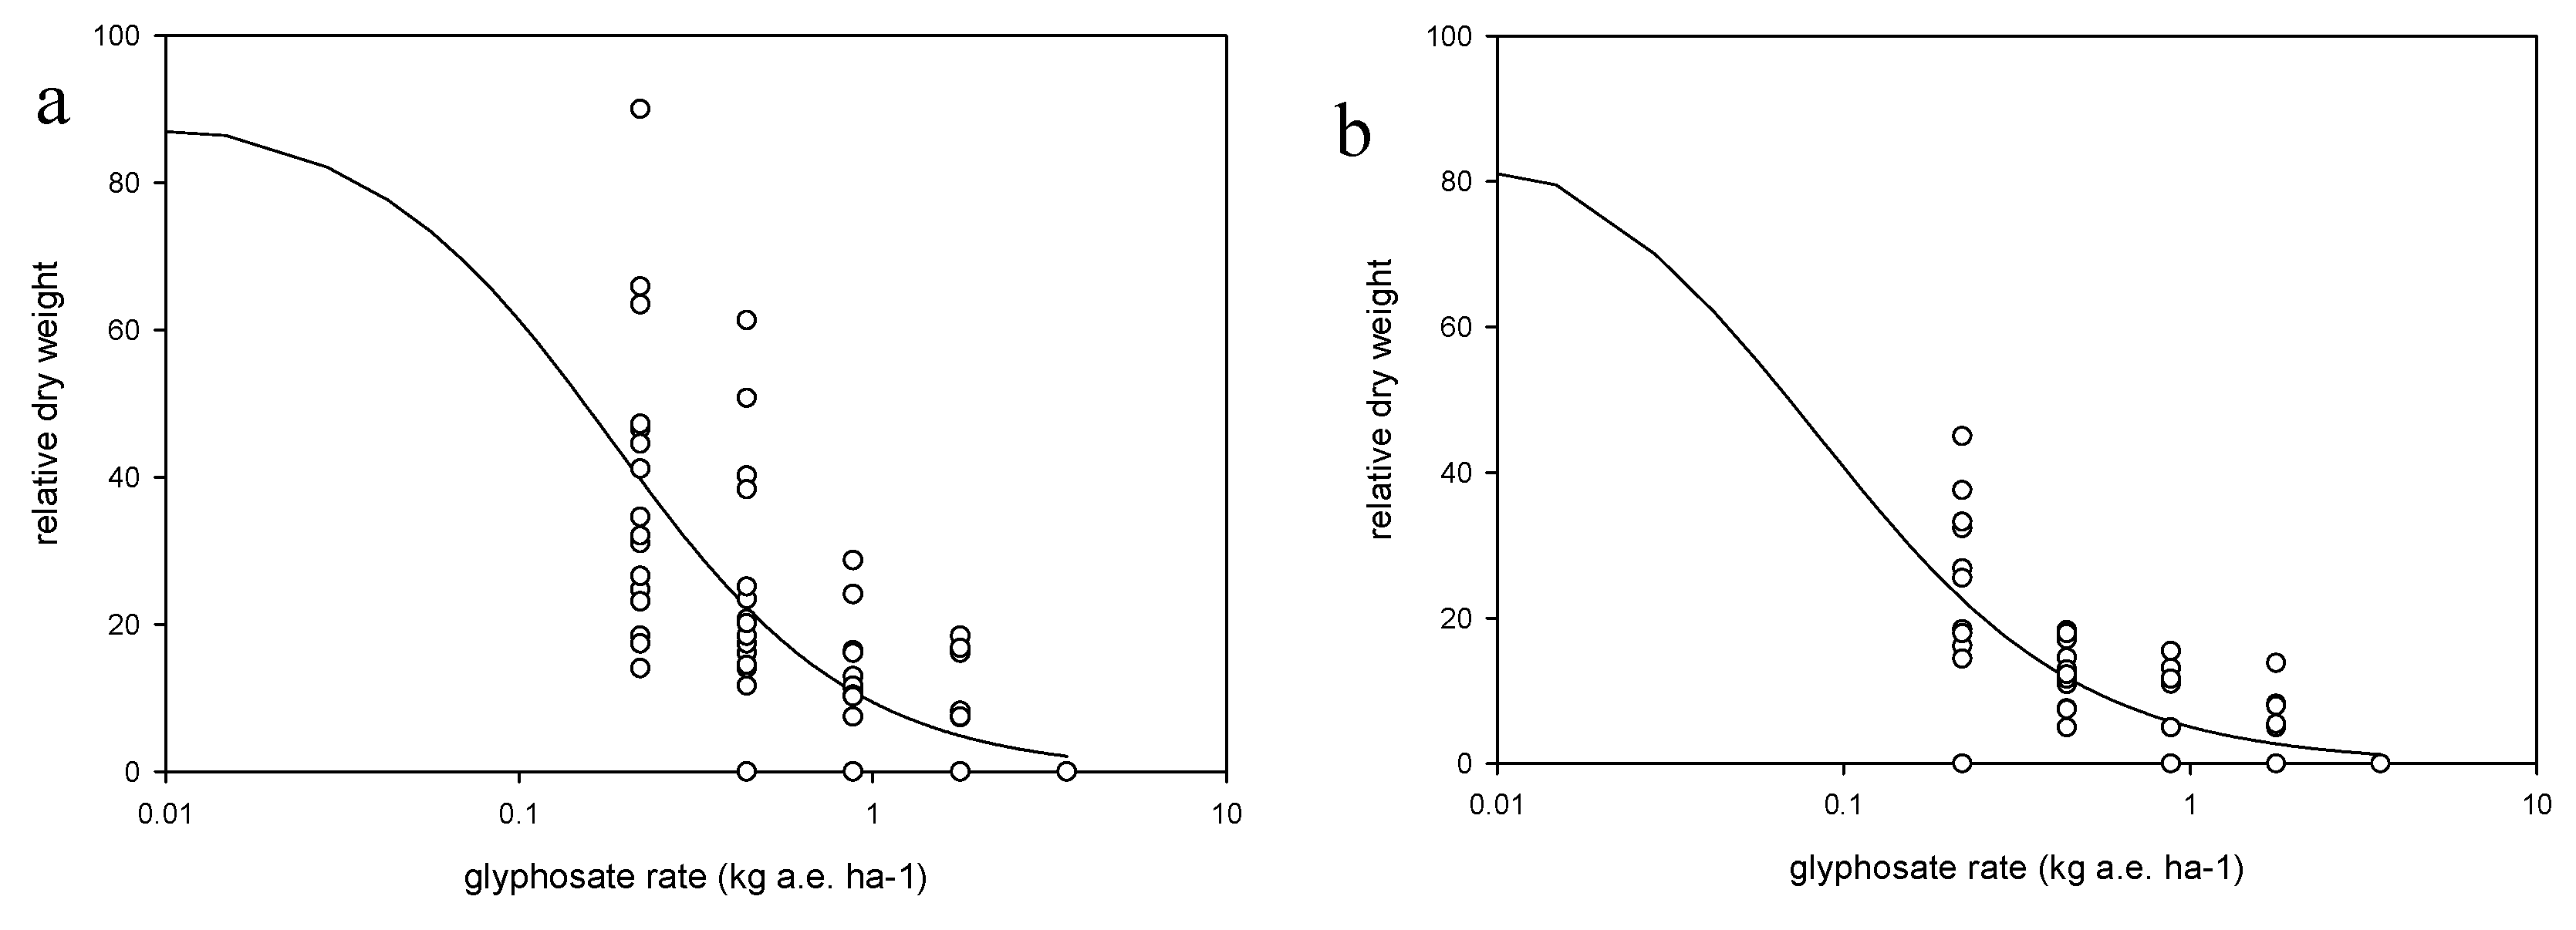
To quantify the response of weed species to glyphosate application rate a log-logistic model was fitted to the dry shoot biomass data (Equation (2)).
Y = D/1 + [exp (b log (x/ED50))],
where Y = shoot biomass (g plant−1); x = rate of glyphosate application (kg ae ha−1); D = the upper limit of the curve asymptote; b = the rate of change (slope) near the inflexion point denoted by ED50. The model was reduced from the original model proposed by Streibig and Kudsk [14] because the lower limit of the logistic function was zero (the original model involved a parameter C determining the lower boundary of the logistic curve). This is a reasonable assumption, as postulated by Madsen and Jensen [29], as plants were killed at the highest dose.
For practical weed control, the ED90 value is more relevant than the ED50. Therefore, a logistic model can be reparametrized to calculate the ED90 value (Equation (3))
Y = D/1+ exp [ b (log (x/ED90) + log (9)/b)],
where Y = shoot biomass (g plant−1); x = glyphosate application rate (kg ae ha−1); D = upper limit of the curve asymptote and b = rate of change (slope) near the inflexion point denoted by ED90.
The number of seeds per plant was linearly related to seed dry weight in P. oleracea as described in Equation (4) which was used to estimate fecundity.
Y(seed number) = 0.109 (±0.011) × seed weight (in mg) + 0.256(±0.273).
Linear models were fitted to relative seed number as follows:
y = bx + a,
where x is shoot dry weight, a and b constants, i.e., slope and seed output increase per unit of plant biomass increase.
The following equation for the estimation of seed production for C. album was used [30]:
y = 265x − 25,
where y = estimated seed production and x = biomass production.
Arcsin transformations were used (e.g., when dependent variable was a proportion or percentage) and transformed data were then used to fit the models described above based on least squares techniques, using SPSS, Statgraphics and SigmaPlot software. Test for constant variance and residuals means square error (RMSE) were carefully observed in order to determine quality of regressions fit to data. Analysis of variance (ANOVA) between experimental runs for the weed control, biomass and ED90 parameters, described in equations 1, 2 and 3, revealed no significant differences (p > 0.05) among the experimental runs, hence the data were pooled, and models fitted to pooled data. For seed production the data were not pooled, so each species × run was analyzed separately. Analyses of variance also were performed on each species for parameters a and b (Equation (1)) and for parameters D, b and ED50 (Equation (2)), and ED90 (Equation (3)) to test differences among experimental runs at p > 0.05.

3. Results and Discussion

3.1. Visual Evaluations of Weed Control and Glyphosate Application Rate Efficacy

Glyphosate application rate of 0.14 to 3.99 kg ae ha−1 provided 90% control averaged across growth stage 1, 2 and 3 of the five species tested at 14 DAT (Table 2). The application rates recorded in this research are in agreement with Krausz and Kapusta; Mulugueta and Boerboom and Umeda and Hicks [31,32,33]. It is important to highlight that the interaction of species × plant size at the time of herbicide application necessitates the accurate evaluation of weed size to refine the herbicide rate for multi-species weed communities.
Therefore, 1 kg of glyphosate ae ha−1 application rate could adequately control E. indica, D. sanguinalis and C. album, at any of the three growth stages tested, but not A. cristata and P. oleracea at growth stages later than 1 (Figure 1a and Figure 2a). The more advanced the growth stage of the weed, the higher would be the glyphosate rate needed to achieve 90% control. However, weed species per se affects the dose needed to achieve 90% control, as in the case of A. cristata and P. oleracea (Table 3). Based on ED90 values, the ranking of glyphosate rates may be grouped into three categories: namely, very low rates (0.14–0.50 kg ae ha−1) for highly sensitive species or growth stages; intermediate rates (0.61–0.96 kg ae ha−1) and high rates (1.27–3.99 kg ae ha−1) for tolerant species or more advanced growth stages.
The glyphosate rates between low and high sensitivity categories differ up to 28.5-fold, indicating a wide sensitivity spectrum among the representative weed species and, consequently, a wider margin for the optimization of herbicide application rate. Based on the weed control ratings, the order of species sensitivity was C. album > D. sanguinalis > E. indica > P. oleracea > A. cristata. Sensitivity to glyphosate declined with advancing growth stages in all species (Table 3). These findings agree with those reported by Higgins et al. [34] and Krausz et al. [31] for C. album.

3.2. Reduced Glyphosate Doses Are as Effective as the Label Recommended Rates

Environmental variation and field conditions a weed species is experiencing affect herbicide efficacy, and product label recommendations are established to account for such variations. Nevertheless, the data presented in this work suggest that it is possible to reduce the glyphosate application rate relative to the label recommendation. The recommended rate range in Argentina, for example, for the grass species tested (i.e., D. sanguinalis and E. indica) is between 0.9 and 2.1 kg ae ha−1. Based on the control ratings, the herbicide application rates could be lowered between 0.33 and 0.90 kg ae ha−1, the average gap rate being about 60%. Furthermore, the recommended rate for the control of C. album in Argentina ranges between 0.9 and 1.8 kg ae ha−1 whereas, based on this research, the application rate could be reduced to 0.14–0.72 kg ae ha−1. For P. oleracea, the recommended rate range in Argentina is between 1.2 and 3.0 kg ae ha−1; the results presented here suggest that the rate range may be 0.69–1.28 kg ae ha−1, a reduction of 33%. The current recommendation rate for A. cristata in Argentina is 1.2–3.0 kg ae ha−1 similar to the results presented here for plants of small and medium sizes. However, beyond growth stage 3 the recommended rate for adequate control of A. cristata should be increased to 3.99 kg ae ha−1. Justifications for reducing herbicide rates should be based on the fact that dominant weed species are very susceptible to the herbicide, therefore herbicide efficacy under reduced rates will provide maximum effects. Additionally, the conditions at application time, growth stage of weeds, crop vigor and climate are optimum, thus allowing for reduced herbicide rates.

3.3. Weed biomass, Species Sensitivity and the Usefulness of ED Values

The glyphosate rate needed to achieve 50% biomass reduction was ranged from 0.01 to 0.41 kg ae ha−1 (Table 4). In respect the individual weed species ED50 values for D. sanguinalis ranged from 0.09 to 0.20 kg ae ha−1 and were similar to these reported by Tharp et al. [33] who calculated a value of 0.12 for plants with four to six leaves and 18–25 cm height. The ED50 values for C. album ranged from 0.08 to 0.16 kg ae ha−1 and were comparable to the values reported by Tharp et al. [35]. A. cristata (Table 4), P. oleracea (Table 4 and Figure 2a) exhibited greater ED50 values of 0.12–0.41 kg ae ha−1 whereas E. indica exhibited lower ED50 values between 0.01 and 008 kg ae ha−1 (Table 4 and Figure 2b). In all cases, the ED50 for glyphosate increased as the weeds developed. The species sensitivity inferred from ED50 values estimated using shoot biomass data (Table 4) was in the order of E. indica > C. album > D. sanguinalis > P. oleracea > A. cristata. The order of species sensitivity based on ED90 (Table 5) was slightly different, with E. indica > P. oleracea > C. album > D. sanguinalis > A. cristata. The relative consistency of the ratio ED90/ED50 (Table 5), for all species tested, indicates that glyphosate rate should be increased about 8.7 times to reduce the weed biomass 1.8 times. Discrepancies in the order of magnitude may be attributed to model fitting variations. The general trend was similar since extremes of the scales were the same for ED50 and ED90. It is also important to emphasize that the ratio of ED90 (Equation (2))/ED90 (Equation (1)) was in the average of 2.2; meaning, the herbicide required to effect 90% reduction of total biomass was 2.2 higher than that required to achieve 90% of control based on visual ratings.

3.4. Fecundity-Avoidance Biomass Threshold Is Useful in Herbicide Efficacy Evaluations

Fecundity-avoidance biomass threshold was estimated based on seed production of nontreated weed species (Table 6) and Equation (5), which describes seed outputs in herbicide-treated surviving plants, the parameters of which are shown in Table 7. Equation (5) allowed the calculation of the biomass that would result in zero seed production (i.e., x = −a/b for each species and size). This simple allometric relationship has limitations, however, because it only considers biomass production as a factor for any species to set seed. In reality, seed production is also a function of photoperiod and/or thermoperiod, tiller potential and crop density. Nevertheless, the “fecundity-avoidance biomass threshold” proposed in this study would allow the integration of the fecundity aspect in all herbicide dose-response evaluations. The data demonstrated that there was a minimum biomass for the plant to set seed (a negative intercept in a linear-allometric relationship) as intuitively seems normal, and in coincidence with Thompson et al. [36] and Rasmussen [30] and Lutman [37]. Although allometric linear relationships among seed numbers and plant weight have been determined for many plants [38], the relationship described by Equation (5) seemed to be inadequate below a threshold size (Table 8); in such cases an exponential model might more reasonably describe the relationship between seed production and plant size.

3.5. Fecundity-Avoidance Biomass Threshold: Considerations and Boundaries

The effects of plant density on fecundity are of primary importance in population dynamics and size-regulated weed populations [38,39]. Considering the findings in this study and in conjunction with reports by Lindquist et al. [40] and Bussan et al. [41], who have measured the effects of herbicides and crop systems on weed survival and seed output, demographic processes should be considered in studies related to herbicide efficacy evaluations. Even if early season weed populations are killed, as in the case of Amaranthus palmeri, the late-emerged populations are still capable of producing seeds at crop harvest time [42]. The assumption that biomass reductions of weed survivors, particularly at lower herbicide rates, are accompanied by proportional reductions in flowering and seed set may be appropriate under certain circumstances. For instance, Clay and Griffin [43] reported that glyphosate rate as low as 0.42 kg ae ha−1 can reduce seed production of Xanthium strumarium L., Sesbania exaltata a (Raf.) Rybd. ex A. W. Hill and Senna obtusifolia L. These authors stated that the application of glyphosate during seed formation might affect levels of indole-3-acetic acid in the seed and inhibit seed germination and seedling emergence. Furthermore, the accuracy of seed estimation for grass weed species also needs to be improved. Forcella et al. [44] reported that viable seed production of Setaria spp. is curvilinearly related to panicle length; the frequency distribution of panicle lengths within a population closely follows a nonlinear Weibull function. These relationships are stable across years and crops, but not to species or herbicide treatment.

3.6. Fecundity-Avoidance Biomass Threshold and Glyphosate Efficacy Evaluations

The “fecundity-avoidance biomass threshold” in relation to glyphosate rate (Table 9) might vary according to species and growth stage. For a highly susceptible weed species such as D. sanguinalis, the glyphosate rate, at growth stage 1, could be as low as 0.23 kg ae ha−1. For less sensitive weeds species such as A. cristata and P. oleracea, glyphosate rates, at growth stage 3, were between 0.90 and 1.11 kg ae ha−1. The inclusion of the “fecundity-avoidance biomass threshold” in weed control strategy shows that glyphosate rate reduction, especially for tolerant species in advanced growth stages, was not feasible.
Glyphosate efficacy is also affected by application variables and environmental conditions as demonstrated by Devine et al. and Jordan et al. [45,46]. The environmental and crop conditions in which the weed is growing may also influence the degree of herbicide efficacy. Ateh and Harvey [47], for example, found that control of Setaria faberii Herrm in narrow-row soybean was very high (>90%) at all rates and times of glyphosate application; however, in wide–row soybean, the lowest rate (0.210 kg ha−1) did not control the weed. The application rates of herbicides are established to ensure control of as many weed species as possible under conditions that may be less than optimal for herbicide activity [48]. Herbicides applied at lower than the recommended rates can control susceptible weed species if applied at an optimal growth stage in favorable growing conditions [49] and [50]. Nevertheless, as reported by Renton et al. [51] careful consideration is needed as lowering the herbicide rate can lead to faster development of herbicide resistance.

4. Conclusions and Implications

Under field conditions many interlinked factors affect the efficacy of herbicides (Doll et al. [52]) and some situations necessitate a full rate. The best agronomic practices (e.g., reducing row spacing, planting fast LAI-development varieties and optimum plant population) are necessary to improve the performance of low herbicide rates. Dose-response parameters are highly sensitive to changes in management and development of the crop weed canopy [41]. Crop rotation, in combination with reduced tillage, significantly decreases the seed production of grasses and broadleaved weeds regardless of the level of management input applied [53]. Further, weed species emerged simultaneously in the field; thus, the field rate should be targeted to the most tolerant species. Nevertheless, our findings emphasized that rates were weed- and size-specific and for that matter, effective control of tolerant species was most particularly dependent on weed size. Thus, weed size should be reported precisely, as proposed by Lancashire et al. [54] and should be linked with fecundity-avoidance biomass threshold for improving evaluations on herbicide efficacy, hence weed management programs. Improving product labeling concerning the precision of herbicide recommendation rates could improve the evaluation of herbicide efficacy. Discrepancies in the glyphosate rates needed to achieve a certain control level and have reported in the literature may be due to considerable variation in weed sizes. Recent research has shown that digitized photographs of very detailed sizes, for example, are a useful tool to overcome this difficulty. In addition, models that predict patterns of weed emergence, coupled with size estimation [55], are of most importance to refine herbicide rate recommendations for different cropping systems. The development and further refinement of such information is of major importance towards a justified use of herbicides. Future robotic weed control systems will be able to collect data about the presence of weeds, facilitate storage and analysis of those data, support decision making about when and where to control weeds by using image recognition software, execute weed control with variable rate spray technologies, as an improvement of “see and spray” or “spot and spray” technologies, and then gather data about the efficacy of the treatment and thus allow evaluation of decisions [56].

Author Contributions

The research was perceived and conducted by E.S.L. and G.F., the manuscript was written by N.E.K., E.S.L. and G.F., manuscript edits made by N.E.K., M.M.W.II, N.R.B. and I.T.

Funding

This research received no external funding.

Acknowledgments

The authors are grateful to our skilled technician J. R. Pérez, to undergraduate pupils who collaborated in the trials, to Laura María Leguizamon who carefully corrected spelling and last but no least to J. Doll who made important contributions to the original manuscript. Trials were conducted under Project 08-03866 funded by Agencia Nacional de Promoción Científica y Tecnológica (ANPCYT-FONCYT-Argentina).

Conflicts of Interest

The authors declare no conflicts of interest.

Disclaimer

This research was supported in part by an appointment to the Agricultural Research Service (ARS) Research Participation Program administered by the Oak Ridge Institute for Science and Education (ORISE) through an interagency agreement between the U.S. Department of Energy (DOE) and the U.S. Department of Agriculture (USDA). ORISE is managed by ORAU under DOE contract number DE-SC0014664. All opinions expressed in this paper are the author’s and do not necessarily reflect the policies and views of USDA, DOE, or ORAU/ORISE. Any opinions, findings, conclusions, or recommendations expressed in this publication are those of the author(s) and do not necessarily reflect the view of the U.S. Department of Agriculture. Mention of trade names or commercial products in this publication is solely for the purpose of providing specific information and does not imply recommendation or endorsement by the U.S. Department of Agriculture. USDA is an equal opportunity provider and employer.

References

  1. Beckie, H.J. Herbicide-resistant weed management: Focus on glyphosate. Pest Manag. Sci. 2011, 67, 1037–1048. [Google Scholar] [CrossRef] [PubMed]
  2. Culpepper, A.S.; Grey, T.L.; Vencill, W.K.; Kichler, J.M.; Webster, T.M.; Brown, S.M.; Hanna, W.W. Glyphosate resistant Palmer amaranth (Amaranthus palmeri) confirmed in Georgia. Weed Sci. 2006, 54, 620–626. [Google Scholar] [CrossRef]
  3. Powles, S.B. Evolved glyphosate-resistant weeds around the world: Lessons to be learnt. Pest Manag. Sci. 2008, 64, 360–365. [Google Scholar] [CrossRef] [PubMed]
  4. Heap, I. The International Survey of Herbicide Resistant Weeds. 2019. Available online: http://www.weedscience.org (accessed on 20 September 2019).
  5. Nandula, V.K.; Reddy, K.N.; Duke, S.O.; Poston, D.H. Glyphosate-resistant weeds: Current status and future outlook. Outlooks Pest Manag. 2005, 16, 183–187. [Google Scholar] [CrossRef]
  6. Franz, J.E.; Mao, M.K.; Sikorski, J.A. Glyphosate: A Unique Global Herbicide. In ACS Monograph; American Chemical Society: Washington, DC, USA, 1997; p. 653. [Google Scholar]
  7. Duke, S.O. Taking stock of herbicide-resistant crops ten years after introduction. Pest Manag. Sci. 2005, 61, 211–218. [Google Scholar] [CrossRef]
  8. Garcia, F.O.; Ambroggio, M.; Trucco, V. No Tillage in the Pampas: A Success Story. Bet. Crop. Int. 2000, 14, 24–27. [Google Scholar]
  9. Pellegrino, E.; Bedini, S.; Nuti, M.; Ercoli, L. Impact of genetically engineered maize on agronomic, environmental and toxicological traits: A meta-analysis of 21 years of field data. Sci. Rep. 2019, 8, 3113. [Google Scholar] [CrossRef] [Green Version]
  10. Duke, S.O.; Powles, S.B. Glyphosate-resistant crops and weeds. Now and in the future. AgBioForum 2009, 12, 346–357. [Google Scholar]
  11. Gianessi, L.P. Economic impacts of glyphosate-resistant crops. Pest Manag. Sci. 2008, 64, 346–352. [Google Scholar] [CrossRef]
  12. Korres, N.E.; Singh, A.; Nizami, A.S.; Murphy, J.D. Is grass biomethane a sustainable transport biofuel? Biofuels Bioprod. Biorefining 2010, 4, 310–325. [Google Scholar] [CrossRef]
  13. Gardner, J.G.; Nelson, G.C. Herbicides, glyphosate resistance and acute mammalian toxicity: Simulating an environmental effect of glyphosate resistant weeds in the USA. Pest Manag. Sci. 2008, 64, 470–478. [Google Scholar] [CrossRef]
  14. Streibig, J.C.; Kudsk, P. Herbicide Bioassays; CRC Press: Boca Raton, FL, USA, 1993; p. 29. [Google Scholar]
  15. Ritz, C.; Baty, F.; Streibig, J.C.; Gerhard, D. Dose-response analysis using R. PLoS ONE 2015, 10, e0146021. [Google Scholar] [CrossRef] [PubMed] [Green Version]
  16. Price, W.J.; Shafii, B.; Seefeldt, S.S. Estimation of dose–response models for discrete and continuous data in weed science. Weed Technol. 2012, 26, 587–601. [Google Scholar] [CrossRef]
  17. Heap, I.M.; Morrison, I.N. Resistance to aryloxyphenoxypropionate and cyclohexanedione herbicides in green foxtail (Setaria viridis). Weed Sci. 1996, 44, 25–30. [Google Scholar] [CrossRef]
  18. Seefeldt, S.S.; Jensen, E.; Fuerst, E.P. Log-logistic analysis of herbicide dose-response relationships. Weed Technol. 1995, 9, 218–227. [Google Scholar] [CrossRef]
  19. Sandral, G.A.; Dear, B.S.; Pratley, J.E.; Cullis, B.R. Herbicide dose rate response curves in subterranean clover determined by a bioassay. Aust. J. Exp. Agric. 1997, 37, 67–74. [Google Scholar] [CrossRef]
  20. Carlson, K.L.; Burnside, O. Comparative phytotoxicity of glyphosate, SC-0224, SC-0545 and HOE-00661. Weed Sci. 1984, 32, 841–844. [Google Scholar] [CrossRef]
  21. Binns, M.R.; Nyrop, J.P.; Van Der Werf, W. Sampling and Monitoring in Crop Protection: The Theoretical Basis for Developing Practical Decision Guides; CABI Publishing: New York, NY, USA, 2000; p. 304. [Google Scholar]
  22. Norsworthy, J.K.; Korres, N.E.; Bagavathiannan, M.V. Weed seedbank management: Revisiting how herbicides are evaluated. Weed Sci. 2018, 66, 415–417. [Google Scholar] [CrossRef] [Green Version]
  23. Neve, P.; Powles, S. Recurrent selection with reduced herbicide rates results in the rapid evolution of herbicide resistance in Lolium rigidum. Theor. Appl. Genet. 2005, 110, 1154–1166. [Google Scholar] [CrossRef]
  24. Harper, J.L. Population Biology of Plants; Pubs Academic Press: London, UK, 1979. [Google Scholar]
  25. Taylor, K.L.; Hatzler, G. Effect of seed bank augmentation on Herbicide Efficacy. Weed Technol. 2000, 14, 261–267. [Google Scholar] [CrossRef]
  26. Green, J.M. The benefits of herbicide-resistant crops. Pest Manag. Sci. 2012, 68, 1323–1331. [Google Scholar] [CrossRef] [PubMed]
  27. Vitta, J.; Tuesca, D.; Puricelli, E. Widespread use of glyphosate tolerant soybean and weed community richness in Argentina. Agric. Ecosyst. Environ. 2004, 103, 621–624. [Google Scholar] [CrossRef]
  28. Leguizamon, E.S. Weed survey in cereal, oilseed and forage crops. In National Service of Agrifood Security (SENASA)-EU Program; Consultancy Final Report; SENASA: Santa Fe, Argentina, 2011; p. 142. [Google Scholar]
  29. Madsen, K.H.; Jensen, J.E. Weed Control in Glyphosate-tolerant sugarbeet (Beta vulgaris L.). Weed Res. 1995, 35, 105–111. [Google Scholar] [CrossRef]
  30. Rasmussen, I.A. Seed production of Chenopodium album in spring barley sprayed with different herbicides in normal to very low doses. In Quantitative Approaches in Weed and Herbicide Research and Their Practical Application; EWRS: Braunschweig, Germany, 1993; pp. 639–646. [Google Scholar]
  31. Krausz, R.F.; Kapusta, G.; Matthews, J.L. Control of annual weeds with glyphosate. Weed Technol. 1996, 10, 957–962. [Google Scholar] [CrossRef]
  32. Mulugueta, D.; Boeboom, C.M. Critical period of weed management in glyphosate-resistant soybean systems. Proc. North Cent. Weed Sci. Soc. 1996, 51, 130–131. [Google Scholar]
  33. Umeda, K.; Hicks, T.V. Timing of Glyphosate Application for Weed Control in Glyphosate Tolerant Lettuce; College of Agriculture and Life Sciences: Tucson, AZ, USA, 2001; p. 1252. [Google Scholar]
  34. Higgings, J.M.; Whitwell, T.; Toler, J.E. Common lambsquarters (Chenopodium album) control with non-selective herbicides. Weed Technol. 1991, 5, 884–886. [Google Scholar] [CrossRef]
  35. Tharp, B.E.; Schabenberger, O.; Kells, J.J. Response of annual weeds species to Glufosinate and Glyphosate. Weed Technol. 1999, 13, 542–547. [Google Scholar] [CrossRef]
  36. Thompson, J.F.; Stafford, J.V.; Miller, P.C.H. Potential for automatic weed detection and selective herbicide application. Crop Prot. 1991, 10, 254–259. [Google Scholar] [CrossRef]
  37. Lutman, P.J.W. Estimation of seed production by Stellaria media, Sinapis arvensis and Tripleurospermum inodorum in arable crops. Weed Res. 2002, 42, 359–369. [Google Scholar] [CrossRef]
  38. Begon, M.; Harper, J.L.; Townsend, C.R. Ecology; Blackwell Science: Oxford, UK, 2009; p. 752. [Google Scholar]
  39. Korres, N.E.; Norsworthy, J.K. Palmer amaranth (Amaranthus palmeri) demographic and biological characteristics in wide-row soybean. Weed Sci. 2017, 65, 491–503. [Google Scholar] [CrossRef]
  40. Lindquist, J.L.; Maxwell, B.D.; Buhler, D.D.; Gunsolus, J.L. Velvetleaf (Abutilon theophrasti) recruitment, survival, seed production, and interference in soybean (Glycine max). Weed Sci. 1995, 43, 226–232. [Google Scholar] [CrossRef] [Green Version]
  41. Bussan, A.J.; Boerboom, C.M.; Stoltenberg, D.E. Response of Setaria faberi demographic processes to herbicide rates. Weed Sci. 2000, 48, 445–453. [Google Scholar] [CrossRef]
  42. Korres, N.E.; Norsworthy, J.K.; Mauromoustakos, A. Effects of Palmer amaranth (Amaranthus palmeri) establishment time and distance from the crop row on biological and phenological characteristics of the weed: Implications on soybean yield. Weed Sci. 2019, 67, 126–135. [Google Scholar] [CrossRef] [Green Version]
  43. Clay, P.A.; Griffin, J.L. Weed seed production and seedling emergence responses to late-season glyphosate applications. Weed Sci. 2000, 48, 481–486. [Google Scholar] [CrossRef]
  44. Forcella, F.; Colbach, N.; Kegode, G.O. Estimating seed production of three Setaria species in row crops. Weed Sci. 2000, 48, 436–444. [Google Scholar] [CrossRef]
  45. Devine, M.D.; Bandeen, J.; Mc Kersie, B.D. Temperature effects on glyphosate absorption, translocation and distribution in quackgrass (Agropyron repens). Weed Sci. 1983, 31, 161–164. [Google Scholar] [CrossRef]
  46. Jordan, D.L.; York, A.C.; Griffith, J.L.; Clay, P.A.; Vidrine, P.R.; Reynolds, D.B. Influence of application variables on efficacy of glyphosate. Weed Technol. 1997, 11, 354–362. [Google Scholar] [CrossRef]
  47. Ateh, C.M.; Harvey, R. Annual weed control to glyphosate-resistant soybean (Glycine max). Weed Technol. 1999, 13, 394–398. [Google Scholar] [CrossRef]
  48. Klingaman, T.E.; King, C.A.; Oliver, L. Effect of application rate, weed species, and weed stage of growth on imazethapyr activity. Weed Sci. 1992, 40, 227–232. [Google Scholar] [CrossRef]
  49. De Felice, M.S.; Brown, W.B.; Aldrich, R.J.; Sims, D.B.; Judy, D.T.; Guethle, D.R. Weed control in soybeans (Glycine max) with reduced rates of postemergence herbicides. Weed Sci. 1989, 35, 1461–1467. [Google Scholar]
  50. Oliver, L.R. Factors affecting herbicide rate. In Soybean Strategies for Reduced Herbicide Rates; Pascale, A.J., Ed.; World Soybean Research Conference: Buenos Aires, Argentina, 1989; pp. 1613–1619. [Google Scholar]
  51. Renton, M.; Diggle, A.; Powles, S. Low Herbicide Rates Can Lead to Faster Development of Herbicide Resistance. In Proceedings of the 16th Australian Weeds Confererence, North Queensland, Australia, 18–22 May 2008; pp. 215–217. [Google Scholar]
  52. Doll, J.; Doersch, D.; Proost, R.; Kivlin, P. Reduced Herbicide Rates: Aspects to Consider: University of Wisconsin-Madiosn; Cooperative Extension Bulletin: Madison, WI, USA, 1992; p. 8. [Google Scholar]
  53. Kegode, G.O.; Forcella, F.; Clay, S. Influence of crop rotation, tillage, and management inputs on weed seed production. Weed Sci. 1999, 47, 175–183. [Google Scholar] [CrossRef] [Green Version]
  54. Lancashire, P.D.; Bleiholer, H.; Van Den Boom, T.; Langeluddeke, P.; Stauss, R.; Weber, E.; Witzenberger, A. A uniform decimal code for growth stages of crop and weeds. Annal. Appl. Biol. 1991, 119, 561–601. [Google Scholar] [CrossRef]
  55. Buhler, D.D.; Hartzler, R.G.; Forcella, F. Implications of weed seedbank dynamics to weed management. Weed Sci. 1997, 45, 329–336. [Google Scholar] [CrossRef]
  56. Korres, N.E.; Burgos, N.R.; Travlos, I.; Vurro, M.; Gitsopoulos, T.K.; Varanasi, V.K.; Duke, S.O.; Kudsk, P.; Brabham, C.; Rouse, C.E.; et al. New directions for integrated weed management: Modern technologies, tools and knowledge discovery. Adv. Agron. 2019, 155, 244–319. [Google Scholar]
Figure 1. Samples for log-logistic models (Equation (1) for Portulaca oleracea. (a) Growth stage 3 and Digitaria sanguinalis. (b) Growth stage 1. See models parameters in Table 2.
Agronomy 09 00851 g001
Figure 2. Log-logistic models for P. oleracea. (a) Growth stage 1 and Eleusine indica (b) Growth stage 1. See model parameters in Table 5.
Agronomy 09 00851 g002
Table 1. (a) Plant characteristics of grasses when treated at three different growth stages (GS). (b) Plant characteristics of dicotyledons when treated at three different growth stages (GS).
(a) Plant characteristics of grasses when treated at three different growth stages (GS).
GS1 GS2 GS3
# TillersDiameter (cm)# TillersDiameter (cm)# TillersDiameter (cm)
D. sanguinalis1–25–64–58–106–715–17
E. indica1–25–63–48–106–715–17
(b) Plant characteristics of dicotyledons when treated at three different growth stages (GS).
A. cristataC. albumP. oleracea
GS1GS2GS3GS1GS2GS3GS1GS2GS3
Stems (#)111111117–10
True leaves (#)35–78–126–812–1418–206–820–3050–80
Height (cm)5–710–1523–2912–1515–2020–25510–1520–30
# = number of tillers.
Table 2. Regression parameters of visual ratings of weed control (%) and glyphosate application rate. All results are based on arc sin (%) 0.5 transformation.
GS 1abRMSE* Glyphosate ED90 2
A. cristata178.7 (75.0–82.4) *0.07 (0.04–0.10)1140.96
277.7 (71.7–83.6)0.23 (0.16–0.30)1761.74
372.6 (68.4–76.7)0.34 (0.29–0.39)573.99
C. album190.1 (88.2–91.9)13.4 (9.5–17.2)120.14
290.8 (83.6–98.0)3.40(2.4–4.50)1150.53
388.5 (81.8–95.2)2.7 (2.00–3.40)870.72
D. sanguinalis190.9 (88.3–93.4)0.01 (0.01–0.02)710.36
288.9 (86.1–91.6)0.05 (0.00–0.01)920.50
391.3 (88.9–93.7)0.01 (0.00–0.01)660.61
E. indica189.8 (85.7–93.8)0.02 (0.00–0.03)1300.38
289.8 (86.3–93.3)0.01 (0.00–0.01)1040.33
378.7 (75.0–82.3)0.07 (0.04–0.10)1140.90
P. oleracea188.8 (83.6–93.9)0.09 (0.05–0.14)2030.69
275.0 (69.4–80.5)0.09 (0.03–0.14)2421.27
377.0 (72.1–81.7)0.12 (0.07–0.17)1621.28
1 Growth stage at application; 2 Calculated with back-transformed Equation (1) outputs. * kg ae ha−1; * numbers in parentheses indicate the confidence intervals at 5% significance level.
Table 3. Weed species sensitivity, in descending order, to glyphosate based on the calculated ED90 from Equation (1).
Growth Stage*Glyphosate ED90
A. cristata33.99
A. cristata21.74
P. oleracea31.28
P. oleracea21.27
A. cristata10.96
E. indica30.90
C. album30.72
P. oleracea10.69
D. sanguinalis30.61
C. album20.53
D. sanguinalis20.50
D. sanguinalis10.36
E. indica10.38
E. indica20.33
C. album10.14
* kg ae ha−1.
Table 4. ED50 and ED90 values along with logistic regressions (Equations (2) and (3)) parameters of the pooled dry weight plant−1 and glyphosate application rate for each species and growth stage. Dry weight data were arc sin (%) 0.5transformed.
GS 1D Values 2b Values 2ED50 Values 2RMSE 2ED90 Values 3
192.7 (82.2–103.2)0.80 (0.40–1.20)0.13 (0.07–0.18)2181.41 (0.22–2.59)
A. cristata290.9 (81.5–100.4)0.79 (0.48–1.10)0.28 (0.19–0.37)2953.14 (1.24–5.04)
388.9 (79.1–98.7)1.13 (0.76–1.50)0.41 (0.26–0.55)3883.23 (1.38–5.09)
1103.4 (18.8–225.6)0.64 (0.42–1.70)0.08 (0.00–0.16)2230.67 (1.21–2.56)
C album298.7 (27.0–170.4)0.64 (0.26–1.54)0.13 (0.03–0.24)3111.49 (1.56–4.53)
3113.5 (45.2–272.0)0.47 (0.20–1.14)0.16 (0.05–0.37)2642.12 (1.07–5.31)
195.8 (80.0–111.6)0.75 (0.20–1.14)0.09 (0.05–0.12)1281.03 (0.21–1.85)
D. sanguinalis2102.2 (72.8–131.5)0.56 (0.23–0.88)0.16 (0.11–0.21)2242.51 (1.07–3.96)
3102.9 (64.3–141–5)0.51 (0.14–0.90)0.20 (0.11–0.29)4033.40 (1.22–5.74)
199.9 (96.2–107.7)1.90 (1.0–2.80)0.01 (0.00–0.03)430.06 (0.04–0.16)
E. indica299.9 (93.6–104.3)1.49 (0.92–2.05)0.02 (0.00–0.04)390.08 (0.05–0.21)
3111.0 (66.5–155.5)0.59 (0.32–0;87)0.08 (0.06–0.11)70.56 (0.14–0.98)
190.1 (84.3–95.8)1.26 (0.91–1.60)0.12 (0.07–0.17)1320.84 (0.27–1.40)
P. oleracea290.2 (82.7–97.7)1.06 (0.73–1.38)0.20 (0.12–0.27)2201.67 (0.61–2.74)
390.1 (82.8–97.7)1.28 (0.92–1.63)0.23 (0.15–0.31)2161.63 (0.69–2.58)
1 Growth stage at glyphosate application; 2 parameters for Equation (2); 3 parameters for Equation (3); numbers in parentheses indicate 95% confidence intervals.
Table 5. Weed species sensitivity to glyphosate based on ED50 as estimated by Equation (2) and ED90 from Equation (3).
GS ED50Relative Ranking 1ED90Relative Ranking 2
A. cristata10.3260.427
20.6820.923
31.0010.952
C. album10.1990.2012
20.3260.418
30.3950.654
D. sanguinalis10.2280.3110
20.3950.744
30.4941.001
E. indica10.02110.0214
20.05100.0214
30.1990.1613
P. oleracea10.2970.2511
20.4940.409
30.5630.486
1 Sensitivity relative to the less sensitive weed species; 2 growth stages combined.
Table 6. Fecundity (seeds plant−1) of untreated plants for runs 1a and 2a averaged across four replicates for each run.
Run 1a Run 2a
GS1GS2GS3GS1GS2GS3
A. cristata138 (119 *)228 (40)251 (139)39 (22)34 (11)48 (22)
D. sanguinalis19075 (2890)1408 (1165)10185 (4510)2045 (730)4098 (1525)2701 (782)
C. album------
E. indica8286 (1442)5462 (4357)30012 (16947)6200 (1100)8655 (4134)7744 (1269)
P. oleracea111121 (5303)12762 (772)10097 (2083)600 (410)508 (604)843 (1027)
* Numbers in the parentheses indicate the standard deviation of the mean.
Table 7. Parameters from regression of seed production on plant dry weight (Equation (5)). Seed numbers were transformed to % of untreated plants seed output.
Run 1aRun 2a
GS1GS2GS3GS1GS2GS3
abR2abR2abR2abR2abR2aBR2
A. cristata−2320578−205081−263590−255575−282493−53753
C. album1−2526580−2526580−2526580---------
D. sanguinalis−411360−137199−458794−102698−191497−1072077
E. indica−29394- 7196−112214-9799−102095−702782
P. oleracea−9865896267−245499−103890−173086−212182
1 Equation parameters obtained from Rasmussen (1993) and applied to the three growth stages.
Table 8. Threshold (% of untreated plants) plant dry weight for ca. nil seed production calculated from Equation (5).
Fecundity-Avoidance Biomass Threshold (% of Maximum Plant Weight *)
GS1GS2GS3
A. cristata20.17 (2.63) **21.73 (3.21)20.37 (5.55)
C. album4.23 (3.25)2.26 (2.62)1.04 (2.09)
D. sanguinalis13.98 (12.35)17.23 (10.29)27.82 (19.74)
E. indica7.83 (10.00)9.66 (9.17)19.78 (18.97)
P. oleracea7.92 (3.60)9.88 (1.21)12.95 (4.99)
* Data from runs 1a and 2a were combined and expressed as g plant−1. ** Numbers in parentheses represent the standard deviation of the mean.
Table 9. Estimated glyphosate rates (derived from data of Table 9 on Equation (2)) for “fecundity-avoidance biomass threshold”.
Fecundity- Avoidance Glyphosate Rate Threshold
(kg ae ha−1)
GS 1GS2GS 3
A. cristata0.2700.7201.110
C. album0.6400.3800.985
D. sanguinalis0.2300.3000.210
E. indica0.2500.2300.295
P. oleracea0.6900.9000.900

