Article

Determining Thresholds for Grassland Renovation by Sod-Seeding

by
Victor P. Rueda-Ayala
* and
Mats Höglind
Norwegian Institute of Bioeconomy Research, NIBIO Særheim, Postvegen 213, 4353 Klepp Stasjon, Norway
*
Author to whom correspondence should be addressed.
Agronomy 2019, 9(12), 842; https://doi.org/10.3390/agronomy9120842
Submission received: 21 October 2019 / Revised: 27 November 2019 / Accepted: 2 December 2019 / Published: 3 December 2019
(This article belongs to the Section Grassland and Pasture Science)

Abstract

:
This study aimed at identifying optimal sward conditions for successful establishment of red clover (Trifolium pratense L.) through sod-seeding two typical Norwegian grassland systems dominated by timothy (Phleum pratense L.) and perennial ryegrass (Lolium perenne L.), respectively. A total of four sod-seeding trials were implemented, two in late summer (SUM) and two in spring (SPR), one for each sward type and time point for reseeding. The sward coverage status was the basis for threshold definition, and image analysis techniques were used for objective coverage estimation of living plants, dead material and bare soil. Plots with different coverage levels (0–100% of the soil covered by vegetation) were created by spraying a broad-spectrum herbicide (glyphosate) in a spot-wise pattern, mimicking common types of patchiness caused by stressful weather events, e.g., frost or mechanical damage from wheels or hoofs. Seed germination and emergence started similarly in all coverage ranges. However, as time progressed clover seedlings started to die at a coverage dependent rate, and at the final harvest red clover dry matter (RCDM) was the lowest on plots with the highest pre-seeding coverage level. Dose-response curves explained these relationships and allowed estimating the effective-coverage ( E C o v 80 ), being the initial sward coverage at which 80% of all established red clover plants contributed significantly to the total biomass. Above 2500 kg ha−1 RCDM were produced on timothy ( E C o v 80 : 15–50%) in SUM, while less than 1000 kg ha−1 RCDM were produced on ryegrass ( E C o v 80 : ± 10 % ), indicating better conditions for clover establishment in timothy compared with ryegrass. In SPR, an E C o v 80 : 10–15% allowed a good red clover estabishment in ryegrass at cut 3, while RCDM was important and significant in timothy even between E C o v 80 20 and 60%, at cut 2 and cut 3, respectively. These thresholds for sod-seeding mark the challenges to introduce red clover in dense swards and could be applicable for grassland renovation with other desirable legume and grasses species. Our findings represent particular soil and climatic characteristics of the study site, thus should be taken with caution. Due to the lack of experimentally and sytematically determined thresholds for reseeding, future studies could benefit from our experimental approach, as a base for more complex, multi-site and multi-seasonal investigations, and farmers could use these thresholds for decision making on successful grassland renovation, to avoid wasting seed resources and yield loses.

1. Introduction

Forage grasses serve as the main source of energy and nutrients for ruminant livestock in many regions of the world. Grass-based dairy and meat production constitutes the economic backbone of agriculture in Northern Europe. Forage grass production systems need to be based on precise usage of inputs and optimal application of available technology to be cost-efficient and to minimize the forage production environmental footprint. Reseeding is a required measurement for preserving the productivity of a grass sward [1], or for diversity maintenance on grassland communities [2]. Sod-seeding is often used in cases where plowing is difficult or risky, when the botanical composition of the sward needs to be improved, or on farms seeking to exploit the feed value and N-fixing properties of legumes [3]. Direct drilling of desired forage species into the existing sod, i.e., sod-seeding, aims at increasing both grass productivity and quality [4,5]. Due to the low demands of labour, equipment and fuel, and by keeping the original vegetations sod-seeding reduces the risk of soil erosion and improves economic, environmental and agronomic grass management assets, without the production loss during the establishment season, associated with reseeding after plowing [6].
A desirable way to increase pasture productivity and quality is via legumes sod-seeding. The most commonly used legume species in Northern Europe and Northern America are red clover (Trifolium pratense L.), white clover (Trifolium repens L.), and alfalfa (Medicago sativa L.), which mainly contribute with potential nitrogen fixation, stabilization of forage dry matter and increasing forage protein content [3,4,7]. However, introducing legumes can be very challenging, particularly in well-established stands where competition is strong [8,9]. Such stands may have a good sward coverage (e.g., >75%) across the field, and some phytotoxins may be released through the living grass roots to prevent germination and root growth of legume seedlings [10] or through the decomposition of grass killed by ice-encasement [8]. Adequate species selection and suppressing competition are defining keys for successful establishment, even more than the seeding rate, the time of application or type of machinery [5,11]. In practical terms, this technique may often provide renovation success in short time, but its long-term success depends on many uncertainties of natural and management sources, i.e., seeds germinate, but the seedlings fail to establish [12].
Sod-seeding has been subject of research for many decades, to determine effectiveness of the seed drill [13]; identify optimal seed mixtures and seeding rates [1]; determine functions in ecosystems of grass mixtures [14]; establishment success in relation to sowing methods, depth and width of cultivation and sowing date [3,6,8]; effects of suppression treatments prior reseeding to reduce competition with existing sward [5,9]; identification of factors determining establishment success of newly sown forage legumes [4]; and effects of application of slurry together with sod-seeding in one operation [15]. This research has led to the development of many general guidelines concerning how to ensure establishment success, often involving measures to improve the contact between seeds and soil by tillage and management operations to reduce competition from the existing sward, such as defoliation or herbicide application. Although many authors have pointed out the density and competitiveness of the existing vegetation as key determinants of establishment success, systematic studies relating establishment to different sward covers are lacking in the literature. Without such information, it is difficult to establish objective criteria for evaluation of the suitability of a field for reseeding and to provide management guidelines.
Based on general observations in one field trial, Frick and Rühlmann [11] suggested that sod-seeding can only be successfully applicable under specific sward conditions, i.e., thresholds. These authors suggested that an evenly distributed grass coverage between 15 and 30% with the desired grass species, and more than 50% of bare soil, assessed visually in early spring, justifies sod-seeding operations. From those indicators and empirical knowledge of local grassland producers, recommendations are provided to farmers in Switzerland for applying sod-seeding, at least three times in the growing season [16,17]. To come a step further, the sward coverage conditions need to be accurately measured with the aid of current technological tools, to enable replication of results on other sites. The experiments should be designed to evaluate the sward conditions at different developmental stages or seasons, comparing effects on the most economically important grass species for forage production for that determined site. Therefore, the objective in this study was to test if thresholds for successful establishment of red clover can be determined using sod-seeding on two ley grass fields dominated by timothy (Phleum pratense L.) and perennial ryegrass (Lolium perenne L.), respectively, at various sward coverage (density) levels, applied at early spring and late summer. The hypotheses was that the establishment of red clover plants is highly successful at zero initial sward coverage and decreases exponentially as the coverage increases. Red clover was the legume sown by direct drilling to enrich the pasture quality, with the additional advantage that this species allowed an easier discrimination of newly emerged seedlings inside the well established grass stand.

2. Materials and Methods

2.1. Study Site, Experiments

The study was carried out at the NIBIO Særheim research station (Klepp Stasjon, Norway, lat. 58.76 N, lon. 5.65 E), at three fields dedicated to permanent grassland production. The site is characterized by a cold maritime climate with cool summers and cold winters (Figure 1). The normal (1961–1990) annual precipitation is 1280 mm, with the wettest months in autumn. The growing season has in average 2175 degree days (base temperature 0 C). The soil is of the umbric podzol type, and sandy loam texture (63% sand, 28% silt, 9% clay) with 7% organic matter (OM) in the topsoil, from moraine origin. Soil analyses reported a pH of 5.9; the macro-nutrient status is (in mg 100 g−1) 8.7 P, 16 K, 11 Mg, 120 Ca, 5.6 Na, and micro-nutrient status is 110 mg 100 g−1 of acid soluble K, 0.3 ppm B, 120 ppm Fe, 2.1 ppm Cu, 2.7 ppm Mn, and 0.2 ppm Mo. Four field trials were implemented in total (Table 1), two in swards dominated by L. perenne (herewith ryegrass) and two in swards dominated by P. pratense (herewith timothy). Two trials were established in late summer 2017, one in ryegrass (SUM-R) and other in timothy (SUM-T). The two trials were established in two different fields; the one with ryegrass has a total area of 4.52 ha, and the one with timothy has a total area of 0.81 ha. The other two trials were established in early spring 2018, similarly, one in ryegrass (SPR-R) and one in timothy (SPR-T). The ryegrass field has a total area of 2.8 ha; the SPR-T experiment was established side-by-side, in the same field where the SUM-T experiment was implemented. Dimensions of each experimental field, plot sizes, experimental units (sampling units), crops and agronomic activities are depicted in Figure 2 and Figure 3.
All trials were arranged in randomized complete block design with four repetition blocks for SUM experiments and with five repetition blocks for SPR experiments. The experimental approach consisted of creating various sward coverage ranges, from bare soil (0% cover) to fully covered (100% cover), by applying glyphosate (1 l ha−1) in a spot-wise pattern. In SUM experiments, it was intended to use 12 levels of grass coverage per repetition block (Table 1; Figure 2). In SPR experiments the number of coverage levels was reduced to 8 per block (Figure 3), due to the observed low reseeding success at a coverage above 50%; for statistical modeling purposes, however, the 100% coverage level was kept. The logic was to mimic common types of bare soil patchiness caused by stressful weather events, e.g., frost or mechanical damage from wheels or hoofs. Each individual plot was sprayed with a pre-determined number of spots to create the desired sward coverage. The number of sprayed spots per plot ranged from 0 on plots where 100% sward coverage was aimed for, to 96 on plots where 15–20% sward coverage was aimed for, whereas the whole experimental unit was sprayed to obtain 0% sward coverage. To assure localized action of the herbicide, a plastic cylinder of 12 cm diameter was used to spray the spots, randomly on each plot. In this way, the desired sward coverage ranges prior the sod-seeding were achieved, herewith called initial sward coverage. The herbicide was sprayed when the sward started regrowth in spring in experiment SPR and when it started to regrow after the second seasonal cut in SUM (Table 1). Reseeding was applied one week after the herbicide application in SPR, and approximately three weeks after the herbicide application in SUM, as soon as the soil was dry enough to introduce machinery onto the field. All assessments were done on the 1.5 × 1.5 m experimental unit (black square area in Figure 2 and Figure 3), which was in the center of each plot size (red rectangle). The remaining area on each plot size without the experimental unit were the borders, and all plots were separated by corridors of 40 cm width, which were also fully sprayed with herbicide.
Red clover (cultivar Lea) was sown at a rate of 5 kg ha−1, using the following direct-drilling planters, a Kuhn Premia 300 in SUM and a Vredo© overseeder in SPR. For both planters, the row width for sod-seeding was 0.15 cm and the total working width was 3 m. To facilitate seeding and reduce competition from the existing sward, all fields were mowed one day before sod-seeding, leaving a stubble height of around 8 cm. All fields were fertilized with N, P and K according to local recommendations. Compound fertilizer 18-3-15 NPK (Fullgjødsel®) was applied at a rate corresponding to 50 kg mineral N ha−1 per regrowth cycle. After reseeding, experiments SUM were harvested once in the autumn, during the reseeding year and once in the subsequent season, whereas experiments SPR were harvested three times during the reseeding year (Table 1) for determination of biomass, as described below. A 2 m wide plot harvester was used, applying a cutting height of 7 cm above the soil surface, according to normal practice in Norway.

2.2. Assessments

Image analysis was used to determine the initial sward coverage, using the method developed by Rueda-Ayala et al. [18] (Table 1). A commercial camera SONY DSC-HX60V was used to capture RGB images, under cloudy conditions to avoid distortions by shadows. The camera resolution was 2736 × 2736 pixels and 2 images were taken per plot. For feature extraction the color scales RGB, color spaces, color model and a vegetation index were used. Namely, the color scales Y’CbCr (being Y’ the achromatic luminance, Cb the blue- and Cr red chromatic channels), the color model cyan, magenta, yellow and key (CMYK) and the modified excess-green index (MExG) were combined. For image processing and segmentation of the plant coverage, a combination of unsupervised and supervised machine learning algorithms was applied. The used algorithms were Gaussian mixture model, based on the expectation-maximization algorithm with random samples, K-nearest neighbour and nearest centroid classifier.
At each harvest time, the collected biomass was weighed and sub-sampled for determination of the total forage dry matter yield (FDM) and its botanical composition. Three botanical groups were separated: grasses (mainly timothy or ryegrass, plus small quantities of other sown grass species in the original sward), red clover and weeds (including secondary grass species and broad-leaved). All samples were oven-dried for 72 h at 80 C and weighed for determination of dry weights. The success of sod-seeding was determined as the effective establishment of red clover, i.e., the establishment of a large enough population of red clover that contributed significantly to the total forage yield at final harvest. Hence, the threshold for successful sod-seeding corresponded to the initial sward coverage level at which red clover could establish and generate that biomass contribution.

2.3. Data Analysis

Main effects of the initial sward coverage on the number of red clover plants established which produced forage dry matter (FDM) were determined by ANOVA ( α = 0.05 ) and non-linear regression. The total FDM was split in three parts, grass dry matter (GDM), red clover dry matter (RCDM) and weed dry matter (WDM), and analysed separately. The relationship between RCDM and initial sward coverage at the time of sod-seeding was explained by the log-logistic model with three parameters, Equation (1), and the Brain-Cousens model with four parameters, Equation (2), [19,20]. In Equation (1), f[ x ( b , d , e ) ] is the expected red clover yield; parameter b denotes the relative slope around e (i.e., the coverage or time affecting 50% of red clover plants fully established; d is the upper limit and x is the initial sward coverage (dose equivalent). Equation (2) results from the modification of Equation (1), adding the term f x in the numerator; f x measures the rate of growth stimulation at doses close to zero. The dose-response models allowed the calculation of the ‘effective-coverage’ ( E C o v 80 ), being the initial sward coverage at which 80% of all established red clover plants contributed significantly to the total biomass. Although the nonlinear trends were clearer for timothy-dominant experiments, ryegrass-dominant data was also fitted to the log-logistic models.
f [ x ( b , d , e ) ] = d 1 + e x p b [ l n ( x ) - l n ( e ) ]
f [ x ( b , d , e ) ] = c + d + f x 1 + e x p b [ l n ( x ) - l n ( e ) ]
The relation between GDM and WDM with the initial sward coverage were fitted to exponential increase and decay functions, respectively. Log-transformation of GDM and WDM, as well as the initial sward coverage made linear models appropriate. These functions were based on the methodology proposed to study selectivity in weed harrowing experiments [21,22]. The GDM was assumed to increase exponentially, as the initial sward coverage at sod-seeding approached 100%, but with a progression in terms of curvature. This progression is shown in ascending order by Equations (3)–(5), where F Y is the GDM yield, F 0 is the grass yield at 0% sward coverage, and S is the initial sward coverage. In this study, c is introduced as the grass regrowth parameter, which indicates the capability of the standing sward to regrow and cover the available space resulting from the herbicide killing effect. In Equation (3), the grass regrowth increased linearly with increasing coverage. In Equation (4), when the coverage was close to 10%, the grass regrowth was more efficient and faster, to approach the biomass amount produced at 100% coverage. In Equation (5), this effect was further intensified. These models explained almost all data, except for GDM in the ryegrass experiment SUM-R. For WDM, an inverse relationship was determined, in which weed biomass was reduced as the coverage increased. This decay is represented in Equations (6) and (7), where W is the WDM and W 0 is the weed biomass at 0% coverage. Similar to the grass regrowth, in this study d is introduced as the weed decay parameter, indicating the capability of the existing grass (in terms of initial sward coverage) to compete for space diminishing the biomass produced by opportunistic weeds. With Equation (6) the weed biomass decay was more intense at low coverage, while with Equation (7) this effect was further intensified.
Non-linear regression models were tested for lack-of-fit ( α = 0.05 ) and via graphical agreement between fitted values and residuals [23]. Model selection was according to the lowest value of AIC (Akaike information criterion). Parameter estimates were accompanied by 95% confidence intervals (95%-CI) to directly assess precision of parameters, contrary to what is possible by providing only standard errors (SE). All linear and exponential models were tested for all data, correspondingly: from Equations (3) to (5) for GDM, and Equations (6) and (7) for WDM. Lack-of-fit test was also applied and model selection was based on the highest R2. F-tests were applied to reduce model complexity and estimates were also accompanied by 95%-CI. Analyses were done with the statistical software R version 3.5.1—‘Feather Spray’, The R Foundation for Statistical Computing [24]. Asymmetrical sigmoidal curves were fitted with the R package drc and E C o v 80 parameters were calculated with the built-in function ED [25].
F Y = F 0 + c · S
F Y = F 0 + e x p [ c · l n ( S + 1 ) ]
F Y = F 0 + e x p ( c · S 0 . 25 )
W = W 0 + e x p [ - d · l n ( S + 1 ) ]
W = W 0 + e x p ( - d · S 0 . 25 )

3. Results

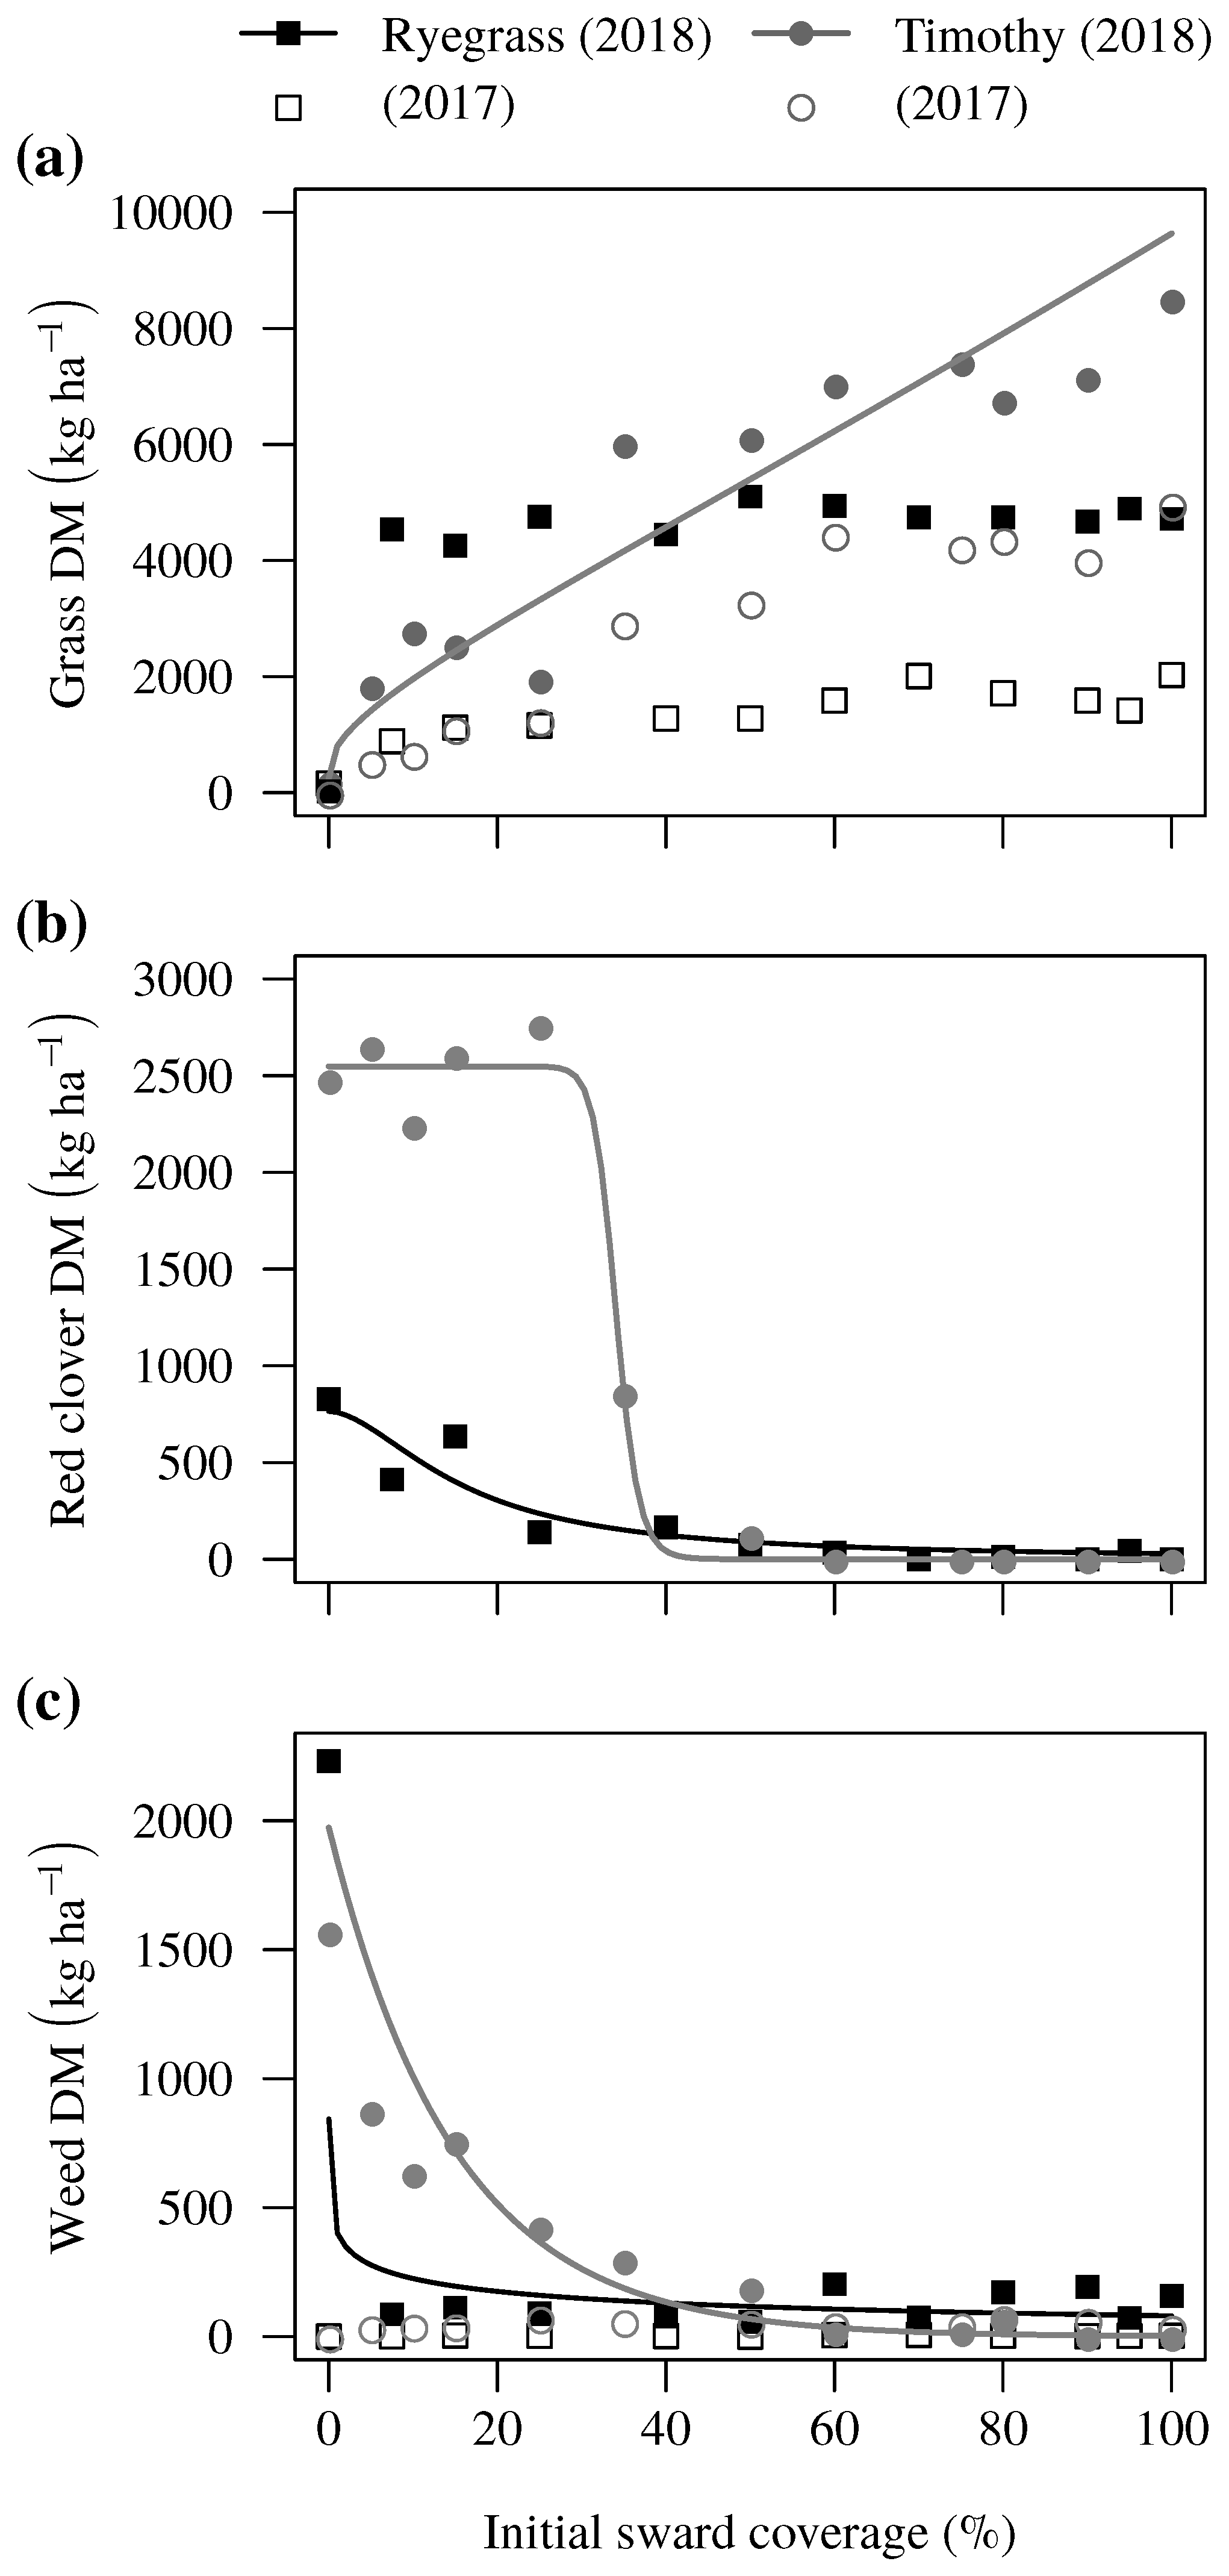
Forage yield was evaluated as dry weight of grass and red clover biomass at final harvest. In the SUM-R experiment, the biomass production of ryegrass only was little affected by the initial sward coverage, because GDM production was similar at all coverage levels above 0% (Figure 4a, black symbols and line). SUM-R grass data were poorly fitted by the proposed models (R2 < 0.60), and the same occurred when quadratic models were applied (R2 < 0.50, not shown). For ryegrass, the GMD was much lower at 0% initial soil coverage than at the other coverage levels, with no clear differences between the latter. For the SUM-T experiment, timothy GDM was explained by Equation (5) (Figure 4a, gray symbols and line), indicating a fast grass regrowth even at low sward coverage levels, but with lower biomass production capability than fully covered plots. Comparing the harvests in summer 2017 (Figure 4a, hollow symbols) and spring 2018 (Figure 4a, filled symbols), GDM was twice as high in the 2018 harvest. Timothy showed a threshold around 35% initial coverage, below which GDM did not recover fully (Figure 4a, gray-filled circles; Table 2). The regrowth ability of ryegrass was stronger than timothy (parameters c in Table 2). The threshold for ryegrass was around 10% (Figure 4a, black-filled squares).
At final harvest on SUM experiments, RCDM was higher in the timothy field, compared with the ryegrass field (Figure 4b), indicating a greater establishment success in the former. RCDM data fitted Equation (1) for both grass mixtures, and the thresholds for successful sod-seeding was represented by the parameter E C o v 80 . Nearly 2500 kg ha−1 RCDM were produced on timothy (Figure 4b, gray-filled circles), being at its maximum at E C o v 80 : 32 % (Table 2). For ryegrass (Figure 4b, black-filled squares), less than 1000 kg ha−1 RCDM were produced at an E C o v 80 near 10%, which was not significantly different than the E C o v 80 for timothy, due to overlapping confidence intervals (Table 2). Above 50% initial sward coverage, RCDM was minimal and approached 0 kg ha−1 on both grass mixtures.
The weed biomass development was similar as RCDM, except that more WDM than RCDM appeared on plots with 0% sward coverage and WDM fell markedly with increasing coverage (Figure 4c), according to Equations (7) (ryegrass) and (6) (timothy). On ryegrass, < 250 kg ha−1 WDM was produced below 15% sward coverage; the weed decay parameter d = 0.7 indicated a strong and fast weed suppression to almost zero WDM with increasing ryegrass coverage (Table 2; Figure 4c, black-filled squares). On timothy, about 1500 kg ha−1 WDM was harvested at first cut in 2018, compared with the nearly 0 kg ha−1 in the summer cut in 2017 (Figure 4c, gray-filled circles). The weed decay was significantly smaller ( d = 0.07 , Table 2) than in ryegrass, with almost 500 kg ha−1 WDM at 20 to 30% initial sward coverage, indicating a lower capability of timothy to suppress weeds.
In SPR experiments, GDM recovery was linear at cut 1 and exponential at cuts 2 and 3 (Table 2), increasing as the initial sward coverage approached 100% for both grass mixtures, ryegrass (Figure 5a) and timothy (Figure 6a). At cut 1, GDM was still constrained below 50% sward coverage, but already at cut 2, the grass biomass developed between 10% and 60% sward coverage was not different than that at 100% coverage. This effect was evident by the grass regrowth parameters for ryegrass ( c = 1.1 ) and timothy ( c = 0.7 ), Table 2, without statistical difference between the two grass types. Red clover yield was also dependent on the species present in the grass mixture. A more successful establishment and biomass red clover development was observed on timothy (Figure 6b) than on ryegrass (Figure 5b). RCDM was around 1000 kg ha−1 in ryegrass if sod-seeding was applied when the initial sward coverage was low. Nevertheless, about 500 kg ha−1 RCDM were still produced, even above 50% coverage. Effective coverage for RCDM could only be estimated at cut 3 for ryegrass, and from cut 2 onward for timothy (Table 2). An E C o v 80 of nearly 10% (and below 20%) allowed a good red clover estabishment in ryegrass, while RCDM was important and significant in timothy even between 47 and 68% E C o v 80 , at cut 2 and cut 3, respectively.
WDM behaved in SPR comparably to SUM experiments, although the maximum WDM was higher in the latter (Figure 5c and Figure 6c). At cuts 2 and 3, WDM data of both grass mixtures fitted Equation (7), and the weed decay parameters showed no significant difference between both crops, as confidence intervals overlapped (Table 2). Weed biomass was extremely high at cut 2 in ryegrass Figure 5c, being nearly 4000 kg ha−1 at an initial sward coverage of 0%, but decreasing to about 500 kg ha−1 when the coverage was >30% and up to 100%. At cut 3, the WDM was above 2000 kg ha−1 at 0% sward coverage, but it was significantly reduced to almost 0 kg ha−1 as the coverage increased above 6.5%. In timothy, the WDM at cut 2 was around 2500 kg ha−1 at 0% coverage and decreased to 500 kg ha−1 at >50% coverage Figure 6c. At cut 3, the WDM was below 1000 kg ha−1 at 0% sward coverage, and it decreased close to 0 kg ha−1 only when the coverage was 40% or higher.

4. Discussion

Although sod-seeding is highly recommended to maintain a sustainable forage production, together with adequate fertilization management and usage, this study shows that only at a low initial sward coverage a good seedling establishment and biomass production may be achieved by sod-seeding red clover. The results presented here indicate that the initial sward coverage at the time of reseeding may be a good variable to determine if a grass sward requires renovation and to define the corresponding thresholds for successful sod-seeding. This is an important finding because sward coverage can be objectively determined via image analysis, and measurements can easily be repeated in space and time. Thus, thresholds can be adjusted to a site-specific location, using the current advances of remote sensing and precision application technology. Previous studies generally did not consider using sward coverage for determining the necessity for grassland renovation. The only study using this variable, to indicate when sod-seeding can be successfully be applied [11], did not use objective and repeatable methods for assessing coverage.
The hypothesized trend of better red clover establisment and biomass production as a result of sod-seeding at 0% initial cover was only partially visible, only in ryegrass fields. In a supplementary assessment in the SUM experiment, we monitored the development of red clover seedlings from two weeks after the sod-seeding date, when at least 95% of seedlings had the spade leaf fully developed on all plots, until five weeks later. Germination and early establishment of red clover seedlings on all plots and sward coverage levels were uniform, after which number of seedlings decreased exponentially with increasing initial sward coverage (data not shown). A good establishment and survival of red clover plants up to the final harvest was observed at sward coverages between 0–30% in timothy (Figure 4b, gray symbols). In contrast, the nonlinear trend Brain-Cousens, Equation (2), explaining the higher red clover establishment and biomass on low to medium sward coverage in SPR-T experiment was unexpected. There, red clover establishment was optimal in the timothy sward coverage range 30–45% (Figure 6b). Apparently, the initial timothy coverage below 10% presented unfavorable conditions for a permanence of red clover until harvest in this experiment. That behaviour also contrasts with both ryegrass fields, where red clover establishment was clearly the best at 0% initial sward coverage (Figure 4b, black symbols; and Figure 5b).
The red clover biomass generated in timothy plots (Figure 4b, gray symbols; Figure 6b) imply relatively favourable conditions for red clover establishment at intermediate initial sward coverage levels, while for ryegrass plots (Figure 4b and Figure 5b) conditions constrained the establishment. It has been reported that some diploid ryegrass cultivars are poorly compatible with clover plants [26], as they produce relatively closed swards (in contrast to the more open swards of tetraploids). A zero or close-to-zero coverage could cause minimal above ground competition. Root competition is most likely more important under such conditions, especially in swards of vigorously growing species [8]. Nevertheless, the presence of a few original grass stand plants (i.e., sward coverage > 15 % ) was presumably more beneficial and offered a protective environment for a better establishment of red clover seedlings in one of the timothy fields, which may be an example of a facilitative interaction [27]. If the initial sward coverage was compared with herbicide effects in dose-response experiments, the ‘low-dose’ coverage triggering the development of red clover seedlings would be comparable to the hormesis effect [20]. Consequently, instead of the hypothesized exponential survival decay, the adequacy of the Brain-Cousens model with four parameters (2) would explain the beneficial and protective effect of low coverage. An additional advantage of this modeling approach was the estimation of effective sward coverage ( E C o v 80 ), as the thresholds at which sod-seeding may actually be needed and successfully implemented.
The time for full establishment of red clover, i.e., when plants are large enough to contribute significantly to the total forage yield, varied according to the season when sod-seeding was applied. In SUM experiments sod-seeding was done in July, after cut 2, and substantial red clover biomass production could only be measured at cut 1 in the subsequent season, i.e., after the winter (Figure 4b). However, before that winter some well-developed red clover plants were visible, although not big enough to be part of the harvest. Komárek et al. [3] and Seguin [4] identified a span of 2 months after sod-seeding to evaluate a successful survival of red clover. They observed similar survival rates, regardless if sod-seeding was done after cut 1 (June), cut 2 (August) or in September. Our study indicates that red clover establishment needs much longer time than two months after sod-seeding to be definitive (e.g., more than 4 months). This situation was also evident for sod-seeding applied in early spring (SPR experiments). In these experiments, with sod-seeding applied in April, a significant red clover biomass became measurable only at cut 3 in both, ryegrass (Figure 5b) and timothy (Figure 6b), meaning month five after the date of sod-seeding. Consequently, sod-seeding experiments with red clover should be continuously monitored for at least half a year post seeding before establishment success is evaluated.
The thresholds for sod-seeding estimated in the present study illustrate the challenges associated with sod-seeding of red clover in the two main grass species used in Norway, and the different effects between these species. Sod-seeding in ryegrass at an initial sward coverage above 10% did not allow a successful red clover seedling establishment in our study, neither in late summer, nor in early spring. Previous trials (9) in the same region showed that ryegrass sward renovation by sod-seeding or wet-seeding was successful only in fields with >50% bare soil, and although new ryegrass plants established, no improvements were measurable in total forage yield [28]. The authors concluded that sward renovation might only be profitable when forage yield and quality are improved, with the least costs for labor and seeds. Conversely, reference [11] found that a sward coverage containing nearly 30% of various desired ryegrass species, allowed a good establishment of perennial ryegrass, increasing its content to above 50% even three years after sod-seeding with a grass-legume mixture sown in June–August. However, in that study other conditions for reseeding and management were implemented, which were not used in the presented here. In the Swiss case, the original sward stand had only 4% of perennial ryegrass and more than 50% bare soil. Moreover, in the same case plots were sprayed with a 10% dosage of glyphosate prior sod-seeding, and between 3 and 5 cuts were done, as early as possible, after sod-seeding. Suppression treatments were not applied in our study, as it was intended identifying the sward conditions at which sod-seeding is justified, without including extra operations which may increase the production costs per unit of forage. For timothy based swards, no corresponding reseeding thresholds had been suggested before. Based on the results, we suggest that sod-seeding in a timothy sward may offer reasonably good probabilities for a successful establishment of red clover at initial sward coverage levels opt to 30% late summer, and up to 50% in early spring.
In line with our hypothesis, the grass yield of the original sward stand at the final harvest was negatively affected by the pre-experimental treatment, when the initial sward coverage was reduced (by spraying herbicide) to below 35% in the timothy swards, while the ryegrass swards showed a good recovery, already at around 15% of initial coverage. It is possible that the benefits of sod-seeding in a ryegrass sward can be visible only when the pasture condition is below this level, and renewal is applied without suppression treatments. Ryegrass has an great shoot competition capability over time [8], thus it can cover the bare soil spots much faster than timothy, suppress opportunistic weeds more strongly, and recover the biomass production and herbage quality status of the pasture, especially if fertilization is well managed [11,12]. This apparent disadvantage of timothy was well compensated with the successful introduction of red clover by sod-seeding. The red clover biomass produced was enough to level up the pasture yield in plots with coverage around 15–50% coverage (in SUM-T) and 20–60% (in SPR) to the average total forage biomass. Therefore, sod-seeding adjusted on those thresholds did in fact increment the clover biomass, which might improve forage yield quality, and contributed to avoid yield loses. Moreover, although not evaluated in this study, positive economic and environmental effects of sod-seeding should be accounted for, because no suppression treatments to the original sward were used, thus diminishing the corresponding costs of suppression operations and soil compaction due to reduced traffic. At the same time, it should be noticed that we created different coverage levels by spraying glyphosate to the desired level. The capability to regrow after other types of injuries, such as winter kill, may differ from the study situation. More experiments are needed to establish thresholds for different sward conditions and interactions with the environment.

5. Conclusions

The thresholds determined in this study mark the challenges to introduce red clover in dense swards. Sod-seeding red clover at low sward coverage conditions allowed establishment of a sufficient plant number to increment red clover biomass, and total forage yield, at final harvest. Using these thresholds for sod-seeding other desirable legume and grass species into a low productive sward, preferably in the form of multi-species, could facilitate flexible management and provide stable yields under variable environmental conditions. Our findings represent particular soil and climatic characteristics of the study site, thus should be taken with caution. Nevertheless, due to the lack of experimentally and systematically determined thresholds for reseeding, the presented results can set up two outcomes. Firstly, future studies could benefit from our experimental approach, as a base for more complex, multi-site and multi-seasonal investigations (e.g., considering suppression treatments after sod-seeding), enabling an objective comparability of results to further improve the threshold definition. Finally, farmers could use these thresholds for decision making on successful grassland renovation, to avoid wasting seed resources and yield loses.

Author Contributions

V.P.R.-A. and M.H. contributed equally to this manuscript: conceptualization, design of experiments, methodology, statistical analyses, original draft preparation, editing and supervision.

Funding

This research was funded by the Norwegian research funding for agriculture and the food industry (NRF), project 255245 (FOREFF).

Acknowledgments

We deeply thank all technicians of the NIBIO Særheim research station for their help with the implementation of field experiments.

Conflicts of Interest

The authors declare no conflict of interest.

References

  1. Barr, S.; Jonas, J.L.; Paschke, M.W. Optimizing seed mixture diversity and seeding rates for grassland restoration. Restor. Ecol. 2016, 25, 1–9. [Google Scholar] [CrossRef]
  2. Kan, H.; Wu, J.; Zhang, Y.; Liu, G. The effects of gap disturbance on the seedling emergence, survival and growth of two different native species in Inner Mongolia. Acta Ecol. Sin. 2017, 37, 38–47. [Google Scholar] [CrossRef]
  3. Komárek, P.; Pavlů, V.; Hejcman, M. Effect of depth and width of cultivation and sowing date on establishment of red clover (Trifolium pratense L.) by rotary slot-seeding into grassland. Grass Forage Sci. 2010, 65, 154–158. [Google Scholar] [CrossRef]
  4. Seguin, P. Review of factors determining legumes sod-seeding outcome during pasture renovation in North America. Biotechnol. Agron. Soc. Environ. 1998, 2, 120–127. [Google Scholar]
  5. Muto, P.; Martin. Effects of pre-treatment, renovation procedure and cultivar on the growth of white clover sown into a permanent pasture under both grazing and mowing regimes. Grass Forage Sci. 2000, 55, 59–68. [Google Scholar] [CrossRef]
  6. Schlueter, D.; Tracy, B. Sowing Method Effects on Clover Establishment into Permanent Pasture. Agron. J. 2012, 104, 1217–1222. [Google Scholar] [CrossRef] [Green Version]
  7. Miller, A.J.; Bork, E.W.; Hall, L.M.; Summers, B. Long-term forage dynamics in pastures sprayed with residual broadleaf herbicide: A test of legume recovery. Can. J. Plant Sci. 2015, 95, 43–53. [Google Scholar] [CrossRef]
  8. Haugland, E.; Tawfiq, M. Root and shoot competition between established grass species and newly sown seedlings during spring growth. Grass Forage Sci. 2001, 56, 193–199. [Google Scholar] [CrossRef]
  9. Halvorson, J.J.; Belesky, D.P.; Godwin, H.W. Seedling performance associated with live or herbicide treated tall fescue. Int. J. Agron. 2015, 2015. [Google Scholar] [CrossRef] [Green Version]
  10. Rueda-Ayala, V.; Jaeck, O.; Gerhards, R. Investigation of biochemical and competitive effects of cover crops on crops and weeds. Crop Prot. 2015, 71, 79–87. [Google Scholar] [CrossRef]
  11. Frick, R.; Rühlmann, M. Wiesenverbesserung durch Übersaat. Witterung und Nutzung entscheiden über Erfolg [Grassland Renovation by Overseeding. Weather and Usage Decisive for Success]; Technical Report 408; Eidgenössische Forschungsanstalt für Betriebswirtschaft und Landtechnik (FAT): Tänikon, Switzerland, 1991; FAT-Berichte 408. [Google Scholar]
  12. Nazarko, O. Seeding Forages into Existing Stands Using Minimal Tillage; Agriculture and Agri-Food Canada and Manitotba Forage Council: Winnipeg, MB, Canada, 2008. [Google Scholar]
  13. Lowther, W.; Horrell, R.; Fraser, W.; Trainor, K.; Johnstone, P. Effectiveness of a strip seeder direct drill for pasture establishment. Soil Tillage Res. 1996, 38, 161–174. [Google Scholar] [CrossRef]
  14. Finn, J.A.; Kirwan, L.; Connolly, J.; Sebastià, M.T.; Helgadottir, A.; Baadshaug, O.H.; Bélanger, G.; Black, A.; Brophy, C.; Collins, R.P.; et al. Ecosystem function enhanced by combining four functional types of plant species in intensively managed grassland mixtures: A 3-year continental-scale field experiment. J. Appl. Ecol. 2013, 50, 365–375. [Google Scholar] [CrossRef] [Green Version]
  15. Harrigan, T.M.; Mutch, D.R.; Snapp, S.S. Manure Slurry-Enriched Micro-Site Seeding of Biosuppressive Covers. Appl. Eng. Agric. 2006, 22, 827–834. [Google Scholar] [CrossRef]
  16. Meier, S. Frühlingskur für die Wiesen [Spring Cure for the Grassland]. 2017. Available online: https://www.schweizerbauer.ch/pflanzen/futterbau/fruehlingskur-fuer-die-wiesen-34088.html (accessed on 1 August 2019).
  17. Meier, S. So früh wie möglich übersäen [Overseeding as Early as Possible]. 2018. Available online: https://www.schweizerbauer.ch/pflanzen/futterbau/-so-frueh-wie-moeglich-uebersaeen-40597.html (accessed on 1 August 2019).
  18. Rueda-Ayala, C.; Rueda-Ayala, V.; Höglind, M.; Andújar, D. Accurate segmentation of grass-sward structures in RGB images using machine learning algorithms. In Precision Agriculture ’19; 12th European Conference on Precision Agriculture (ECPA); van Henten, E., Goense, D., Lokhorst, C., Eds.; Wageningen Academic Publishers: Wageningen, The Netherlands, 2019; Volume 12, pp. 623–627. [Google Scholar]
  19. Streibig, J.C. Models for Curve-fitting Herbicide Dose Response Data. Acta Agric. Scand. 1980, 30, 59–64. [Google Scholar] [CrossRef]
  20. Ritz, C.; Streibig, J. Bioassay Analysis Using R. J. Stat. Softw. Artic. 2005, 12, 1–22. [Google Scholar] [CrossRef] [Green Version]
  21. Rasmussen, J.; Bibby, B.; Schou, A. Investigating the selectivity of weed harrowing with new methods. Weed Res. 2008, 48, 523–532. [Google Scholar] [CrossRef] [Green Version]
  22. Rueda-Ayala, V.P.; Rasmussen, J.; Gerhards, R.; Fournaise, N.E. The influence of post-emergence weed harrowing on selectivity, crop recovery and crop yield in different growth stages of winter wheat. Weed Res. 2011, 51, 478–488. [Google Scholar] [CrossRef]
  23. Belz, R.G.; Piepho, H.P. Modeling Effective Dosages in Hormetic Dose-Response Studies. PLoS ONE 2012, 7, e33432. [Google Scholar] [CrossRef] [PubMed] [Green Version]
  24. R Core Team. R: A Language and Environment for Statistical Computing; R Foundation for Statistical Computing: Vienna, Austria, 2018. [Google Scholar]
  25. Ritz, C.; Baty, F.; Streibig, J.C.; Gerhard, D. Dose-Response Analysis Using R. PLoS ONE 2015, 10, e0146021. [Google Scholar] [CrossRef] [PubMed] [Green Version]
  26. Hopkins, A. Grass: Its Production and Utilization; British Grassland Society: Kenilworth, UK, 2000. [Google Scholar]
  27. Brooker, R.W.; Maestre, F.T.; Callaway, R.M.; Lortie, C.L.; Cavieres, L.A.; Kunstler, G.; Liancourt, P.; Tielbörger, K.; Travis, J.M.J.; Anthelme, F.; et al. Facilitation in plant communities: The past, the present, and the future. J. Ecol. 2007, 96, 18–34. [Google Scholar] [CrossRef] [Green Version]
  28. Nesheim, L.; Höglind, M. Fornying av eng uten pløying [No-Till Sward Renovation]; Norwegian Institute of Bioeconomy Research (NIBIO), 2018; Available online: http://hdl.handle.net/11250/2563810 (accessed on 1 August 2019).
Figure 1. Rainfall, air temperature and soil temperature data at Særheim during the study period 2017–2018. Source: NIBIO Særheim meteorological station.
Agronomy 09 00842 g001
Figure 2. Aerial image of the SUM-T experimental field, taken one week after sod-seeding, including sizes of the whole field, single plot (initial coverage level), and experimental unit (sampling unit). The experimental design was randomized complete block with four repetition blocks (I to IV). The initial sward coverage in block I was implemented in descending order (100 to 0%, from the top left to the bottom right of the block in the image) for visual purposes. The experiment SUM-R had the exact same design, but was implemented at a neighboring field.
Agronomy 09 00842 g002
Figure 3. Aerial image of the SPR-T experimental field, including sizes of the whole field, single plot (initial coverage level), and experimental unit (sampling unit). The experimental design was randomized complete block with five repetition blocks (I to V); this field was placed side-by-side with SUM-T (Figure 2). The initial sward coverage varied from 0 to 50% and including a plot with 100% grass coverage. The experiment SPR-R had the exact same design, but was implemented at a neighboring field.
Agronomy 09 00842 g003
Figure 4. Grass (a) and red clover (b) yields, and weed biomass (c) produced in the same year of sod-seeding (late summer 2017, hollow symbols) and one season later (early spring 2018, filled symbols) in ryegrass dominant (black symbols) and timothy (gray symbols) swards, SUM experiments. Sod-seeding was done on plots with manually varied sward coverage, using a contact herbicide. Equation (4) fitted data in (a); (1) in (b); and, (7) and (6) in (c) fitted ryegrass and timothy data, respectively.
Agronomy 09 00842 g004
Figure 5. Ryegrass (a) and red clover (b) yields, and weed biomass (c) produced at three cuts in SPR experiments. Sod-seeding was done on plots with manually varied sward coverage, using a contact herbicide. Equation (3) fitted cut 1 data; Equation (5) fitted cut 2 and cut 3 data in (a). Cuts 1 and 2 did not significantly contribute with red clover biomass; Equation (1) fitted cut 3 data in (b). Equation (7) fitted data in (c).
Agronomy 09 00842 g005
Figure 6. Timothy (a) and red clover (b) yields, and weed biomass (c) produced at three cuts in SPR experiments. Sod-seeding was done on plots with manually varied sward coverage, using a contact herbicide. Equation (3) fitted cut 1 data, (5) fitted cut 2 data and (4) fitted cut 3 data in (a). Cut 1 did not significantly contribute with red clover biomass; Equation (1) fitted cut 2 data and Equation (2) fitted cut 3 data in (b). Equation (7) fitted data in (c).
Agronomy 09 00842 g006
Table 1. Details of season, initial sward coverage and agricultural tasks and date for the implemented experiments.
Experiment Nr. CodeSeasonCropSward Coverage (%)Task
1SUM-Tlate summer 2017timothy0-5-10-15-25-35-50-60-75-80-90-100spraying herbicide: 13.07.
mowing: 19.07.
sod-seeding: 20.07.
cut 2017: 30.08.
cut 2018: 04.06.
2SUM-Rlate summer 2017ryegrass0-7.5-15-25-40-50-60-70-80-90-95-100spraying herbicide: 14.07.
mowing: 19.07.
sod-seeding: 20.07.
cut 2017: 11.09.
cut 2018: 18.06.
3SPR-Tearly spring 2018timothy0-6.5-12.5-18.75-25-37.5-50-100spraying herbicide: 02.04.
mowing: 11.04.
sod-seeding: 21.04.
cut 1: 29.05.
cut 2: 19.07.
cut 3: 19.09.
4SPR-Rearly spring 2018ryegrass0-6.5-12.5-18.75-25-37.5-50-100spraying herbicide: 02.04.
mowing: 11.04.
sod-seeding: 21.04.
cut 1: 06.06.
cut 2: 20.07.
cut 3: 19.09.
Table 2. Parameter estimates of grass regrowth c, effective coverage for 80% red clover biomass production E C o v 80 , and weed decay d, calculated as a function of the initial sward coverage at the time of sod-seeding in ryegrass- and timothy sward mixtures. Fitting Equations are presented and 95% confidence intervals given in brackets.
Exp.CutGrass RegrowthEffective CoverageWeed Decay
cEquation ECov 80 EquationdEquation
SUM-R1 N E 7.22 [0.00–18.21](1)0.74 [0.19–1.30](7)
SUM-T11.15 [0.74–1.56](5)32.28 [14.80–49.82](1)0.07 [0.05–0.09](7)
SPR-R179.73 [64.43–95.03](3) N E N E
21.09 [0.35–1.85](5) N E 0.82 [0.32–1.31](7)
30.36 [0.25–0.47](5)6.86 [0.00–18.00](1)1.38 [0.88–1.87](7)
SPR-T131.34 [23.55–39.13](3) N E N E
20.73 [0.45–1.01](5)47.74 [ N E ](2)0.67 [0.17–1.16](7)
30.21 [0.16–0.27](4)68.03 [8.22–100.00](2)0.82 [0.32–1.32](7)
N E = Non-estimable.

