Article

Envirotypes Based on Seed Yield Limiting Factors Allow to Tackle G × E Interactions

by
Erwan Corlouer
1,
Arnaud Gauffreteau
2,
Anne-Sophie Bouchet
1,
Christine Bissuel-Bélaygue
1,
Nathalie Nesi
1,* and
Anne Laperche
1
1
IGEPP, INRA, AGROCAMPUS OUEST, Université de Rennes 1, 35650 Le Rheu, France
2
UMR Agronomie, INRA, AgroParisTech, Université Paris-Saclay, 78850 Thiverval-Grignon, France
*
Author to whom correspondence should be addressed.
Agronomy 2019, 9(12), 798; https://doi.org/10.3390/agronomy9120798
Submission received: 14 October 2019 / Revised: 5 November 2019 / Accepted: 21 November 2019 / Published: 23 November 2019

Abstract

:
One challenge in plant breeding is to ensure optimized production under fluctuating environments while reducing the environmental impacts of agriculture. Thus, new rapeseed varieties should be adapted to a wide range of pedoclimatic conditions and constraints. Addressing this issue requires identifying the critical factors limiting production and the genotype by environment (G × E) interaction. Our goal was to characterize the effects of environment and G × E interaction on the seed yield of rapeseed grown over a large field network. First, we defined a pedoclimatic indicator set with the ability to highlight the potential limiting factors along the crop cycle by analyzing the yield of two genotypes grown under 20 environments. Out of the 84 pedoclimatic indicators, 10 were identified as limiting after a partial least squares regression analysis. The environments were then clustered into five envirotypes, each characterized by few major limiting factors: low winter temperatures and heat stress during seed filling (1); low solar radiation during seed filling (3); vernalization conditions during winter (4) and high temperatures at flowering (5). A larger genetic diversity was evaluated in a subset of 11 environments to analyze the impact of envirotyping on genotype ranking. Their results were discussed in light of field network management and plant breeding purposes.

1. Introduction

Faced with the challenges of adapting agriculture to climate change, as well as more sustainable cultural practices, a major goal is to maintain seed production (quantity and quality) under a wide range of growth conditions, with sometimes highly adverse and unexpected constraints. In this context, plant breeders face a dilemma between designing either new genotypes adapted to diverse pedoclimatic conditions or highly specifically adapted genotypes. This consideration highlights two main issues, first is the definition of field networks for genotype trialing under a large range of limiting factors, and second is the understanding of the G × E interactions.
Genotypes are often trialed within field networks for breeding, cultivar registration, or agricultural recommendations. Since the concepts of ecovalence [1] or joint linear regression [2] in the 1960s, several methods have been developed to characterize the genotype reactivity to a given environment using phenotypic observation [3]. These methods are easy to handle and allow quantifying the G × E interactions as well as classifying genotypes as reactive or non-reactive. However, they do not provide any easy way to unravel the interactions due to climate, management practices, or genotype features, nor to access to the biological processes involved.
To get deeper insights into the G × E determinants, statistical methods, such as the factorial regression [4] or partial least squares (PLS) regression [5], were developed in the 1980s. They rely on the identification of the main environmental covariates that contribute to the G × E effects. A prerequisite of these methods is the definition of a priori environmental covariates standing for the potential seed yield limiting factors. According to Van Ittersum et al. [6], the limiting factors can be classified according to their impact on seed yield. The first category corresponds to the “climatic” factors that allow predicting a potential seed yield for a given genotype in a given environment. These factors are related to CO2 concentration, solar radiation, and soil water holding capacity or temperature. The second category of factors reflects water and nutrient availability that limits the expression of the potential seed yield. This set of environmental factors must be adapted to the considered crop and its agronomic context.
Rapeseed (Brassica napus L.) is a major worldwide oil crop with an annual production of around 70 Mt [7]. For winter oilseed rape (WOSR), Bouchet et al. [8] reported that G × E interactions could explain up to 10% of the seed yield variation in a field network covering the main crop areas in France. Therefore, there is scope to decipher the main factors that affect seed yield in WOSR in order to improve both the management practices and breeding of cultivars with better resilience towards biotic and/or abiotic constraints. Up until now, most of the studies dedicated to G × E in rapeseed were focused on spring oilseed rape (SOSR) accessions grown under a Mediterranean-type climate and showed that water availability and temperature were the two main yield limiting factors under these environmental conditions [9,10,11]. However, data about other contrasting kinds of climates, such as continental or oceanic types are rather scarce [12].
One main feature of WOSR is its long crop cycle in Western Europe (>10 months from sowing to harvest in France) during which multiple biotic and/or abiotic stresses may occur and impact the seed yield. To define the potential seed yield limiting factors along the crop cycle, it is necessary to divide the whole cycle into different periods, corresponding to homogenous developmental or climatic features, and to list the potential limiting factors over each period. Among all factors defined by Van Ittersum et al. [6], some have already been qualified as limiting for WOSR, such as extreme temperatures at anthesis or vernalization requirement fulfillment during winter [13]. In Northern Europe, solar radiation may also be limiting, and a short photoperiod (less than 9 h) can affect plant development and impact seed yield. Water deficiency, especially at sowing and during seed filling and nitrogen limitation before flowering, has also been described to impact seed yield [14].
The goal of the present work was to cluster environments into different envirotypes in order to describe seed yield variation and explain the G × E interaction for WOSR under French pedoclimatic conditions. We based the envirotyping approach on regrouping environments according to their patterns of limiting pedoclimatic factors. We made the hypothesis that inside a single envirotype (cluster of environments presenting the same environmental limiting conditions), the G × E interaction was lower than the G × E observed at the whole network scale. Therefore, we used the data obtained across a field network of twenty environments (year by location combinations) to develop a four-step strategy: (i) set up a large set of indicators based on pedoclimatic data and phenology of WOSR. (ii) Identify the indicators that most influenced seed yield using PLS regression. (iii) Group the environments into envirotypes based on these limiting factors. (iv) Characterize the impact of the envirotyping on the G × E interaction using a large genetic diversity. This pipeline is presented and discussed based on its interest in deciphering the G × E interactions to improve plant breeding and field network management.

2. Materials and Methods

2.1. Field Network and Crop Management Description

Field experiments were conducted in 20 environments (combination of location and year) between 2011 and 2016 in France to cover contrasting pedoclimatic conditions that represented the main areas of rapeseed production and the climate diversity existing in France. The complete field network consisted of 20 environments (Table S1). Each one is defined as the combination of a given location by the year of harvest, as following: Ch14 (Châteauroux in 2014), Dij13 and Dij15 (Dijon in 2013 and 2015 respectively), Liv16 (Liverdy in 2016), LR11, LR12, LR13, LR15, and LR16 (Le Rheu in 2011, 2012, 2013, 2015, and 2016, respectively), Md11, Md14, and Md15 (Mondonville in 2011, 2014, and 2015, respectively), Pre14, Pre15, and Pre16 (Prémesques in 2014, 2015, and 2016, respectively), Sel14 and Sel15 (Selommes in 2014 and 2015, respectively), Ver14 and Ver15 (Verpillères in 2014 and 2015, respectively) and Yeb15 (Yèbles in 2015). Each individual trial was conducted using classical crop management for WOSR with comprehensive protection against weeds, pests, and pathogens. Optimal Nitrogen (N) fertilization was estimated using the balance sheet method [15,16] for a target yield of 3.5 t ha−1. The total amount of required N fertilizer ranged between 40–190 kg N ha−1 depending on the environment and was provided in one, two, or three applications (Table S1). Plant N status was estimated using the Nitrogen Nutrition Index (NNI) [17] at the stage where flower buds were still enclosed by leaves (BBCH50) [18,19], with a minimum delay of two weeks after the latest N supply. Each trial was designed as a randomized complete block design with two to four repetitions (according to the environment). Individual plot surface ranged from 6.75 m2 to 14 m2.

2.2. Plant Material and Seed Yield Assessment

Two probe genotypes, namely Aviso and Montego, were scored for seed yield over the 20 environments of the network. These genotypes were contrasted for earliness (mean difference of 40 growing degree days (GDD) ± 18) at flowering, GDD calculated as Gabrielle et al. [20] and height (mean difference of 13 cm ± 9 cm), with Montego being the earliest and the smallest one. A diversity set of 127 WOSR accessions (hereafter referred to as DS127) released from 1959 to 2007 (Table S2) was scored for seed yield over a subset of 11 environments. Seed yield (SY) was defined as the weight (t) of seeds harvested per ha considering moisture and impurity levels at 0% each. As a first evaluation of the G × E, the ecovalence [1] was calculated for SY for each genotype (Equation (1)). It corresponds to the contribution of each genotype to the G × E. The ecovalence gives information about the stability of a genotype across environments. A high ecovalence means that the genotype is not stable across environments.
W g 2 = e = 1 E ( Y g e Y g . ¯ Y . e ¯ + Y . . ¯ ) 2 ,
where W g 2 is the ecovalence for the genotype g, Y g e is the SY value for genotype g in environment e, Y g . ¯ is the mean SY for the genotype g across all environments, Y . e ¯ is the mean SY for the environment e across all genotypes, and Y . . ¯ is the general mean. The DS127 displayed genetic variability for ecovalence, as shown in Figure S1, reflecting a genetic variability of the response to environmental conditions.

2.3. Key Periods of the Winter Rapeseed Crop Cycle

The rapeseed crop cycle was divided into seven consecutive and non-overlapping periods based on climatic data and plant phenology (Figure S2). The first period was the fall (F) that covered from the sowing date to the beginning of the climatic winter (CW) defined as the second period. The CW started or ended when 3 consecutive days with daily air temperature were recorded under or above 5 °C, respectively (adapted for Hebinger [21]). The third period was the bolting period (B) that spanned from the end of CW to the beginning of flowering of Montego (BBCH60) [18,19]. The fourth period was the flowering (FLO) that lasted three weeks from the Montego BBCH60 stage onwards. The last three periods were defined on the base of thermal dates calculated from flowering (cumulative thermal time using a base temperature of 0 °C) according to Leterme [22] and Julien et al. [23]. The P300 period lasted 300 GDD after FLO and is related to the seed number fixation. The P600 period started at the end of P300 and lasted 300 GDD. It is related to reserve allocation to the pod growth. Finally, the P1000 period started at the end of P600 and lasted 400 GDD. During P1000, reserves were primarily allocated to seed growth. The vegetative part of the cycle included the F, CW, and B periods, while the FLO, P300, P600, and P1000 defined the reproductive part of the cycle.

2.4. Indicators Used for Environmental Description

2.4.1. Descriptor Definition: Raw Climatic Data and Soil Water Status Evaluation

Specialized climatic data corresponding to mean daily rainfalls (R), evapotranspiration of Penmann (ETP), global solar radiation (SR), mean air temperature (Tmean), maximum air temperature (Tmaxi), and minimum air temperature (Tmin), that were extracted from the Meteo France database [24].
Water status for each environment was quantified by daily water soil content (WSC), calculated from the water balance described in Equation (2). The maximal water soil content was estimated for each location based on soil physical characteristics of two soil layers, 0–30 cm and 30–100 cm, according to Bruand et al. [25]. The soil depth was set up to 100 cm for all locations according to oilseed rape root distribution [26] and French soils mean depth [27].
{ W S C i =   W S C i 1 + ( R i K c i × E T P i ) R O i W S C i 0 ,
where W S C i is the water soil content at day i, R i is the rainfall of day i, K c i is the crop coefficient (with kinetic through adapted from Allen et al. [28]; Figure S2) calculated at day i, E T P i is the potential evapotranspiration, and R O i is the runoff. Runoff at day i is estimated as the difference between [ W S C i 1 + ( R i K c i × E T P i ) ] and WSC_MAX when [ W S C i 1 + ( R i K c i × E T P i ) ] > WSC_MAX and is 0 when [ W S C i 1 + ( R i K c i × E T P i ) ] ≤ WSC_MAX.
For the initialization of the simulations of water balance, two extreme scenarios were tested in all environments (i) WSC = WSC_MAX on 1 January before sowing without any previous crop (Kc limited to soil evaporation coefficient) and (ii) WSC = 0 at sowing. The two simulations converged rapidly and showed that the WSC was very close to 0 mm in August before sowing in almost all environments and was at field capacity in winter, as reported by Weymann et al. [29]. Then, WSC was initialized to 0 mm on August, 1st before each sowing. Based on the previous data, 15 descriptors were identified. Eight descriptors were based on direct calculations of the raw data (mean, range, and sum) and are summarized in Table 1a. They corresponded to the minimal temperature (TMIN), the maximal temperature (TMAX), the mean temperature (TMN) over a period and the length of a period in GDD (LGDD) for periods F, CW, B, and FLO. The water soil content maximal capacity (WSC_MAX) and the mean water soil content (WSC_MN). The sum of the radiations (SSR) and the photothermal quotient (QPT) only for the FLO period calculated as the ratio between SSR and LGDD [30,31]. Seven other descriptors consisted of the quantification of different stress durations by counting the number of days when the considered raw climatic data was under or above a given threshold. These descriptors are summarized in Table 1b and correspond to the number of days with Tmax > 25 °C (high temperature—HT), the number of days with 0 °C < Tmin < 5 °C (low temperature—LT), the number of days with Tmin < 0 °C (frost—FR). The number of days when WSC < 1/3 WSC_MAX (water stress—WS), the number of days when WSC = 0 mm (water deficiency—WD). The number of days with SR < 900 J cm−2 (lack of solar radiation—LSR) and the number of days with Tmean < 5 °C, and a day length below 9 h (optimal vernalization treatment [13]—VERN_OPT).

2.4.2. Set up of Informative Indicators

Combining the different descriptors with the crop periods led to the definition of 84 pedoclimatic indicators falling into four main categories, namely “temperature”, “water”, “solar” and “plant”. The pedoclimatic indicators that did not vary along the crop cycle (11 in this study) or varied in less than 3 environments (5 in this study) were considered as non-informative and eventually removed from our dataset (Figure 1). Among these, 9 were of the temperature category and 7 of the water category. The Pearson correlation coefficients were calculated between each of the 68 remaining pedoclimatic indicators. Environments were clustered based on the pedoclimatic indicator categories using the Ward method [32] to describe the network.

2.5. Statistical Analyses

All statistical analyses were performed with R software version 3.5.1 [33].

2.5.1. Partial Least Squares (PLS) Regression

To identify the pedoclimatic indicators that limited seed yield, a univariate partial least squares (PLS) regression [34] was performed on the mean SY value calculated as the mean between Aviso and Montego seed yields across the 20 environments of the network. PLS regression was preferred to linear regression because many indicators were considered and some of them were correlated. The univariate PLS regression model was based on the construction of latent variable (T) as linear combinations of the X variables (the pedoclimatic indicators in this study) so that cov(T,Y) is maximal and then regressing Y (the mean seed yield of Aviso and Montego) on those latent variables [35,36]. The number of latent variables to consider was based on the Q2 indicator [37]; one new component was considered if its Q2 value was over 0.0975. Finally, the model performance was estimated by its Q2cum (ref) value assessed on all its components. Gauchi and Chagnon [38] showed that a selection among the indicators under study could improve the PLS regression model. They proposed methods to perform this selection of variables as the Backward-Q2cum method (BQ method) [38]. The first step of this method was to perform a PLS regression on all pedoclimatic indicators and then to select the set of indicators that explain SY variability using a backward selection: at each step, the pedoclimatic indicator presenting the smallest regression coefficient in absolute value was discarded and a new PLS regression was performed. The process was repeated n-1 times (with n the number of pedoclimatic indicators considered). The best PLS regression model corresponded to the model with the highest Q2cum value. When two models resulted in the same Q2cum value, the one with the smallest number of indicators was chosen. PLS regressions runs were carried out using the plsreg1 function from the package plsdepot [39].
To validate the indicators set identified by the PLS regression, a leave-one-out procedure was used on the 20 environments. Twenty PLS regressions were performed using the same method, each on 19 environments (one environment was removed at each PLS regression). For each of the indicators selected by the PLS regression on the whole network, we calculated a confidence index as the number of times where the pedoclimatic indicator was selected among the 20 “leave-one-out” PLS regressions divided by the total number of environments. If the value of the confidence index was superior to 0.5, the pedoclimatic indicator was considered as consistent.

2.5.2. Envirotyping Based on the PLS Regression Results

Using the best PLS regression model, each environment was characterized by its coordinates on the different PLS axes multiplied by the impact of those axes on Y. Based on these coordinates, Euclidean distances between environments were calculated and used to carry out a clustering using the Ward method [32]. To determine the number of envirotypes (clusters of environments), the inertia gain was observed, and the Krzanowski and Lai index [40] was calculated for a number of clusters between 2 and 15. The index maximal value indicates the optimal number of envirotypes. Finally, each envirotype was described using the function catdes of the package FactoMineR [41] by the calculation of a test value as defined by Husson et al. [42]. Briefly, the test-value is the normalized variation between the mean value of individuals belonging to a given envirotype and the general mean.

2.5.3. Test of the Environment and Genotype by Environment Effects Using Linear Models

Each linear model was run using the function lm of R.
A first linear fixed model (Equation (3)) was fitted on the data of DS127 (11 environments) to test the effects of the environments and the G × E interaction across the network:
Y i j k = μ + G i + E j + G i × E j + R k ( j ) + ε i j k ,
where Y i j k is the seed yield (SY) of genotype i in environment j for the replicate k, μ is the population mean, G i stands for the effect of genotype i, E j for the effect of environment j, R k for the effect of replicate k nested in the environment j, G i × E j for the effect of interaction between genotype i, and environment j and ε i j k is the residual.
A second linear model (Equation (4)) was fitted to include an “envirotype” term and the corresponding interaction effects.
Y i j k l = μ + G i + C l + C l ( j ) + G i × C l + G i × C l ( j ) + C l ( j × k ) + ε i j k l ,
where Y i j k l is the SY observed for the genotype i, in envirotype l, in environment j, and in replicate k, μ is the population mean, G i stands for the effect of genotype i, C l for the effect of envirotype l, E j for the effect of environment j nested in envirotype l. R k stands for the effect of replicate k nested in environment j also nested in envirotype l. G i × C l the effect of interaction between genotype i and envirotype l,   G i × C l ( E j ) the effect of interaction between genotype i and environment j nested in envirotype l. ε i j k l is the residual.

3. Results

3.1. Description of the Field Network and Pedoclimatic Indicators

The mean seed yield of the two probe genotypes Aviso and Montego reached 3.4 t ha−1 (standard deviation of 0.618) over the whole network, ranging from 2.4 t ha−1 to 4.7 t ha−1 depending on the environment. The targeted yield of 3–3.5 t ha−1 was reached in most environments (Table S1). In addition, the mean NNI value across the network was 1.18 (standard deviation of 0.25), confirming that the network was not very impacted by a nitrogen stress as the NNI value was higher than 0.9 [17]. No biotic stresses were reported in the network. Taken together, these data suggested that the SY was primarily limited by pedoclimatic conditions.
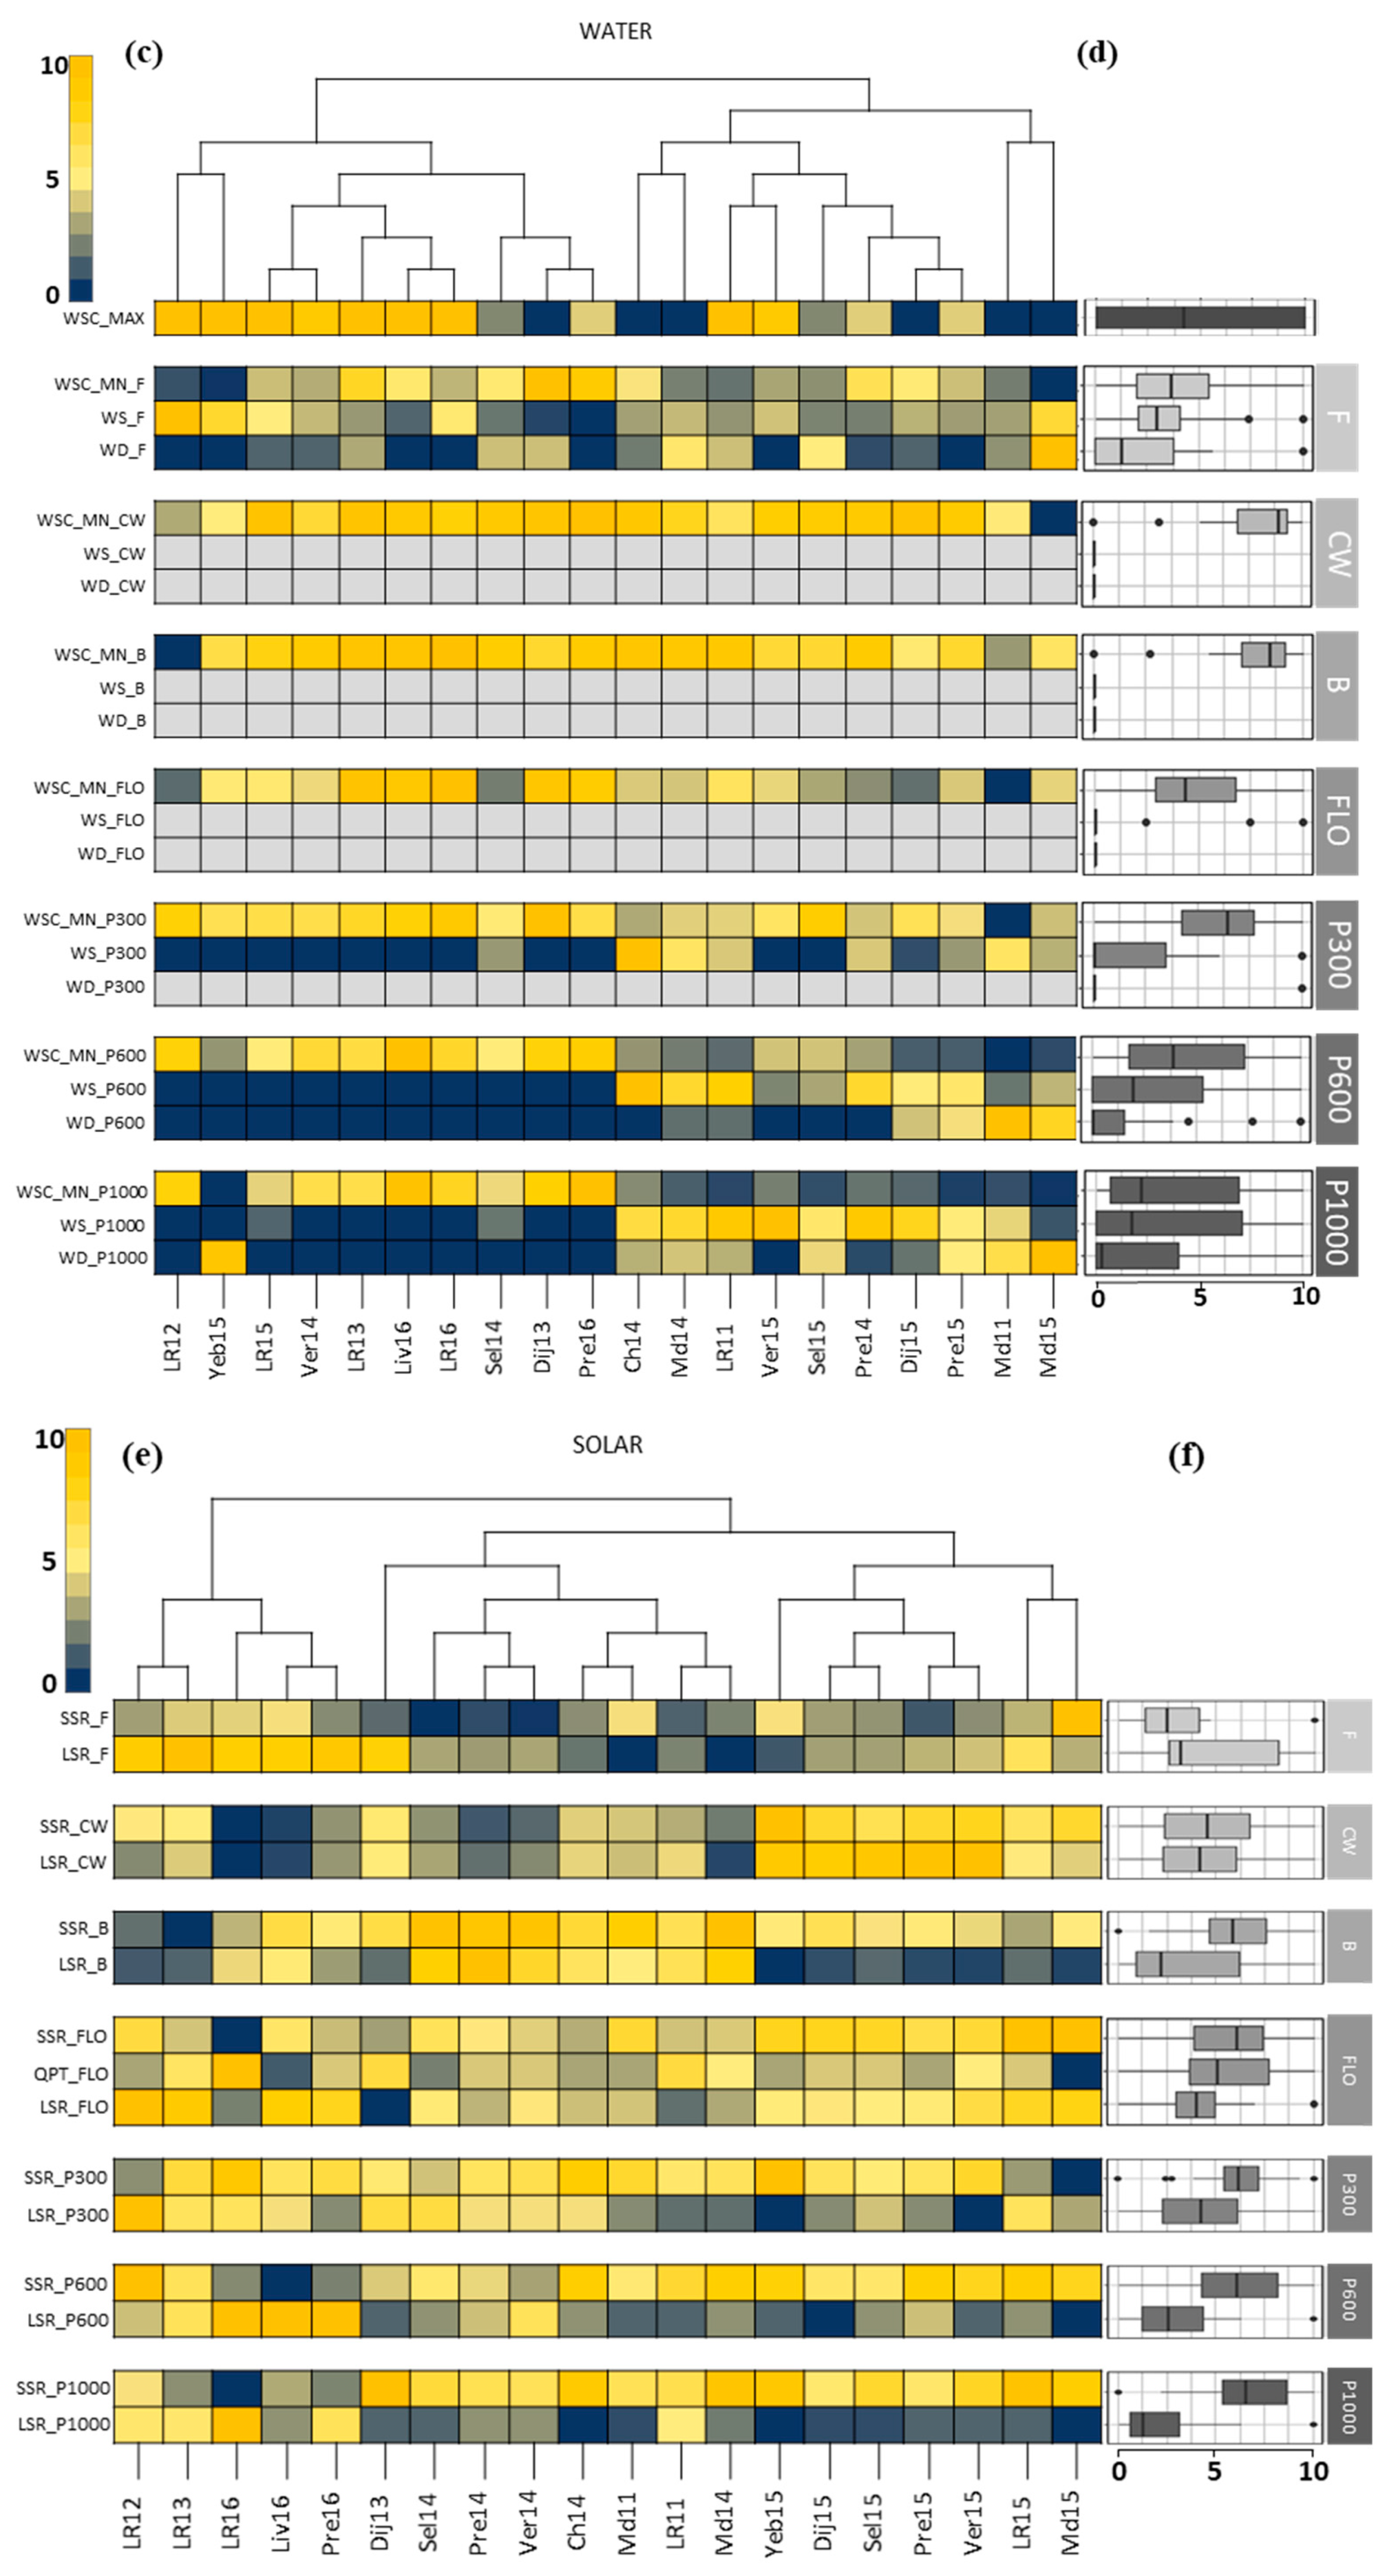
According to the four classifications, performed for each pedoclimatic categories, environments can be assigned to three climatic categories (Figure 1). The first category gathered the environments Dij13, Dij15, Pre15, Ver15, Sel15, Yeb15, Md11, and Md15, and can be qualified as “continental”. It is characterized by cold winters (high FR_CW and high LT_CW) and high temperature during spring and summers (high TMAX_FLO/P300/P600/P1000 and high HT_FLO/P300/P600/P1000). No solar deficit was recorded for these environments and five out of eight environments showed water stress during the reproductive phase (Dij15, Pre15, Yeb15, Md11, and Md15). This “continental” category gathered all environments of the year 2015 (except LR15), and all the trials were carried out in location “Dijon” in Eastern France. The second category consisted of the three environments LR12, LR13, and LR16. The environments of this category are characterized by a short duration of the flowering phase when expressed in growing degree-days (low LGDD_FLO), low temperatures at flowering (high LT_FLO and low TMN_FLO), solar deficiency during falls and the reproductive phase (LSR_F/P300/P600), and no water stress during the whole crop cycle. This category is specific to the LR location in Brittany (Western France), an area known for its oceanic climate with mild and rainy winters and the absence of extreme temperatures. The last group gathered environments Md14, Sel14, Pre14, Ver14, Liv16, Pre16, LR11, Ch14, and LR15. This group can be qualified as “modified oceanic” climate and is characterized by warm falls and winters (high TMAX_F and low FR_CW) and cool springs and summers. At the network scale, specific climatic constraints were recorded independently of the climate category: water stress during flowering (WSC_MN_FLO) were recorded for Md11, Dij15, Sel14, and LR12, and optimal vernalization conditions were not fulfilled for LR12, LR16, Md14, Md15, Md11, and Pre14. The calculation of the Pearson’s correlation coefficient for the 68 pedoclimatic indicators (Table S3) revealed that 25% of the correlation coefficients were significant at α = 0.05 and corresponded to correlation coefficient absolute values above 0.5 and that 5% of the correlations were highly significant (p-value < 0.001). This 5% of correlations are highlighted in Table S3.

3.2. Identification of the Critical Indicators for Seed Yield

Following the PLS regression analysis, the BQ method was applied, resulting in the selection of a model based on three components and 10 pedoclimatic indicators (Table 2). The confidence index calculated by PLS across permutations showed that these 10 indicators were identified in at least 60% of the permutations. The observed seed yield and the predicted seed yield were highly correlated (R2 = 0.96, RMSE = 1.3). Selected indicators presented highly significant correlations with other indicators excepted for TMAX_FLO (Table 2).
All categories of descriptors were represented in the 10 indicators revealed by the PLS regression with TMN_CW, TMAX_FLO, TMIN_P300, HT_P300, HT_P600, and TMN_P100 for the temperature category, WS_P1000 for the water category, LSR_FLO and SSR_P600 for the solar category, and finally, VERN_OPT. Except for VERN_OPT and TMN_CW, all selected indicators that explained seed yield variation were post-flowering indicators.

3.3. Definition of the Envirotypes

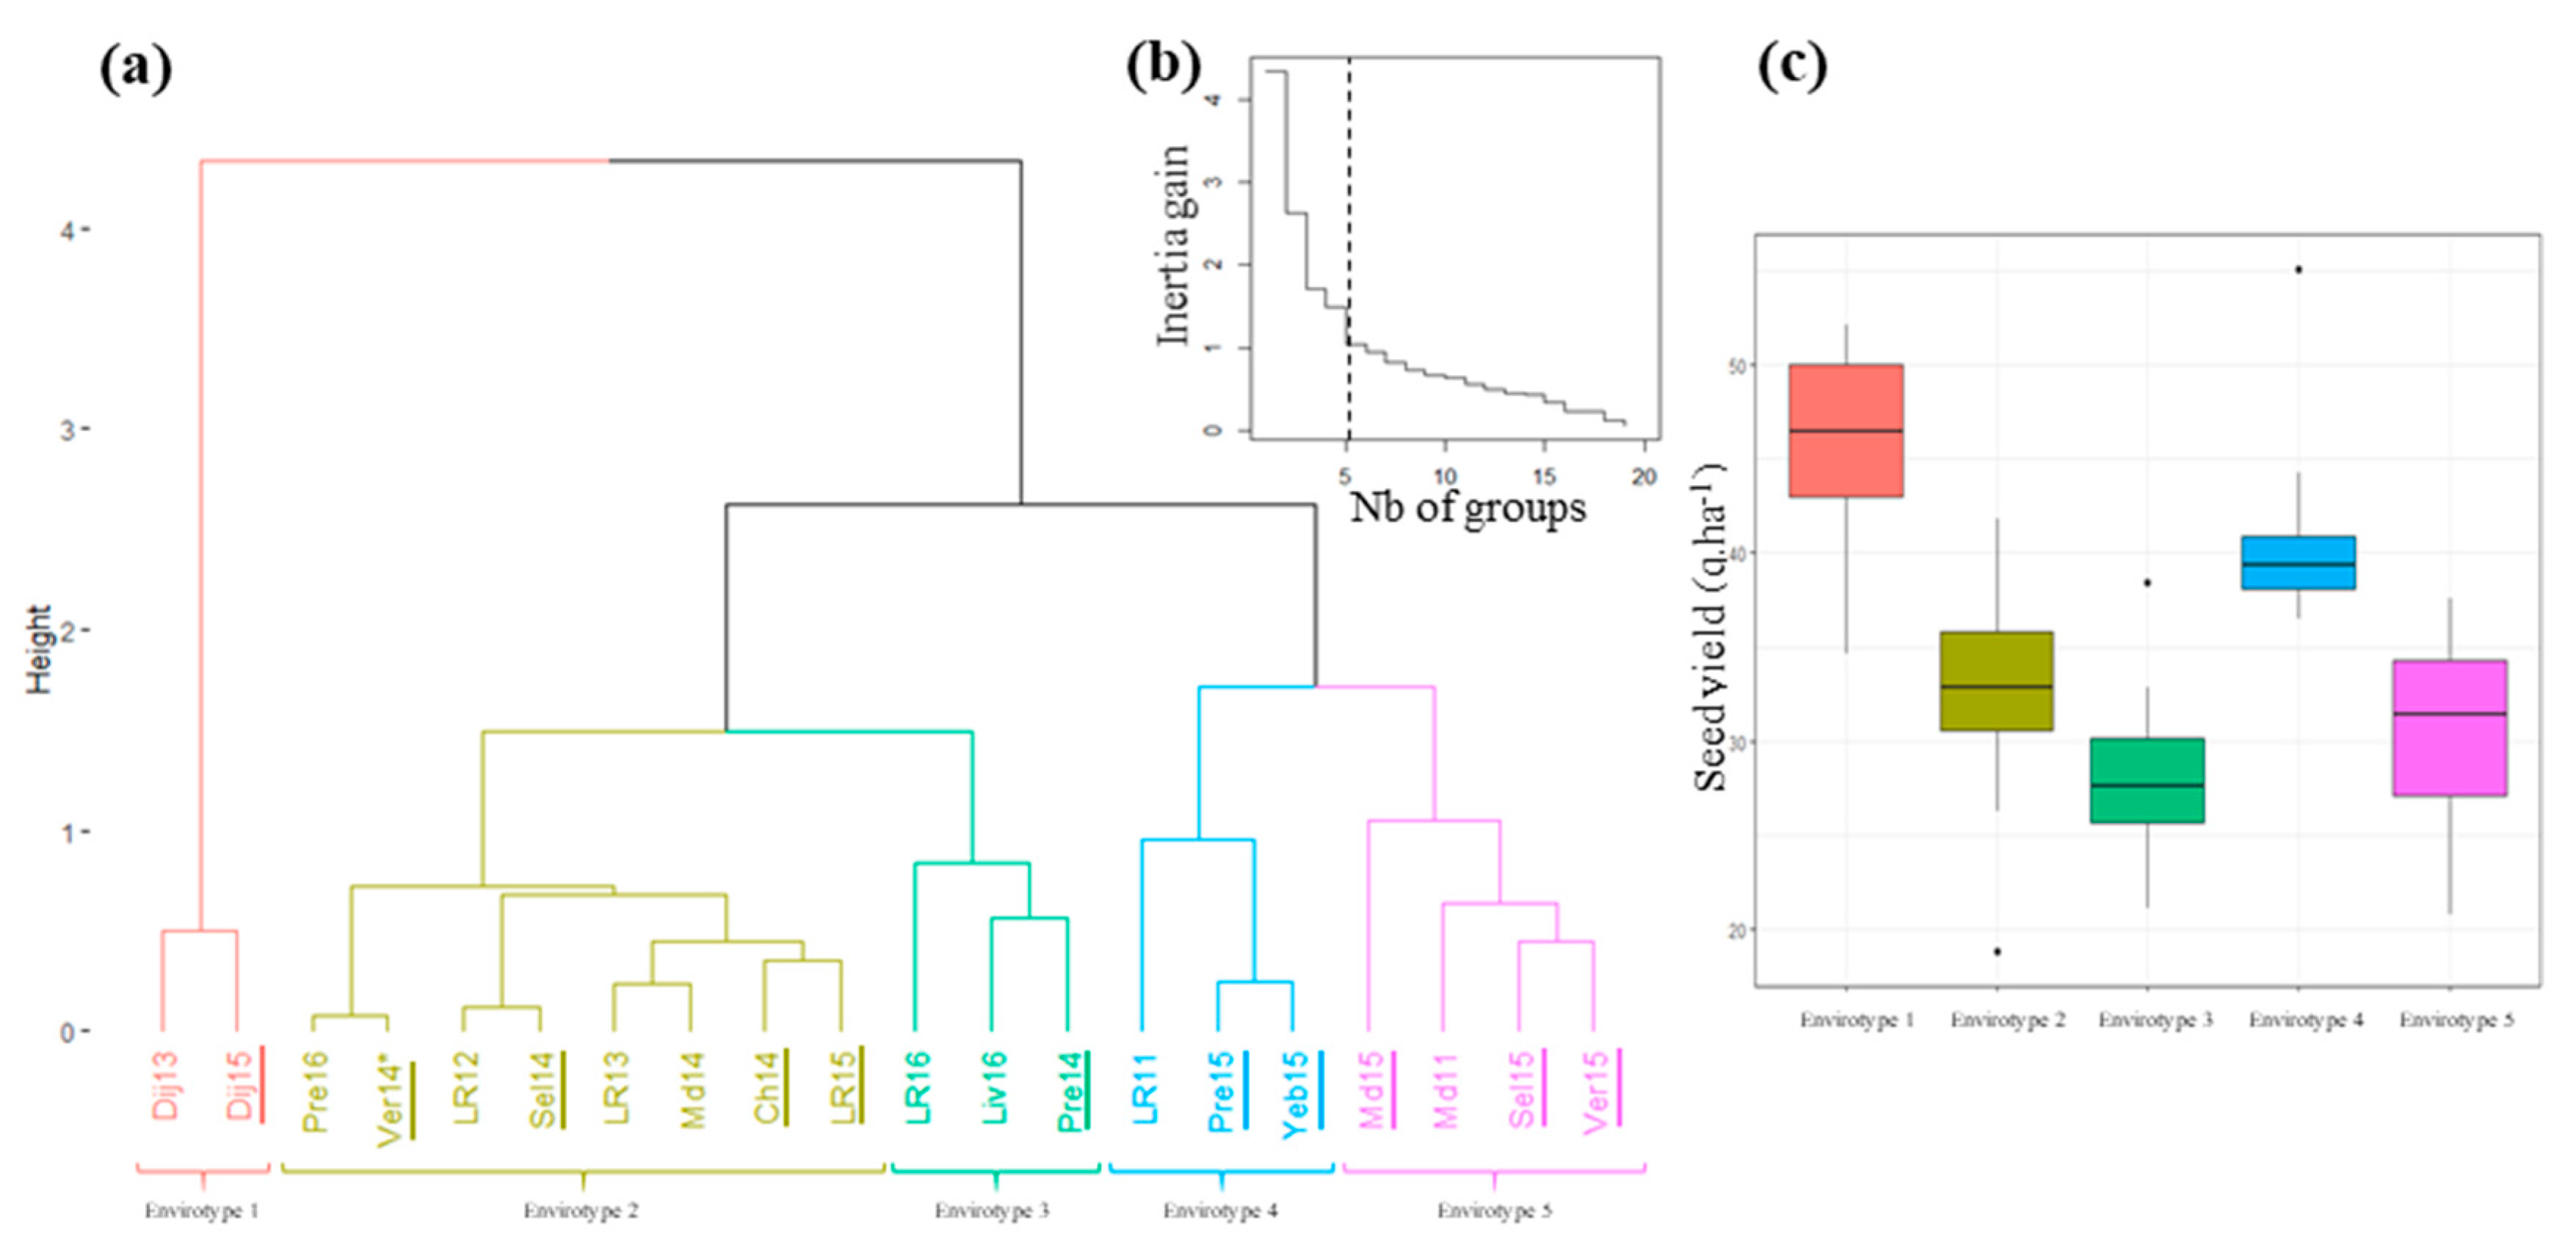
Based on the results of the PLS regression and of clustering of the environments, five envirotypes were identified regarding the inertia gain and the result of the Krzanowski and Lai index [40] (Figure 2a,b). The environments Dij13 and Dij15 constituted the envirotype 1. Pre16, Ver14, LR12, Sel14, LR13, Md14, Ch14, and LR15 constituted the envirotype 2. LR16, Liv16, and Pre14 constituted the envirotype 3. LR11, Pre15, and Yeb15 constituted the envirotype 4 and Md15, Md11, Sel15, and Ver15 constituted the envirotype 5. Noticeably, the different envirotypes did not correspond to a year or location specific classification except for the envirotype 1. The seed yield distribution of Aviso and Montego in each envirotype revealed high-yielding envirotypes (e.g., envirotype 1) and low-yielding envirotypes (e.g., envirotype 3) (Figure 2c).
The envirotypes were characterized according to their pedoclimatic indicators pattern (Figure 3). Envirotype 1 had a higher mean HT_P300 and a higher mean HT_P600 than the global network but a lower mean TMN_CW. Envirotype 2 was representative of the global network. Envirotype 3 was characterized by a lower mean SSR_P600. Envirotype 4 was characterized by a more important VERN_OPT. Last, envirotype 5 had a higher mean TMAX_FLO than the global network.

3.4. Evaluation and Decomposition of the G × E Interaction at the Network Level

3.4.1. Effect of the Envirotyping on the G × E Decomposition

The DS127 was trialed in 11 out of the 20 environments represented in at least one envirotype (Figure 2a). The distribution of seed yield for the DS127 per envirotype displayed the same pattern as shown for Aviso and Montego (Figure S3). The multi-local variance analysis, using the Equation (3) on the DS127 data (Table 3) revealed a high environmental effect with 51.1% of the variation and a high genotype effect and G × E interaction reaching 28.9% and 11.7% of the global variation, respectively. When considering the effect of the envirotyping on seed yield, we observed that the envirotype was significant and explained 46.2% of the total variation, and the environmental effect within each envirotype explained 4.9% (Table 4). Clustering the environments into five envirotypes contributed to explaining 90% of the environmental effect observed at the field network scale. The initial G × E interaction (Table 3) was split into the G × C (42.6%) and G × C × E effect (57.4%) (Table 4). Finally, within an envirotype, the environmental and G × E effects were reduced when compared to the global network.

3.4.2. Ranking of the Genotypes Per Envirotype

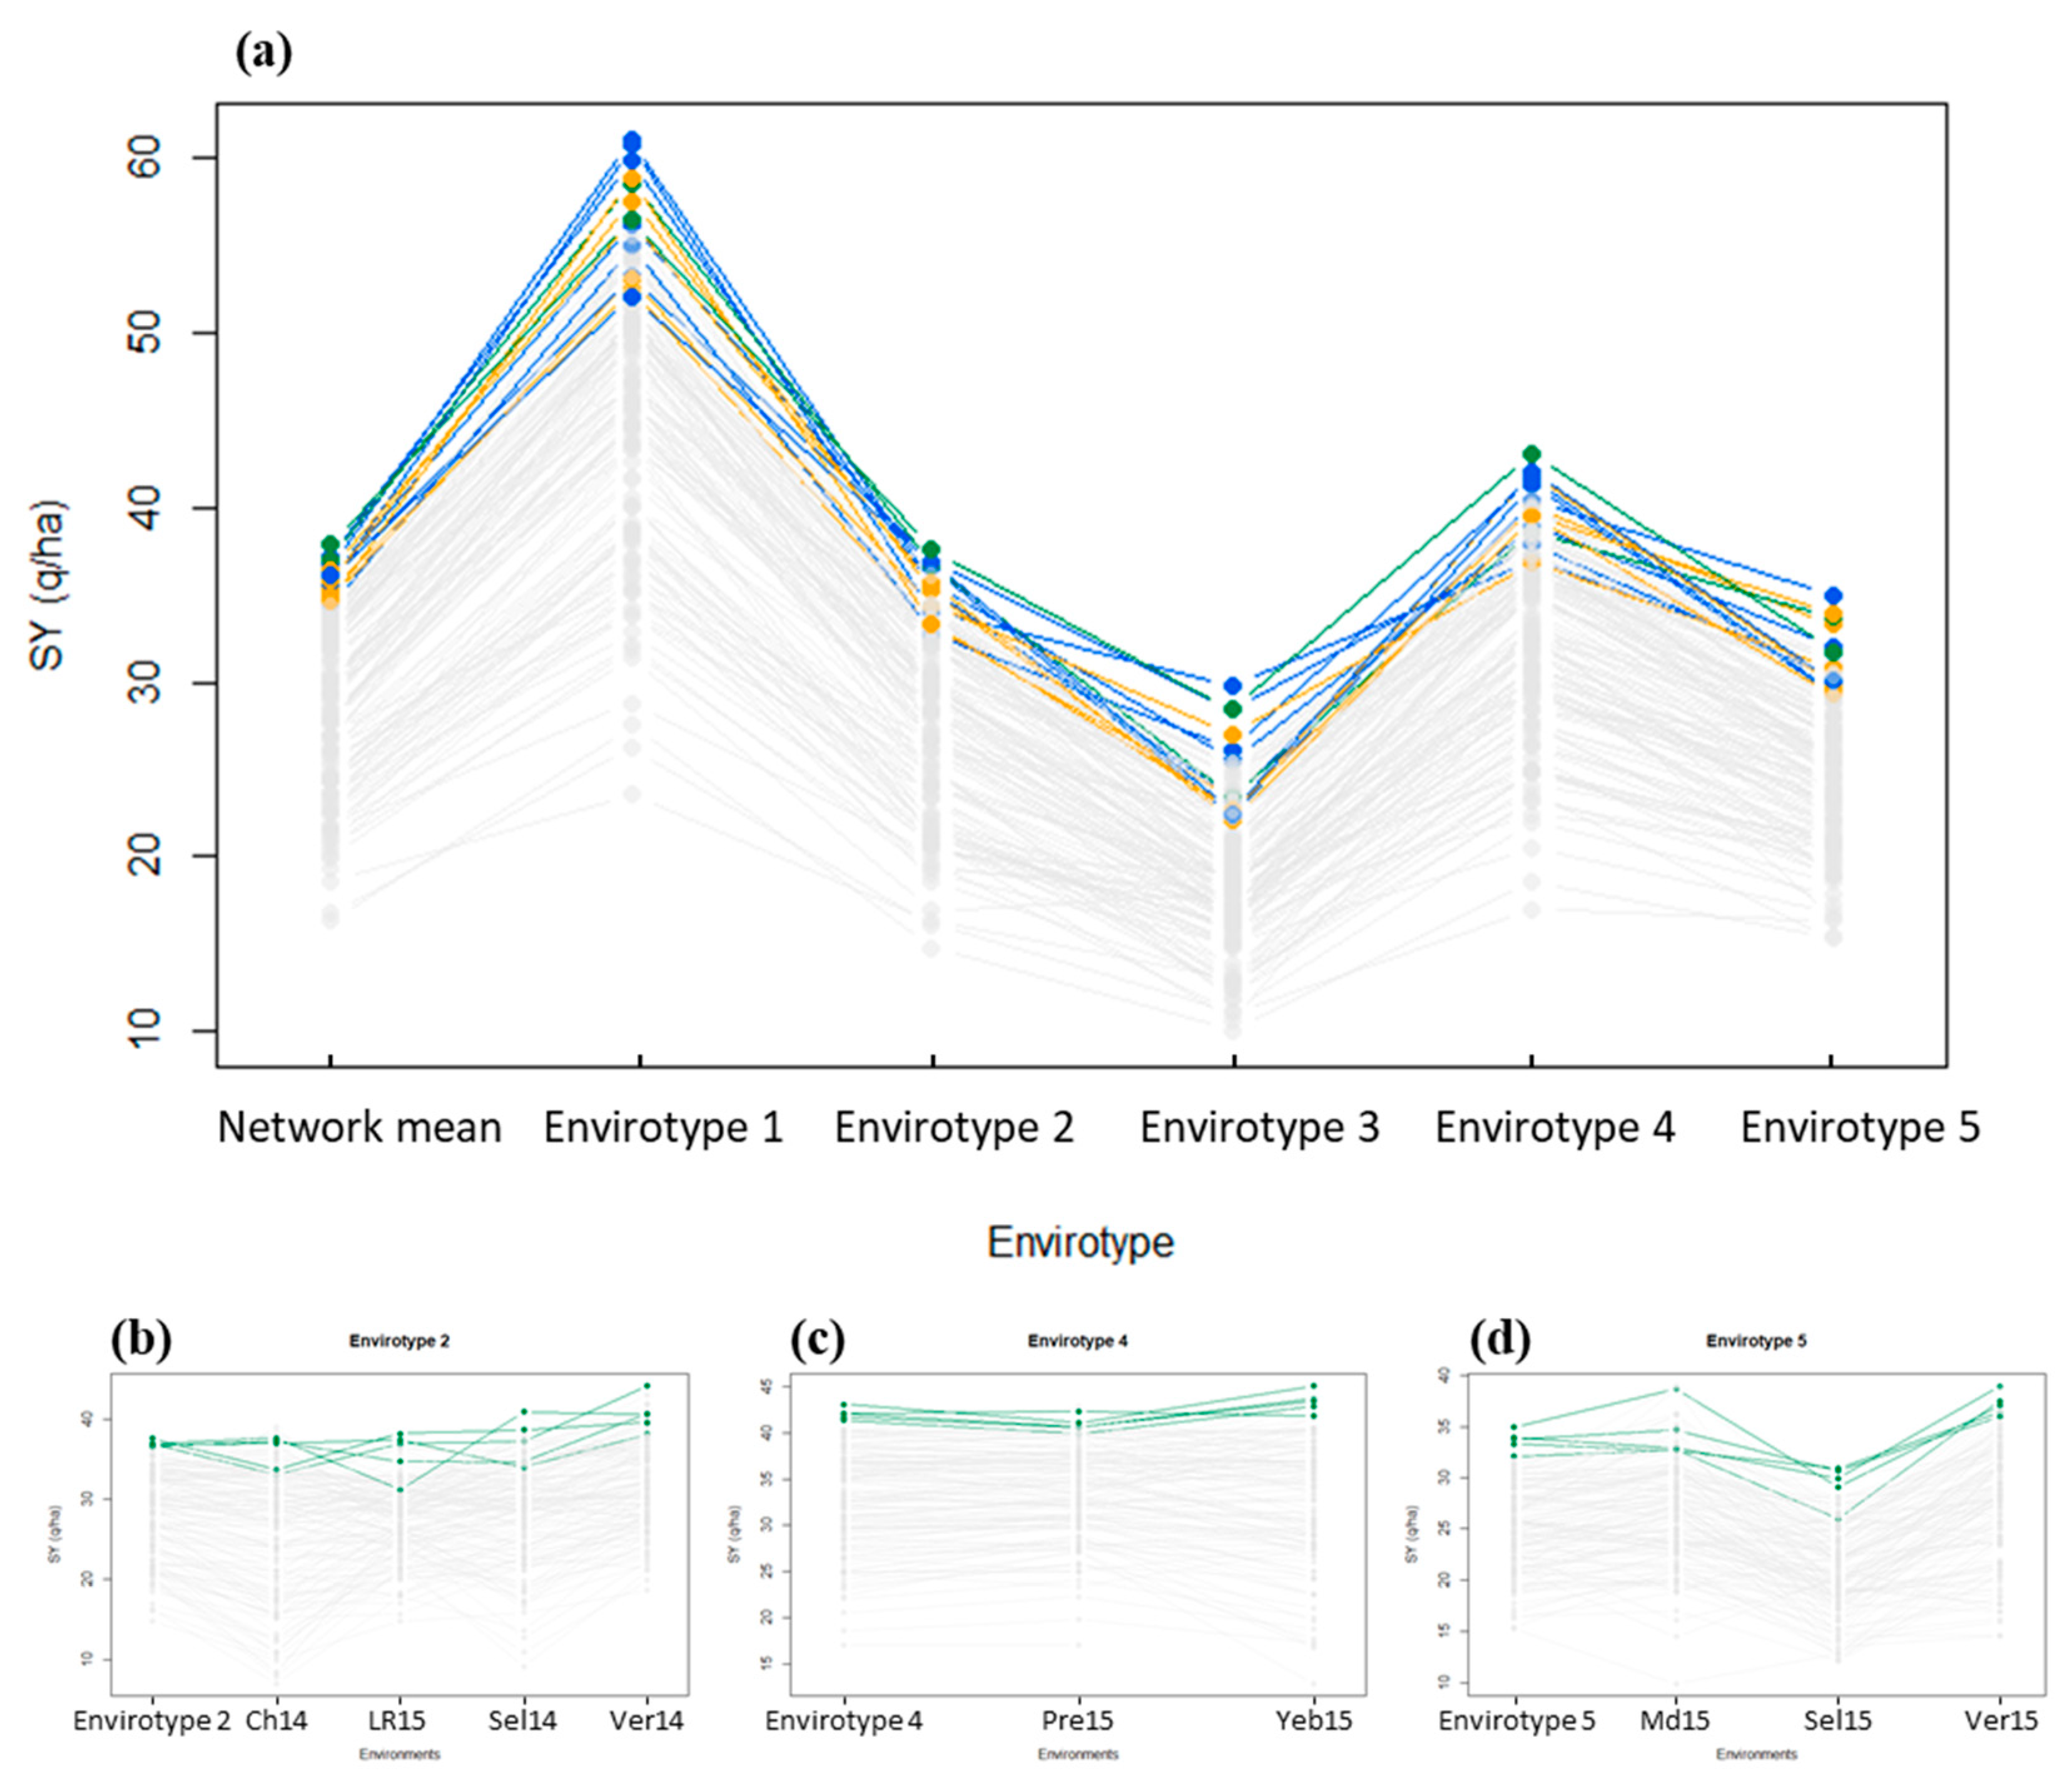
The evaluation of the genotype ranking per envirotype also illustrates the impact of the envirotyping on deciphering the G × E interaction (Figure 4a). Lists of the top five genotypes of each envirotype were compared. Taken together, these genotypes were always performing in the first quarter list, but the top five genotypes differed between envirotypes. Indeed, only two genotypes (Ecrin and SW Gospel) were identified in the top list of three envirotypes, including envirotype 1, 2, and 5 for Ecrin and envirotype 2, 3, and 4 for SW Gospel. Seven genotypes were common to two envirotypes: Adriana (envirotypes 1 and 5), Capvert (1 and 3), Astrid (1 and 5), Courage (2 and 3), Salomont (2 and 4), Alesi (2 and 4), and Kadore (3 and 4). Finally, five genotypes were envirotype-specific as Remy (1), Navajo (3), Pacific (4) Lewis (5), and Aviso (5). These rankings changed between envirotypes, highlighting qualitative G × E at the network scale. The same approach was carried out for envirotypes 2, 4, and 5 that included several environments, and the top list of genotypes per environment of a given envirotype was compared to the global ranking at the envirotype scale (Figure 4b–d). For instance, one genotype (SW Gospel) was identified as one of the best five genotypes of all the constituting environments of envirotype 4. Similar results were observed for genotype Astrid within envirotype 5.

4. Discussion

The main goal of this study was to characterize the environmental effect and the G × E interaction on winter oilseed rapeseed yield variation considering climatic, pedological, and plant phenological features. Using this framework, 68 informative pedoclimatic indicators were defined. A PLS regression coupled with a decision rule (Backward-Q2cum method) allowed to tag 10 indicators linked to the vernalization and reproductive phase as limiting for seed yield. These 10 indicators were used to cluster the environments of the network into five envirotypes. The envirotyping allowed catching a major part of the environmental effect as well as a smaller part of the G × E interaction. These results open new directions in quantitative genetics and genomics selection.

4.1. When Used in A Multi-Constraining Network the PLS Regression Selected Key Indicators That Were Critical for Seed Yield

Under French climatic conditions, a wide range of stresses can limit seed yield, according to the duration of the crop cycle as well as the diversity of climates occurring in France (oceanic, Mediterranean or pseudo-continental climates). To cover most stresses that potentially occurred along the crop cycle, 84 pedoclimatic indicators were defined and split into four categories (thermic, water, solar, and plant) for all developmental stages. This large set was reduced to 68 after consideration of the variability of each single indicator within the network. Other studies have focused on the impact of abiotic stresses on seed yield of Brassica napus. Thermic and water stresses were identified as limiting factors for spring oilseed rape grown under Mediterranean-type climates [9,10,11], and the time of flowering depends on the photoperiod and temperature [13]. However, these studies did not consider any other abiotic constraints. In this study, an exhaustive environmental screening of potential pedoclimatic indicators affecting seed yield was performed and produced a high number of indicators. Because this number was much higher than the number of environments and because correlations existed between indicators, classical methods to identify limiting factors, such as the factorial regression, cannot be carried out without a preselection of the most important variables. PLS regression permits using all variables, including correlated variables, without selection, and pairing with a decision rule selects indicators to improve the regression model. From the 68 indicators, 10 were identified by the PLS regression as limiting factors and all four categories were represented.

4.2. Critical Factors for Seed Yield in WOSR Were Mostly Related to Heat Stress, Radiation Deficit, and Water Shortage during Vernalization and Reproductive Periods

The 10 pedoclimatic indicators identified for seed yield were related to the vernalization period (TMN_CW and VERN_OPT) and the reproductive phase (TMAX_FLO, LSR_FLO, TMIN_P300, HT_P300, HT_P600, SSR_P600, TMN_P1000, and WS_P1000). Most of the correlated indicators showed the same processes excepted for the correlation between HT_P600 and FR_CW (Table S3). Vernalization controls flowering time and is highly impacted by the photoperiod and the duration at low temperatures (<5 °C for Brassica napus) [43]. The non-fulfillment of optimal vernalization conditions impacts seed yield, leading to a delay or an absence of flowering in WOSR [44]. In Arabidopsis thaliana, the two genes FRIGIDA (FRI) and FLOWERING LOCUS C (FLC) are known to delay flowering, but their effect can be suppressed by a vernalization treatment. Orthologs have been identified in Brassica napus and their impact on flowering time was confirmed [45,46]. With an earlier flowering, the environmental conditions at anthesis could change and affect the seed number elaboration. An earlier flowering also decreases the duration of the vegetative phase resulting in a lower amount of accumulated assimilates to be remobilized to the grain afterward. During the reproductive phase including the flowering period, the seed number fixation period (P300), the period when reserves are allocated to pod growth (P600) and the period when reserves primarily allocated to the pods are used for seed growth (P1000), five thermic indicators were identified as limiting. Heat stress at flowering is known to induce a seed yield reduction in Brassica napus by affecting the flower fertility: size and shape of the floral organs [47,48,49]. Heat stress can also affect the seed number, the number of seeds per pod, and the pod number [47,48], depending on the period affected by the stress. For instance, during the P1000 period, high temperature impact on seed yield was quantified as a loss of 0.4 t ha−1 for an increase of 3 °C of the mean temperature for canola [50]. Two solar indicators were identified during flowering and P600 periods. Radiation stresses are sometimes confounded with heat stress in the literature, and therefore less described [48]. In our study, these two solar indicators were not correlated with a thermic indicator; we were able to distinguish radiation effects from heat stress and to highlight both effects independently. This distinction is important because radiation stress by itself can lead to seed yield variation, especially during flowering and seed filling, as shown by Baux et al. [31]. Radiation stress during the reproductive phase could affect the pod autotrophy by affecting the pod chlorophyll content and their photosynthetic activity. Finally, one water indicator was identified as limiting during the end of the crop cycle. In France, water shortage is not considered as a major limiting factor for rapeseed, but it can lead to seed yield loss, especially when the stress appears between the BBCH stages 65 and 73, affecting the number of pods per plant [14].

4.3. An Approach to Capture the Components of the Environmental Effect

The five envirotypes identified gathered from two to eight environments each. The environments were not grouped according to their climatic features or the climatic year. Indeed, this clustering was compared to a clustering performed using a PCA carried out using the whole set of pedoclimatic indicators. The results showed that environments were clustered mainly according to the year of the experiment and secondly according to their location, and no differences were observed for mean seed yield between groups (data not shown). However, the envirotyping based on the PLS regression was reliable as it explained 90% of the environmental variation observed across 11 environments, thus drastically reducing the remaining environmental effect within each envirotype. These results confirmed the important effect of environment on seed yield and the ability of the method to identify a posteriori the pedoclimatic components explaining yield instability. This envirotyping allowed us to define a typology of environments. These results can be helpful to design new networks or to improve existing ones. For instance, redundant environments, that are environments attributed to the same envirotype, could be removed from the network, or new environments could be added to increase the representativeness of specific limiting factors. Indeed, the 11 environments where the DS127 was trialed consisted of a first optimization of the network as each envirotype was represented by at least one environment. Such optimized networks could be valuable for registration and post-registration trials to provide agricultural advice in the choice of cultivars adapted to one or several environments.

4.4. An Approach that Provided First Clues to Tackle the G × E Interaction

After the understanding of the environmental effect, the second goal of this study was to decipher the G × E interaction. According to the DS127 data, the G × E interaction stood for 11.7% of the variation. The envirotyping permitted to reduce the G × E between envirotype to 5% and reducing the G × E inside envirotype to only 6.7%. However, as showed by the genotype ranking, the interaction was still present inside envirotypes. When we calculated the ecovalence of each environment as defined by Parisot-Baril [51], which corresponds to the contribution of each environment to the G × E interaction, we did not observe that highly interactive (or stable) environments were grouped together. This may result from the fact that period definition, PLS regression, and envirotyping were performed on the two probes genotypes that were not perfectly representative of the whole diversity of DS127. To specifically target the pedoclimatic factors that do affect the G × E interaction, it could be worth using the PLS regression approach to explain directly the environmental ecovalence instead of the mean environment seed yield or directly performing a multivariate PLS regression on the interaction matrix estimated for large number of genotypes trialed under numerous environments (more than 20 environments). However, envirotyping directly on G × E interaction term remains tricky as G × E only accounted for a small part of total variation, leading to potential confounding effects with errors. Such errors could be attributed to the fact that the G × E interaction is dependent on both the genotype set and on the environment sets. In such G × E-based clustering approach, the environments will be gathered into envirotypes according to their ability to contribute to G × E and not to their patterns of seed yield limiting factors, leading to difficulties to interpret the clustering. Moreover, the clustering will be dependent on the given genotype set. It will, therefore, not be possible to use the obtained clustering to optimize a field network. In our study, the envirotyping was based on seed yield variation between environments, leading to an agronomic characterization of the envirotype. We then demonstrated that this envirotyping was also useful to control a part of the G × E interaction and could be transferred from few genotypes to a larger range of genetic diversity.

4.5. Get Further into the Genetic Determinant of the G × E Interaction and Its Interest for Breeding Programs

Handling G × E interaction is critical for breeders, as it is a driver of a wide versus specific adaptation of cultivars to environments. Stable cultivars that present a small contribution to the G × E are adapted for large areas, whereas cultivars dedicated to specific environments may benefit from high G × E interaction. In most cases, the breeding material is evaluated for a variety of locations. Another option consists in breeding genotypes using a single representative environment of the region of interest [52]. However, we showed that trials carried out in the same location but on different years did not present the same limiting factors. Therefore, we propose an alternative strategy where breeding trials are grouped into envirotypes according to their limiting factors and not according to their geographical proximity. This methodology can help breeders in designing field networks that emphasize limiting factors for their breeding programs, but we must define new indicators related to biotic interaction or cultural conditions. To help in the identification and the assessment of new pedoclimatic indicators, crop models can be used to simulate daily indicators, such as nitrogen nutrition index, soil water content, soil nutrient availability (N, P, K, S...).

5. Conclusions

The results of our study could find applications in quantitative genetics (for QTL detection/GWAS) and for breeding (with marker-assisted selection (MAS)) using the envirotypes or by considering the limiting factors as covariables in the models. Indeed, the G × E interactions lead to instability of the loci detected from one environment to the other. Understanding this specificity will help breeders considering specific loci for MAS purposes, depending on a given environment (represented here by an envirotype and its pattern of limiting factors). Our results could also be used to improve genomic predictions by calibrating models for each envirotype or using environmental covariates into the calibrations to predict the environment effect and genotypic performances across environments.

Supplementary Materials

The following are available online at https://www.mdpi.com/2073-4395/9/12/798/s1. Figure S1: Description of the DS127 set based on the ecovalence calculated for each genotype. Figure S2: Adaptation of crop coefficient (Kc) dynamics for winter oilseed rape to perform soil water content estimation across the crop cycle. Figure S3: Seed yield distribution of the DS127 set following the envirotypes defined for Aviso and Montego. Table S1: Field network and crop management strategies. Table S2: Description of the DS127 diversity set of winter oilseed rape. Table S3: Matrix of correlation coefficients between the 68 pedoclimatic indicators.

Author Contributions

Conceptualization, E.C., A.G., C.B.-B., A.L. and N.N.; methodology, E.C., A.G. and A.L.; software, E.C.; validation, E.C. and A.L.; formal analysis, E.C.; investigation, E.C., C.B.-B., A.L. and N.N.; resources, A.L. and N.N.; data curation, E.C., A.-S.B., A.L. and N.N.; writing—original draft preparation, E.C., A.L. and N.N.; writing—review and editing, A.G., A.-S.B., C.B.-B., A.L. and N.N.; visualization, E.C., A.L. and N.N.; supervision, A.L. and N.N.; project administration, A.L. and N.N.; funding acquisition, N.N.

Funding

“This research was supported by two national collaborative projects entitled GENERGY (ANR-07-GPLA-016) funded by the French National Research Agency (ANR) and RAPSODYN (ANR-11-BTBR-0004) funded by the program “Investments for the Future”.

Acknowledgments

The authors acknowledge Olivier Godinot (AGROCAMPUS OUEST, France) for providing a useful extraction of the climatic data from Meteo France. We thank Sébastien Faure (Innolea, France) and Patrick Bagot (GEVES, France) for helpful discussions about the development of the pedoclimatic indicators, Morgan Hamm (University of Washington, Seattle, USA) for English proofreading of the manuscript. We are grateful to the technical teams for excellent field trial management and data collection, especially Elise Alix, Bernard Moulin, Alina Tollenaere, Tyfanie Bourlet and the Experimental Unit of “La Motte” from INRA (Le Rheu, France); Pierre George, Amandine Larièpe and Sébastien Faure from Innolea (Mondonville, France); Johanna Younous and Thomas Foubert from Euralis (Châteauroux, France); Xavier Pinochet and Guillaume Joly from Terres Inovia (Dijon, France); Clara Simon and Jean-Eric Dheu from Limagrain Europe (Verneuil l’Etang, France); Olivier Maes and Alexandra Heulin from MAS seeds (Rhodon, France); Damien Dugué from RAGT (Prémesques, France); Julien Moreau from Syngenta (Verpillères, France). We acknowledge the BrACySol Biological Resource Center (INRA Ploudaniel, France) for providing most of the seeds that were used in this study.

Conflicts of Interest

The authors declare no conflict of interest. The funders had no role in the design of the study; in the collection, analyses, or interpretation of data; in the writing of the manuscript, or in the decision to publish the results.

References

  1. von Wricke, G. Über eine Methode zur Erfassung der ökologischen Streubreite in Feldversuchen. Z. Planznezücht 1962, 47, 92–96. [Google Scholar]
  2. Finlay, K.W.; Wilkinson, G.N. The analysis of adaptation in a plant-breeding programme. Aust. J. Agric. Res. 1963, 14, 742–754. [Google Scholar] [CrossRef]
  3. Brancourt-Hulmel, M.; Biarnès-Dumoulin, V.; Denis, J. Points de repère dans l’analyse de la stabilité et de l’interaction génotype-milieu en amélioration des plantes. Agronomie 1997, 17, 219–246. [Google Scholar] [CrossRef]
  4. Denis, J.B. Two way analysis using covariates1. Stat. A J. Theor. Appl. Stat. 1988, 19, 123–132. [Google Scholar]
  5. Vargas, J.; van Eeuwijk, F.; Sayre, K.D.; Reynolds, P.M.C. Interpreting treatment x environment interactin in agronomy trials. Agron. J. 2001, 93, 949–960. [Google Scholar] [CrossRef]
  6. Van Ittersum, M.K.; Cassman, K.G.; Grassini, P.; Wolf, J.; Tittonell, P.; Hochman, Z. Yield gap analysis with local to global relevance-A review. Filed Crop. Res. 2013, 143, 4–17. [Google Scholar] [CrossRef]
  7. FAOSTAT Production/Yield Quantities of Rapeseed in World. Available online: http://www.fao.org/faostat/en/?#data/QC/visualize (accessed on 20 April 2019).
  8. Bouchet, A.S.; Laperche, A.; Bissuel-Belaygue, C.; Baron, C.; Morice, J.; Rousseau-Gueutin, M.; Dheu, J.E.; George, P.; Pinochet, X.; Foubert, T.; et al. Genetic basis of nitrogen use efficiency and yield stability across environments in winter rapeseed. BMC Genet. 2016, 17, 131. [Google Scholar] [CrossRef]
  9. He, D.; Wang, E.; Wang, J.; Lilley, J.M. Genotype × environment × management interactions of canola across China: A simulation study. Agric. For. Meteorol. 2017, 247, 424–433. [Google Scholar] [CrossRef]
  10. Moghaddam, M.J.; Pourdad, S.S. Genotype × environment interactions and simultaneous selection for high oil yield and stability in rainfed warm areas rapeseed (Brassica napus L.) from Iran. Euphytica 2011, 180, 321–335. [Google Scholar] [CrossRef]
  11. Zhang, H.; Berger, J.D.; Milroy, S.P. Genotype×environment interaction studies highlight the role of phenology in specific adaptation of canola (Brassica napus) to contrasting Mediterranean climates. Filed Crop. Res. 2013, 144, 77–88. [Google Scholar] [CrossRef]
  12. Metzger, M.J.; Bunce, R.G.H.; Jongman, R.H.G.; Mücher, C.A.; Watkins, J.W. A climatic stratification of the environment of Europe. Glob. Ecol. Biogeogr. 2005, 14, 549–563. [Google Scholar] [CrossRef]
  13. Habekotté, B. Evaluation of seed yield determining factors of winter oilseed rape (Brassica napus L.) by means of crop growth modelling. Filed Crop. Res. 1997, 54, 137–151. [Google Scholar] [CrossRef]
  14. Champolivier, L.; Merrien, A. Effects of water stress applied at different growth stages to Brassica napus L. var. oleifera on yield, yield components and seed quality. Eur. J. Agron. 1996, 5, 153–160. [Google Scholar] [CrossRef]
  15. Parnaudeau, V.; Jeuffroy, M.; Machet, J.; Reau, R.; Bissuel, C. Methods for determining the nitrogen fertiliser requirements of some major arable crops in France. In Proceedings of the International Fertiliser Society, Cambridge, UK, 11 December 2009; pp. 1–26. [Google Scholar]
  16. Rémy, J.; Hébert, J. Le devenir des engrais azotés dans le sol. Acad. l’Agric. Fr. 1977, 63, 700–714. [Google Scholar]
  17. Colnenne, C.; Meynard, J.; Reau, R.; Justes, E.; Merrien, A. Determination of a Critical Nitrogen Dilution Curve for Winter Oilseed Rape. Ann. Bot. 1998, 81, 311–317. [Google Scholar] [CrossRef]
  18. Lancashire, P.D.; Bleiholder, H.; Van Den BOOM, T.; Langelüddeke, P.; Stauss, R.; Weber, E.; Witzenberger, A. A uniform decimal code for growth stages of crops and weeds. Ann. Appl. Biol. 1991, 119, 561–601. [Google Scholar] [CrossRef]
  19. Weber, E.; Bleiholder, H. Explanations of the BBCH decimal codes for the growth stages of maize, rape, faba beans, sunflowers and peas-with illustrations. Gesunde Pflanz. 1990, 42, 308–321. [Google Scholar]
  20. Gabrielle, B.; Denoroy, P.; Gosse, G.; Justes, E.; Andersen, M.N. Development and evaluation of a CERES-type model for winter oilseed rape. Filed Crop. Res. 1998, 57, 95–111. [Google Scholar] [CrossRef]
  21. Hebinger, H. Le Colza; Editions France Agricole: Paris, France, 2013; ISBN 978-2-85557-241-3. [Google Scholar]
  22. Leterme, P. Modelisation De La Croissance Et De La Production Des Siliques Chez Le Colza D’hiver (Brassica napus L.); INA Paris-Grignon: Paris, France, 1985. [Google Scholar]
  23. Jullien, A.; Mathieu, A.; Allirand, J.M.; Pinet, A.; De Reffye, P.; Cournède, P.H.; Ney, B. Characterization of the interactions between architecture and sourcesink relationships in winter oilseed rape (Brassica napus) using the GreenLab model. Ann. Bot. 2011, 107, 765–779. [Google Scholar] [CrossRef]
  24. Météo France Données Quotidiennes Du Modèle De Simulation Des Schémas De Surface. Available online: https://donneespubliques.meteofrance.fr/?fond=produit&id_produit=230&id_rubrique=40 (accessed on 1 January 2016).
  25. Bruand, A.; Duval, O.; Cousin, I. Estimation des propriétés de rétention en eau des sols à partir de la base de données SOLHYDRO: Une première proposition combinant le type d’horizon, sa texture et sa densité apparente. Étude Gest. Des Sols 2004, 11, 323–334. [Google Scholar]
  26. Fan, J.; McConkey, B.; Wang, H.; Janzen, H. Root distribution by depth for temperate agricultural crops. Filed Crop. Res. 2016, 189, 68–74. [Google Scholar] [CrossRef]
  27. Lacoste, M.; Mulder, V.L.; Richer-De-Forges, A.C.; Martin, M.P.; Arrouays, D. Evaluating large-extent spatial modeling approaches: A case study for soil depth for France. Geoderma Reg. 2016, 7, 137–152. [Google Scholar] [CrossRef]
  28. Allen, R.G.; Pereira, L.S.; Raes, D.; Smith, M. Crop evapotranspiration—Guidelines for computing crop water requirements - FAO Irrigation and drainage paper 56. Irrig. Drain. 1998, 1–15. [Google Scholar]
  29. Weymann, W.; Böttcher, U.; Sieling, K.; Kage, H. Effects of weather conditions during different growth phases on yield formation of winter oilseed rape. Filed Crop. Res. 2015, 173, 41–48. [Google Scholar] [CrossRef]
  30. Fischer, R.A. Number of kernels in wheat crops and the influence of solar radiation and temperature. J. Agric. Sci. 1985, 105, 447–461. [Google Scholar] [CrossRef]
  31. Baux, A.; Wegmüller, J.; Holzkämper, A. Exploring Climatic Impact on Oilseed Rape Yield in Switzerland. Procedia Environ. Sci. 2015, 29, 123. [Google Scholar] [CrossRef]
  32. Ward, J.H. Hierarchical grouping to optimize an objective function. J. Am. Stat. Assoc. 1963, 58, 236–244. [Google Scholar] [CrossRef]
  33. R Development Core Team. R: A Language and Environment for Statistical Computing; R Foundation for Statistical Computing: Vienna, Austria, 2017. [Google Scholar]
  34. Wold, S.; Albano, C.; Dunn, W.J., III; Esbensen, K.; Hellberg, S.; Johansson, E.; Sjöström, H. Pattern Recognition: Finding and Using Regularities in Multivariate Data. In “Food Research and Data Analysis”, Proceedings of the IUFoST Conference, Oslo, Norway, 20–23 September 1982; Martens, J., Ed.; Applied Science Publications: London, UK, 1983; pp. 147–188. [Google Scholar]
  35. Palermo, G.; Piraino, P.; Zucht, H.D. Performance of PLS regression coefficients in selecting variables for each response of a multivariate PLS for omics-type data. Adv. Appl. Bioinform. Chem. 2009, 2, 57–70. [Google Scholar] [CrossRef]
  36. Tenenhaus, M. La Régression PLS: Théorie Et Pratique; Editions Technip: Paris, France, 1998; ISBN 2-7108-0735-1. [Google Scholar]
  37. Schüürmann, G.; Ebert, R.U.; Chen, J.; Wang, B.; Kühne, R. External validation and prediction employing the predictive squared correlation coefficient—Test set activity mean vs. training set activity mean. J. Chem. Inf. Model. 2008, 48, 2140–2145. [Google Scholar] [CrossRef]
  38. Gauchi, J.P.; Chagnon, P. Comparison of selection methods of explanatory variables in PLS regression with application to manufacturing process data. Chemom. Intell. Lab. Syst. 2001, 58, 171–193. [Google Scholar] [CrossRef]
  39. Sanchez, G. Plsdepot: Partial Least Squares (PLS) Data Analysis Methods, R package version 0.1.17; 2012; Available online: https://CRAN.R-project.org/package=plsdepot (accessed on 22 November 2019).
  40. Krzanowski, W.J.; Lai, Y.T. A Criterion for Determining the Number of Groups in a Data Set Using Sum-of-Squares Clustering. Biometrics 1988, 44, 23. [Google Scholar] [CrossRef]
  41. Lê, S.; Josse, J.; Husson, F. FactoMineR: A Package for Multivariate Analysis. J. Stat. Softw. 2008, 25, 1–18. [Google Scholar] [CrossRef]
  42. Husson, F.; Lê, S.; Pagès, J. Computer Science and Data Analysis Series Exploratory Multivariate Analysis by Example Using R; Chapman and Hall/CRC: Boca Raton, FL, USA, 2017; ISBN 9781138196346. [Google Scholar]
  43. Chandler, J.; Corbesier, L.; Spielmann, P.; Dettendorfer, J.; Stahl, D.; Apel, K.; Melzer, S. Modulating flowering time and prevention of pod shatter in oilseed rape. Mol. Breed. 2005, 15, 87–94. [Google Scholar] [CrossRef]
  44. Ferreira, M.E.; Satagopan, J.; Yandell, B.S.; Williams, P.H.; Osborn, T.C. Mapping loci controlling vernalization requirement and flowering time in Brassica napus. Theor. Appl. Genet. 1995, 90, 727–732. [Google Scholar] [CrossRef] [PubMed]
  45. Sheldon, C.C.; Finnegan, E.J.; Rouse, D.T.; Tadege, M.; Bagnall, D.J.; Helliwell, C.A.; Peacock, W.J.; Dennis, E.S. Control of Flowering By Vernalization. Curr. Opin. Plant Biol. 2000, 3, 418–422. [Google Scholar] [CrossRef]
  46. Tadege, M.; Sheldon, C.C.; Helliwell, C.A.; Stoutjesdijk, P.; Dennis, E.S.; Peacock, W.J. Control of flowering time by FLC orthologues in Brassica napus. Plant J. 2001, 28, 545–553. [Google Scholar] [CrossRef]
  47. Morrison, M.J. Heat stress during reproduction in summer rape. Can. J. Bot. 1993, 71, 303–308. [Google Scholar] [CrossRef]
  48. Angadi, S.V.; Cutforth, H.W.; Miller, P.R.; Mcconkey, B.G.; Entz, M.H.; Brandt, S.A. Response of three Brassica species to high temperature stress during reproductive growth. Can. J. Plant Sci. 2000, 80, 693–702. [Google Scholar] [CrossRef] [Green Version]
  49. Young, L.W.; Wilen, R.W.; Bonham-smith, P.C. High temperature stress of Brassica napus during fowering reduces micro- and megagametophyte fertility, induces fruit abortion, and disrupts seed production. J. Exp. Bot. 2004, 55, 485–495. [Google Scholar] [CrossRef] [Green Version]
  50. Nuttal, W.F.; Moulin, A.P.; Townley-Smith, L.J. Yield Response of Canola to Nitrogen, Phosphorus, Precipitation, and Temperature. Agron. J. 1992, 84, 765–768. [Google Scholar] [CrossRef]
  51. Parisot-Baril, C. Etude De La Stabilite Du Rendement Chez Le Ble Tendre D’hiver (Triticum Aestivum L. THELL.); Université Paris-Sud: Orsay, France, 1992. [Google Scholar]
  52. Yan, W. Analysis and Handling of G × E in a Practical Breeding Program. Crop Sci. 2016, 56, 2106–2118. [Google Scholar] [CrossRef]
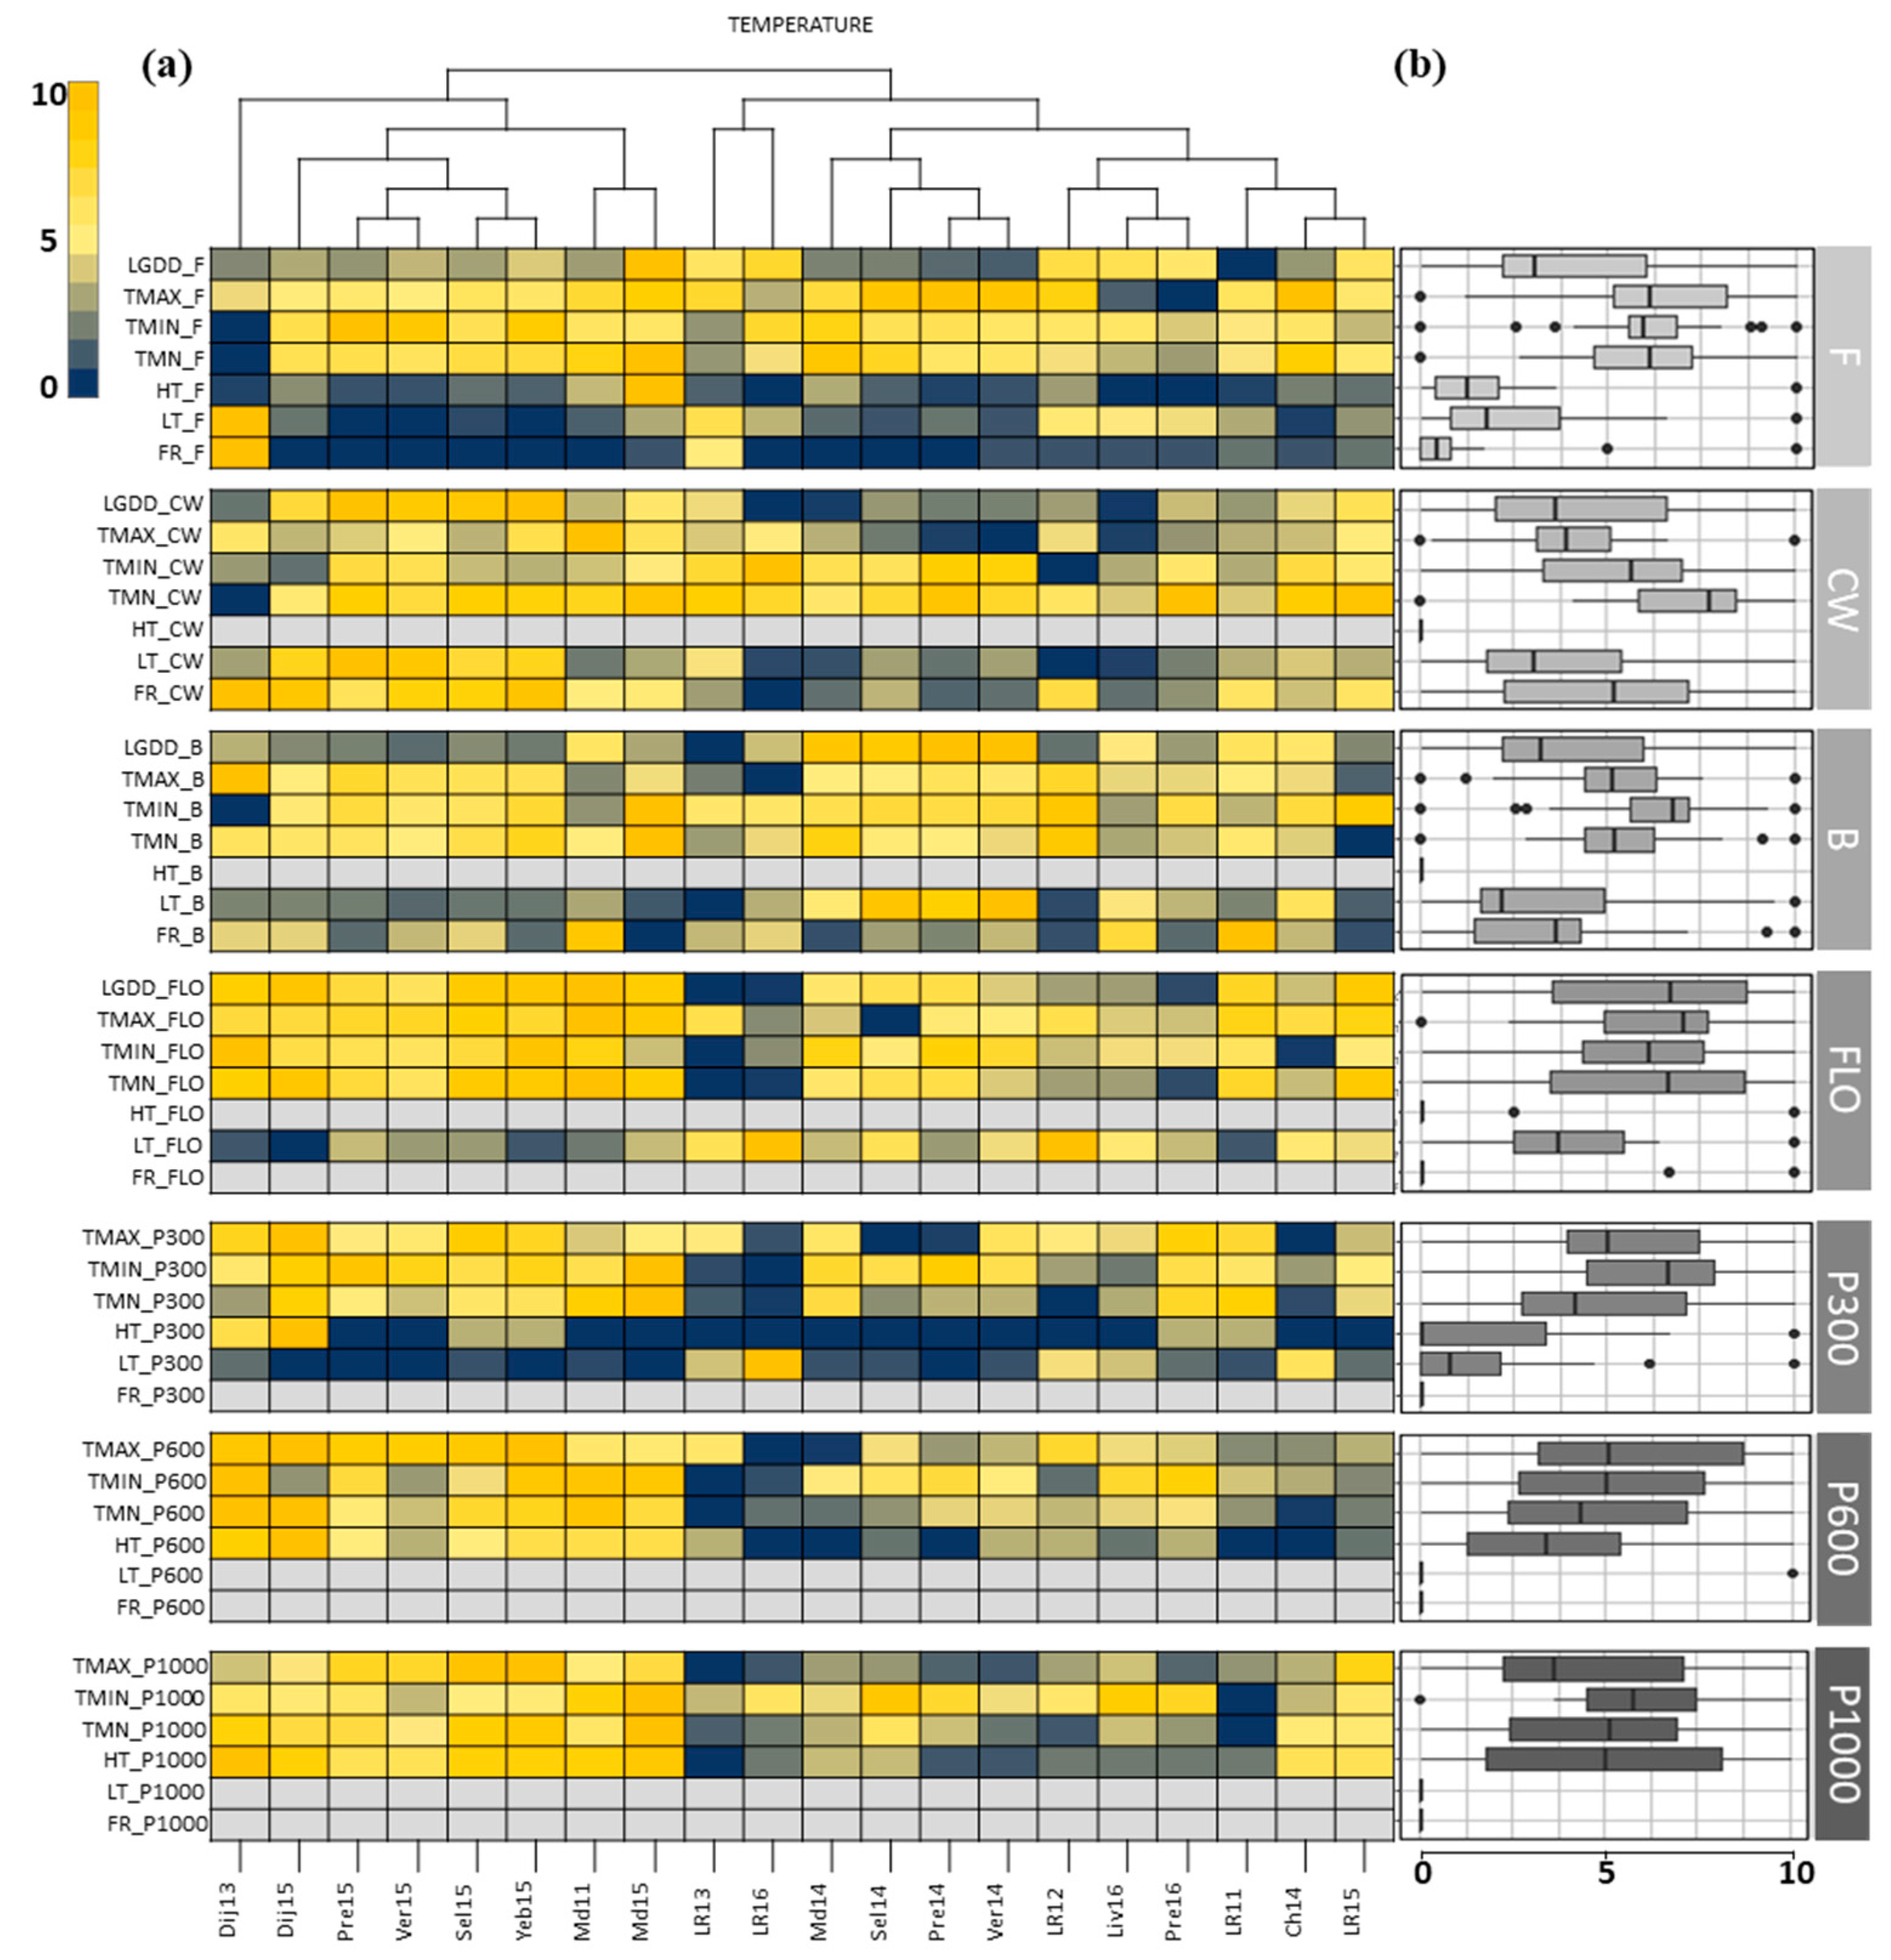
Figure 1. Description of the field network by the pedoclimatic indicators and variations of these indicators within the field network. Heatmaps are presented on the left (a,c,e,g) and boxplots on the right (b,d,f,h) for temperature indicators (a,b); water indicators (c,d); solar indicators, (e,f) or plant indicators (g,h). To run comparisons between environments, each indicator was scaled from 0 (dark blue) to 10 (yellow) on the heatmaps. Non-informative indicators are represented in grey and were removed for further studies. Pedoclimatic indicators are grouped by period as following: Fall (F), climatic winter (CW), Bolting (B), Flowering (FLO), Seed number fixation period (P300), Priority allocation to envelope phase (P600), and priority allocation to seeds phase (P1000). Information about environments is given in Table S1.
Agronomy 09 00798 g001aAgronomy 09 00798 g001bAgronomy 09 00798 g001c
Figure 2. Envirotype definition: (a) dendrogram tree of the 20 environments of the field network based on the PLS regression results. The 11 environments of the DS127 are underlined. (b) Inertia gain for number of groups between 2 to 19. (c) Boxplots showing the distribution of the seed yield (q ha−1) of Aviso and Montego per envirotype.
Agronomy 09 00798 g002
Figure 3. Characterization of the envirotypes using the 10 indicators selected by the PLS regression. The pedoclimatic indicators are written in black and the correlated indicators in blue (positive correlation) or in red (negative correlation). TMN_CW (mean temperature during the climatic winter period), TMAX_FLO (maximal temperature during the flowering period), TMIN_P300 (minimal temperature during the seed number fixation period), TMN_P1000 (mean temperature during the seed filling period), HT_P300 (number of days of high temperature during the seed number fixation period), HT_P600 (number of days of high temperature during the “allocation to the pod” period), VERN_OPT (number of days with an optimal vernalization treatment), WS_P1000 (number of days presenting a water stress during the seed filling period), LSR_FLO (number of days with a lack of solar radiation during the flowering period). The mean network is represented by a black dash line.
Agronomy 09 00798 g003
Figure 4. Ranking of the genotypes: (a) comparison of the top 5 genotypes in each envirotype across the whole network; network mean represented the mean ranking of the genotypes. Genotypes identified as one of the top 5 genotypes in three envirotypes are represented in green (); the one identified in 2 envirotypes out of 5 are represented in blue () and the one identified in a single envirotype are represented in orange (). (b,c,d) Ranking of the top 5 genotypes in green () for envirotype 2, 4, and 5, respectively, in each environment of the corresponding envirotype.
Agronomy 09 00798 g004
Table 1. (a) List of pedoclimatic descriptors: soil data status and descriptors calculated using raw climatic data; (b) List of pedoclimatic descriptors corresponding to stress duration.
(a)
(a)
DescriptorDescriptionCategoryUnit
LGDD*Length of a crop period expressed in growing degree-days. Sum of the daily Tmean for the period (base temperature 0 °C)Temperature°C.d
TMNMean of the daily Tmean recorded over a given crop periodTemperature°C
TMINMinimal temperature over a given crop periodTemperature°C
TMAXMaximal temperature over a given crop periodTemperature°C
WSC_MAX*Maximal water soil content for a given environmentWatermm
WSC_MNMean of the water soil content over a given crop period (in proportion of WSC_MAX)Water%
SSRSum of the daily solar radiation over a given crop periodSolarJ cm−2
QPT*Photothermal quotient of SSR by LGDD (SSR/LGDD)SolarMJ m−2 °C−1
(b)
(b)
DescriptorDescriptionCategory
HTNumber of days with high temperature (Tmax > 25 °C)Temperature
LTNumber of days with low temperature (0 °C < Tmin < 5 °C)Temperature
FRNumber of freezing days (Tmin < 0 °C)Temperature
WSNumber of days when WSC < 1/3 WSC_MAXWater
WDNumber of days when WSC = 0 mmWater
LSRNumber of days with a lack of solar radiation (SR < 900 J cm−2)Solar
VERN_OPT*Number of days with an optimal vernalization treatment (Tmean < 5 °C and day length < 9 h)Plant
Each descriptor can be attributed to all crop periods (descriptor × crop period = indicator) excepted for descriptors with a star (*). The length of a crop period in growing degree days (LGDD) is only calculated for Fall, Climatic Winter, Bolting, and Flowering. The photothermal quotient (QPT) is only calculated for Flowering. Tmin and Tmax represent daily minimal and maximal temperature, respectively, whereas TMIN and TMAX represent minimal and maximal temperature for a given period.
Table 2. The 10 limiting factors identified by partial least squares regression.
Pedoclimatic IndicatorConfidence IndexCorrelated Indicators
VERN_OPT1LT_CW
TMAX_FLO0.95-
HT_P6000.9FR_CW (0.72); TMAX_P600 (0.83); TMN_P600 (0.87); HT_P1000 (0.70)
SSR_P6000.85LSR_P600 (−0.70)
TMN_CW0.85TMIN_B (0.73)
HT_P3000.8TMAX_P300 (0.70)
LSR_FLO0.8SSR_FLO (−0.70)
WS_P10000.75WS_P600 (0.77); WSC_MN_P600 (−0.68); WSC_MN_P1000 (−0.70)
TMIN_P3000.65TMN_FLO (0.70); LT_FLO (−0.68); LGDD_FLO (0.70); TMN_P300 (0.71); LT_P300 (−0.88)
TMN_P10000.6TMN_FLO (0.70); LGDD_FLO (0.70); TMAX_P1000 (0.76); HT_P1000 (0.89); LSR_P1000 (−0.76)
Confidence index corresponds to the percentage of permutations where the indicator was identified by PLS regression. Correlated indicators represent additional indicators that were significantly correlated with the ones identified by the PLS regression. The values given into parentheses represent the Pearson’s correlation coefficient (data given in Table S3).
Table 3. Results and corresponding variance partition of the linear fixed model (3) on DS127 data (127 genotypes trialed in 11 environments of the network).
GEG × EE × RResiduals
Sum Sq7082112513128620606914190
%Sum Sq28.951.111.72.55.8
Pvalue************
Significance of the genotype (G), environment (E), replicate (E × R), and their interaction (G × E) were assessed using model (3). Sum Sq: sum square of the considered effect, %Sum Sq: proportion of the total variation explained for the considered effect, p value: results of the F-test. (***, p < 0.001).
Table 4. Results and corresponding variance partition on the linear fixed model (4) on DS127 data.
GCC × EG × CG × C × EC × E × RResiduals
Sum Sq70821113195119361219516425606914190
%Sum Sq28.946.24.95.06.72.55.8
Pvalue******************
Significance of the genotype (G), environment (E), envirotype (C), replicate (C × E × R) and their interactions (C × E, G × C, G × C × E) were assessed using model (4). Sum Sq: sum square of the considered effect, %Sum Sq: proportion of the total variation explained for the considered effect, p value: results of the F-test. (***, p < 0.001).