Article

Soil Amendment with Biochar Affects Water Drainage and Nutrient Losses by Leaching: Experimental Evidence under Field-Grown Conditions

by
Angela Libutti
,
Anna Rita Bernadette Cammerino
,
Matteo Francavilla
and
Massimo Monteleone
*
Department of Science of Agriculture, Food and Environment, University of Foggia, 71122 Foggia, Italy
*
Author to whom correspondence should be addressed.
Agronomy 2019, 9(11), 758; https://doi.org/10.3390/agronomy9110758
Submission received: 27 September 2019 / Revised: 9 November 2019 / Accepted: 12 November 2019 / Published: 15 November 2019

Abstract

:
Leaching of soluble elements from cultivated soils is a major concern to meet the target of agricultural sustainability in most areas. The effect of biochar application to a cultivated soil on water drainage and the consequent solute losses was assessed during a trial carried out over two consecutive growing seasons. Biochar was added to a loam-texture soil, at 0, 1, and 2% d.w. rates. A lysimeter-like set-up arranged in the experimental field-unit, allowed collecting the percolating water. Two multiple linear regressions (ANCOVA models) were applied to detect biochar effect on: (1) The seasonal amount of drained water; and (2) the concentration of solutes in the drained water. The statistical comparison among a set of slope coefficients as affected by treatments (growing season and biochar) was used as modelling approach. The lower biochar application rate (1%) significantly reduced both the amount of drained water and its concentration in solutes. Conversely, the higher biochar application rate (2%) showed no significant effects. Nitrate and chloride showed a significant interaction with biochar application rates. Higher biochar application increased nitrate leaching while reduced that of chloride. Biochar application within a rate no more than 1% resulted in a useful and quite effective technical operation.

1. Introduction

Among several other issues, farm management should cope with the effects of minerals dissolved in the soil water solution. The availability of these minerals as solutes provides nutrients to crops (a positive condition), although water drainage can induce solute losses (a negative condition) thus hiding the previous function. Conversely, an increase in the solute’s concentration may lead to the build-up of soil salinity (a negative condition) that requires salt leaching to remove excessive solutes from the cultivated soil profile (this time a positive condition).
Irrigation and fertilization are farming techniques that directly modify the status of the circulating soil solution. Indeed, the risk of solute losses by water drainage may further rise under intensive agricultural conditions, i.e., when larger amounts of irrigation water and mineral fertilizers are applied to increase crop yields [1]. Leaching losses are also affected by pedoclimatic conditions such as soil water retention capacity, soil hydraulic conductivity, rainfalls, and crop transpiration rate [2].
Proper farming management has the goal to increase the efficient use of plant nutrients, thus favoring plant uptake, reducing nutrient losses by drainage while balancing the salt build-up through leaching.
Plant nutrient losses also increases farmers’ costs in fertilizers and greatly contributes to the pollution of both surface and groundwater from non-point sources [3]. In this respect, nitrogen and phosphorus are the two macronutrients mostly threatening water quality, causing environmental damages such as eutrophication of water bodies [4]. Moreover, nitrogen is the major concern for drinking water quality and human health because of the associated risk of methemoglobinemia or “blue-baby” syndrome in infants and gastrointestinal cancer in adults [5].
Biochar can exert a significant influence on the leaching of soluble elements from the soil [6,7]. Biochar is a carbon-rich, solid by-product obtained from agricultural and forestry biomasses pyrolysis [8,9,10,11]. As soil amendment, biochar provides a potential soil carbon sequestration to mitigate global climate change [12]. Beneficial aspects of improved physical, chemical and microbiological soil properties have also been reported when biochar is added to agricultural soil [13]. These properties are mainly due to biochar highly porous structure and large surface area, greater negative surface charge and charge density [14,15]. Biochar improves soil structure and porosity, increases soil water retention and water availability to plants [16], reduces soil bulk density, and influences soil water infiltration and the saturated hydraulic conductivity [17].
Several experimental evidences showed that biochar can retain cations better than other forms of soil organic matter [13]. Other studies indicated the ability of biochar to retain anions although the underlying mechanisms are not always clear. A number of experiments [18,19,20,21,22,23,24] showed that biochar is an effective option in mitigating nitrate leaching. Agegnehu et al. [25] founded that biochar reduced leaching of, P, NO3-N, NH4+-N, K, Ca, Mg, and Na. Conversely, other authors reported a high level of leached P and K [26], an increased K and Na concentration in the column leachate [27], a significant increase in the soil solution concentration of N, Ca, Mg, and K [28], after soil amendment with biochar.
Nutrient retention or release following biochar addition to soil were rarely evaluated at the field-grown scale and are still poorly documented in the literature. The large majority of the experiments, indeed, were conducted on leaching soil columns or pots and under strictly controlled lab conditions.
Here we report an experimental study carried out under field conditions, considering a very representative soil area, during two consecutive crop cycles. A lysimeter-like installation allowed the recovery of the water drained from the 0.70 m soil profile and collected at the bottom of a large trench dug in the soil. Therefore, a quantitative evaluation of the concentration of the major anions and cations dissolved in the drained water was performed.
The aim of the experimental trial was to assess whether biochar application to soil under conditions of intensive crop cultivation can affect the losses of soluble elements from the soil profile.

2. Materials and Methods

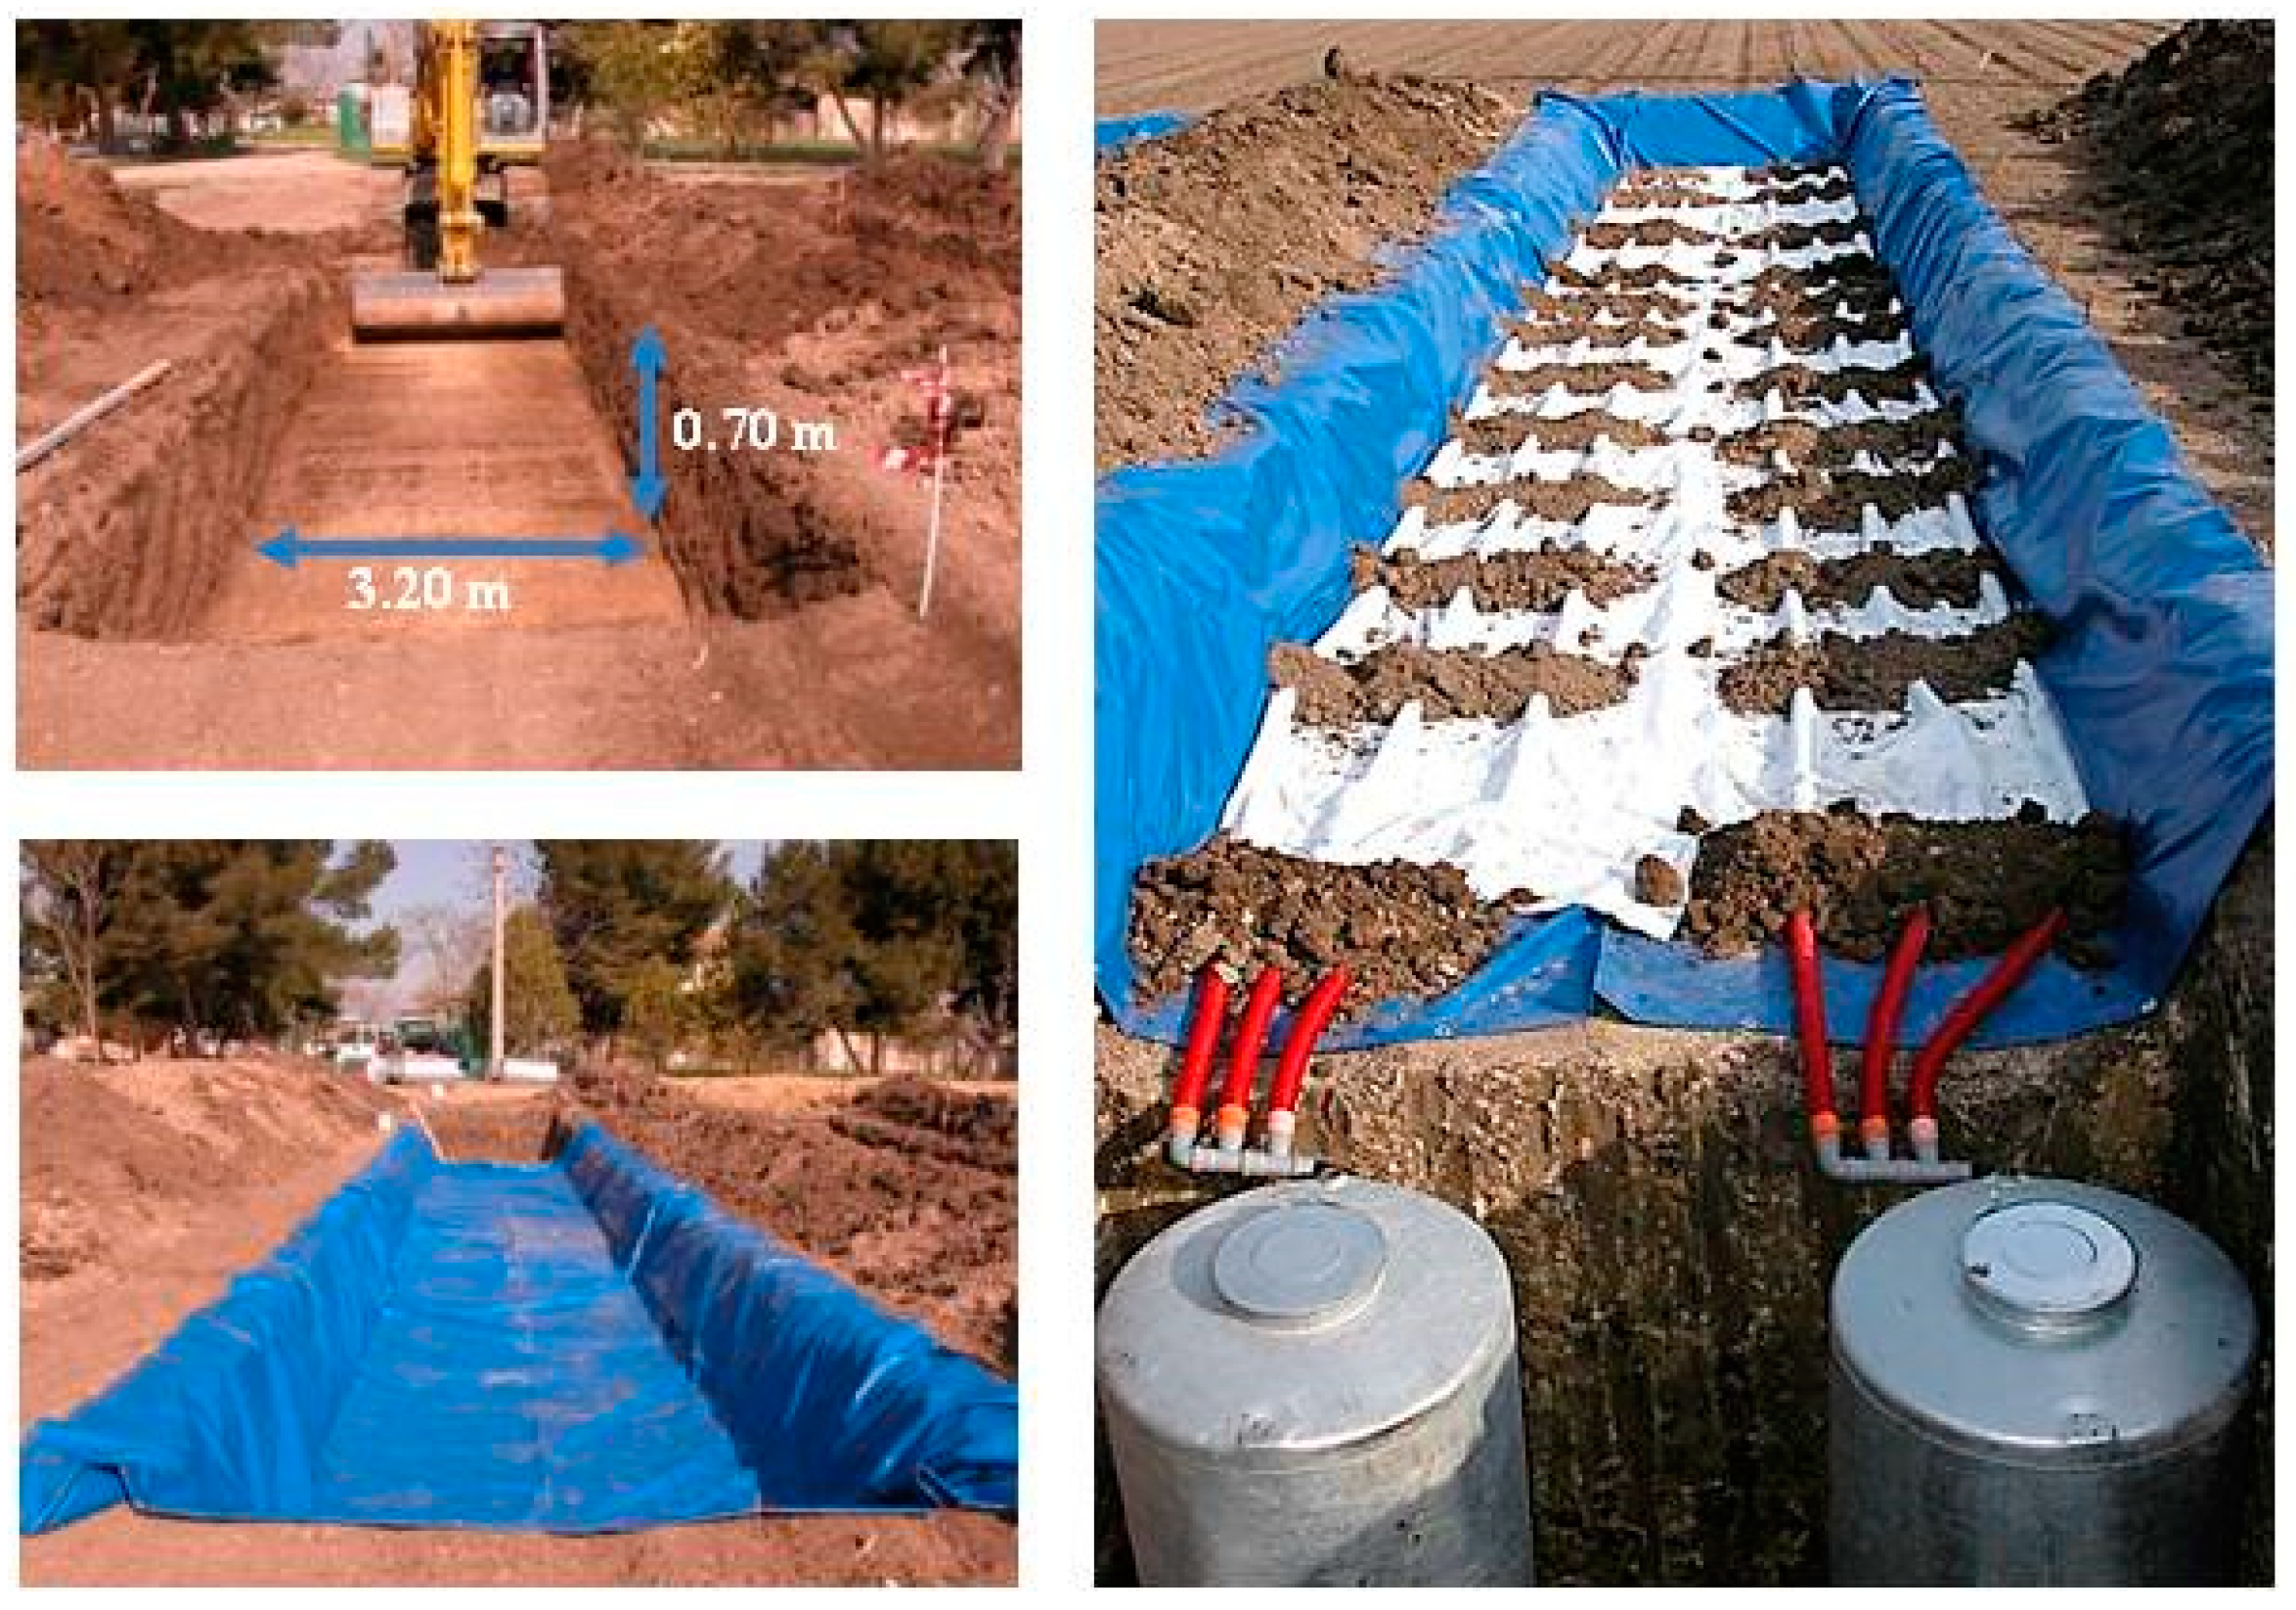
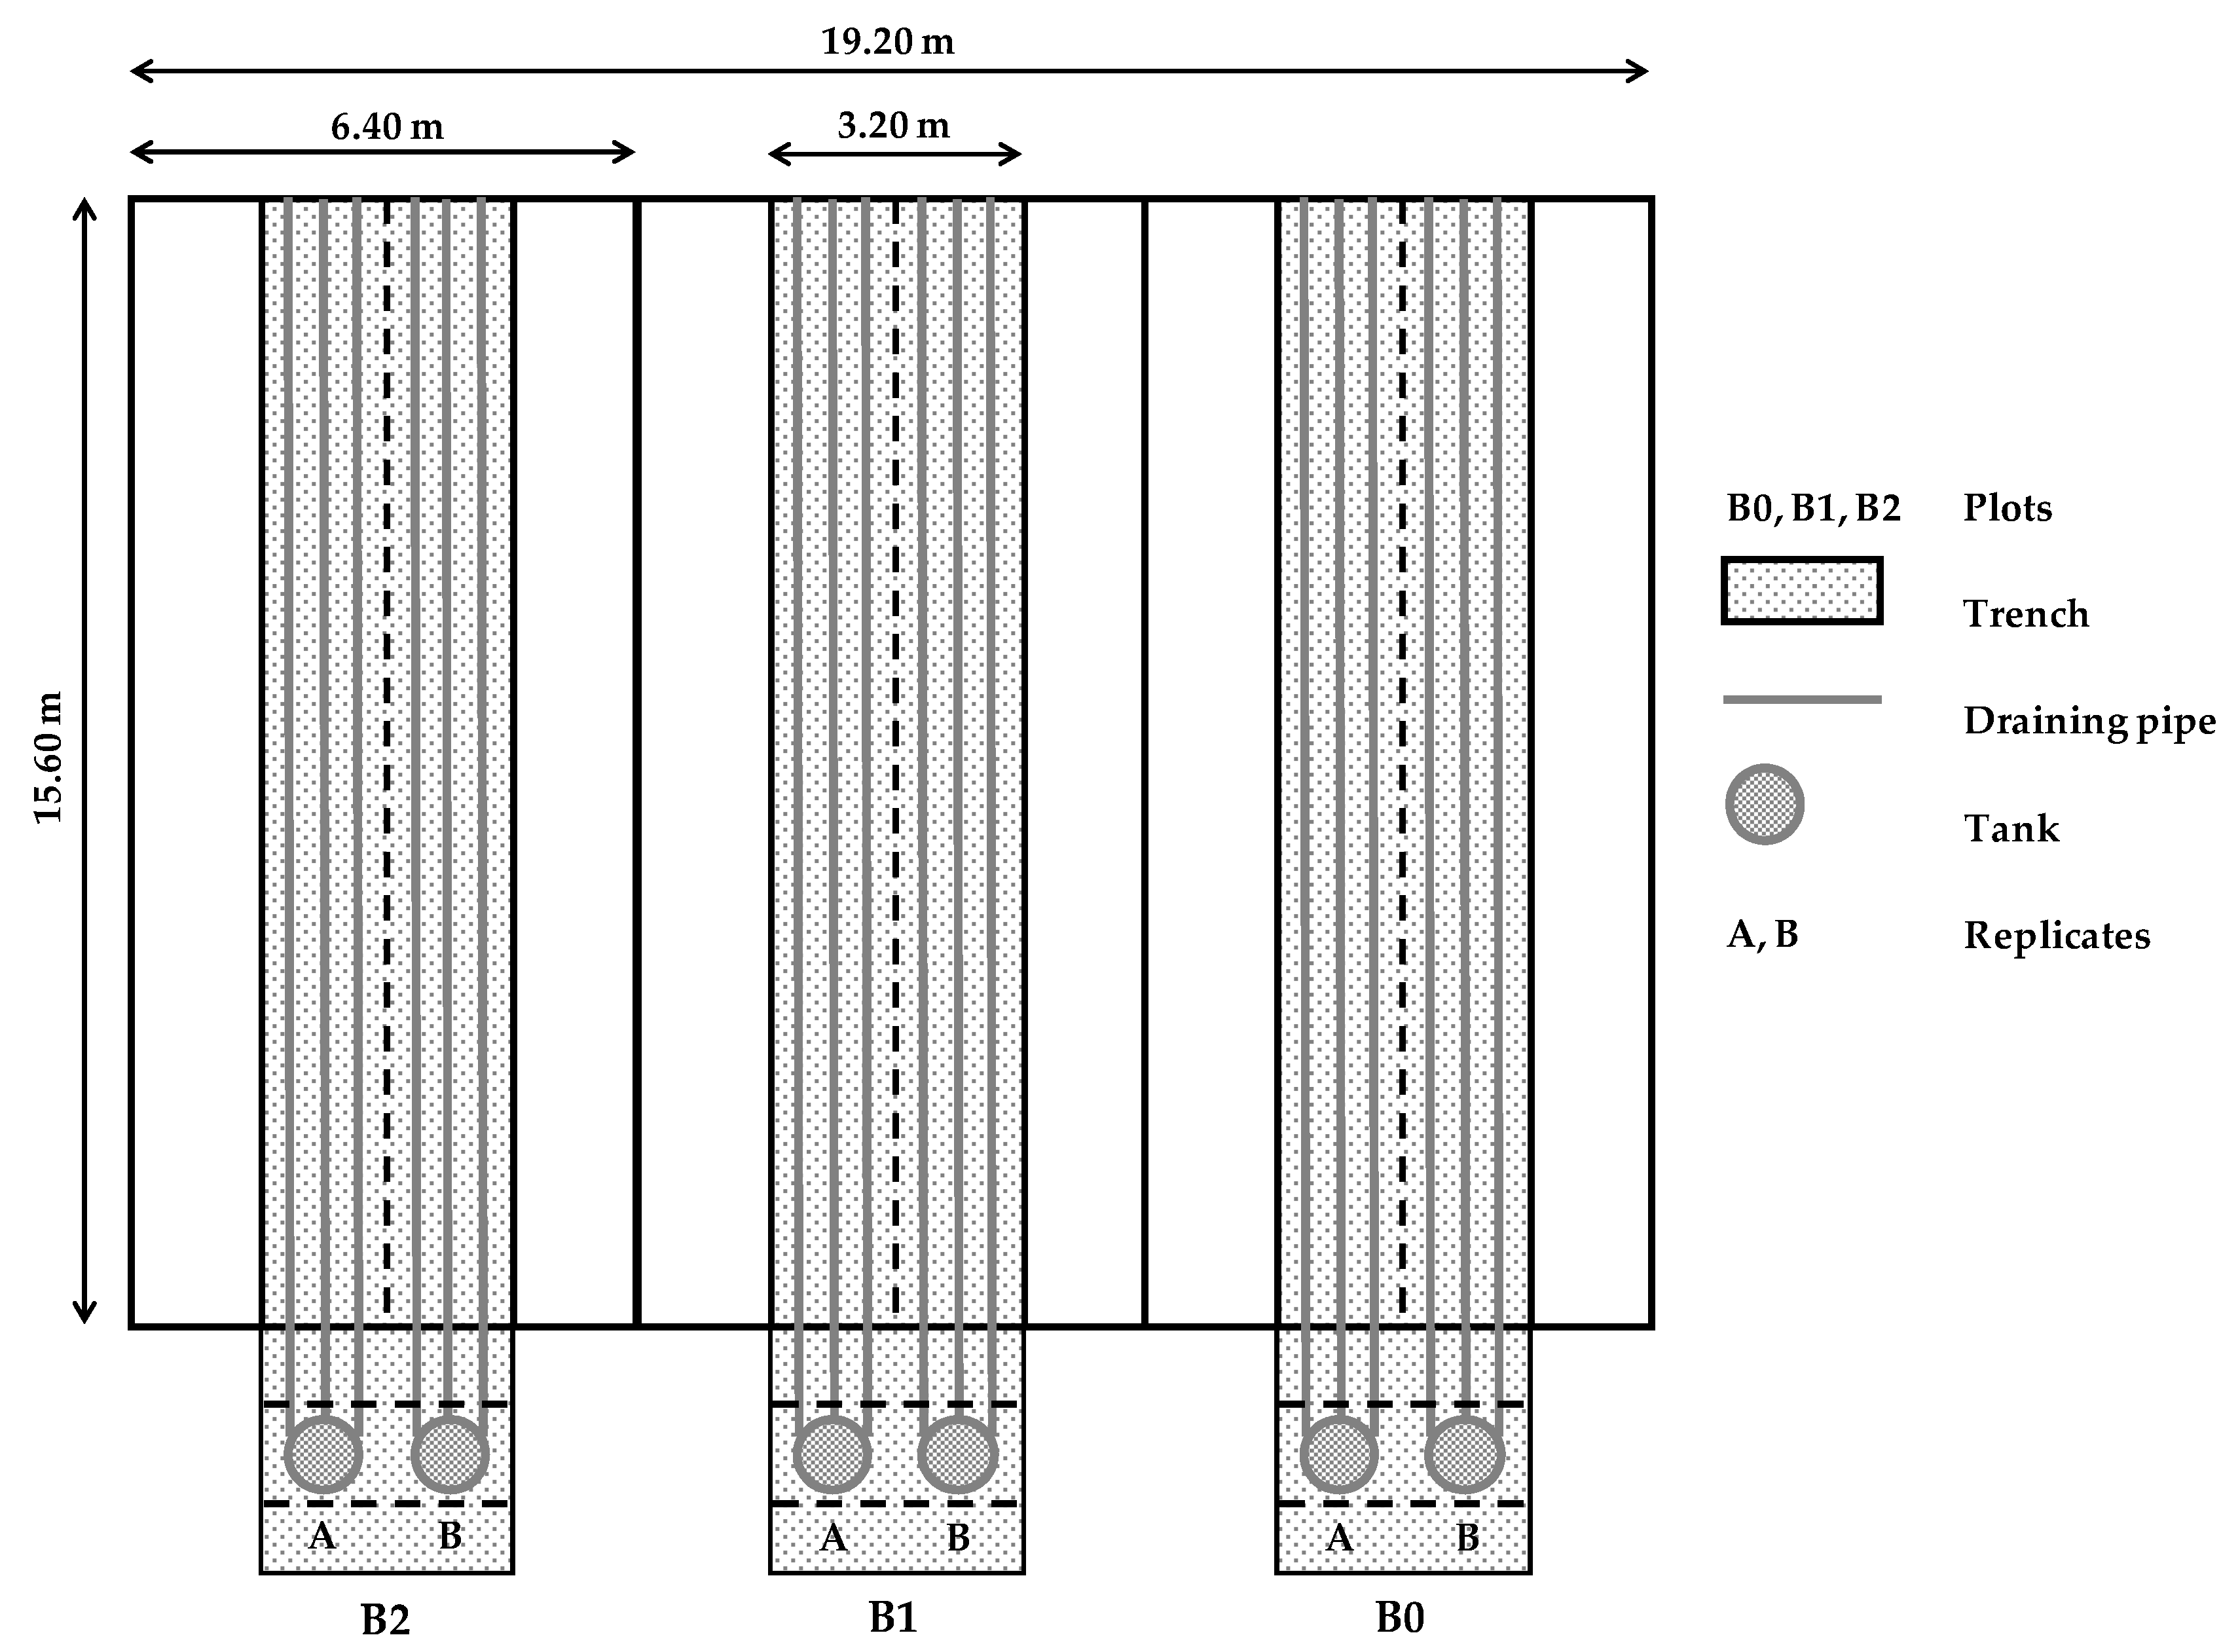
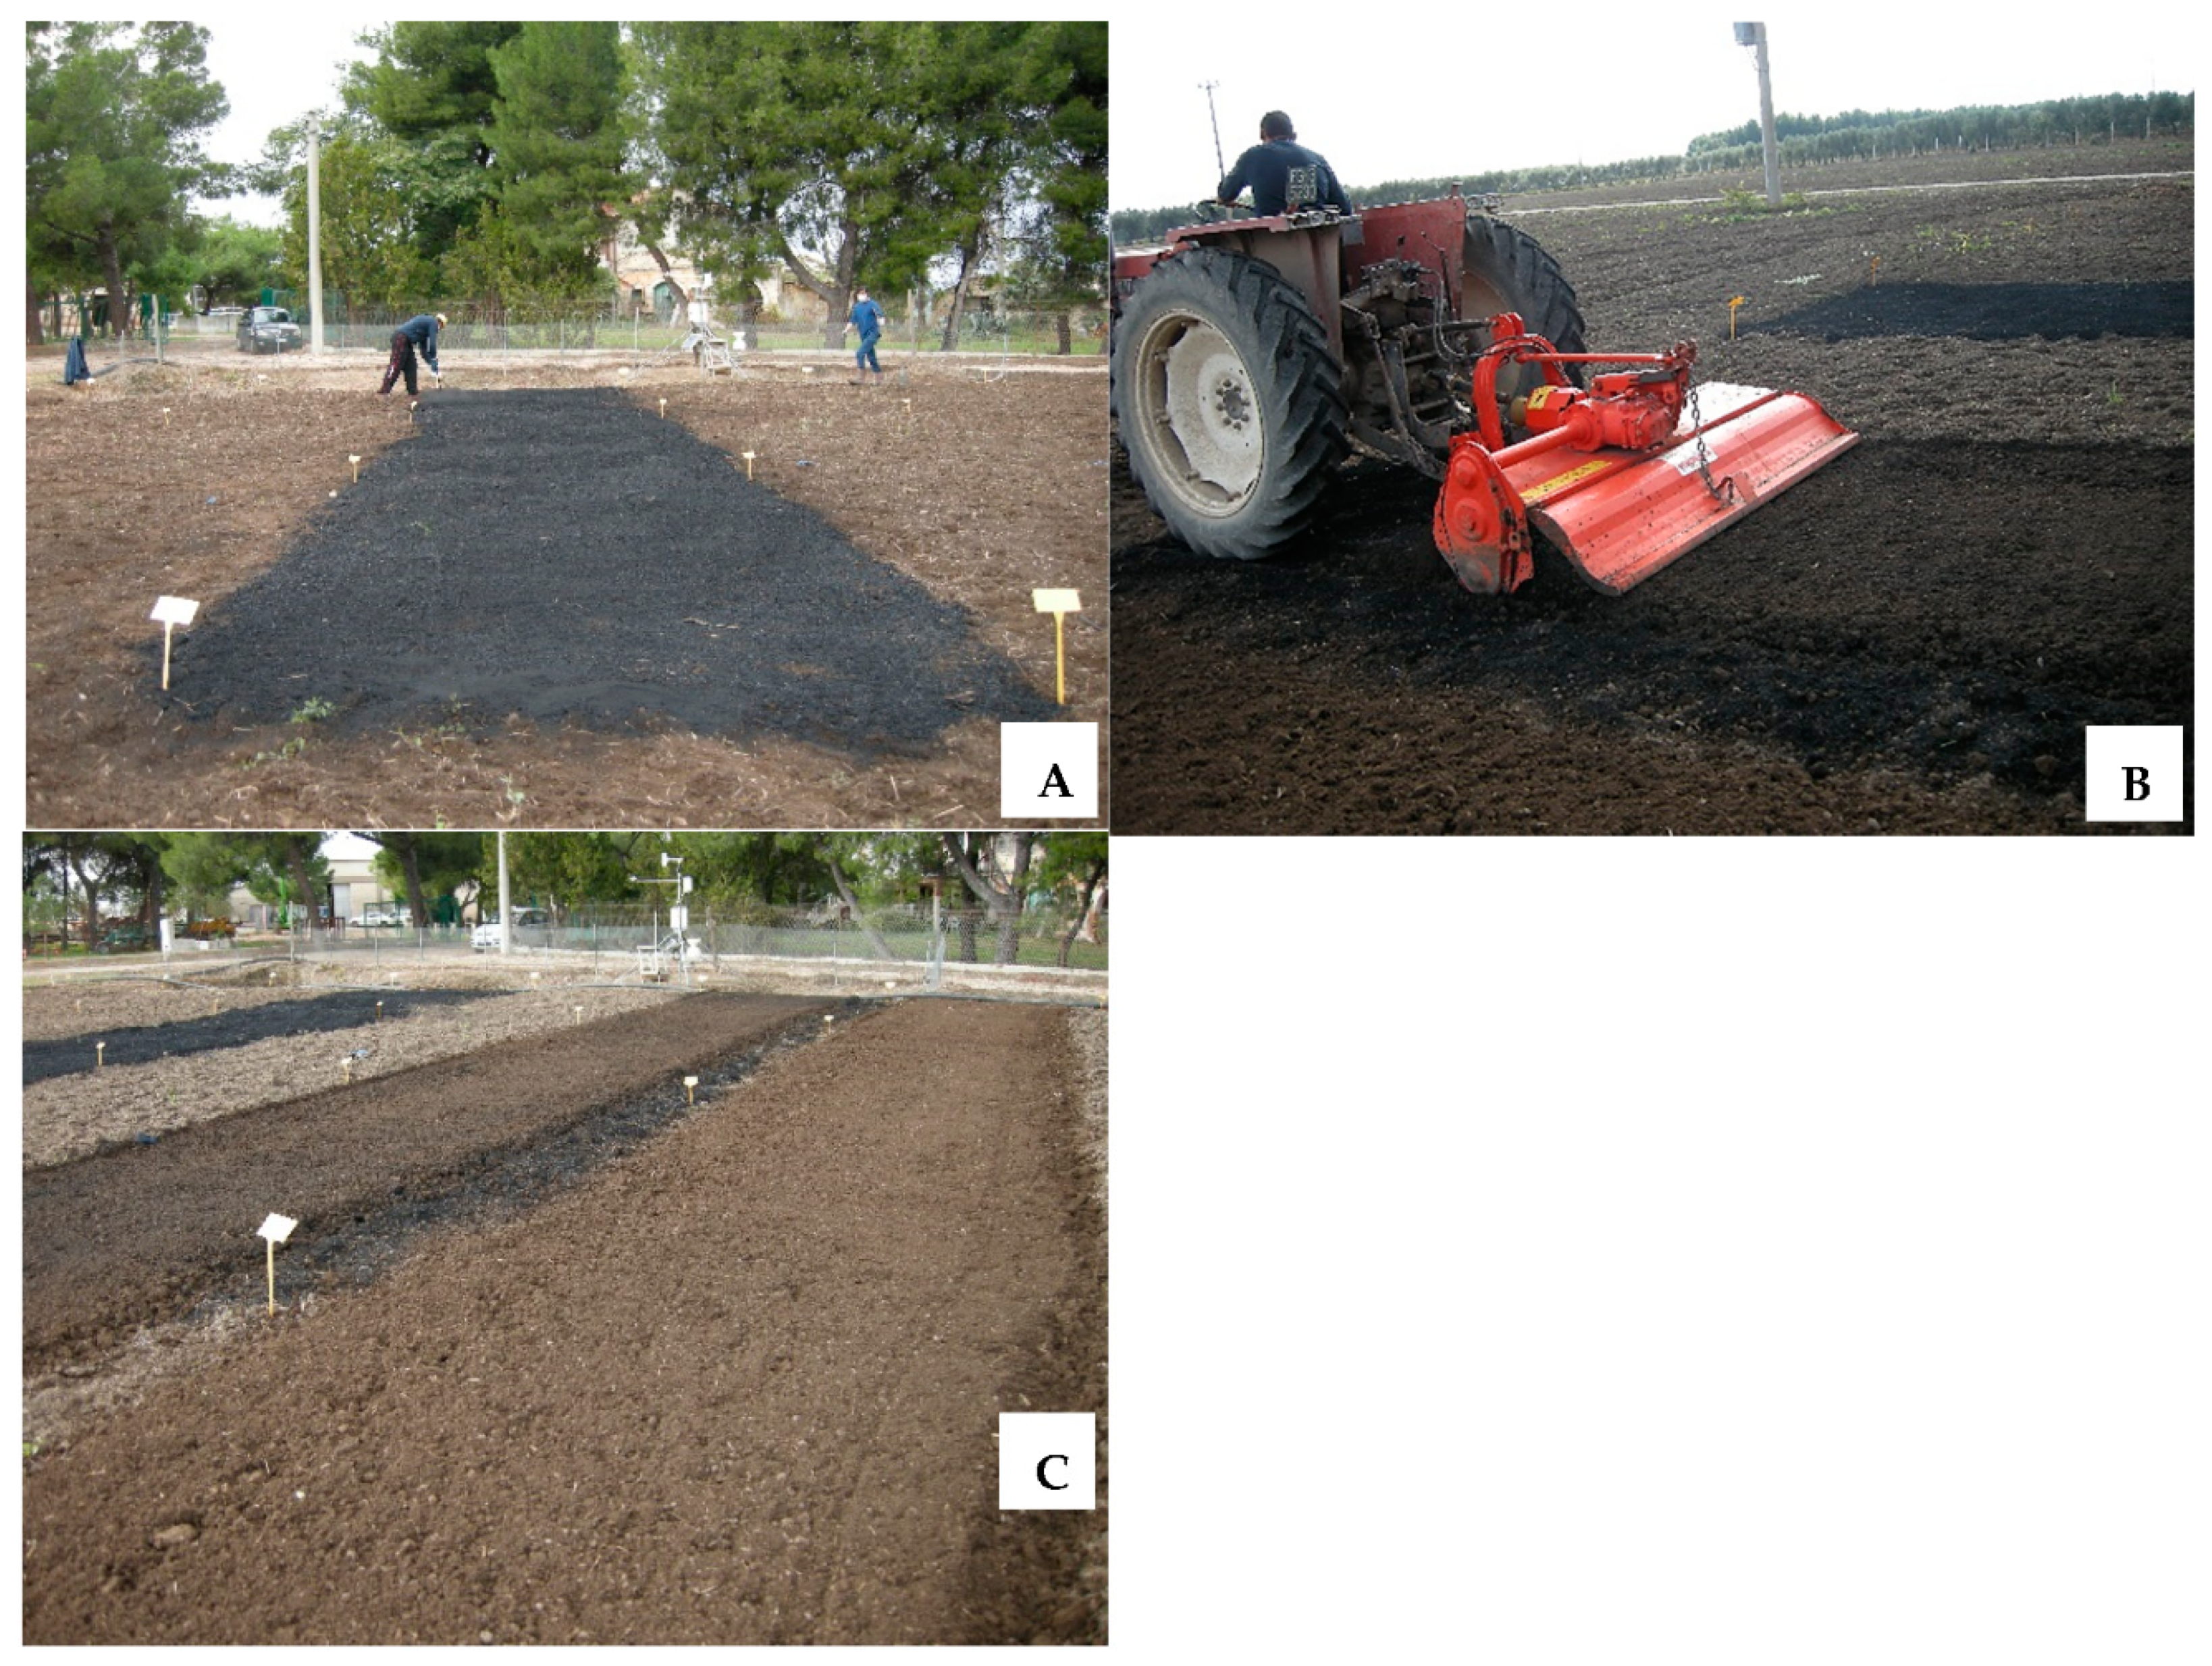
2.1. Study Area and Experimental Set-Up

The study was carried out under field-grown conditions, from October 2014 to July 2015, in the north-eastern part of the Apulia Region (Southern Italy), at San Giovanni Rotondo (Foggia district). The experimental field (41°34′ N, 15°43′ E; altitude, 15 m a.s.l.) was located in a cereal-horticultural farm placed 15 km apart from the coast of Manfredonia Gulf (Adriatic Sea) where farming operations routinely fulfil a double crop per year.
The experiment was carried out over two consecutive growing cycles: Intercropped lettuce (Lactuca sativa, L.) and radicchio (Cichorium intybus, L.) across the first (fall–winter) growing season (GS1), followed by zucchini (Cucurbita pepo L.) in the second (spring–summer) growing season (GS2).
The study area is characterized by a Mediterranean climate, with minimum air temperatures hardly dropping below 0 °C in winter, and maximum temperature frequently exceeding 40 °C in summer. The long-term annual mean rainfall is 360 mm, with precipitations mainly occurring in the period from September to March [1]. During the trial period, solar radiation, air temperature, air relative humidity, wind speed and precipitation were detected daily by a weather station placed close to the experimental field equipped with a data-logger (Campbell Scientific, Logan, UT, USA).
The experiment took place on a loam-texture soil (United States Department of Agriculture - USDA classification). According to the FAO (Foof and Agriculture Organization of the United Nations) international standard taxonomic soil classification system “World Reference Base for Soil Resources”, the soil belongs to the “haplic calcisol” reference group, corresponding to a typical calcixerept in the USDA soil taxonomy.
The trials were carried out using a specifically designed experimental set-up (Figure 1). At the center of each of three adjacent and identical field-plots (having an area of approximately 100 m2) a basin was dug (0.70 m depth), thus forming a hydraulically insulated drainage system collecting the deep percolating water. Water losses along the 0.70 m soil profile were due to heavy precipitations exceeding the soil water holding capacity or unpredicted rains soon after irrigation. This water was collected by perforated drainage pipes placed along the bottom of each basin and connected to tanks positioned underground at the head of each field-plot. For a detailed description of the experimental device please read Appendix A. The use of this experimental set-up allowed the recovering of all the drained water volumes progressively percolated throughout the entire study period. Consequently, chemical analyses were performed on samples taken from these water volumes.
This experimental device was prepared some years before (in 2006) and it was formerly used in performing two previous experiments focused on the leaching of salts and nitrate, respectively [1,29].

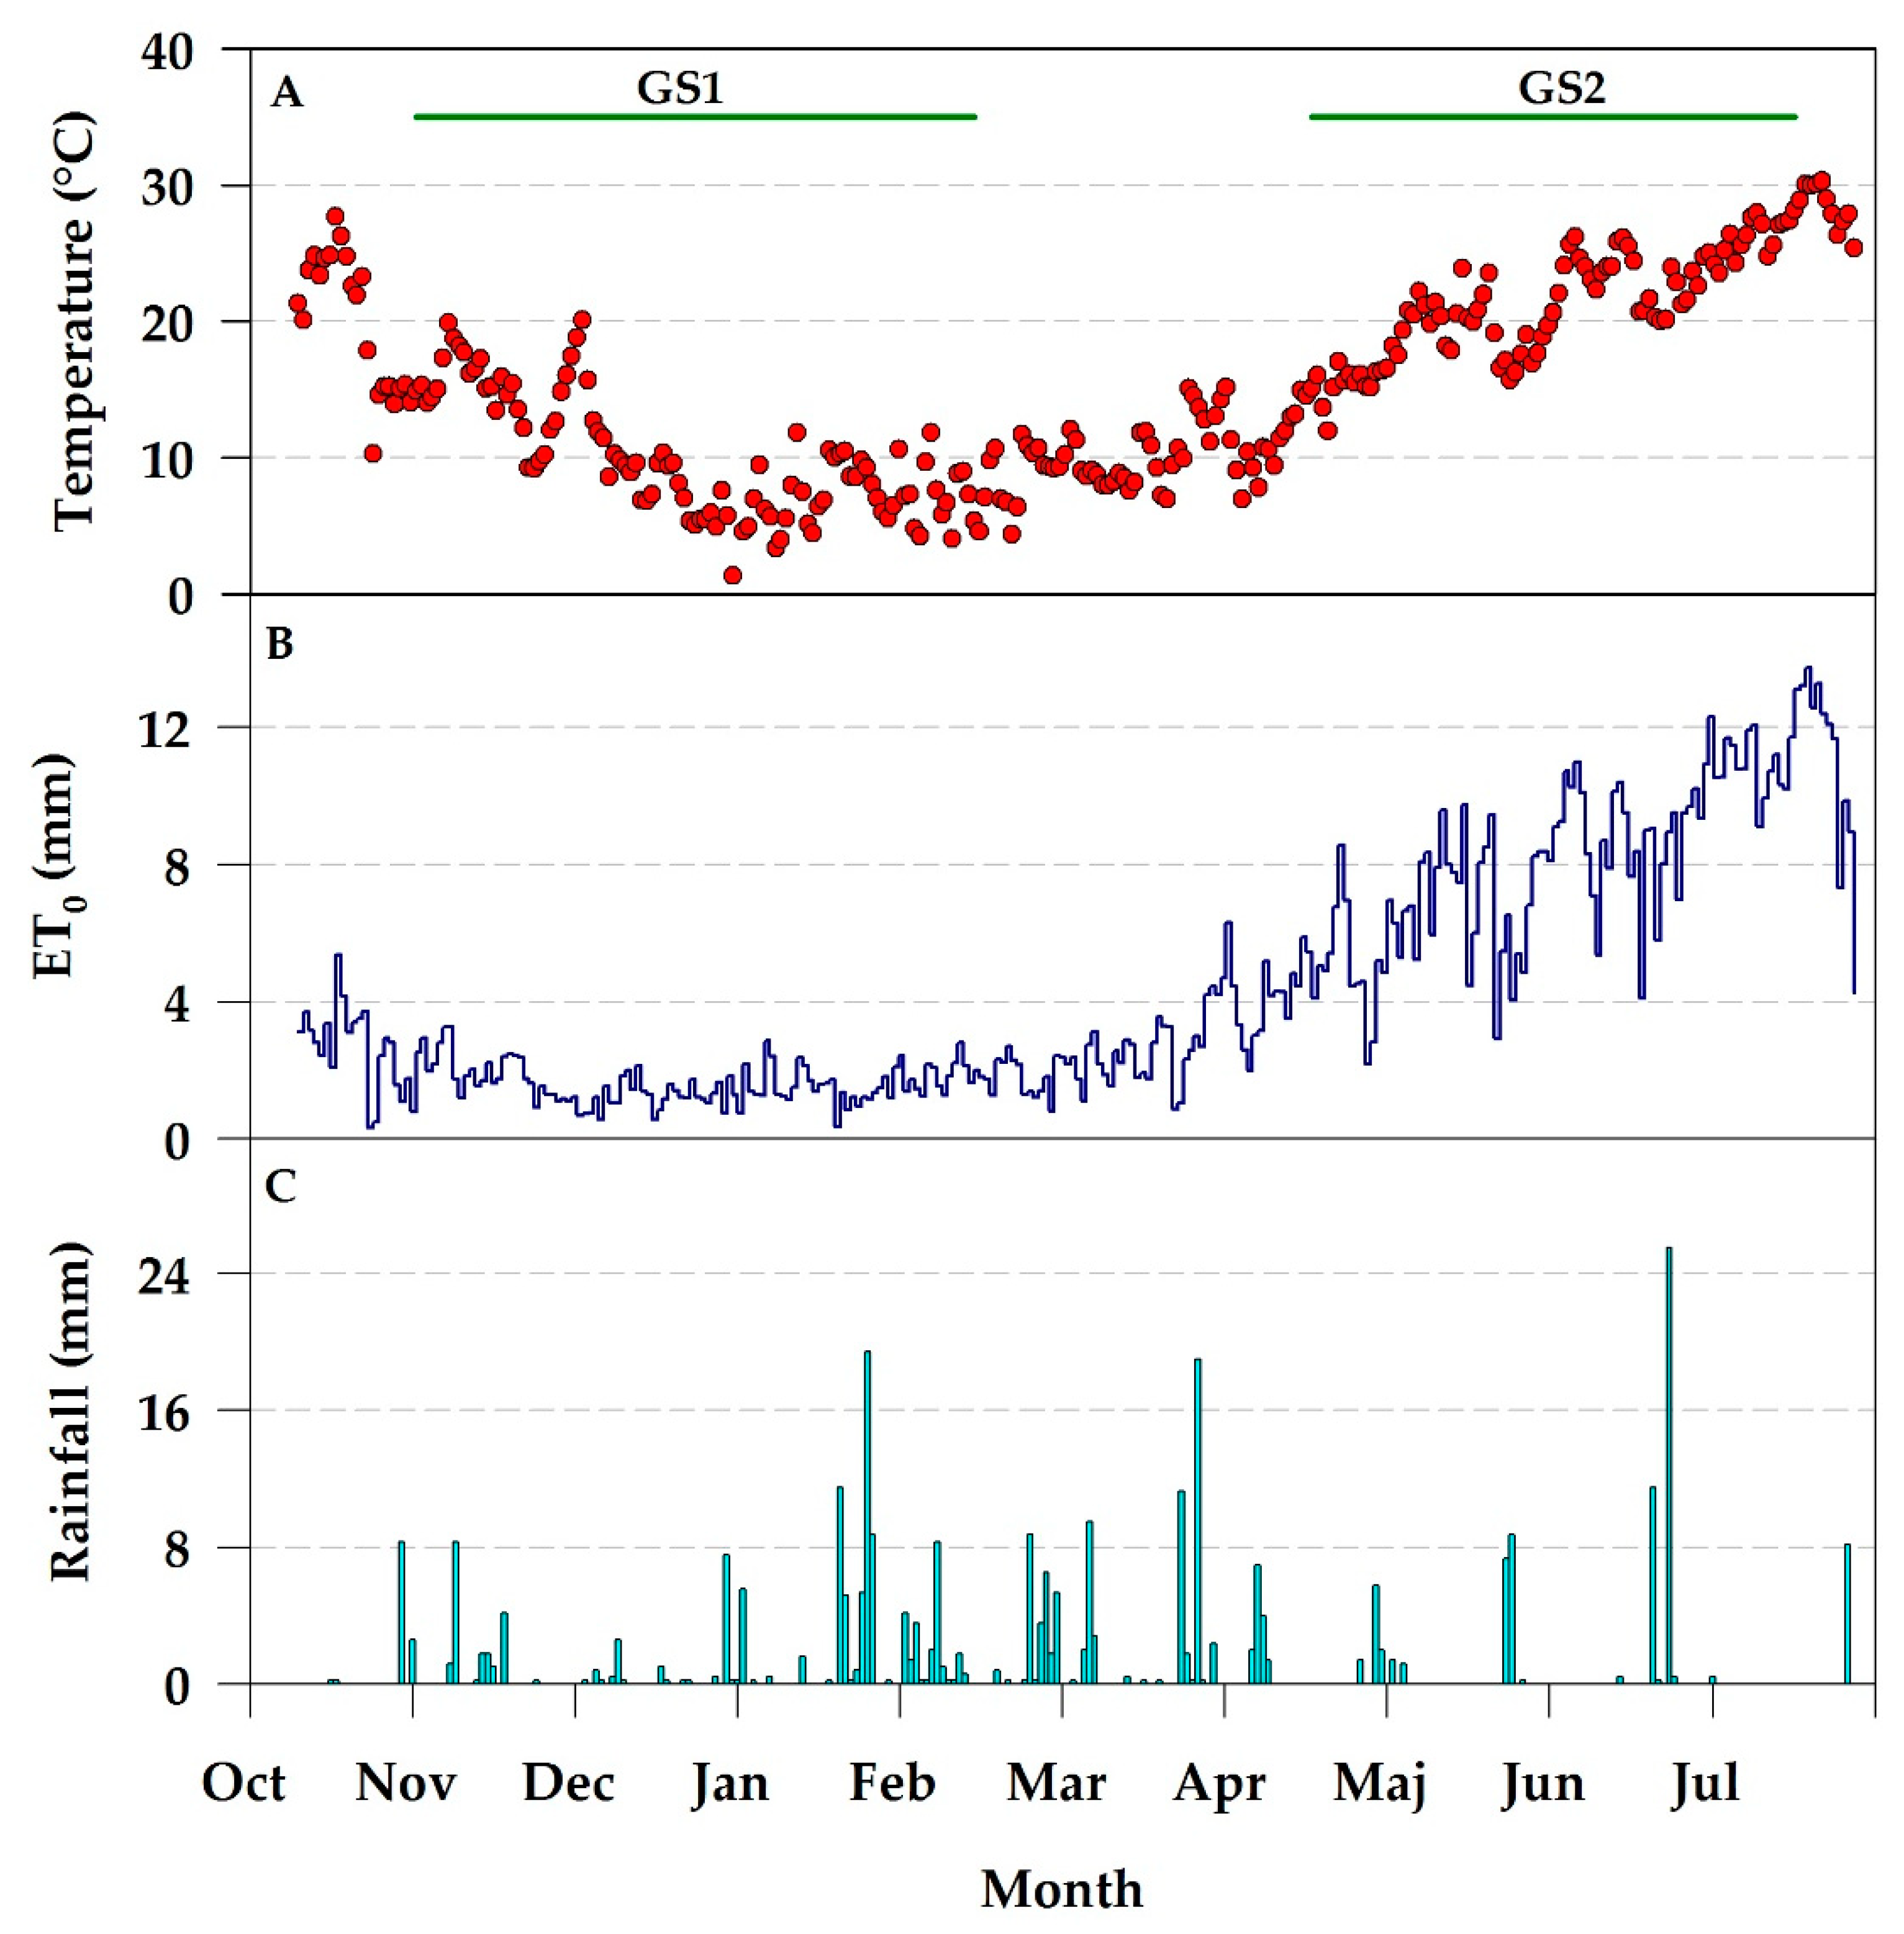
2.2. Crop Rotation and Agronomic Conditions

Lettuce (Lactuca sativa, L.), cultivar “Canasta scura”, and radicchio (Cichorium intybus, L.), cultivar “Tondo Rosso”, were transplanted on 31 October 2014. Zucchini (Cucurbita pepo, L.), cultivar “President”, was transplanted on 17 April 2015. The seedlings were placed in double rows (40 cm apart) spaced at 160 cm, at a distance of 30 cm along each single row, reaching a final density of 4.2 plants m−2.
Lettuce and radicchio production were hand harvested at full maturity on 13 February 2015 (105 days from transplanting). Similarly, zucchini were progressively harvested by hand when full maturity was reached, from 25 May until 15 July (starting 99 days after transplanting).
Irrigation scheduling was performed according to the evapotranspiration criterion, with watering carried out every time the 50% of the available soil moisture was depleted. The reference evapotranspiration (ET0) was calculated daily according to the FAO Penman–Monteith equation [30]. For each considered crop, the maximum crop evapotranspiration (ETC) was estimated daily according to the classical ‘two-step’ procedure, i.e., by multiplying ET0 by the crop coefficients as proposed by the FAO Irrigation and Drainage Paper N. 56 [30]. Each watering restored the full ETC losses, with the soil water content taken back to field capacity. A drip irrigation method was applied for the three crops (a single drip line placed between each couple of plant rows and emitters at 0.4 m apart along the lines). Water was withdrawn from a phreatic well located near the experimental field. This water was chemically analyzed and results are reported in the Appendix E and the corresponding Table A3. The irrigation water resulted saline, with an electrical conductivity (EC) that ranged from 4.7 to 5.8 dS m−1 during the crop irrigation period, and a mean pH of 7.7. Saline groundwater represents the irrigation source normally used in the farm where the study was carried out. Considering the experimental area (Apulian Tavoliere plain—Southern Italy), crop irrigation with saline water is often a standard practice due to the shortage of good quality water [29,31,32].
Cropping operations, including fertilization, weed and pest control, followed the options usually applied by farmers in the study area and were carried out according to the usual local farming practices. As to fertilization, 120 kg ha−1 N, 60 kg ha−1 P2O5 and 150 kg ha−1 K2O were applied to the soil for lettuce and radicchio; 180 kg ha−1 N, 100 kg ha−1 P2O5 and 200 kg ha−1 K2O for zucchini. More specifically, pre-transplanting fertilization was applied in GS1 by distributing nitrogen as nitrate (16 kg ha−1) and ammonium (24 kg ha−1) followed by two fertigations throughout the growing season applying nitrogen as nitrate (22.4 kg ha−1), ammonium (15.6 kg ha−1) and urea (42 kg ha−1). Pre-transplanting fertilization was also applied in GS2 by distributing nitrogen as ammonium (20 kg ha−1) followed by four fertigations throughout the growing season applying nitrogen as nitrate (44.8 kg ha−1), ammonium (31.2 kg ha−1), and urea (84 kg ha−1).

2.3. Experimental Treatments and Physico-Chemical Analyses on Biochar, Soil, and Water Samples

The layout of the experimental field is reported in Figure 2. It is made of three adjacent plots (where the biochar treatments were assigned), having an area of 100 m2 each, a trench of 50 m2 at the center of each plot, two groups of draining pipes per trench (A and B), and three drains per group connected to tanks placed underground.
The experimental design included three biochar application rates to soil, corresponding to 0, 1, and 2% of the dry soil weight (i.e., B0 or control, B1 and B2, respectively). Biochar applications within the 0.20 m soil depth were 26 and 52 mg ha−1, for B1 and B2 respectively (considering the soil bulk density equal to 1.3 mg m−3). Each of the three experimental plots (B0, B1, and B2) was considered as split into two identical sampling areas (replicates), A and B, respectively (Figure 2).
The biochar used in the experiment was obtained through pyrogasification of fir woodchips at 1200 °C in a 200 kWe power gasifier unit. Biochar was analyzed for a set of physico-chemical properties reported in the Appendix B and the corresponding Table A1. Biochar is currently included in the list of soil amendments allowed in the Italian agriculture (Italian Official Journal—General Series No 186, 12 August 2015). According to the technical specifications published by the Italian Ministry of Agriculture, the biochar used in our experiments was rated into the first quality class (Corg > 60%; salinity ≤ 1000 mS m−1; ash < 10%). Other prescribed specifications (pH = 4–12 and H/Corg ≤ 0.7) were fully complied. Moreover, the values of H/Corg (0.25) and O/Corg (0.10) showed that biochar quality was not only suitable as soil amendment, but also characterized by a high C stability [33].
Biochar application to the fields followed the operations reported in the Appendix C and the corresponding Figure A1.
Soil physico-chemical characterization was performed before the starting of the trial. Further details on soil analysis and soil properties are reported in the Appendix D and the corresponding Table A2. Moreover, considering that biochar applied to the soil showed a high pH value (see Appendix B, Table A1) and saline groundwater was used for crop irrigation, pH and electrical conductivity (EC) of the soil were carefully monitored along the two considered growing seasons. Soil samples were taken from the upper 0.30 m soil layer in each sub-plot (replicate) before each crop transplanting date and at monthly intervals during each crop cycle; pH and EC were therefore measured on 1:2.5 (w/v) aqueous soil extracts and saturated soil paste extracts respectively.
Drained water was also sampled throughout each cropping cycle, whenever drainage occurred, in triplicates from every tank. Water samples were collected in sterile 50-mL polyethylene containers and transported to the laboratory in refrigerated bags. They were kept in a refrigerator at +4 °C, and analyzed within 24 h from the time of collection. The measured parameters were anions and cations concentration (mg L−1). Both the major anions (Cl, NO3, SO42−, and PO43−) and cations (NH4+, Na+, K+, Ca2+, and Mg2+) were determined by ion chromatography (Dionex ICS 1100, Dionex Corporation, Sunnyvale, CA, USA).

2.4. Statistical Analysis

The loss of solutes is the consequence of two concomitant processes: (1) water drainage through deep percolation and (2) mineral nutrients solubilization in the percolating water. The higher the effect of biochar on both soil water retention and ion adsorption, the lower will be the consequent loss of solutes. The assumption regarding the leaching of major anions and cations is that the losses of these solutes from the soil profile (SOUT; kg ha−1) should be the consequence of both the volumes of water drained (WOUT; m3 ha−1) and the concentration of the corresponding solutes in the drainage water. WOUT (m3 ha−1), in turn, depends on the amount of water supply WIN (m3 ha−1), measured as the sum of both precipitation (WP) and irrigation (WI), according to the following “drainage model”:
WOUT = γ × WIN
where γ (-) is the drainage coefficient affected by the soil hydraulic properties (with or without biochar), on condition that: γ ≤ 1.
On the other hand, SOUT (kg ha−1) depends on the amount of drained water (WOUT) according to the following “leaching model”:
SOUT = ε × WOUT
where ε (kg m−3) is the leaching coefficient, i.e., the solute concentration in the drainage water, affected by the initial ion concentration in the soil, ion solubility, and soil physico-chemical retention properties (with or without biochar).
By merging Equation (1) with (2), respectively, the following Equation (3) is obtained:
SOUT = ε × γ × WIN
Therefore, the considered experimental data processed in the statistical analyses were: The cumulated volumes of water inflow (WIN) and outflow (WOUT) with respect to the upper 0.70 m soil profile, together with the cumulative amounts of each anion and cation leached away from the same soil profile (SOUT), throughout GS1 and GS2, respectively.
Cumulated outflow data (WOUT) was linearly regressed as a function of the seasonal water supply (WIN), while cumulated solute losses (SOUT) was linearly regressed with respect the seasonal drainage water amount (WOUT), according to an analysis of covariance model (ANCOVA). The dataset was preliminary checked for the homogeneity of the variance of the experimental error applying the Bartlett test, which did not result significant. A full factorial statistical ANCOVA model was therefore applied taking into account the following experimental factors: Growing season (GS1 and GS2) and biochar treatment (B0, B1, and B2), as well as their interaction. The two linear models of covariance, WOUT vs. WIN and SOUT vs. WOUT, respectively, were used to statistically compare the values of the drainage and leaching coefficients (ε and γ, respectively) as affected by the experimental factors and their possible interaction.
The statistical analyses were performed by using the JMP software package, version 8.1 (SAS Institute Inc., Cary, NC, USA). All of the figures were prepared using the SigmaPlot software (Systat Software, Chicago, IL, USA).

3. Results

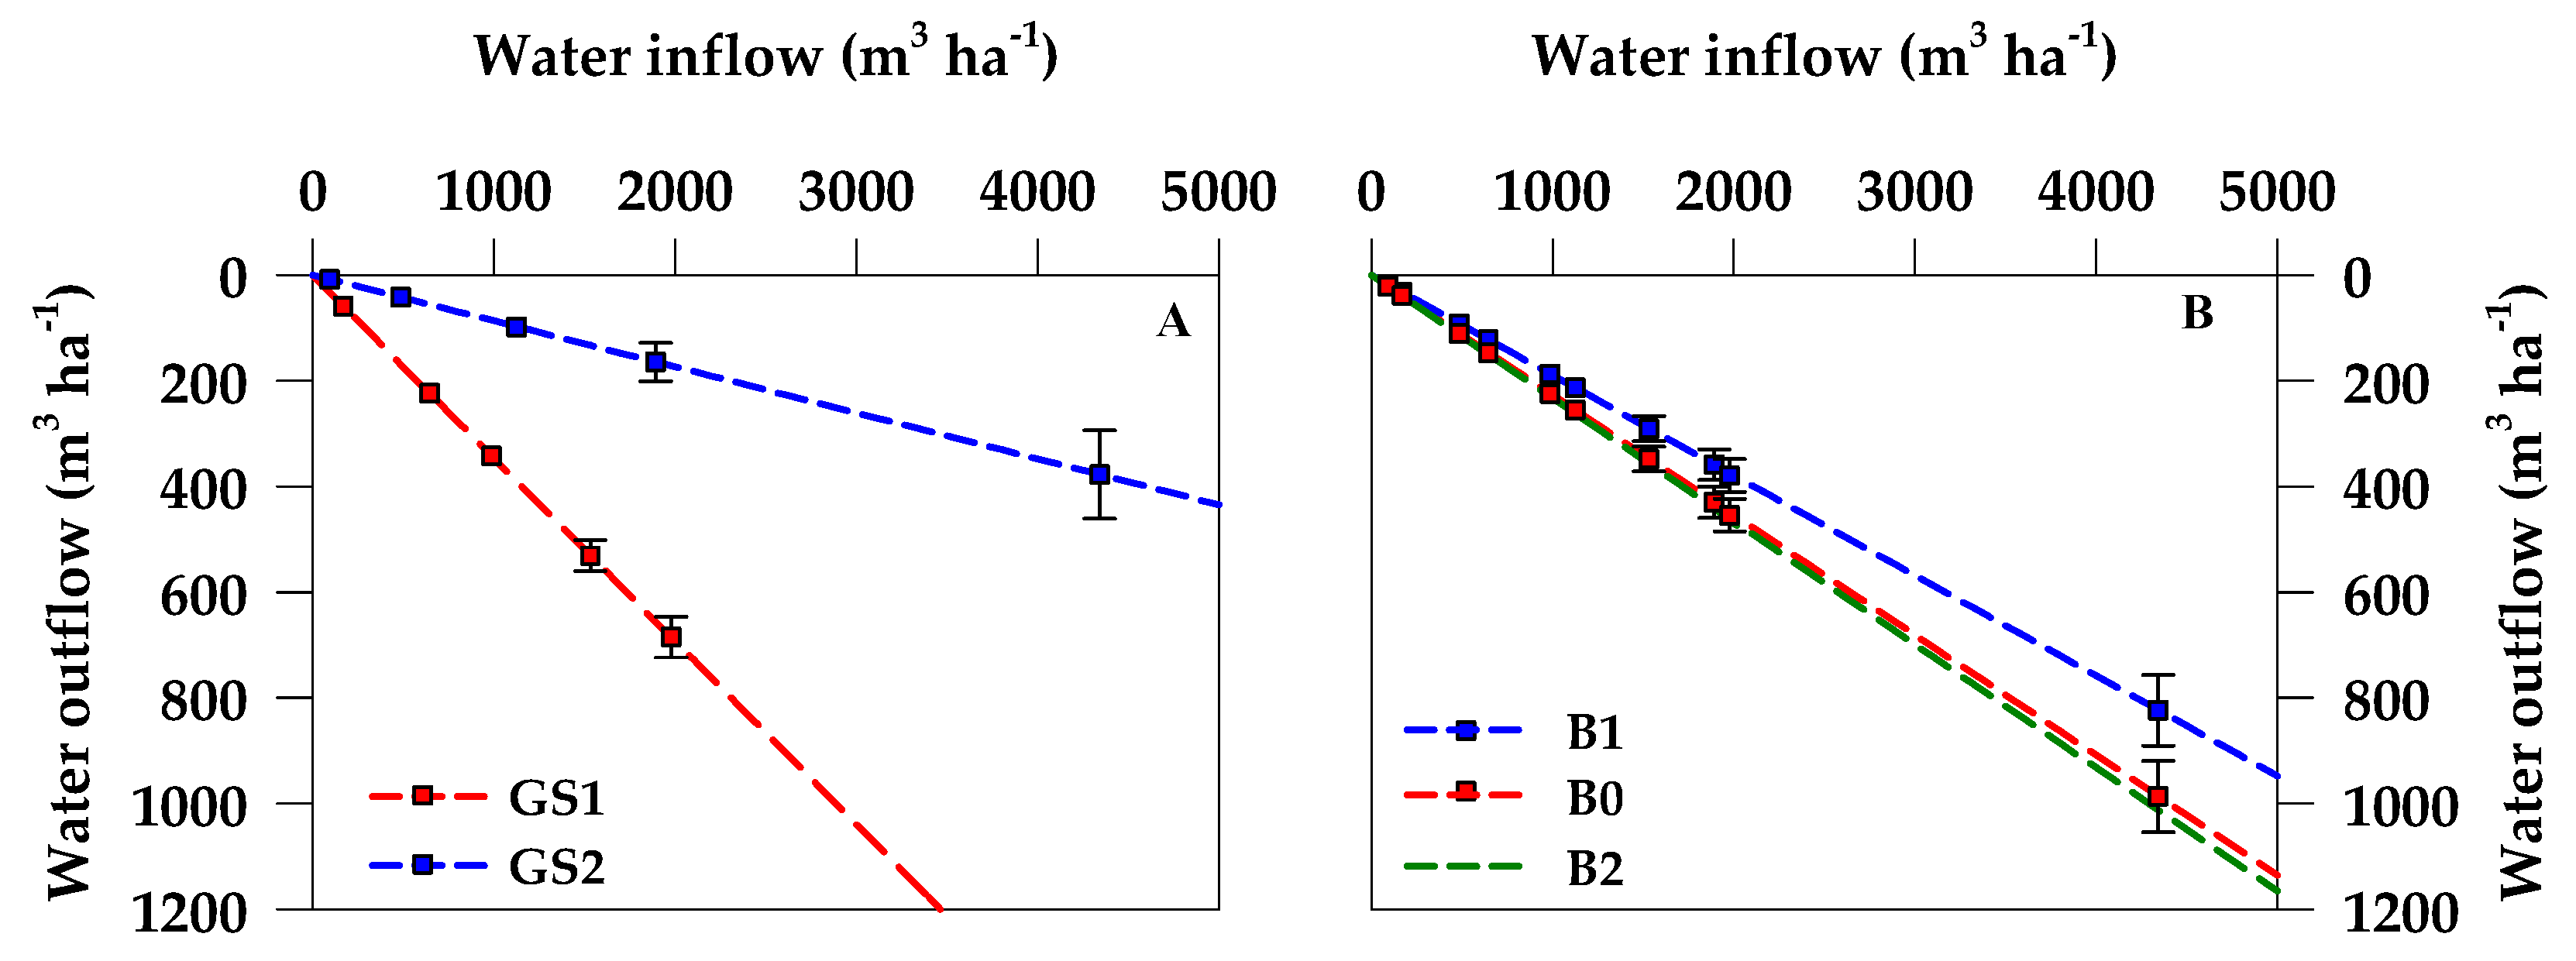
3.1. Water Inflows, Outflows, and Solutes Leaching

Figure 3 shows the observed main weather conditions (temperature, rainfalls and reference evapotranspiration) during the experimental period.
Table 1 reports the values of water inflows (rains and irrigation volumes) and water outflows (drainage volumes), as well as the losses of solutes by leaching detected during GS1 and GS2 and all the year-round (GS1 + GS2).
Precipitation (WP) were 1574 m3 ha−1 in GS1 and 663 m3 ha−1 in GS2.
Seasonal irrigation volumes (WI) were higher during GS2 (the dry season) than GS1 (the wet season). In GS1, fall–winter precipitations (WP) highly contributed to satisfy the water crop requirements (ETC). During GS1, three irrigations with an average frequency of 17.5 days were applied; irrigation was applied only during the first 40 days after transplanting, supplying 404 m3 ha−1 of water in total. During GS2, nineteen irrigations with an average frequency of 6.5 days were applied; the seasonal irrigation volume supplied was 3679 m3 ha−1.
The water supply (WIN) was higher during GS2 (4342 m3 ha−1) than GS1 (1978 m3 ha−1), due to the higher evapotranspiration demand of the spring–summer season and the consequent higher water requirement by the cultivated crop.
Drainage water (WOUT) was collected at 15-day intervals, eight times during GS1 with volumes of water varying from 18 to 265 m3 ha−1; five times during GS2 with volumes of water varying from 40 to 162 m3 ha−1. On average, the total amount of drainage water recorded in the course of the two cropping cycles was higher in GS1 (693 ± 56 m3 ha−1) than GS2 (369 ± 52 m3 ha−1). These larger drainage volumes were mainly the result of greater precipitations occurred in the autumn–winter period.
In Table 1, the average total amounts of anions and cations leached by the drainage water are also reported. Impressive losses of nitrate (NO3) were detected during GS1 (on average 306 ± 23 kg ha−1), while the losses of the same macronutrient were approximately reduced to one third during GS2 (on average, 104 ± 13 kg ha−1), but still remaining quite high. These values should be considered the consequence of an intensive crop management applied by the farmer with respect to the mineral fertilization rate. Moreover, in GS1 it should be considered the relevant soil NO3-N initial availability (see Table A2 in Appendix D). Besides nitrate, also chloride (Cl) and sodium (Na+) were largely lost through soil percolation (on average, 263 ± 26 kg ha−1 and 252 ± 19 kg ha−1, during GS1; 402 ± 81 kg ha−1 and 133 ± 20 kg ha−1, during GS2, respectively) because of the unintentional supply of high amounts of these two ions brought into the soil by saline irrigation water [29]. Phosphate (PO43−) and ammonium (NH4+) were never revealed in detectable quantities in drained waters. With respect to phosphate, it means that under such experimental soil conditions it is only slightly soluble or insoluble, while ammonium is predominantly adsorbed by the soil exchange complex (and biochar).
It should also be emphasized that the reported results provide just a general order of magnitude of the values at stake, but they do not allow a proper evaluation of the processes involved. Indeed, the WOUT values are directly affected by the amount of WIN, while SOUT is directly affected by WOUT and, in turn, indirectly affected by WIN itself (see Equations (1)–(3) previously reported). Only through the ANCOVA we can correctly quantify the treatment effects on each resulting output, “ceteris paribus”, i.e., the other variables being unchanged or constant.

3.2. The Drainage Model

Considering the results of the ANCOVA applied to drainage, a set of linear regressions was obtained interpreting WOUT as a function of WIN. The ANCOVA accounted for the effect of the two experimental factors: Growing season (GS) and biochar application rate (B), together with their interaction (GS*B). The interaction of the two experimental factors did not result significant and, for this reason, it was not included in the final regression model.r
The estimates and the statistical significance of the linear coefficients (intercept and slopes, respectively), are reported in Table 2. With no water supply, drainage is absent and, coherently, the regression lines show a zero intercept value, starting directly from the axis origin. Statistically, the model resulted highly significant (R2 = 0.90; p < 0.0001) and showed a quite good level of precision (root mean square error [RMSE] = 75.75 m3 ha−1; coefficient of variation [CV] = 34.24%). The slope of the model represents the so-called drainage coefficient (γ) and it accounts for the fraction of WIN lost by drainage (WOUT). The average value of γ was equal to 0.2167, indicating that approximately 22% of total water supplied to the crop by rains and irrigation was drained out of the considered soil profile.
A highly significant influence on γ was showed by the growing season (GS). Particularly, GS1 increased the γ value to 0.3464, while GS2 resulted in a lower γ value equal to 0.0867. The effect exerted by the growing season on water drainage is shown in Figure 4A.
The effect of biochar (B) on the γ value was highly significant only considering B1 (Table 2 and Figure 4B). Indeed, when biochar was applied at a 1% rate, γ was significantly reduced (p < 0.01) to a value of 0.1897. No significant effects were detected considering both B0 and B2 (Table 2).

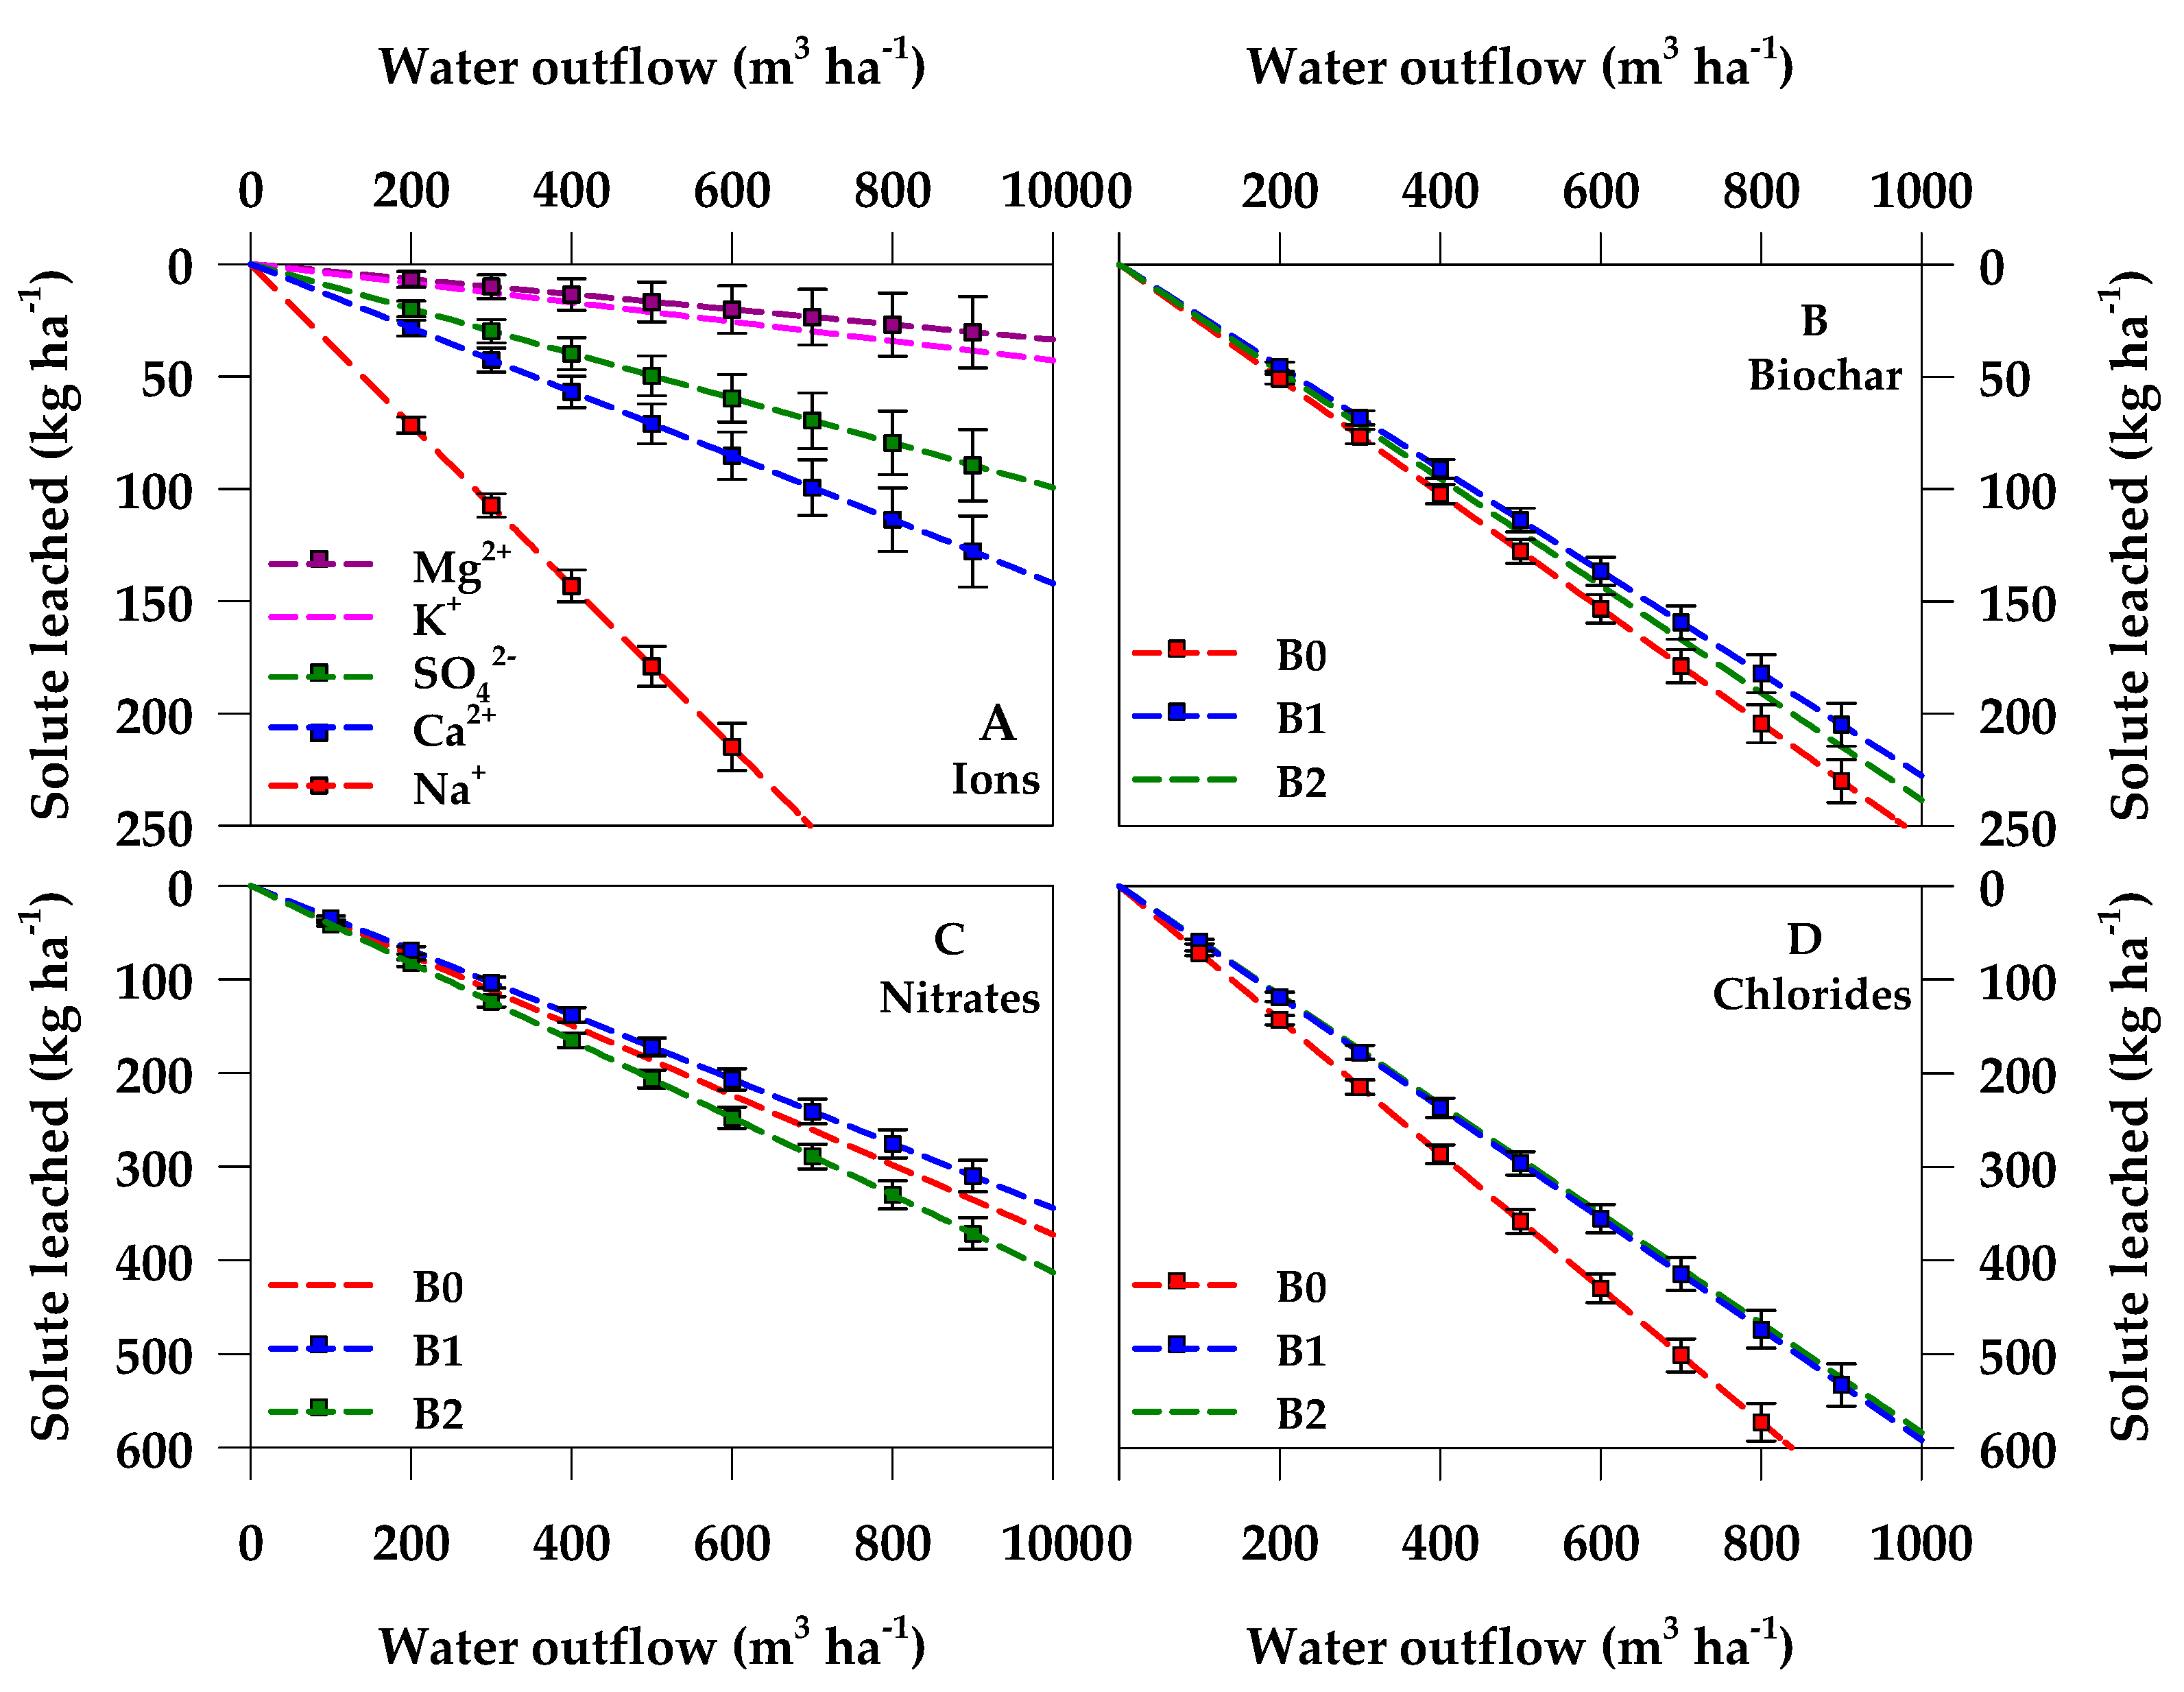
3.3. The Leaching Model

The ANCOVA applied to leaching interpreted the linear relationship of SOUT as a function of WOUT (Table 3). The model resulted highly significant (R2 = 0.95; p < 0.0001) and showed a quite good level of precision (RMSE = 18.85 kg m−3; CV = 36.46%).
The model accounted for the effect of the experimental factors, as well as for their interaction. The effect of the three experimental factors: Ionic species (I), growing season (GS), and biochar (B), individually considered, was highly significant. Also the interaction I*GS and I*B resulted highly significant. Only these significant effects were included in the final regression model as reported in Table 3.
Similarly to drainage, also in the case of leaching, all regression lines showed a zero intercept, indicating that, with no water drainage, no leaching of solutes occurred.
The slope of the model represents the so-called leaching coefficient (ε) and it accounts for the leached solutes from the considered soil profile per unit volume of drained water (WOUT). The average value of ε was equal to 0.2406 kg m−3 (Table 3).
As reported in Table 3 and Figure 5A, ε showed different values for the analyzed anions and cations, depending on their concentration in the soil as well as the solubility and mobility within the soil water solution of each considered chemical species. The higher the ion solubility and mobility, the higher its concentration in the soil water solution (i.e., the value of ε) and, therefore, the higher the loss of solutes from the rooting zone of the soil due to leaching.
Cl resulted the highest ionic species susceptible to leaching, showing a ε value of 0.6308 kg m−3 (Δε = +0.3902 kg m−3), more than doubled if compared with the ε average value of the model. Indeed, Cl is particularly prone to leaching as either soil minerals or organic matter do not adsorb it and therefore it is primarily dissolved in the soil circulating solution.
NO3 and Na+ proved a slightly lower mobility in the soil than Cl with ε = 0.3767 and 0.3581 kg m−3 (Δε = +0.1362 and +0.1175 kg m−3, respectively). The negligible interplay of NO3 with the negatively charged soil matrix justifies its relatively high mobility within the circulating soil solution. With respect to Na+, the result is consistent with the very weak holding strength characterizing this cation at the soil surface, poorly attracted and held on the cation exchange complex. The lowest ε value of 0.0337 kg m−3 (Δε = −0.2068 kg m−3) was observed for magnesium (Mg2+). Similarly, also potassium (K+) showed a quite low ε value equal to 0.0428 kg m−3 (Δε = −0.2068 kg m−3). These results can be explained considering that both Mg2+ and K+ represent cations usually leached in small amounts from the soil, even when applied as fertilizer. Sulphate (SO42−) and calcium (Ca2+) showed an intermediate ε value equal to 0.0995 and 0.1422 kg m−3 (Δε = −0.1410 and −0.0984 kg m−3, respectively).
Growing season (GS) had a significant effect on the value of the leaching coefficient (Table 3). On average, GS1 showed a lower ε (0.2068 kg m−3) than GS2 (0.2743 kg m−3), highlighting higher loss rates of solutes from the soil during the spring–summer rather than the fall–winter crop cycles.
A significant interaction I*GS was also observed, although involving only two anions, Cl and NO3 respectively. In particular (Table 3), in GS1 the Cl leaching coefficient was reduced to a value of 0.3722 kg m−3 (Δε = −0.2259 kg m−3), while it increased to 0.4363 kg m−3 (Δε = +0.0932 kg m−3) considering the NO3. The exact opposite was observed for GS2, during which ε was higher for Cl (0.8904 kg m−3) and lower for NO3 (0.3172 kg m−3).
The average effect of biochar addition to soil on reducing the leaching of solutes (Table 3 and Figure 5B) was significant only when considering B1, i.e., the 1% soil application rate (Δε = −0.0129 kg m−3), as it was already observed for the effect on water drainage. B2 treatment also reduced the losses of solutes, but this effect did not result statistically significant (Δε = −0.0021 kg m−3). On the contrary, B0 showed a significant increase of ions leaching (Δε = +0.0149 kg m−3) with respect to the average value.
The interaction I*B was also significant, again considering only NO3 (Figure 5C) and Cl (Figure 5D). The leaching coefficient with respect to NO3 (0.3767 kg m−3) was significantly reduced in B1 (Δε = −0.0193 kg m−3) but significantly increased in B2 (Δε = +0.0382 kg m−3). Differently from NO3, the Cl leaching coefficient (0.6308 kg m−3) was significantly reduced both in B1 and B2 (Δε = −0.0258 and −0.0447 kg m−3, respectively) as shown in Table 3.

3.4. Soil Salinity and pH

Soil pH was not affected by biochar (neither B1 nor B2), while it slightly increased during GS1 (on average from 7.4 to 7.7), returning back to its original value at the end of GS2. Similarly, soil EC was not significantly affected by biochar, but conversely it was strongly affected by the growing season, being very low in GS1 (on average from 0.55 to 0.57 dS m−1), showing a sharp increase in GS2, when full irrigation with saline water was performed and groundwater salinity was the highest (on average from 0.57 to 2.4 dS m−1). The precipitation regime characterizing the fall–winter seasons usually promotes a successful salt leaching along the soil profile.

4. Discussion

4.1. Seasonal Effect on Water Loss by Drainage

The experimental results derived from the empirical drainage model clearly showed that the autumn–winter growing season (GS1) accounted for a higher drainage coefficient, resulting in larger volumes of drained water keeping fixed the total water supply (WIN).
This was observed mainly because the soil water content in fall–winter is generally closer to full water capacity than in spring–summer, due to more abundant rainfalls occurring in the former period than in the latter and lower evapotranspiration rates by the crops.

4.2. Biochar Effect on Water Loss by Drainage

Still according to the results obtained from the empirical drainage model, biochar added to the soil played an important role in reducing soil water losses by drainage. This effect is likely due to an increased soil water retention, although strictly limited to a lower application dosage (B1). On the contrary, when a higher amending biochar rate (B2) was applied to soil, its effect on water drainage did not differ from the control (B0). Several authors reported a significant increase in the water retention capacity of the soil in case of biochar addition [34,35].
This property is mainly due to its porous structure and large exposed surface area [36,37]. Water is retained not only in the biochar pores (intra-pores) but also in the pores created at the interface between biochar and soil particles or small aggregates (inter-pores), as reported by Liu et al. [38]. In particular, pores can hold water via capillary and adhesive forces, thus reducing the mobility of water and improving soil water holding capacity [34,39]. Various studies reported increased soil water retention with increasing rate of biochar application, suggesting that large amount of biochar are required to consistently improve soil water holding capacity [39]. Conversely, other studies reported no effect [40,41,42,43], or even a decrease, on water retention [44,45,46] as a consequence of larger biochar application to soil.
Results of biochar use as soil amendment are highly variable in the literature. This is mainly due to a wide range of feedstock processing conditions, also including the type of biomass used and the technical operations applied in the pyrolytic technology to obtain biochar. Moreover, agronomic conditions and field technical operations showed to be highly influential, such as biochar application rate and the size of its particles, together with soil type and structure [16,17,28,40]. Our results are consistent with the findings of those authors reporting increased water retention even if at lower rates of biochar application [47] and particularly with results reported by Hansen et al. [48] and Du et al. [49]. They observed a significant improvement in the water holding capacity after soil amendment by 1% biochar. As reported already, B2 did not reduced soil water drainage. According to suggestions from the literature, this behavior could be explained considering that the 2% biochar treatment (B2) affected the saturated hydraulic conductivity of soil more than the 1% treatment (B1). Under water-saturated soil conditions, a greater water conductivity might create faster water-movement through soil pores and, consequently, greater water drainage along the soil profile. Previous studies, indeed, showed that amending soil with biochar can either increase or decrease the saturated hydraulic conductivity depending on biochar type, soil texture and amount of biochar application [35,45,50,51,52]. Kameyama et al. [53], Barnes et al. [54], and Li et al. [55] reported an increased saturated hydraulic conductivity in clay soils at higher concentration of biochar (5%–10%, w/w). Saturated hydraulic conductivity in biochar-amended soils is mainly controlled by the pores between biochar and soil particles (intra-pores), pore connectivity, pore size and tortuosity [17,56]. The addition of low biochar doses (i.e., 1% w/w) could reduce the size and connectivity of pores due to the filling of intra-pores by soil particle, thus increasing the soil tortuosity [56,57]. On the contrary, soil amendment with higher biochar rate (e.g., 2% w/w) could cause the formation of larger and more connected pores between soil and biochar particles [35,54,55], enhancing water flow and hydraulic conductivity in the soil. In our experimental conditions, soil amended with a higher biochar dose (B2) seems to behave accordingly to this latter hypothesis. Our findings, indeed, are consistent with Li et al. [55] that reported a significant increase in soil hydraulic conductivity when 2% biochar was mixed into the upper 10–20 cm layer of a silty clay soil. Considering the soil and biochar type, and the biochar application rate managed in our field trials, we can suppose a “threshold effect” of biochar dose on these two hydrological soil properties: Water retention and water drainage, respectively. When the amount of biochar applied to soil does not exceed approximately the 1% w/w threshold, water retention prevails and the soil water holding capacity is enhanced. Differently, when soil is amended with a higher biochar dose than 1% (and in the 1%–2% w/w range), the effect of biochar on the hydraulic conductivity is prevailing and the water losses by drainage are higher. However, direct measurements of hydraulic soil properties in our experimental conditions are needed to confirm this possible explanation.

4.3. Seasonal Effect on Solute Losses by Leaching

Considering the obtained results about the leaching of solutes from the soil as derived from the leaching empirical model, the autumn–winter growing season (GS1) was characterized by major nitrate losses than the spring–summer period (GS2), keeping fixed the amount of drained water (WOUT). These results can be explained considering that nitrates uptake by the crops is limited in winter due to a reduced growth rate while nitrate concentration into the soil remains high in the same period. Therefore, during the lettuce–radicchio crop cycle, the rate of plant nitrogen uptake was quite low and the NO3 not actively utilized by the plants was still available in the circulating soil solution, significantly contributing to leaching. Previous studies [1,58] showed that, in the autumn–winter growing season, a larger nitrogen fertilizer supply to the crop, together with the usually intense precipitations, resulted in significant nitrogen losses. Arregui and Quemada [59] also reported this kind of data interpretation. The authors showed that nitrogen leaching in Mediterranean climate easily occurs in the autumn–winter season, when crop growth is slow due to temperature constraints, nitrogen demand is usually low, precipitation exceed crop evapotranspiration and considerable drainage take place along the soil profile.
Conversely, the spring–summer period (GS2) showed major chloride losses than GS1, keeping fixed the amount of drained water (WOUT). Irrigation, performed in summertime, used saline water from the aquifer, very rich in chlorides. This provides evidence of a higher Cl leaching in GS2.

4.4. Biochar Effect on Solute Losses by Leaching

Still according to the results obtained from the empirical leaching model, biochar was shown to be effective in reducing the concentration of solutes in the soil drainage water but only considering the lower dose added to the soil (B1). This is generally true for all kind of solutes, both anions and cations.
More specifically, biochar significantly reduced the leaching coefficient of Cl (at both the addition rates, B1 and B2) and NO3 (only at the lower addition rate, B1). Several studies [43,60,61] confirmed the occurrence of anionic adsorption, particularly of nitrate, on biochar surface, deeming a high pyrolysis temperature (>600 °C) as the fundamental reason for this attribute. As observed by Dhyani et al. [62], biochars produced at high temperature have a greater specific surface area and show a good deal of positive charges on their surface. Other experiments, carried out under laboratory conditions [63,64,65], showed a good nitrate adsorption activity with high temperature derived biochars. Therefore, in our experimental conditions and according to the literature, the anions retention observed in the soil treated with two biochar supply rates could be attributed to the high temperature (up to 1200 °C) at which the used biochar was obtained.
However, the higher soil application rate of biochar (B2) significantly increased NO3 leaching as shown by the higher NO3 ε value in B2 (0.42 kg m−3) than B1 (0.36 kg m−3). Very likely, it can be supposed that the increased NO3 leaching could be due to increased microbial respiration [66] and enhanced mineralization of organic nitrogen boosted by the higher level of biochar [67], thus releasing nitrate in the soil solution. However, further experiments, more data, and additional analyses are needed to confirm this possible explanation, since the objective of this study was not focused on this but mostly related to the overall field scale and the balance conditions of water and solutes.

5. Conclusions

This work assessed the effect of biochar application to a cultivated soil on water drainage and the consequent losses of solutes by leaching. Actual field-grown conditions were applied considering a loam-texture soil and performing a couple of cultivation trials carried out over two consecutive growing cycles of horticultural crops.
Biochar proved a positive effect, but only at a lower supply rate. Indeed, biochar application to soil at 1% d.w. significantly reduced both water drainage and solute leaching. This effect was likely due to an increase in water retention as well as in ion adsorption. At a higher application rate (i.e., 2% soil d.w.), biochar effect did not differ from the control (no biochar applied) and the reduction of solute leaching was not statistically detected.
Unlike all the other ions considered in the trial, NO3 showed a higher leaching reduction at lower biochar application, while Cl leaching was significantly reduced at both biochar addition rates.
Therefore, strictly under the considered experimental conditions, 1% is approximately the recommended biochar application rate for mitigating nutrient losses (and nitrate most of all).
Increased anions and cations retention in the soil, particularly when they represent useful nutrients for the crop growth, should assure a better uptake by the plant roots and, at the same time, a decreased risk of surface- and ground-water contamination.
The conclusion to be drawn suggests that biochar application to the upper layer of cultivated soils can contribute, within a defined rate, in improving the soil water retention, also reducing solute losses by drained water.

Author Contributions

Conceptualization, A.L. and M.M.; methodology, A.L. and M.M.; validation, A.L. and M.M.; formal analysis, A.L. and M.M.; investigation, A.L.; data curation, A.L., A.R.B.C., and M.F.; writing—original draft preparation, A.L.; writing—review and editing, A.L. and M.M.; visualization, A.L.; supervision, A.L. and M.M.; project administration, A.L.; funding acquisition, A.L.

Funding

This study was carried out as part of the Project “Promotion of ECO-sustainable processes for the enhancement of Apulian agricultural production (ECO_P4), co-funded by Italian Ministry of Universities and Research (MIUR), within the Italian “PON/Ricerca e Competitività 2007–2013”.

Conflicts of Interest

The authors declare no conflict of interest.

Appendix A. Experimental Set-Up

The experimental set-up included three adjacent and identical plots of approximately 100 m2 (6.4 m wide, 15.6 m long).
At the center of each plot, an artificial draining basin was dug, removing the soil to create a trench of approximately 50 m2 (3.2 m wide, 15.6 m long), and 0.7 m of depth (Figure 1). At the bottom of the trench, a slope gradient of 0.5% was arranged.
A plastic sheet was used to cover both the walls and the bottom of each trench (Figure 1). In this way, the basins were hydraulically isolated thus preventing lateral fluxes and percolation of water.
A set of 52-mm-diameter corrugated draining pipes was installed at the bottom of the trench, over the plastic cover, to collect the percolating water. Each plot had six draining pipes, longitudinally arranged into two groups per trench (three draining pipes per group) and covered with a polypropylene textile.
At one end of the trench, the three draining pipes of each group were connected to a single unperforated PVC pipe, finally assembled to a connection pipe channeling the percolating water into a 1000 L tank (Figure 1).
Therefore, each plot had two tanks (i.e., one tank per group of draining pipes) that were buried at the ‘downstream’ end of the plots.
The trenches were then filled with the same soil previously dug out, reproducing at the best the original soil stratification.
As a result of this experimental set-up, the natural hydraulic gradient of the soil was disrupted, while a water saturated zone was formed at the bottom of each draining basin, before the water drained away. This condition mimicked the presence of a shallow water table at a depth of 0.7 m.

Appendix B. Biochar Analyses and Characterization

Biochar was ground and sieved (in a 2 mm mesh) and then analyzed in triplicate for a set of physico-chemical properties.
Biochar pH and electrical conductivity were determined after 1 h shaking with deionized water (1:20 w/v) and waiting for an equilibrium time of 5 min before measurement using a GLP 22+ pH-meter and a GLP 31+ EC-meter (Crison Instruments, Barcelona), respectively.
Biochar proximate properties, i.e., total solid (TS), volatile solid (VS), ash (AS), and fixed carbon (FC), were obtained using a thermogravimetric analyzer unit (LECO-TGA701), according to the ASTM D7582 method.
Ultimate analysis was performed by a CHNS Elemental Analyzer (CHN LECO 680), operating according to the LECO-ASTM D5373 method, to determine the C, N, H and S contents. Oxigen (O) was calculated by difference: O (%) = 100-C-H-N-S-ash.
Carbon stability of biochar was evaluated indirectly by the molar ratios of hydrogen to organic carbon (H/Corg) and oxygen to organic carbon (O/Corg). Lower H/Corg ratios, as well as lower O/Corg ratios provide indications of a long-term stability and persistence of biochar in the soil, contributing to carbon sequestration [68]. H/Corg values exceeding 0.7 are an indication of non-pyrolytic chars or pyrolysis deficiencies [69]. O/Corg ratio less than 0.2 should ensure a minimum biochar half-life of 1000 years [33]. These ratios were calculated from H, C, and O content.
Micro- and macro-elements analysis was performed by digesting 0.25 g of biochar sample in 10 mL of HNO3 in a closed vessel microwave digester (CEM-Mars6) for 20 min at 220 °C. The obtained solution was analyzed by inductively coupled plasma-optical emission spectroscopy (ICP-OES), using the 720 Series ICP-OES spectrometer (Agilent Technologies, Santa Clara, CA, USA).
Biochar physical properties, i.e., bulk density and total porosity, were measured by applying the ring knife method as proposed by Sun et al. [70].
Water holding capacity (WHC) was determined on biochar soaked in water for 24 h and drained for 2 h thus obtaining a saturated material that was weighted, dried at 105 °C in an oven and reweighted.
The following Table A1 reports the main physico-chemical properties of biochar applied to soil in the experimental trial.
Table A1. Main physico-chemical properties of the biochar applied to soil.
Biochar PropertyValue
pH 9.4
Electrical conductivity (dS m−1) 0.3
Fixed Carbon (%)88.0
Volatile Solid (%)8.7
Ash (%)3.3
C (%)83.2
H (%)1.7
N (%)0.4
S (%)0.05
O (%)11.4
H/C ratio (−)0.25
O/C ratio (−)0.10
K (g kg−1)25.24
Ca (g kg−1)4.39
Mg (g kg−1)1.04
Fe (g kg−1)1.02
Cd (g kg−1)nd
Co (g kg−1)nd
Pb (g kg−1)nd
Mn (g kg−1)0.29
Bulk density (kg m−3)130
Total porosity (%)47.4
Water Holding Capacity (%)275.9

Appendix C. Biochar Application to Soil

Before using biochar as soil amendment, biochar was preliminary ground into particles smaller than 1 cm in order to increase its area to volume ratio, thus maximizing the interaction with soil particles.
The experimental fields were ploughed first, then biochar was applied to the soil surface (Figure A1A) using a fertilizer spreader 1 month before the first transplanting, finally it was mixed to the soil within the upper 0.20 m soil layer with a rotary hoeing tillage (Figure A1B,C).
Considering the soil bulk density (1.3 mg m−3) and the incorporation of biochar to 0.20 m soil depth, rates of biochar application were equivalent to 26 and 52 mg ha−1, respectively for B1 and B2.
Figure A1. Sequential operations of biochar application to soil: (A) Biochar broadcasting at the soil surface through a fertilizer spreader 1 month before the first transplanting; (B) biochar mixing within the upper 0.20 m of soil layer with a rotary hoeing tillage; (C) final resulting soil preparation.
Agronomy 09 00758 g0a1

Appendix D. Soil Classification and Soil Physico-Chemical Characterization

According to the FAO international standard taxonomic soil classification system “World Reference Base for Soil Resources”, the soil belongs to the haplic calcisol reference group, corresponding to a typic calcixerept in the USDA soil taxonomy.
Samplings and measures were performed before the starting of the trial. Three soil samples were collected from every sub-plot. Each sample consisted in three soil cores taken at 0–20, 20–40, and 40–60 cm soil depth, using a 50-mm-diameter soil auger. Therefore, 18 samples in total were obtained.
The soil particle-size distribution was determined using the pipette-gravimetric method. Field capacity and wilting point, respectively at −0.03 MPa and −1.5 MPa were obtained using a pressure-plate apparatus (Soilmoisture Equipment Corp.); the maximum crop-available water was consequently estimated by the difference of the two values.
The bulk density was measured by extracting three intact soil cores at 20, 40, and 60 cm soil depths, with an ‘undisturbed’ soil-core sampler (Model 0200, Soilmoisture Equipment Corp., Goleta, CA, USA).
The pH and electrical conductivity were measured on 1:2.5 (w/v) aqueous soil extracts and saturated soil paste extracts respectively.
The soil total N was determined by the Kjeldahl method [71], while P2O5 was determined by using the sodium bicarbonate method [72]. Organic carbon was detected by oxidation with a potassium dichromate-titration of FeSO4 according to Walkley–Black method [73] and the organic matter was estimated by multiplying the percentage of the organic carbon by the factor 1.724.
Na+, Ca2+, and Mg2+ were determined in soil saturated paste extracts and analyzed by using Atomic Absorption Spectroscopy—AAS (Perkin-Elmer Atomic Absorption Spectrophotometer—model 2380). NO3-N was determined according to Keeney and Nelson [74]. After sampling, the soil cores were stored and maintained frozen until determining NO3-N concentration by soil extraction with 2 M KCl, followed by spectrophotometric analysis of the extract.
The following Table A2 reports the main physico-chemical properties of the 0.7 m soil layer.
Table A2. Main physico-chemical properties of the 0.7 m soil layer.
Soil PropertyMean ± Standard Error
Clay (%)19.87 ± 0.81
Silt (%)34.28 ± 0.74
Sand (%)45.85 ± 0.74
Field capacity: Gravimetric soil moisture at field capacity (% dw)29.86 ± 0.31
Wilting point: Gravimetric soil moisture at wilting point (% dw)17.41 ± 0.19
Bulk density (mg m−3)1.31 ± 0.21
pH7.58 ± 0.06
EC (dS m−1)2.45 ± 0.17
Total nitrogen (‰)1.08 ± 0.05
Olsen P2O5 (mg kg−1)62.35 ± 0.74
Organic matter (%)1.61 ± 0.07
Na+ (mg kg−1)200.19 ± 8.38
Ca2+ (mg kg−1)178.02 ± 17.38
Mg2+ (mg kg−1)25.88 ± 3.16
NO3-N (mg kg−1)10.78 ± 0.36

Appendix E. Chemical Analysis of Irrigation Water

Table A3. Reports the chemical parameters measured on the irrigation water, as average values of the entire experimental period.
Main Chemical Properties of Irrigation Water. Water Parameter Mean ± Standard Error
pH 7.69 ± 0.06
EC (dS m−1) 5.25 ± 0.17
Na+ (mg L−1) 609.88 ± 5.25
K+ (mg L−1) 38.16 ± 0.36
Mg2+ (mg L−1) 121.57 ± 0.96
Ca2+ (mg L−1) 159.24 ± 1.51
NO3 (mg L−1) 185.88 ± 8.25
Cl (mg L−1) 1312.43 ± 64.28
SO4 (mg L−1) 198.64 ± 5.78

References

  1. Libutti, A.; Monteleone, M. Soil vs. groundwater: The quality dilemma. Managing nitrogen leaching and salinity control under irrigated agriculture in Mediterranean conditions Agric. Water Manag. 2017, 186, 40–50. [Google Scholar] [CrossRef]
  2. Sorrenti, G.; Toselli, M. Soil leaching as affected by the amendment with biochar and compost. Agric. Ecosyst. Environ. 2016, 226, 56–64. [Google Scholar] [CrossRef]
  3. Motevalli, A.; Naghibi, S.A.; Hashemi, H.; Berndtsson, R.; Pradhan, B.; Gholami, V. Inverse method using boosted regression tree and k-nearest neighborto quantify effects of point and non-point source nitrate pollution ingroundwater. J. Clean. Prod. 2019, 228, 1248–1263. [Google Scholar] [CrossRef]
  4. Dupas, R.; Delmas, M.; Dorioz, M.; Garnier, J.; Moatar, F.; Gascuel-Odoux, C. Assessing the impact of agricultural pressures on N and P loads andeutrophication risk. Ecol. Indic. 2015, 48, 396–407. [Google Scholar] [CrossRef]
  5. Ward, M.H.; Rena, R.J.; Brender, J.D.; de Kok, T.M.; Weyer, P.J.; Nolan, B.T.; Villanueva, M.; van Breda, S.G. Drinking Water Nitrate and Human Health: An Updated Review. Int. J. Environ. Res. Public Health 2018, 15, 1557. [Google Scholar] [CrossRef] [PubMed]
  6. Han, F.; Ren, L.; Zhang, X.C. Effect of biochar on the soil nutrients about different grasslands in the Loess Plateau. Catena 2016, 137, 554–562. [Google Scholar] [CrossRef]
  7. Sadeghi, S.H.; Hazbavi, Z.; Harchegani, M.K. Controllability of runoff and soilloss from small plots treated by vinasse-produced biochar. Sci. Total Environ. 2016, 541, 483–490. [Google Scholar] [CrossRef] [PubMed]
  8. Lehmann, J. Bio-energy in the black. Front. Ecol. Environ. 2007, 5, 381–387. [Google Scholar] [CrossRef]
  9. Zabaniotou, A.; Rovas, D.; Libutti, A.; Monteleone, M. Boosting circular economy and closing the loop in agriculture: Case study of a small-scale pyrolysis-biochar based system integrated in an olive farm in simbiosi with an olive mill. Environ. Dev. 2015, 14, 22–36. [Google Scholar] [CrossRef]
  10. Monlau, F.; Francavilla, M.; Sambusiti, C.; Antoniou, N.; Solhy, A.; Libutti, A.; Zabaniotou, A.; Barakat, A.; Monteleone, M. Toward a functional integration of anaerobic digestion and pyrolysis for a sustainable resource management. Comparison between solid-digestate and its derived pyrochar as soil amendment. Appl. Energ. 2016, 169, 652–662. [Google Scholar] [CrossRef]
  11. Zabaniotou, A.; Rovas, D.; Delivand, M.K.; Francavilla, M.; Libutti, A.; Cammerino, A.R.B.; Monteleone, M. Conceptual vision of bioenergy sector development in Mediterranean regions based on decentralized thermochemical systems. Sustain. Energy Technol. Assess. 2017, 23, 33–47. [Google Scholar] [CrossRef]
  12. Lehmann, J.; Joseph, S. Biochar for Environmental Management: Science and Technology; Earthscan: London, UK, 2009. [Google Scholar]
  13. Lone, A.H.; Najar, G.R.; Ganie, M.A.; So fi, J.A.; Tahir Ali, T. Biochar for sustainable soil health: a review of prospects and concerns. Pedosphere 2015, 25, 639–653. [Google Scholar] [CrossRef]
  14. Wang, S.; Gao, B.; Zimmerman, A.R.; Li, Y.; Ma, L.; Harris, W.G.; Migliaccio, K.W. Physicochemical and sorptive properties of biochars derived from woody and herbaceous biomass. Chemosphere 2015, 134, 257–262. [Google Scholar] [CrossRef]
  15. Jaafar, N.M.; Clode, P.L.; Abbott, L.K. Biochar-soil interactions in four agricultural soils. Pedosphere 2015, 25, 729–736. [Google Scholar] [CrossRef]
  16. Obia, A.; Mulder, J.; Martinsen, V.; Cornelissen, G.; Børresen, T. In situ effects of biochar on aggregation, water retention and porosity in light-textured tropical soils. Soil Till. Res. 2016, 155, 35–44. [Google Scholar] [CrossRef]
  17. Lim, T.J.; Spokas, K.A.; Feyereisen, G.; Novak, J.M. Predicting the impact of biochar additions on soil hydraulic properties. Chemosphere 2016, 142, 136–144. [Google Scholar] [CrossRef] [PubMed]
  18. Haider, G.; Steffens, D.; Moser, G.; Müller, C.; Kammannd, C.I. Biochar reduced nitrate leaching and improved soil moisture content without yield improvements in a four-year field study. Agric. Ecosyst. Environ. 2017, 237, 80–94. [Google Scholar] [CrossRef]
  19. Buecker, J.; Kloss, S.; Wimmer, B.; Rempt, F.; Zehetner, F.; Soja, G. Leachate Composition of Temperate Agricultural Soils in Response to Biochar Application. Water Air Soil Poll. 2016, 227, 1–13. [Google Scholar] [CrossRef]
  20. Demiraj, E.; Libutti, A.; Malltezi, J.; Rroço, E.; Brahushi, F.; Monteleone, M.; Sulçe, S. Effect of organic amendments on nitrate leaching mitigation in a sandy loam soil of Shkodra district, Albania. Ital. J. Agron. 2018, 13, 1136. [Google Scholar] [CrossRef]
  21. Bradley, A.; Larson, R.A.; Runge, T. Effect of Wood Biochar in Manure-Applied Sand Columns on Leachate Quality. J. Environ. Qual. 2015, 44, 1720–1728. [Google Scholar] [CrossRef]
  22. Kanthle, A.K.; Lenka, N.K.; Lenka, S.; Tedia, K. Biochar impact on nitrate leaching as influenced by native soil organic carbon in an Inceptisol of central India. Soil Till. Res. 2016, 157, 65–72. [Google Scholar] [CrossRef]
  23. Yuan, H.; Lu, T.; Wang, Y.; Chen, Y.; Lei, T. Sewage sludge biochar: Nutrient composition and its effect on the leaching of soil nutrients. Geoderma 2016, 267, 17–23. [Google Scholar] [CrossRef]
  24. Libutti, A.; Mucci, M.; Francavilla, M.; Monteleone, M. Effect of biochar amendment on nitrate retention in a silty clay loam soil. Ital. J. Agron. 2016, 11, 273–276. [Google Scholar] [CrossRef]
  25. Agegnehu, G.; Bird, M.I.; Nelson, P.N.; Bass, A.M. The ameliorating effects of biochar and compost on soil quality and plant growth on a Ferralsol. Soil Res. 2015, 53, 1–12. [Google Scholar] [CrossRef]
  26. Hardie, M.A.; Oliver, G.; Clothier, B.E.; Bound, S.A.; Green, S.A.; Close, D.C. Effect of Biochar on Nutrient Leaching in a Young Apple Orchard. J. Environ. Qual. 2015, 4484, 1273–1282. [Google Scholar] [CrossRef]
  27. Novak, J.M.; Busscher, W.J.; Laird, D.L.; Ahmedna, M.; Watts, D.W.; Niandou, M.A.S. Impact of biochar amendment on fertility of a Southeastern coastal plain soil. Soil Sci. 2009, 174, 105–112. [Google Scholar] [CrossRef]
  28. Major, J.; Rondon, M.; Molina, D.; Riha, S.J.; Lehmann, J. Nutrient leaching in a Colombian savanna oxisol amended with biochar. J. Environ. Qual. 2012, 41, 1076–1086. [Google Scholar] [CrossRef]
  29. Libutti, A.; Monteleone, M. Irrigation management in Mediterranean salt affected agriculture: how leaching operates. Ital. J. Agron. 2012, 7, e5. [Google Scholar] [CrossRef]
  30. Allen, R.G.; Pereira, L.S.; Raes, D.; Smith, M. Crop evapotranspiration: guidelines for computing crop water requirements. In Irrigation and Drainage Paper No. 56; Food and Agriculture Organization of the United Nations (FAO): Rome, Italy, 1998. [Google Scholar]
  31. Monteleone, M.; Libutti, A. Salt leaching due to rain in Mediterranean climate: is it enough? Ital. J. Agron. 2012, 7, e6. [Google Scholar] [CrossRef]
  32. Libutti, A.; Cammerino, A.R.B.; Monteleone, M. Risk assessment of soil salinization due to tomato cultivation in Mediterranean climate conditions. Water 2018, 10, 1503. [Google Scholar] [CrossRef]
  33. Spokas, K.A. Review of the stability of biochar in soils: predictability of O/C molar ratios. Carbon Manag. 2010, 1, 289–303. [Google Scholar] [CrossRef] [Green Version]
  34. Karhu, K.; Mattila, T.; Bergstrom, I.; Regina, K. Biochar addition to agricultural soil increased CH4 uptake and water holding capacity—Results from a short-term pilot field study. Agric. Ecosyst. Environ. 2011, 140, 309–313. [Google Scholar] [CrossRef]
  35. Herath, H.M.S.K.; Camps-Arbestain, M.; Hedley, M. Effect of biochar on soil physical properties in two contrasting soils: An alfisol and an andisol. Geoderma 2013, 209–210, 188–197. [Google Scholar] [CrossRef]
  36. Basso, A.S.; Miguez, F.E.; Laird, D.A.; Horton, R.; Westgate, M. Assessing potential of biochar for increasing water-holding capacity of sandy soils. GCB Bioenergy 2013, 5, 132–143. [Google Scholar] [CrossRef] [Green Version]
  37. Liu, C.; Wang, H.; Tang, X.; Guan, Z.; Reid, B.J.; Rajapaksha, A.U.; Ok, Y.S.; Sun, H. Biochar increased water holding capacity but accelerated organic carbon leaching from a sloping farmland soil in China. Environ. Sci. Pollut. Res. 2016, 23, 995–1006. [Google Scholar] [CrossRef]
  38. Liu, Z.; Dugan, B.; Masiello, C.A.; Gonnermann, H.M. Biochar particle size, shape, and porosity act together to influence soil water properties. PLoS ONE 2017, 12, e0179079. [Google Scholar] [CrossRef] [Green Version]
  39. Blanco-Canqui, H. Biochar and soil physical properties. Soil. Sci. Soc. Am. J. 2017, 84, 687–711. [Google Scholar] [CrossRef] [Green Version]
  40. Hardie, M.; Clothier, B.; Bound, S.; Oliver, G.; Close, D. Does biochar influence soil physical properties and soil water availability? Plant Soil 2014, 376, 347–361. [Google Scholar] [CrossRef]
  41. Jeffery, S.; Meinders, M.B.; Stoof, C.R.; Bezemer, T.M.; van de Voorde, T.F.; Mommer, L.; van Groenigen, J.W. Biochar application does not improve the soil hydrological function of a sandy soil. Geoderma 2015, 251, 47–54. [Google Scholar] [CrossRef]
  42. Mollinedo, J.; Schumacher, T.E.; Chintala, R. Influence of feedstocks and pyrolysis on biochar’s capacity to modify soil water retention characteristics. J. Anal. Appl. Pyrolysis 2015, 114, 100–108. [Google Scholar] [CrossRef]
  43. Kameyama, K.; Miyamoto, T.; Yukiyoshi, I.; Shiono, T. Effects of biochar produced from sugarcane bagasse at different pyrolysis temperatures on water retention of a calcaric dark red soil. Soil Sci. 2016, 181, 20–28. [Google Scholar] [CrossRef]
  44. Abel, S.; Peters, A.; Trinks, S.; Schonsky, H.; Facklam, M.; Wessolek, G. Impact of biochar and hydrochar addition on water retention and water repellency of sandy soil. Geoderma 2013, 202–203, 183–191. [Google Scholar] [CrossRef]
  45. Mukherjee, A.; Lal, R. Biochar impacts on soil physical properties and greenhouse gas emissions. Agronomy 2013, 3, 313–339. [Google Scholar] [CrossRef] [Green Version]
  46. Carvalho, M.T.M.; Madari, B.E.; Bastiaans, L.; van Oort, P.A.J.; Leal, W.G.O.; Heinemann, A.B.; da Silva, M.A.S.; Maia, A.H.N.; Parsons, D.; Meinke, H. Properties of a clay soil from 1.5 to 3.5 years after biochar application and the impact on rice yield. Geoderma 2016, 276, 7–18. [Google Scholar] [CrossRef]
  47. Gamage, D.N.; Mapa, R.B.; Dharmakeerthi, R.S.; Biswas, A. Effect of rice husk biochar on selected soil properties in tropical alfisols. Soil Res. 2016, 54, 302–310. [Google Scholar] [CrossRef]
  48. Hansen, V.; Hauggaard-Nielsen, H.; Petersen, C.T.; Mikkelsen, T.N.; Müller-Stöver, D. Effects of gasification biochar on plant-available water capacity and plant growth in two contrasting soil types. Soil Till. Res. 2016, 161, 1–9. [Google Scholar] [CrossRef] [Green Version]
  49. Du, Z.; Chen, X.; Qi, X.; Li, Z.; Nan, J.; Deng, J. The effects of biochar and hoggery biogas slurry on fluvo-aquic soil physical and hydraulic properties: A field study of four consecutive wheat-maize rotations. J. Soils Sediments 2016, 16, 2050–2058. [Google Scholar] [CrossRef]
  50. Borchard, N.; Siemens, J.; Ladd, B.; Möller, A.; Amelung, W. Application of biochars to sandy and silty soil failed to increase maize yield under common agricultural practice. Soil Till. Res. 2014, 144, 184–194. [Google Scholar] [CrossRef]
  51. Brockhoff, S.R.; Christians, N.E.; Killorn, R.J.; Horton, R.; Davis, D.D. Physical and mineral nutrition properties of sand-based turfgrass root zones amended with biochar. Agron. J. 2010, 102, 1627–1631. [Google Scholar] [CrossRef]
  52. Githinji, L. Effect of biochar application rate on soil physical and hydraulic properties of a sandy loam. Arch. Agron. Soil Sci. 2014, 60, 457–470. [Google Scholar] [CrossRef]
  53. Kameyama, K.; Miyamoto, T.; Shiono, T.; Shinogi, Y. Influence of sugarcane bagasse-derived biochar application on nitrate leaching in Calcaric dark red soil. J. Environ. Qual. 2012, 41, 1131–1137. [Google Scholar] [CrossRef]
  54. Barnes, R.T.; Gallagher, M.E.; Masiello, C.A.; Liu, Z.; Dugan, B. Biochar-induced changes in soil hydraulic conductivity and dissolved nutrient fluxes constrained by laboratory experiments. PLoS ONE 2014, 9, e108340. [Google Scholar] [CrossRef] [Green Version]
  55. Li, S.; Zhang, Y.; Yan, W.; Shangguan, Z. Effect of biochar application method on nitrogen leaching and hydraulic conductivity in a silty clay soil. Soil Till. Res. 2018, 183, 100–108. [Google Scholar] [CrossRef]
  56. Liu, Z.; Dugan, B.; Masiello, C.A.; Barnes, R.T.; Gallagher, M.E.; Gonnermann, H. Impacts of biochar concentration and particle size on hydraulic conductivity and DOC leaching of biochar-sand mixtures. J. Hydrol. 2016, 533, 461–472. [Google Scholar] [CrossRef] [Green Version]
  57. Zhang, J.; Chen, Q.; You, C. Biochar effect on water evaporation and hydraulic conductivity in sandy soil. Pedosphere 2016, 26, 265–272. [Google Scholar] [CrossRef]
  58. Libutti, A.; Gatta, G.; Gagliardi, A.; Vergine, P.; Pollice, A.; Beneduce, L.; Disciglio, G.; Tarantino, E. Agro-industrial wastewater reuse for irrigation of a vegetable crop succession under Mediterranean conditions. Agric. Water Manag. 2018, 196, 1–14. [Google Scholar] [CrossRef]
  59. Arregui, L.M.; Quemada, M. Drainage and nitrate leaching in a crop rotation under different N-fertilizer strategies: Application of capacitance probes. Plant Soil 2006, 288, 57–69. [Google Scholar] [CrossRef]
  60. Yao, Y.; Gao, B.; Zhang, M.; Inyang, M.; Zimmerman, A.R. Effect of biochar amendment on sorption and leaching of nitrate, ammonium, and phosphate in a sandy soil. Chemosphere 2012, 89, 1467–1471. [Google Scholar] [CrossRef]
  61. Chintala, R.; Mollinedo, J.; Schumacher, T.E.; Malo, D.D.; Papiernik, S.K.; Clay, D.E.; Kumar, S.; Gulbrandson, D.W. Nitrate sorption and desorption by biochars produced from fast pyrolysis. Micropor. Mesopor. Mat. 2013, 179, 250–257. [Google Scholar] [CrossRef]
  62. Dhyani, V.; Bhaskar, T. A comprehensive review on the pyrolysis of lignocellulosic biomass. Renew. Energy 2018, 129, 695–716. [Google Scholar] [CrossRef]
  63. Mizuta, K.; Matsumoto, T.; Hatate, Y.; Nishihara, K.; Nakanishi, T. Removal of nitrate-nitrogen from drinking water using bamboo powder charcoal. Bioresour. Technol. 2004, 95, 255–257. [Google Scholar]
  64. Liang, X.; Ji, Y.J.; He, M.M.; Su, M.M.; Liu, C.L.; Tian, G.M. Simple N balance assessment for optimizing the biochar amendment level in paddy soils. Commun. Soil Sci. Plan. 2014, 45, 1247–1258. [Google Scholar] [CrossRef]
  65. Fidel, R.B.; Laird, D.A.; Spokas, K.A. Sorption of ammonium and nitrate to biochars is electrostatic and pH-dependent. Sci. Rep. 2018, 8, 17627. [Google Scholar] [CrossRef] [PubMed]
  66. Steiner, C.; de Arruda, M.R.; Teixeira, W.G.; Zech, W. Soil respiration curves as soil fertility indicators in perennial central Amazonian plantations treated with charcoal, and mineral or organic fertilisers. Trop. Sci. 2008, 47, 218–230. [Google Scholar] [CrossRef]
  67. Laird, D.A.; Fleming, P.; Davis, D.D.; Horton, R.; Wang, B.; Karlen, D.L. Impact of biochar amendments on the quality of a typical Midwestern agricultural soil. Geoderma 2010, 158, 443–449. [Google Scholar] [CrossRef] [Green Version]
  68. Cheng, C.H.; Lehmann, J.; Engelhard, M.H. Natural oxidation of black carbon in soils: changes in molecular form and surface charge along a climosequence. Geochim. Cosmochim. Acta 2008, 72, 1598–1610. [Google Scholar] [CrossRef]
  69. Schimmelpfennig, S.; Glaser, B. One step forward toward characterization: some important material properties to distinguish biochars. J. Environ. Qual. 2012, 41, 1001–1013. [Google Scholar] [CrossRef] [Green Version]
  70. Sun, X.Y.; Luan, Y.N.; Wang, H.; Guo, C.; Li, S.Y. Growth Media for Ornamental Plants; DB11/T 770-2010; Beijing Municipal Administration of Quality and Technology Supervision: Beijing, China, 2010. [Google Scholar]
  71. Bremner, J.M. Nitrogen-total. In Methods of Soil Analysis Part 3—Chemical Methods. SSSA Book Ser. No. 5; Sparks, D.L., Page, A.L., Johnston, C.T., Summ, M.E., Eds.; SSSA: Madison, WI, USA, 1996; pp. 1058–1121. [Google Scholar]
  72. Olsen, S.R.; Cole, C.V.; Watanabe, F.S.; Dean, L.A. Estimation of Available Phosphorus in Soil by Extraction with Sodium Bicarbonate; USDA Circular 939; USDA: Washington, DC, USA, 1954; pp. 1–19. [Google Scholar]
  73. Walkley, A.; Black, I.A. An examination of the Degtjareff method fordetermining soil organic matter and a proposed modification of the chromicacid titration method. Soil Sci. 1934, 37, 29–38. [Google Scholar] [CrossRef]
  74. Keeney, D.R.; Nelson, D.W. Nitrogen Inorganic Forms. In Methods of Soil Analysis. Part 2, 2nd ed.; Page, A.L., Miller, R.H., Keeney, D.R., Eds.; Agron. Monogr. 9; American Society of Agronomy and Soil Science Society of America Publisher: Madison, WI, USA, 1982; pp. 643–698. [Google Scholar]
Figure 1. A lysimeter-like installation was set up allowing the recovery of the water drained from the 0.70 m soil profile and collected by draining perforated pipes placed along the bottom of each basin and connected to tanks located underground at the head of each field plot.
Agronomy 09 00758 g001
Figure 2. Layout of the experimental field.
Agronomy 09 00758 g002
Figure 3. Daily average of air temperature (A), reference crop evapotranspiration (B) and precipitation (C), registered during the two crop growing seasons of lettuce–radicchio (GS1) and zucchini (GS2).
Agronomy 09 00758 g003
Figure 4. Set of linear regressions as result of the ANCOVA drainage model. (A) average effect of the growing seasons GS1 and GS2; (B) average effect of the biochar treatments (B0, B1, and B2). The slope of the regression lines detects the fraction of water drained with respect to the water supplied. To avoid overlapping, some symbols may be not represented.
Agronomy 09 00758 g004
Figure 5. Set of linear regressions as result of the ANCOVA leaching model. (A) average effect of ions; (B) average effect of the biochar treatments (B0, B1, and B2); (C) interaction of nitrate with the biochar treatments; (D) interaction of chloride with the biochar treatments. The slope of the regression lines detects the average ion concentration in the drained water. To avoid overlapping, some symbols may be not represented.
Agronomy 09 00758 g005
Table 1. Average values of water inflow (rains (WP) and irrigation (WI) volumes per unit area), water outflow (drainage) and solute leaching detected in the two consecutive growing cycles (GS1 and GS2) and all the year-round (GS1 + GS2).
VariableUnitsGS1Std ErrGS2Std ErrTotalStd Err
WPm3 ha−11574.1-663.3-2237.4-
WI404.4-3678.7-4083.0-
Win1978.5-4342.0-6320.4-
GCWout693.256.4369.551.781062.763.4
Wout/Win(%)35.0-8.5-16.8-
NO3kg ha−1305.822.7104.012.5409.826.4
Cl262.826.4402.581.3665.384.2
Na2+252.119.2133.420.4385.525.6
Ca2+104.510.053.28.8157.75013.5
SO4−44.02.556.810.6100.75010.0
K+30.43.15016.12.746.5534.7
Mg2+24.21.85212.51.736.72.7
PO43−n.d.-n.d.---
NH4+n.d.-n.d.---
Std Err = standard error; n.d. = not detected.
Table 2. Statistical results of the analysis of covariance (ANCOVA) drainage model (see the first table line for the equation). The coefficient estimates, their percentage variation with respect to the average slope, standard errors and their corresponding probabilities are shown. Summary of fit is also reported in the lower part of the table.
WOUT = α + (γ ± Δi) × WIN
TermEstimateVariation (%)Standard Errorp
α = intercept (m3 ha−1)0.0000===
γ = average slope (−)0.2167100.000.0064**
ΔGS (effects of Growing Season on γ)
 GS10.129759.850.0064**
 GS2−0.1297−59.850.0064**
ΔB (effects of Biochar on γ)
 B00.01054.850.0091n.s.
 B1−0.0270−12.460.0091**
 B20.01657.610.0091n.s.
R2 = 0.9433; RMSE = 75.75 m3 ha−1; CV = 34.24%
** p < 0.01; n.s. = not significant; R2 = coefficient of determination; RMSE = root mean square error; CV = coefficient of variation.
Table 3. Statistical results of the ANCOVA leaching model (see the first table line for the equation). The coefficient estimates, their percentage variation with respect to the average slope, standard errors and their corresponding probabilities are shown. Summary of fit is also reported in the lower part of the table.
SOUT = α + (ε ± Δi) × WOUT
TermEstimateVariation (%)Standard Errorp
α = intercept (m3 ha−1)0.0000===
ε = average slope (kg m−3)0.2406100.000.0034**
ΔI (effects of Ions on ε)
 Mg2+−0.2068−85.950.0083**
 K+−0.1977−82.17**
 SO42−−0.1410−58.60**
 Ca2+−0.0984−40.90**
 Na+0.117548.84**
 NO30.136256.61**
 Cl0.3902162.18**
ΔGS (effects of Growing Season on ε)
 GS1−0.0337−14.010.0034**
 GS20.033714.01**
ΔGS*I (interaction effects on ε)
 GS1 * Cl−0.2259−93.890.0084**
 GS2 * Cl0.225993.89**
 GS1 * NO30.093238.740.0084**
 GS2 * NO3−0.0932−38.74**
ΔB (effects of Biochar on ε)
 B00.01496.190.0036**
 B1−0.0129−5.360.0039**
 B2−0.0021−0.870.0036n.s.
ΔB*I (interaction effects on ε)
 B0 * NO3−0.0188−7.810.0089n.s.
 B1 * NO3−0.0193−8.020.0087*
 B2 * NO30.038215.840.0088**
 B0 * Cl0.070529.300.0089**
 B1 * Cl−0.0258−10.720.0097**
 B2 * Cl−0.0447−18.580.0088**
R2 = 0.9660; RMSE = 18.85 m3 ha−1; CV = 36.46%
** p < 0.01; n.s. = not significant; R2 = coefficient of determination; RMSE = root mean square error; CV = coefficient of variation.

