Future Changes in Rice Bioclimatic Growing Conditions in Portugal


Abstract
1. Introduction
2. Materials and Methods
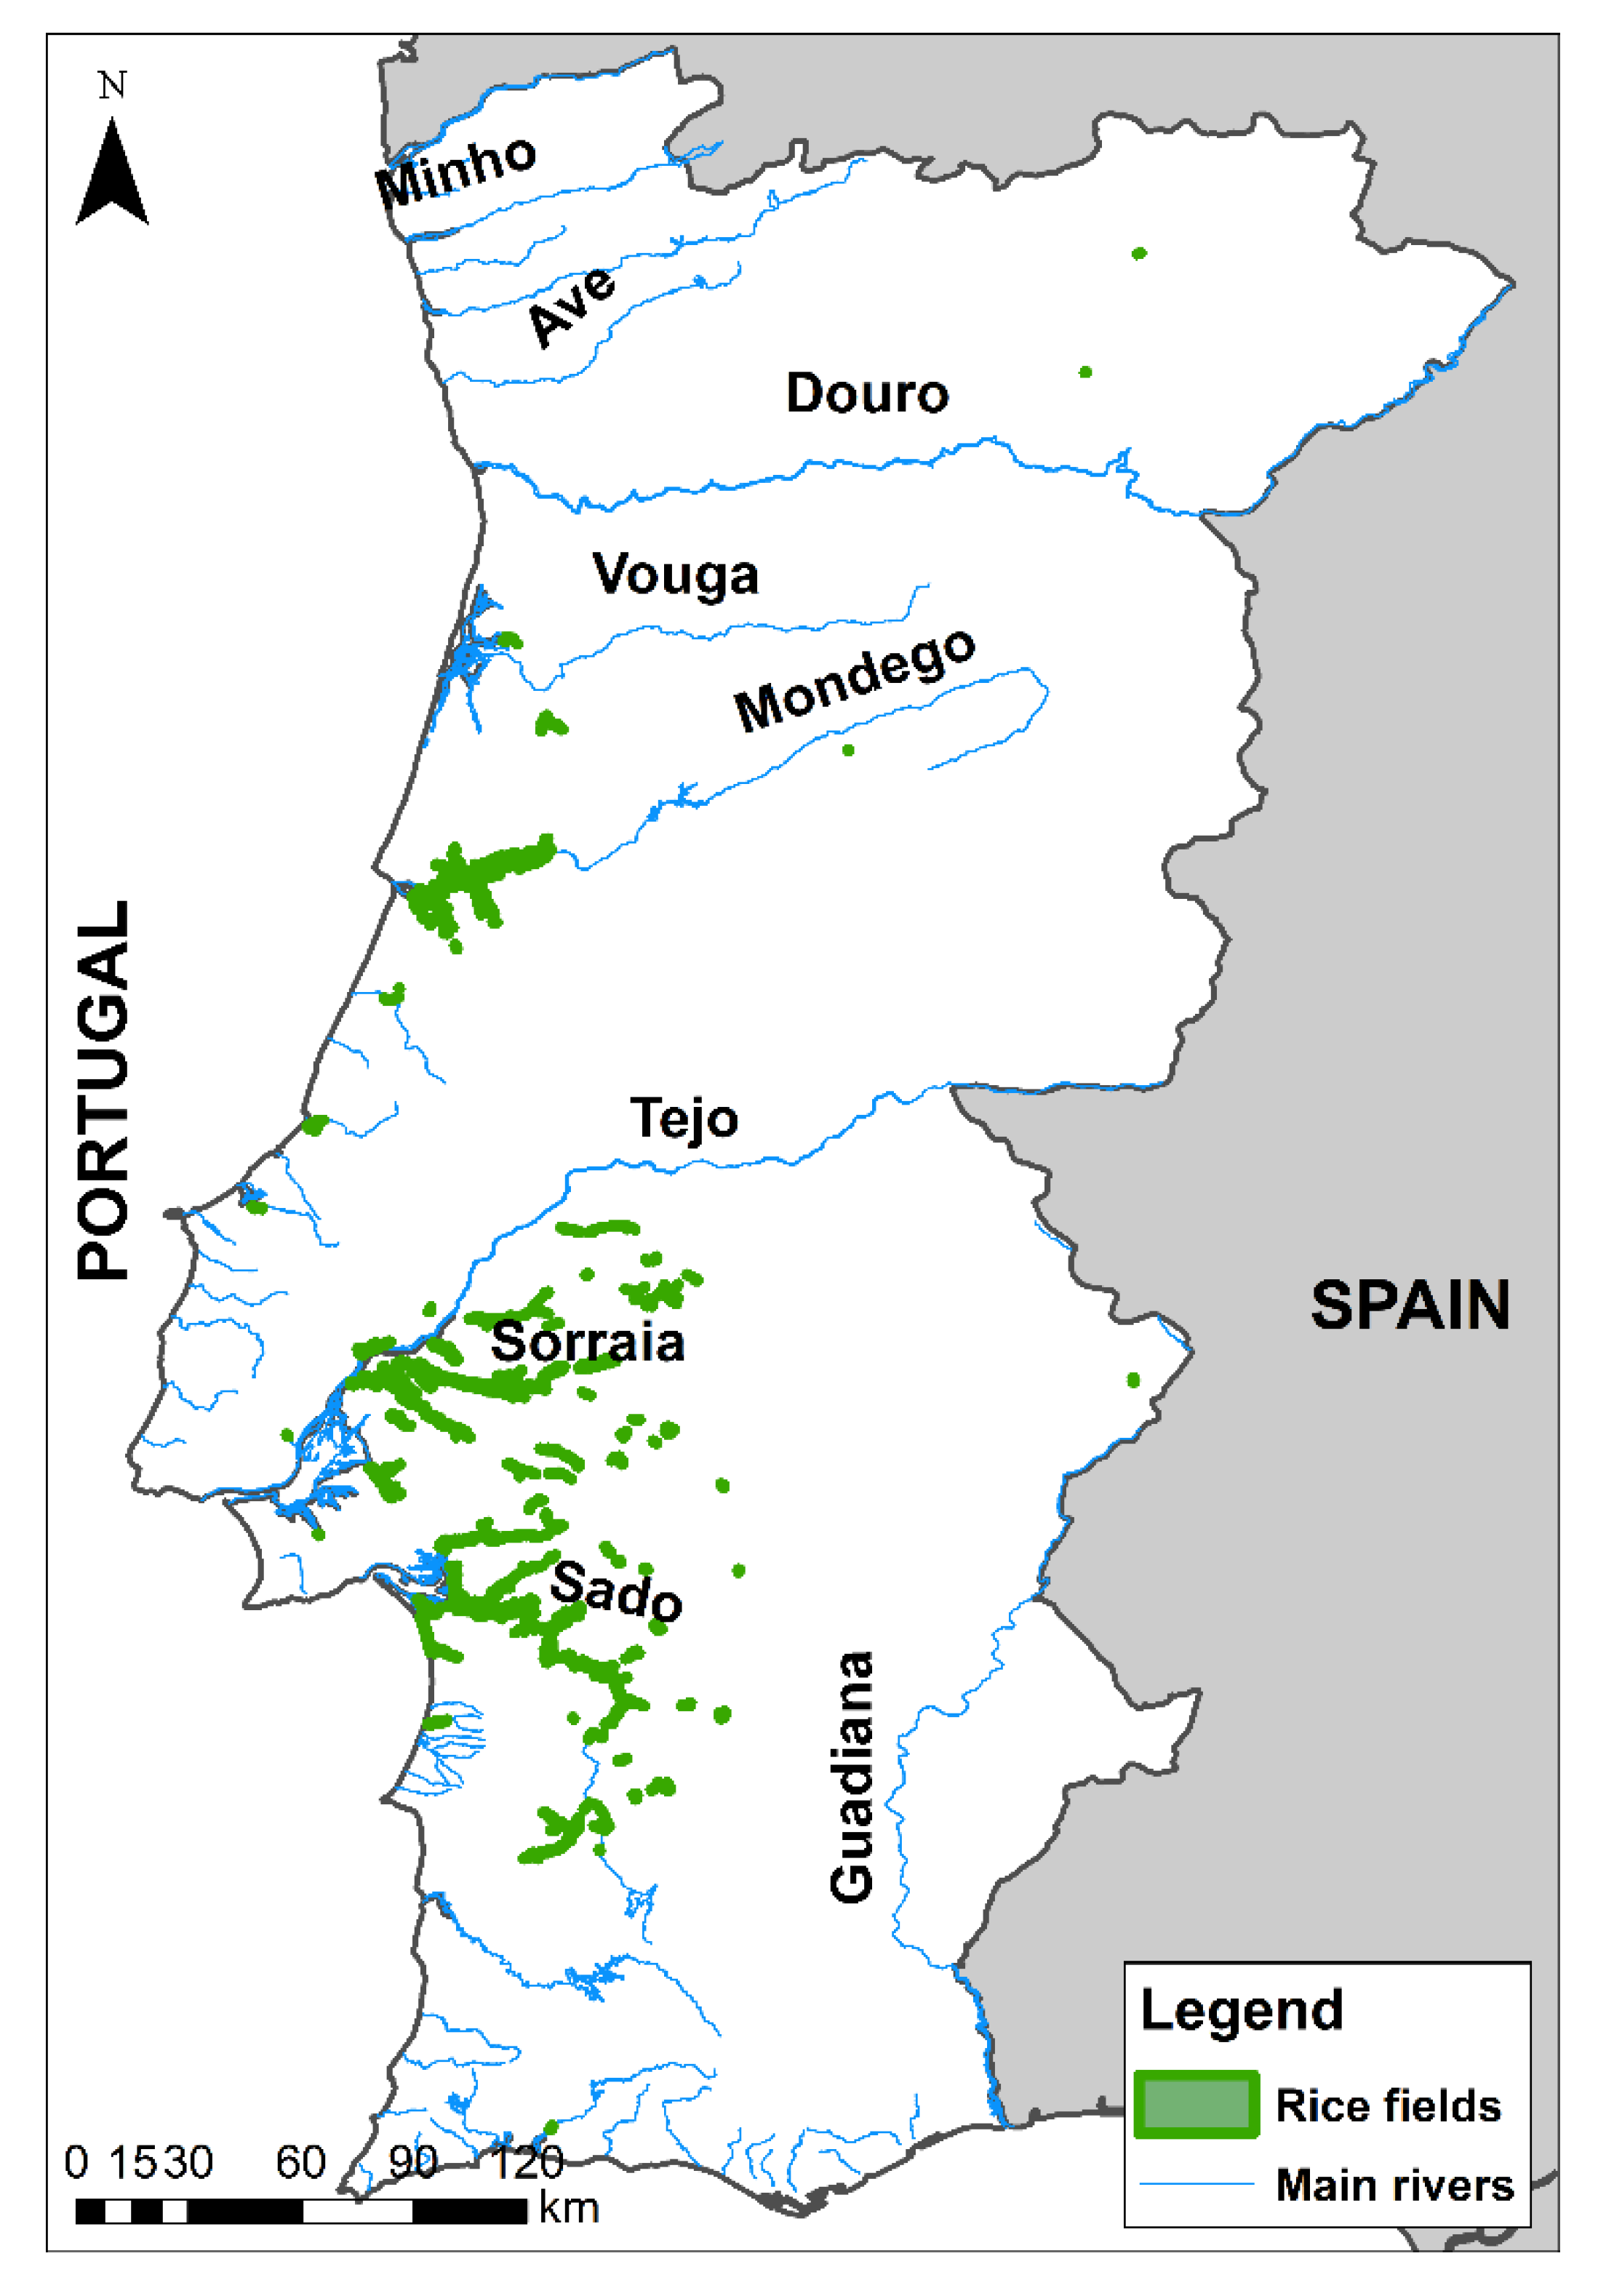
2.1. Rice Fields
2.2. Bioclimatic Datasets
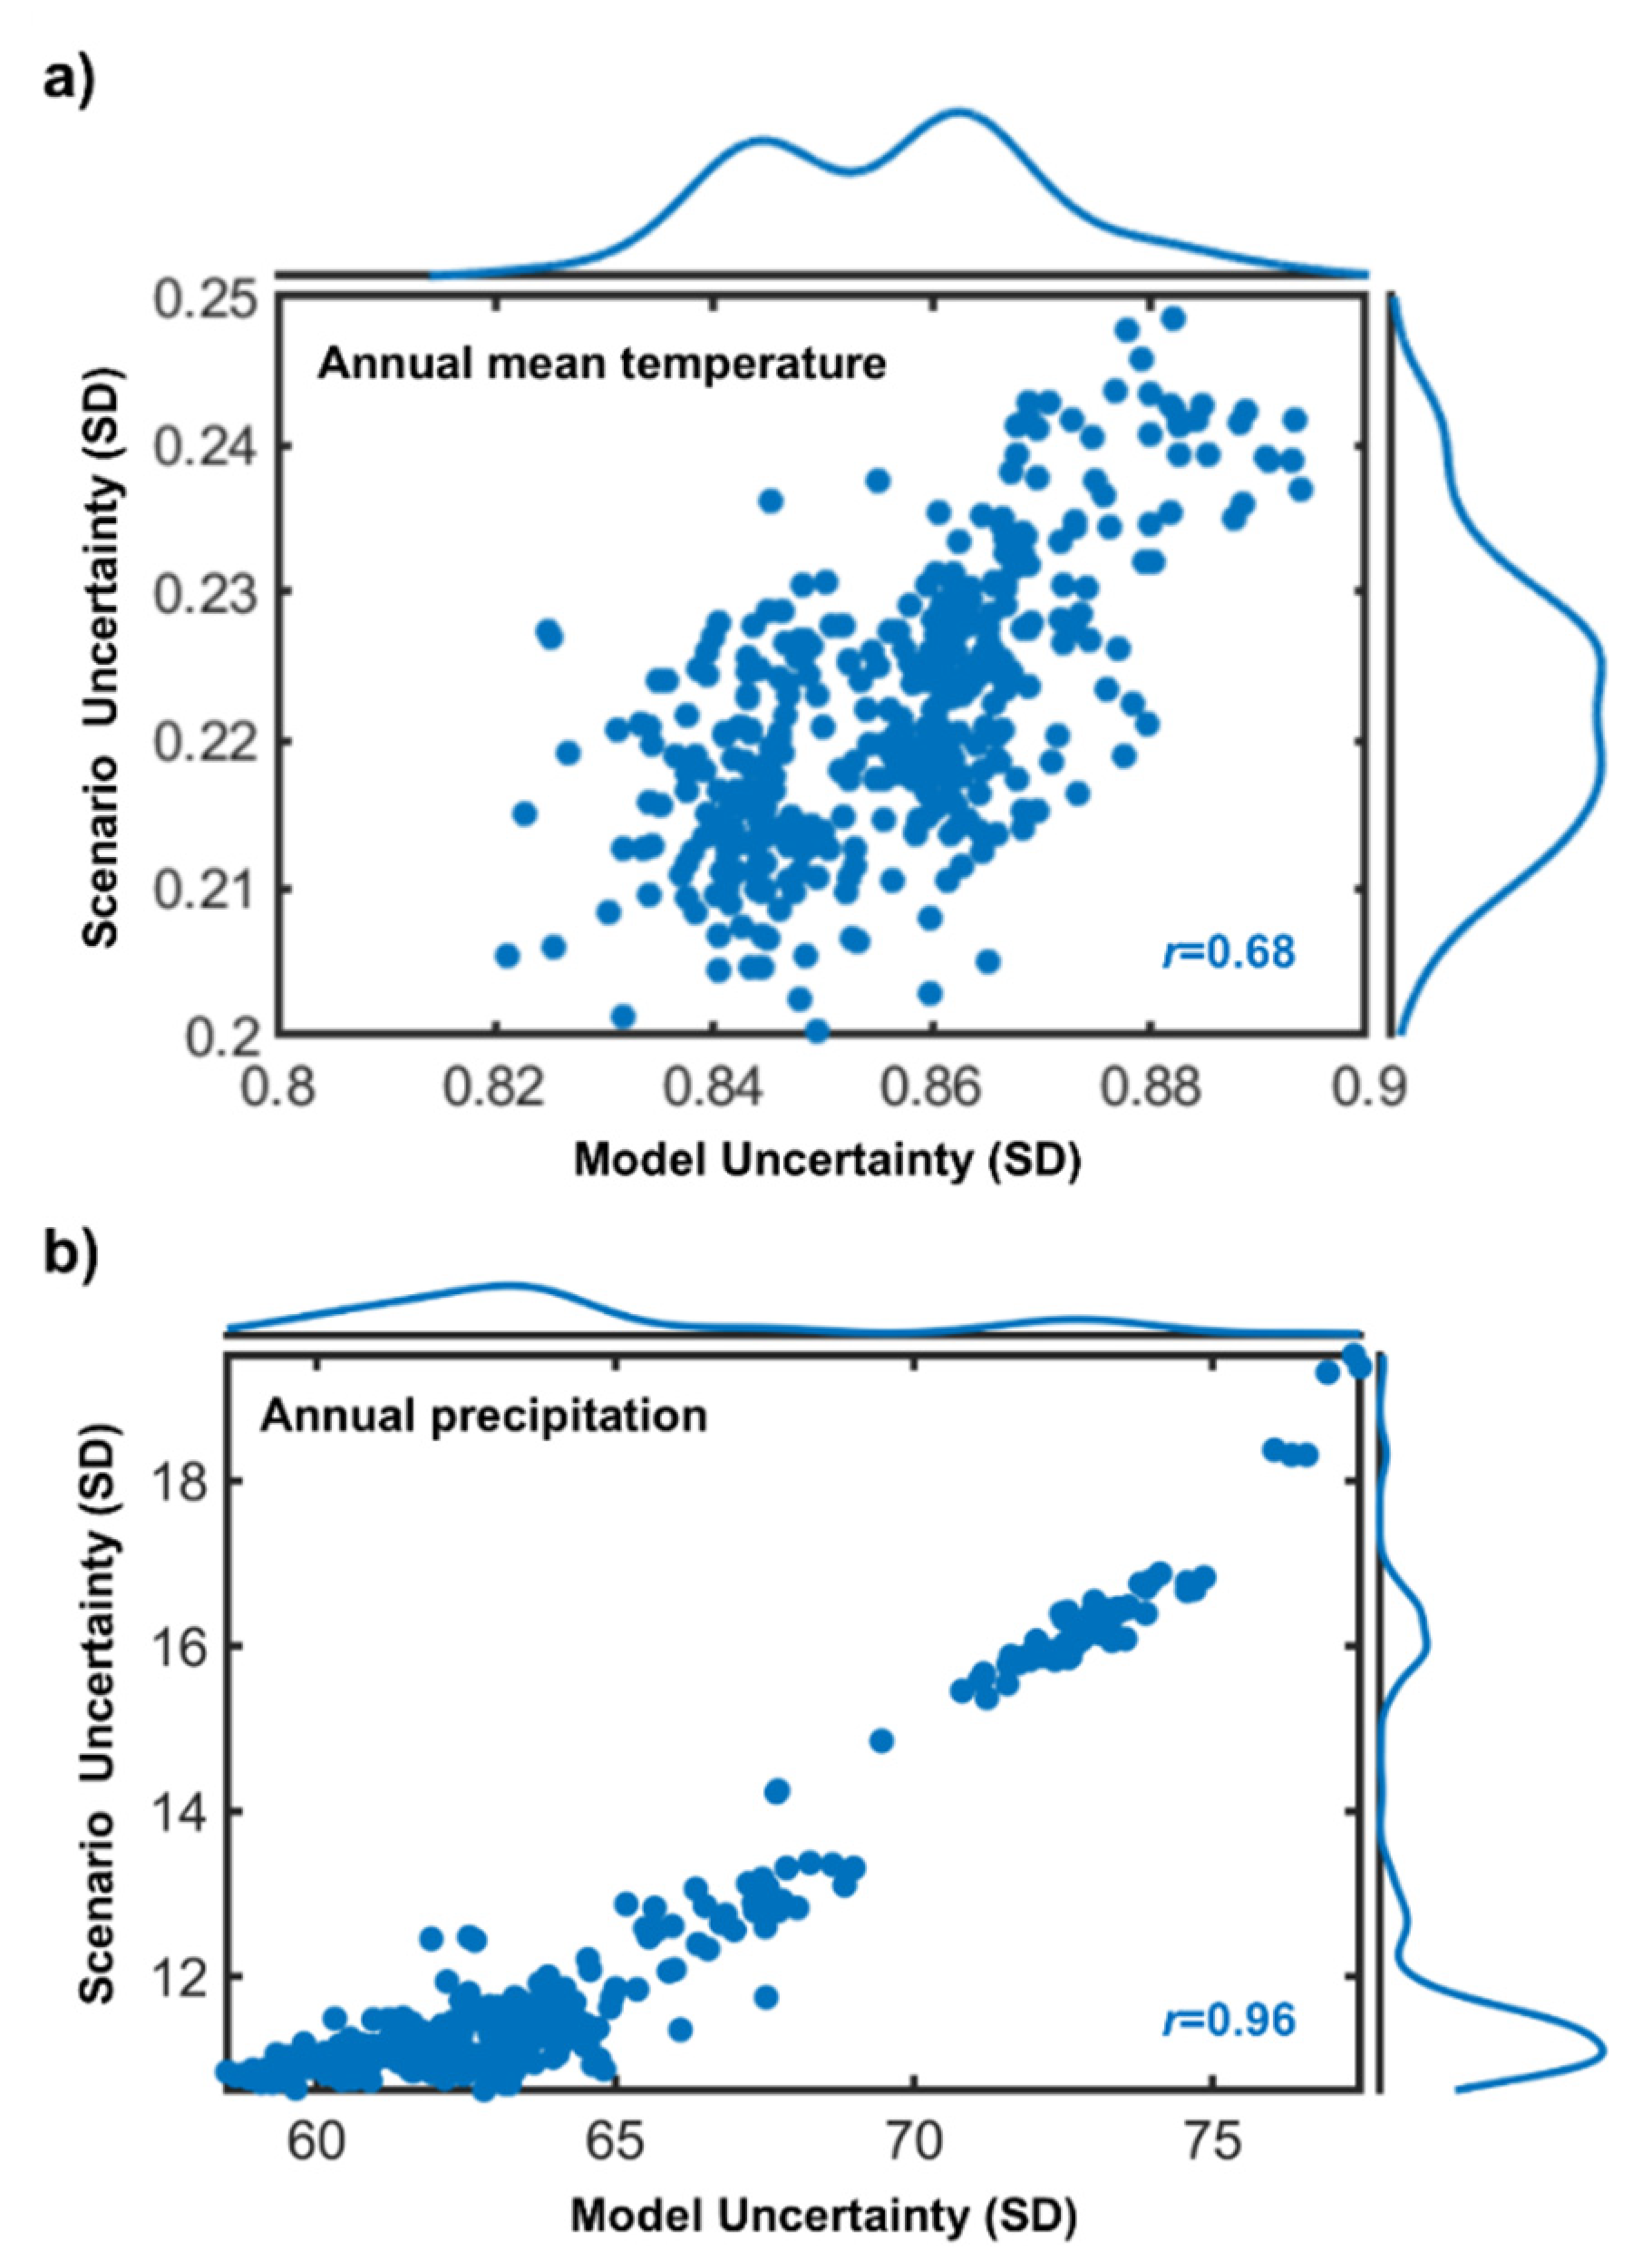
2.3. Uncertainty Measures (Model vs Scenario)
2.4. Combined Index
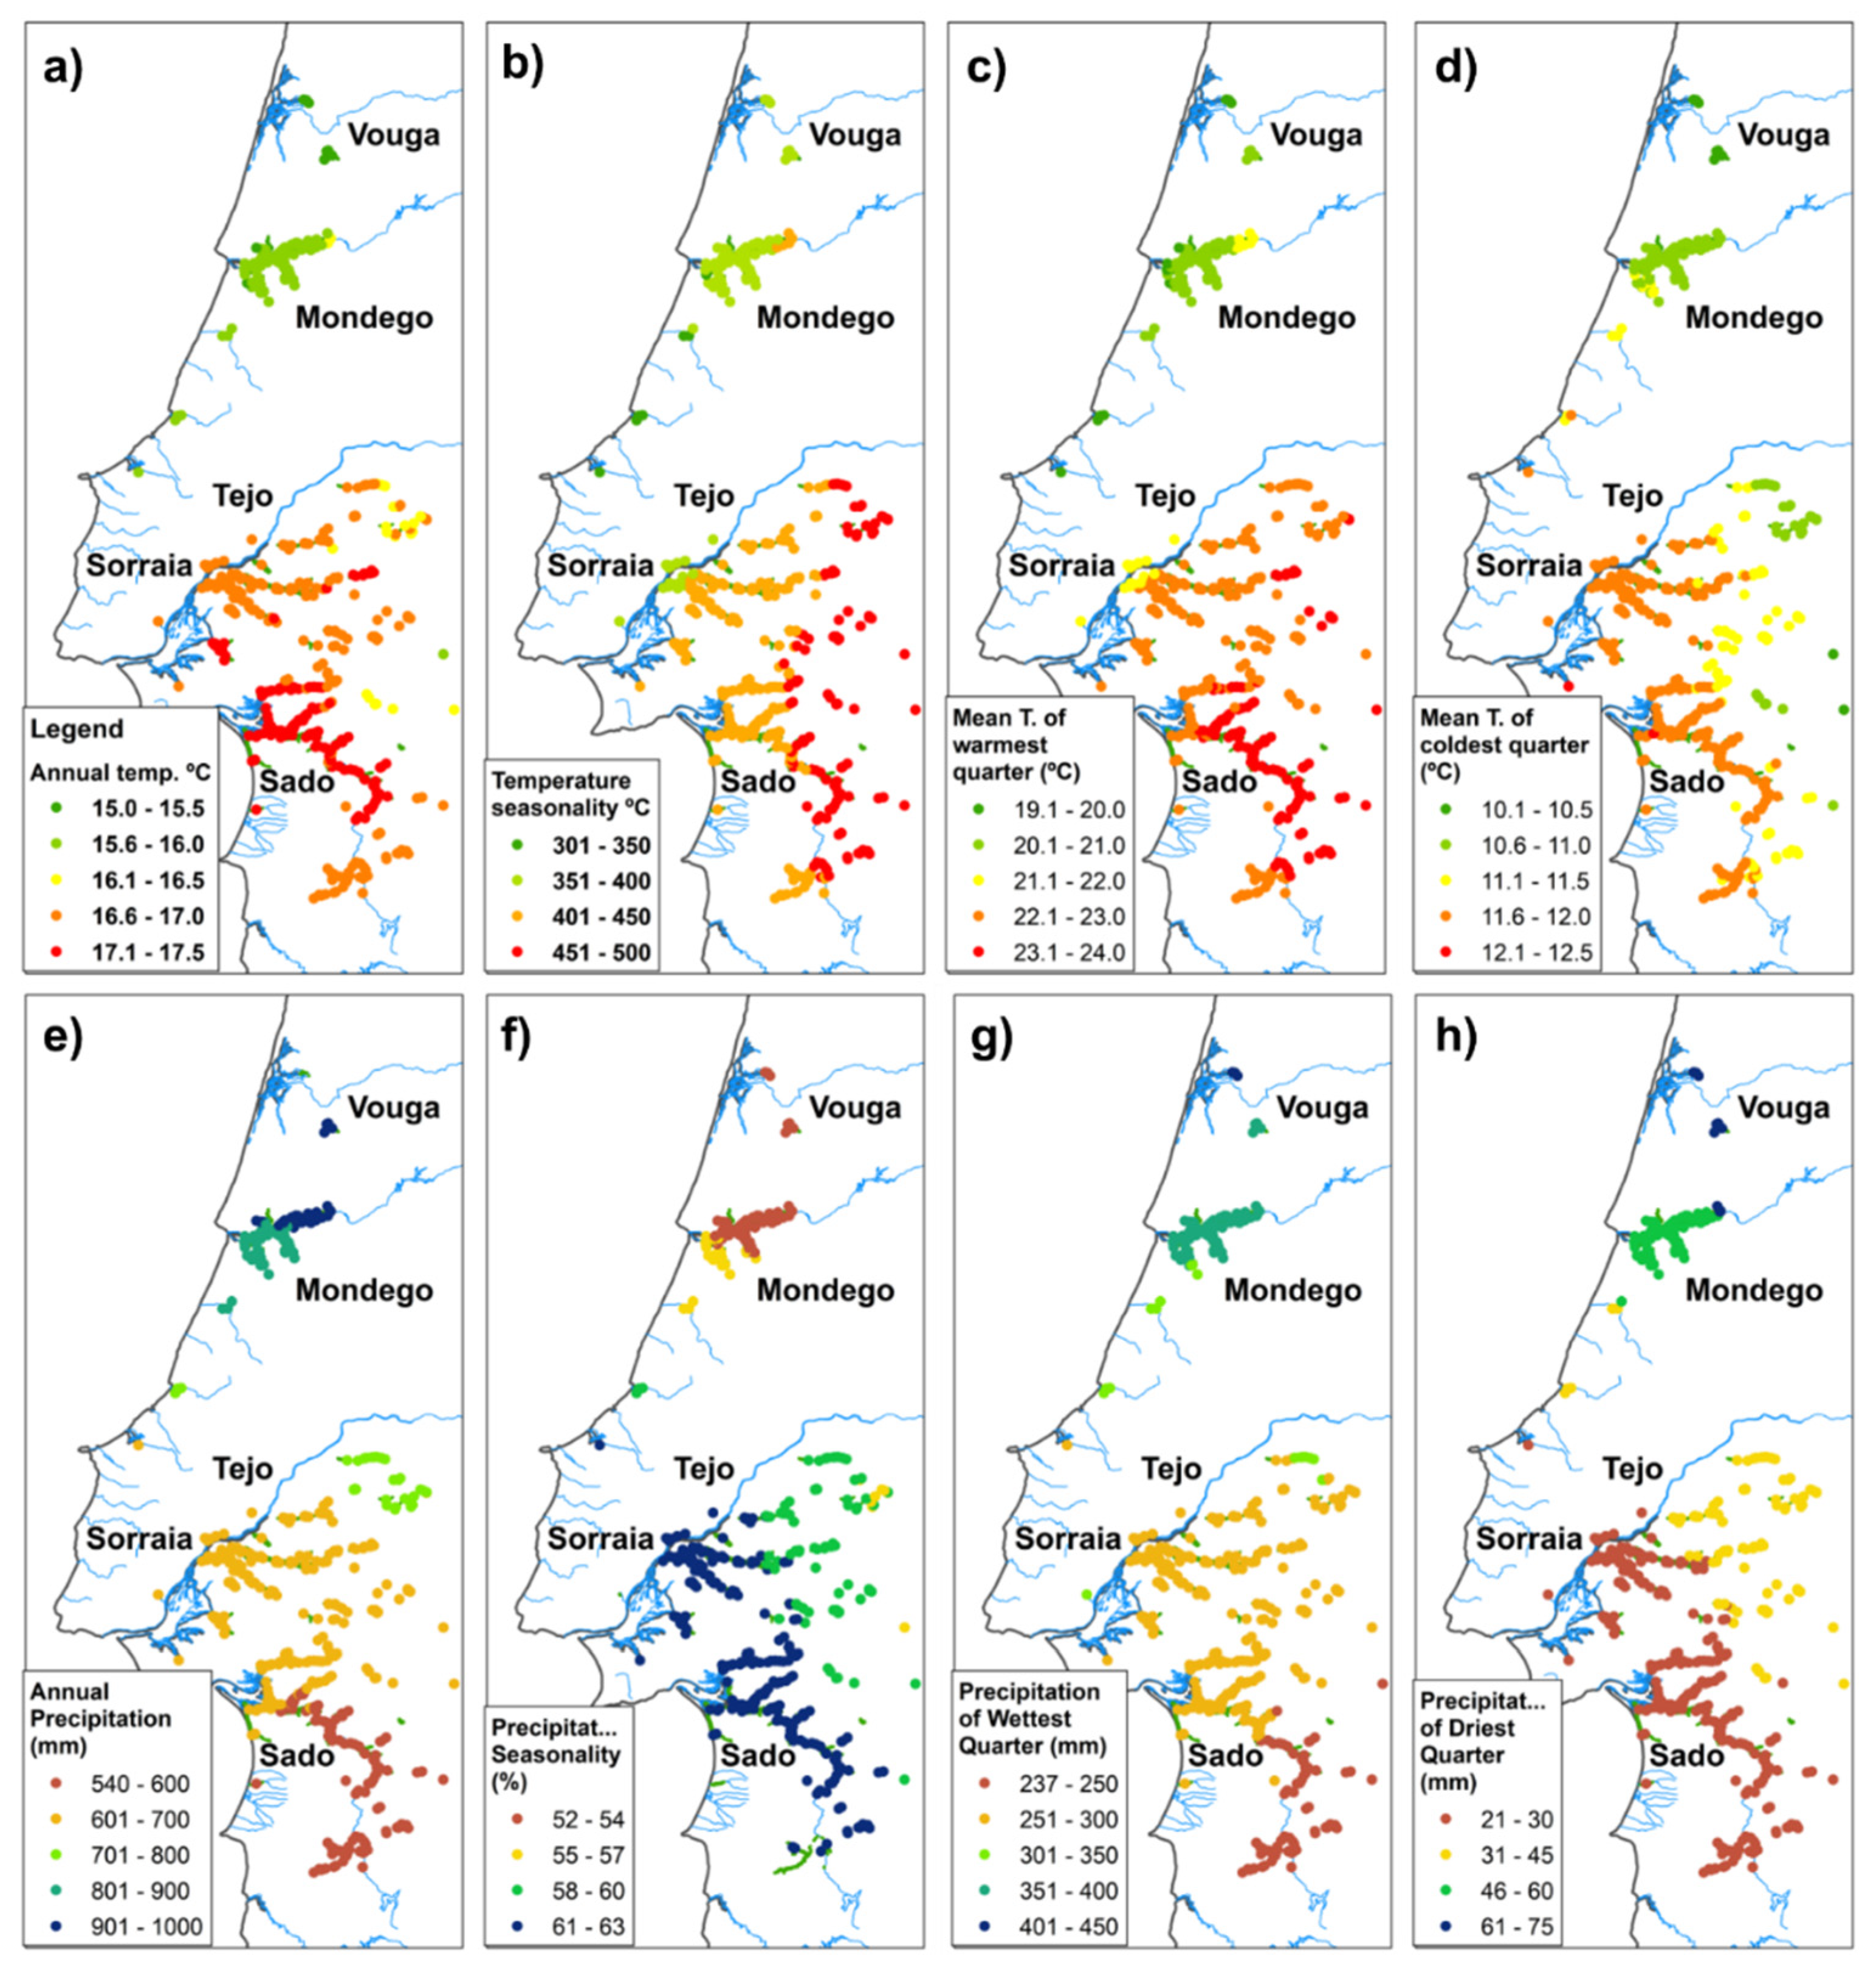
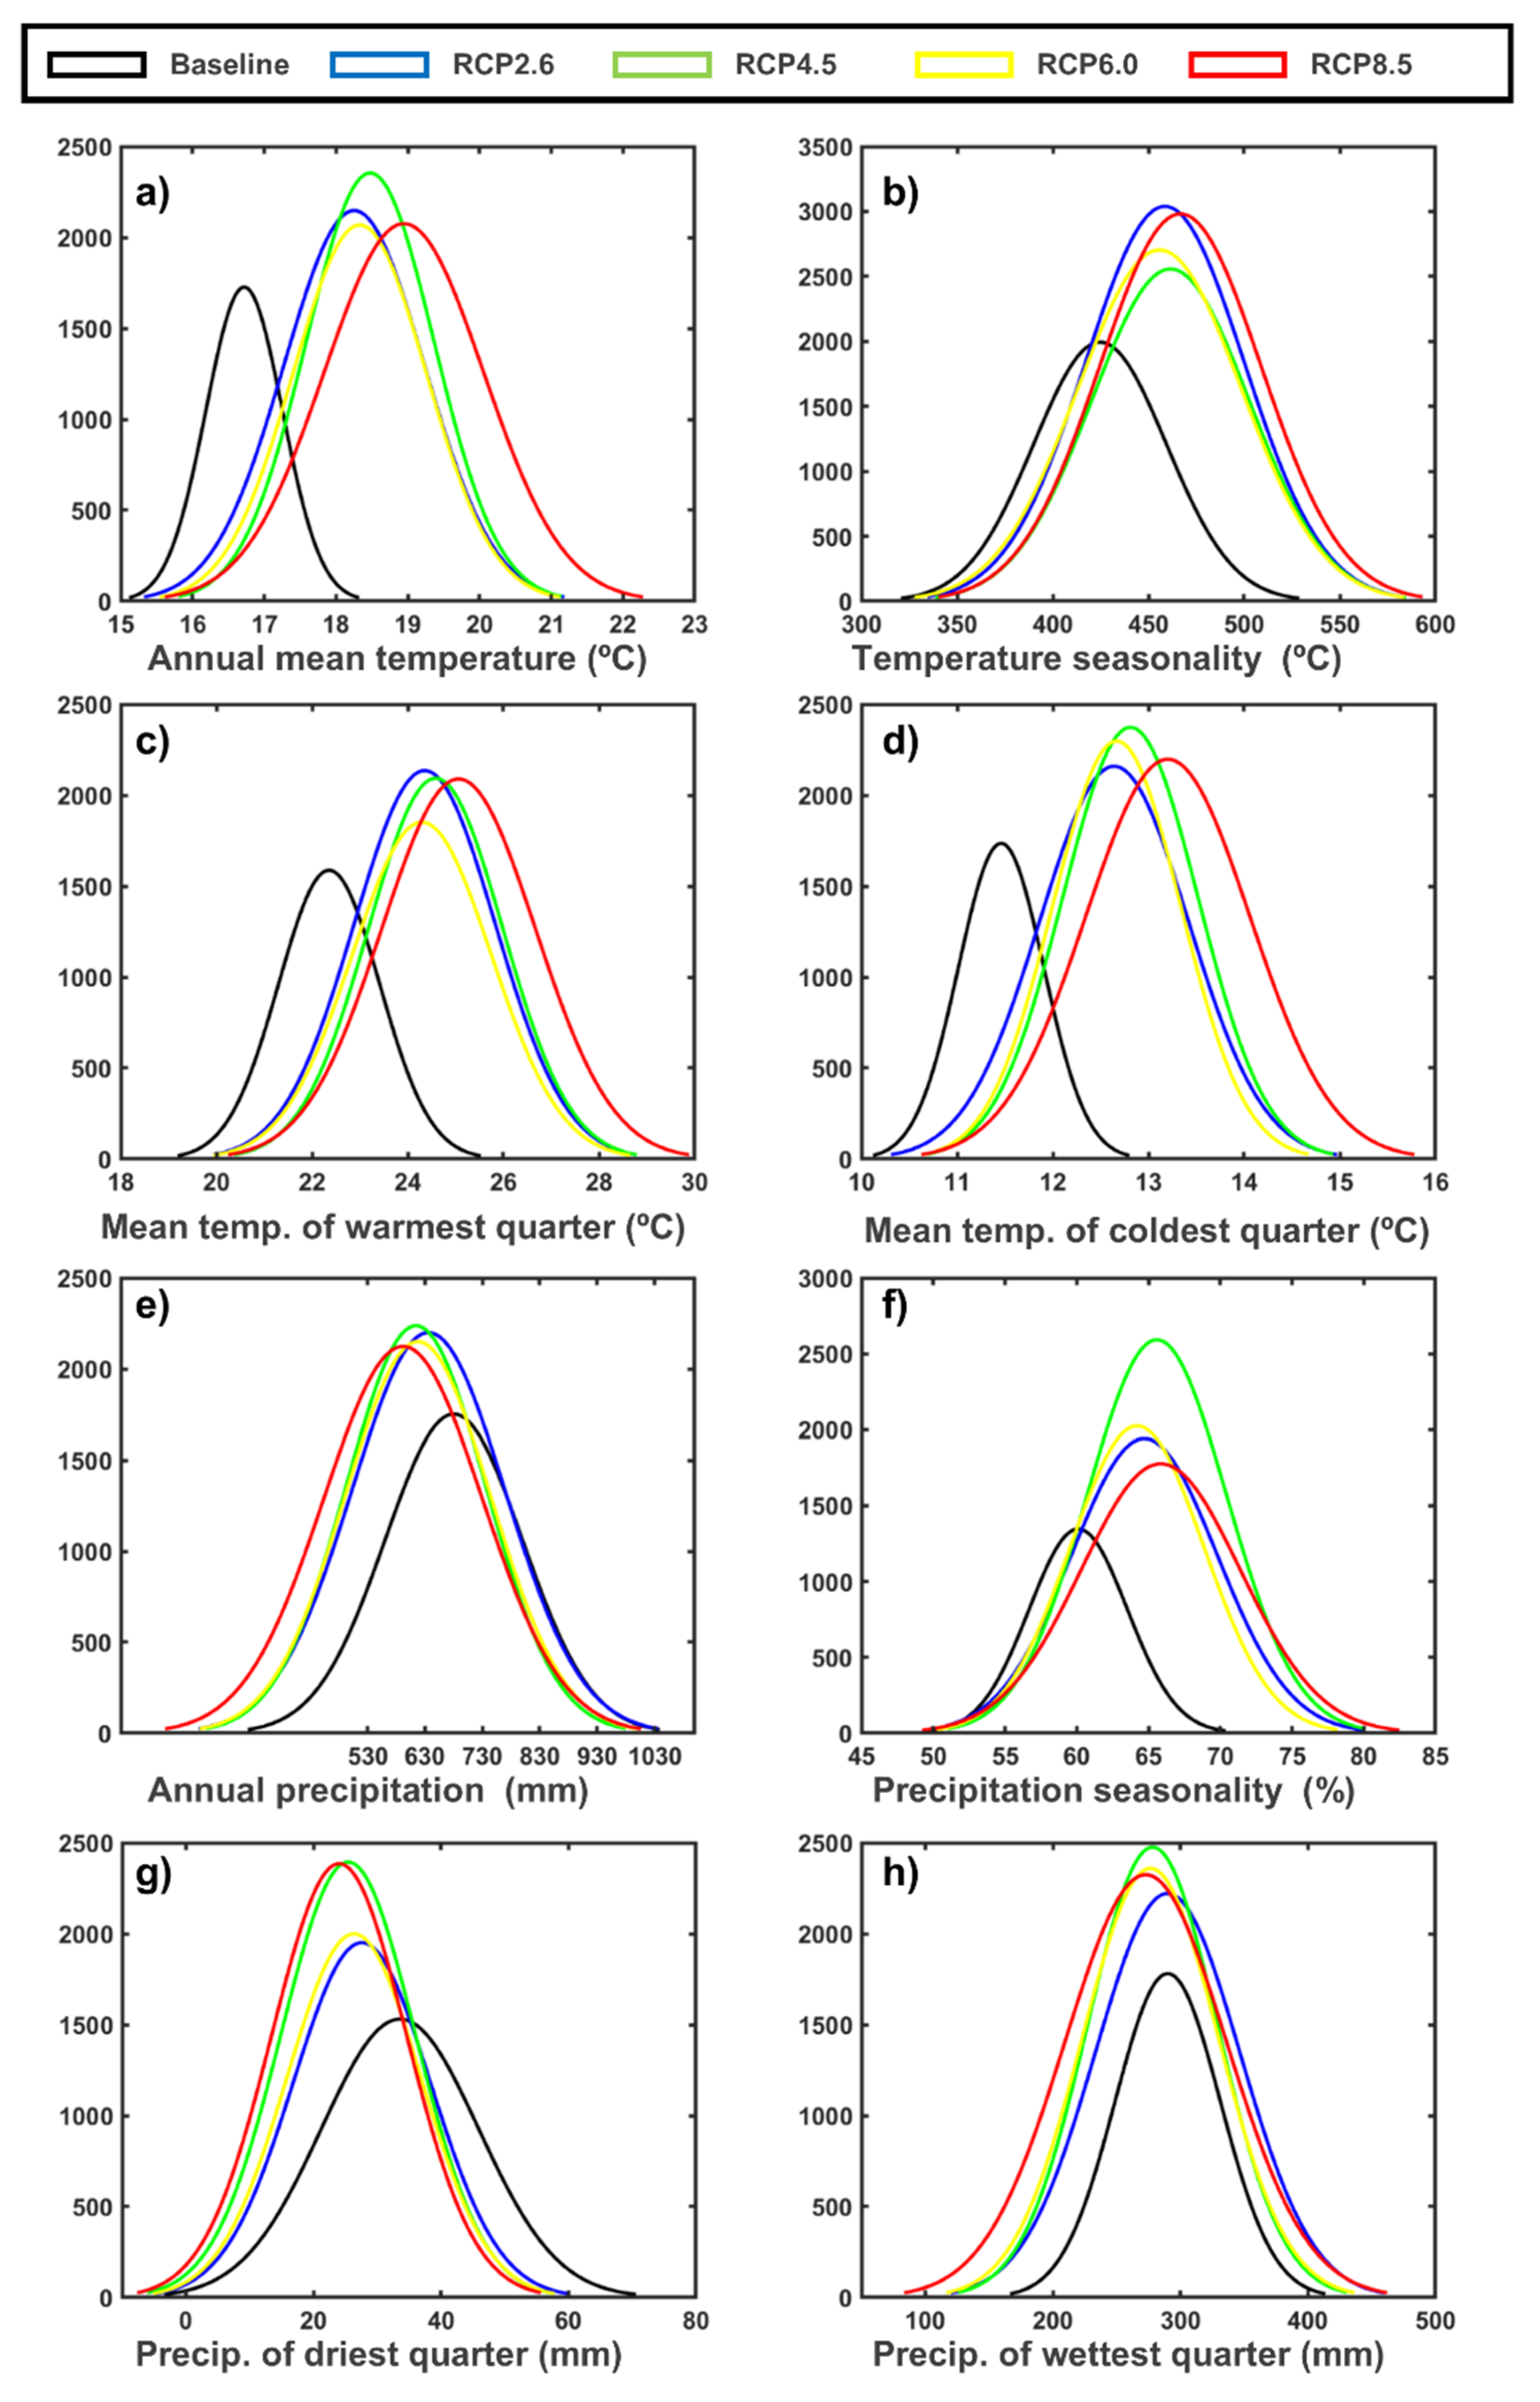
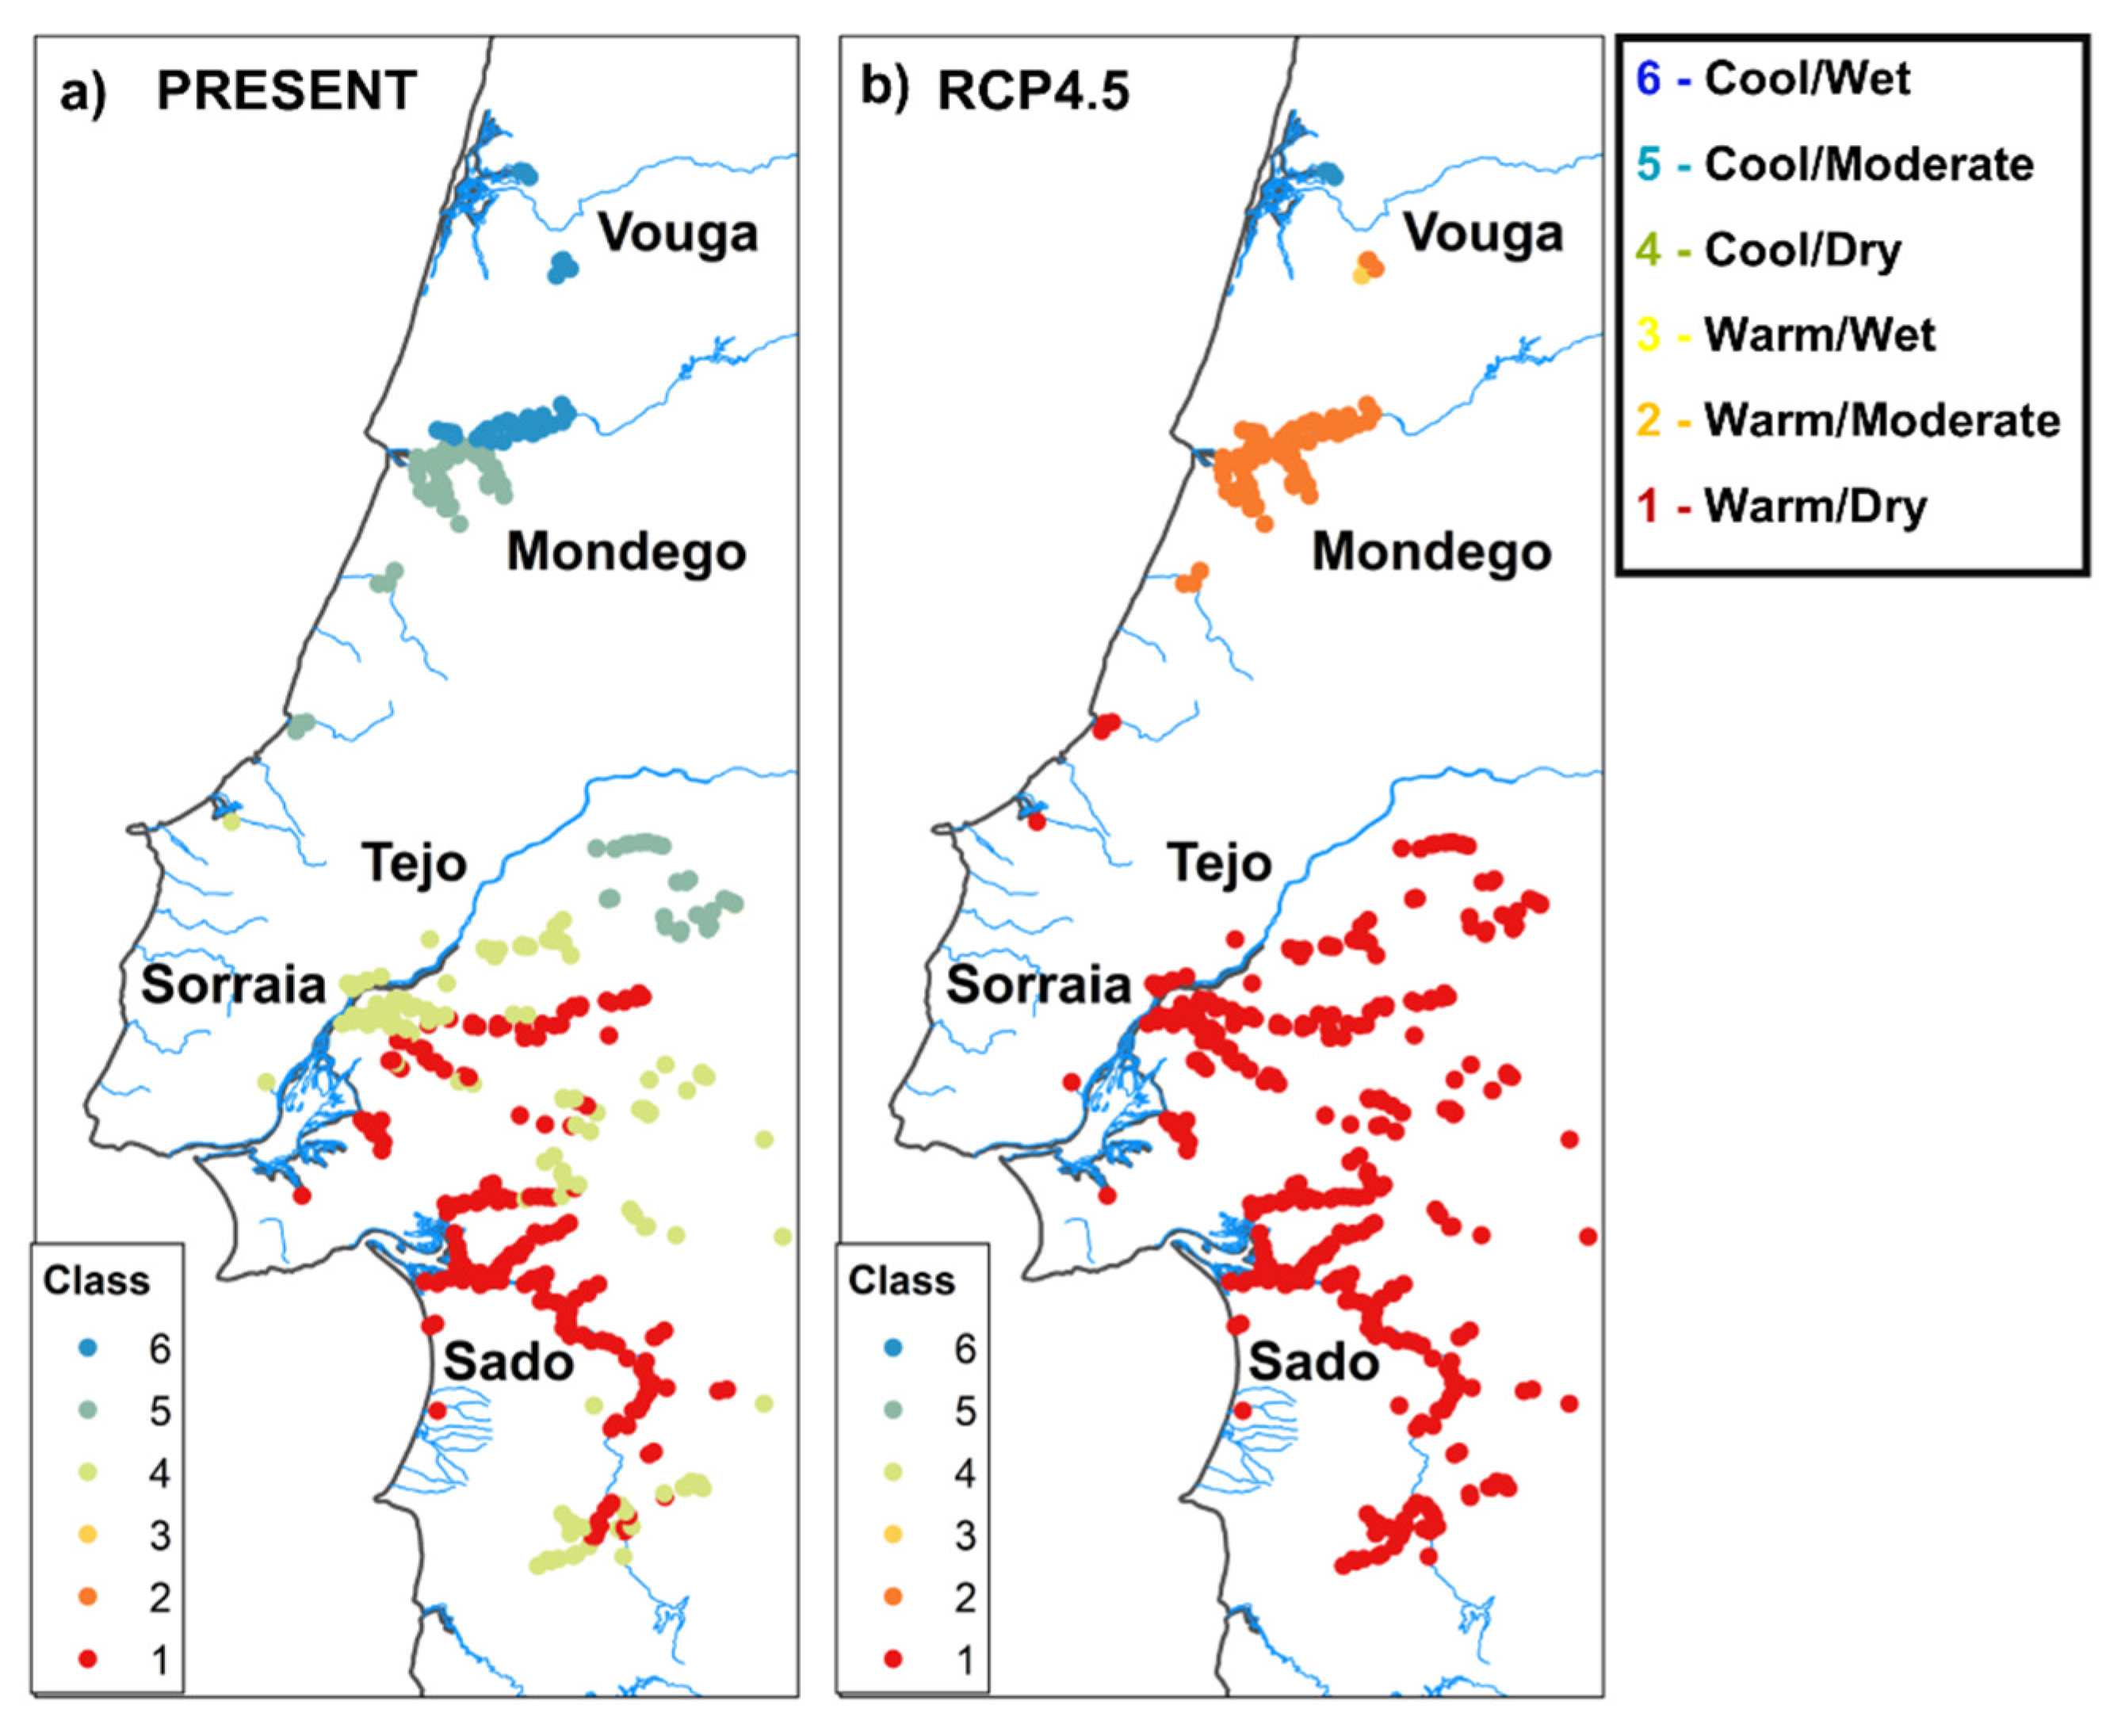
3. Results
4. Discussion
5. Conclusions
Author Contributions
Funding
Acknowledgments
Conflicts of Interest
References
- Arendt, E.K.; Zannini, E. 3-Rice. In Cereal Grains for the Food and Beverage Industries; Arendt, E.K., Zannini, E., Eds.; Woodhead Publishing: Sawston, UK, 2013; pp. 114–154. [Google Scholar] [CrossRef]
- FAOSTAT. Agricultural statistics—Crops. In Food and Agriculture Organization of the United Nations; FAOSTAT: Rome, Italy, 2019. [Google Scholar]
- INE. Main crops yield (kg/ha) by geographic localization (agrarian region) and specie. Annual; In Instituto Nacional de Estatística, I.P; INE: Mexico City, Mexico, 2019. [Google Scholar]
- USDA. Portuguese Rice Imports Pick up as Production Declines—USDA Gain Report; USDA: Washington, DC, USA, 2017; p. 13.
- Santos, T.; Lemos, D.; Brites, C.; Guine, R.P.F.; Correia, P.R. Contribution for the Characterisation of Carolino Rice Cultivars; Fundacion General Univ Politecnica Madrid: Madrid, Spain, 2014; pp. 79–84. [Google Scholar]
- Mota, C.; Coelho, M.; Nascimento, A.; Gueifao, S.; Coelho, I.; Cabral, M.; Torres, D.; Castanheira, I. The nutritional characterization of rice varieties consumed in portugal. Ann. Nutr. Metab. 2013, 63, 1509. [Google Scholar]
- Hatfield, J.L.; Prueger, J.H. Temperature extremes: Effect on plant growth and development. Weather Clim. Extremes 2015, 10, 4–10. [Google Scholar] [CrossRef]
- Wahid, A.; Gelani, S.; Ashraf, M.; Foolad, M.R. Heat tolerance in plants: An overview. Environ. Exp. Bot. 2007, 61, 199–223. [Google Scholar] [CrossRef]
- Matthews, R.B.; Kropff, M.J.; Horie, T.; Bachelet, D. Simulating the impact of climate change on rice production in Asia and evaluating options for adaptation. Agric. Syst. 1997, 54, 399–425. [Google Scholar] [CrossRef]
- Aggarwal, P.K.; Mall, R.K. Climate change and rice yields in diverse agro-environments of India. II. Effect of uncertainties in scenarios and crop models on impact assessment. Clim. Chang. 2002, 52, 331–343. [Google Scholar] [CrossRef]
- Yao, F.M.; Xu, Y.L.; Lin, E.D.; Yokozawa, M.; Zhang, J.H. Assessing the impacts of climate change on rice yields in the main rice areas of China. Clim. Chang. 2007, 80, 395–409. [Google Scholar] [CrossRef]
- Lal, M.; Singh, K.K.; Rathore, L.S.; Srinivasan, G.; Saseendran, S.A. Vulnerability of rice and wheat yields in NW India to future changes in climate. Agric. For. Meteorol. 1998, 89, 101–114. [Google Scholar] [CrossRef]
- Fraga, H.; Pinto, J.G.; Viola, F.; Santos, J.A. Climate change projections for olive yields in the Mediterranean Basin. Int. J. Clim. 2019. [Google Scholar] [CrossRef]
- Costa, R.; Fraga, H.; Fonseca, A.; de Cortazar-Atauri, I.G.; Val, M.C.; Carlos, C.; Reis, S.; Santos, J.A. Grapevine phenology of cv. touriga franca and touriga nacional in the Douro wine region: Modelling and climate change projections. Agronomy 2019, 9, 210. [Google Scholar] [CrossRef]
- Fraga, H.; García de Cortázar Atauri, I.; Santos, J.A. Viticultural irrigation demands under climate change scenarios in Portugal. Agric. Water Manag. 2018, 196, 66–74. [Google Scholar] [CrossRef]
- Yang, C.Y.; Fraga, H.; van Ieperen, W.; Trindade, H.; Santos, J.A. Effects of climate change and adaptation options on winter wheat yield under rainfed Mediterranean conditions in southern Portugal. Clim. Chang. 2019, 154, 159–178. [Google Scholar] [CrossRef]
- Yang, C.Y.; Fraga, H.; van Ieperen, W.; Santos, J.A. Modelling climate change impacts on early and late harvest grassland systems in Portugal. Crop Pasture Sci. 2018, 69, 821–836. [Google Scholar] [CrossRef]
- Ferreira, D.; Simoes, M.; Reboredo, F.; Pessoa, F.; Almeida, A.S.; Daradzhanska, I.; Lidon, F. Effects of climate change (precipitation variations), on rice crop yields in alluvial plains of the Tejo and Sado rivers. Emir. J. Food Agric. 2018, 30, 488–495. [Google Scholar] [CrossRef]
- Santos, J.A.; Costa, R.; Fraga, H. Climate change impacts on thermal growing conditions of main fruit species in Portugal. Clim. Chang. 2017, 140, 273–286. [Google Scholar] [CrossRef]
- IPCC. Climate Change 2013: The Physical Science Basis. Summary for Policymakers. Working Group I Contribution to the IPCC Fifth Assessment Report; IPCC: Geneva, Switzerland, 2013. [Google Scholar]
- Nagarajan, S.; Jagadish, S.V.K.; Prasad, A.S.H.; Thomar, A.K.; Anand, A.; Pal, M.; Agarwal, P.K. Local climate affects growth, yield and grain quality of aromatic and non-aromatic rice in northwestern India. Agric. Ecosyst. Environ. 2010, 138, 274–281. [Google Scholar] [CrossRef]
- Wassmann, R.; Jagadish, S.V.K.; Heuer, S.; Ismail, A.; Redona, E.; Serraj, R.; Singh, R.K.; Howell, G.; Pathak, H.; Sumfleth, K. Climate change affecting rice production: The physiological and agronomic basis for possible adaptation strategies. Adv. Agron. 2009, 101, 59–122. [Google Scholar] [CrossRef]
- IPCC. Climate Change 2001: Synthesis Report. A Contribution of Working Groups I, II, III to the Third Assessment Report of the Intergovernmental Panel on Climate Change; Watson, R.T., the Core Team, Eds.; Cambridge University Press: Cambridge, UK, 2001. [Google Scholar]
- Caetano, M.; Mata, F.; Freire, S. Accuracy assessment of the Portuguese CORINE land cover map. Glob. Dev. Environ. Earth Obs. Space 2006, 459–467. [Google Scholar]
- Hijmans, R.J.; Cameron, S.E.; Parra, J.L.; Jones, P.G.; Jarvis, A. Very high resolution interpolated climate surfaces for global land areas. Int. J. Clim. 2005, 25, 1965–1978. [Google Scholar] [CrossRef]
- Fraga, H.; Malheiro, A.C.; Moutinho-Pereira, J.; Jones, G.V.; Alves, F.; Pinto, J.G.; Santos, J.A. Very high resolution bioclimatic zoning of Portuguese wine regions: Present and future scenarios. Reg. Environ. Chang. 2014, 14, 295–306. [Google Scholar] [CrossRef]
- IPCC. Climate Change 2013: The Physical Science Basis. Contribution of Working Group I to the Fifth Assessment Report of the Intergovernmental Panel on Climate Change; Stocker, T.F., Qin, D., Plattner, G.-K., Tignor, M.M.B., Allen, S.K., Boschung, J., Nauels, A., Xia, Y., Bex, V., Midgley, P.M., Eds.; Cambridge University Press: Cambridge, UK; New York, NY, USA, 2013; p. 1535. [Google Scholar]
- Deser, C.; Phillips, A.; Bourdette, V.; Teng, H.Y. Uncertainty in climate change projections: The role of internal variability. Clim. Dyn. 2012, 38, 527–546. [Google Scholar] [CrossRef]
- Hay, L.E.; Wilby, R.J.L.; Leavesley, G.H. A comparison of delta change and downscaled GCM scenarios for three mountainous basins in the United States. J. Am. Water Resour. Assoc. 2000, 36, 387–397. [Google Scholar] [CrossRef]
- Xin, X.G.; Zhang, L.; Zhang, J.; Wu, T.W.; Fang, Y.J. Climate change projections over east Asia with BCC_CSM1.1 climate model under RCP scenarios. J. Meteorol. Soc. Jpn. 2013, 91, 413–429. [Google Scholar] [CrossRef]
- Shields, C.A.; Bailey, D.A.; Danabasoglu, G.; Jochum, M.; Kiehl, J.T.; Levis, S.; Park, S. The low-resolution CCSM4. J. Clim. 2012, 25, 3993–4014. [Google Scholar] [CrossRef]
- Schmidt, G.A.; Kelley, M.; Nazarenko, L.; Ruedy, R.; Russell, G.L.; Aleinov, I.; Bauer, M.; Bauer, S.E.; Bhat, M.K.; Bleck, R.; et al. Configuration and assessment of the GISS ModelE2 contributions to the CMIP5 archive. J. Adv. Model. Earth Syst. 2014, 6, 141–184. [Google Scholar] [CrossRef]
- Baek, H.J.; Lee, J.; Lee, H.S.; Hyun, Y.K.; Cho, C.; Kwon, W.T.; Marzin, C.; Gan, S.Y.; Kim, M.J.; Choi, D.H.; et al. Climate change in the 21st century simulated by HadGEM2-AO under representative concentration pathways. Asia Pac. J. Atmos. Sci. 2013, 49, 603–618. [Google Scholar] [CrossRef]
- Jones, C.D.; Hughes, J.K.; Bellouin, N.; Hardiman, S.C.; Jones, G.S.; Knight, J.; Liddicoat, S.; O’Connor, F.M.; Andres, R.J.; Bell, C.; et al. The HadGEM2-ES implementation of CMIP5 centennial simulations. Geosci. Model Dev. 2011, 4, 543–570. [Google Scholar] [CrossRef]
- Persechino, A.; Mignot, J.; Swingedouw, D.; Labetoulle, S.; Guilyardi, E. Decadal predictability of the Atlantic meridional overturning circulation and climate in the IPSL-CM5A-LR model. Clim. Dyn. 2013, 40, 2359–2380. [Google Scholar] [CrossRef]
- Watanabe, S.; Hajima, T.; Sudo, K.; Nagashima, T.; Takemura, T.; Okajima, H.; Nozawa, T.; Kawase, H.; Abe, M.; Yokohata, T.; et al. MIROC-ESM 2010: Model description and basic results of CMIP5-20c3m experiments. Geosci. Model Dev. 2011, 4, 845–872. [Google Scholar] [CrossRef]
- Watanabe, M.; Suzuki, T.; O’ishi, R.; Komuro, Y.; Watanabe, S.; Emori, S.; Takemura, T.; Chikira, M.; Ogura, T.; Sekiguchi, M.; et al. Improved climate simulation by MIROC5. mean states, variability, and climate sensitivity. J. Clim. 2010, 23, 6312–6335. [Google Scholar] [CrossRef]
- Yukimoto, S.; Adachi, Y.; Hosaka, M.; Sakami, T.; Yoshimura, H.; Hirabara, M.; Tanaka, T.Y.; Shindo, E.; Tsujino, H.; Deushi, M.; et al. A new global climate model of the meteorological research institute: MRI-CGCM3-model description and basic performance. J. Meteorol. Soc. Jpn. 2012, 90, 23–64. [Google Scholar] [CrossRef]
- Bentsen, M.; Bethke, I.; Debernard, J.B.; Iversen, T.; Kirkevag, A.; Seland, O.; Drange, H.; Roelandt, C.; Seierstad, I.A.; Hoose, C.; et al. The Norwegian earth system model, NorESM1-M—Part 1: Description and basic evaluation of the physical climate. Geosci. Model Dev. 2013, 6, 687–720. [Google Scholar] [CrossRef]
- Wassmann, R.; Jagadish, S.V.K.; Sumfleth, K.; Pathak, H.; Howell, G.; Ismail, A.; Serraj, R.; Redona, E.; Singh, R.K.; Heuer, S. Regional vulnerability of climate change impacts on asian rice production and scope for adaptation. In Advances in Agronomy; Sparks, D.L., Ed.; Elsevier Academic Press Inc: San Diego, CA, USA, 2009; Volume 102, pp. 91–133. [Google Scholar] [CrossRef]
- Jagadish, S.V.K.; Craufurd, P.Q.; Wheeler, T.R. Phenotyping parents of mapping populations of rice for heat tolerance during anthesis. Crop Sci. 2008, 48, 1140–1146. [Google Scholar] [CrossRef]
- Figueiredo, N.; Carranca, C.; Trindade, H.; Pereira, J.; Goufo, P.; Coutinho, J.; Marques, P.; Maricato, R.; de Varennes, A. Elevated carbon dioxide and temperature effects on rice yield, leaf greenness, and phenological stages duration. Paddy Water Environ. 2015, 13, 313–324. [Google Scholar] [CrossRef]
- Ainsworth, E.A. Rice production in a changing climate: A meta-analysis of responses to elevated carbon dioxide and elevated ozone concentration. Glob. Chang. Biol. 2008, 14, 1642–1650. [Google Scholar] [CrossRef]
- Nishiyama, I.; Yoshida, S.; Coronel, V. Effect of Calcium peroxide on rice seedling emergence from floodwater at high-temperatures—Varietal difference. JARQ Jpn. Agric. Res. Q. 1980, 14, 60–61. [Google Scholar]
- Moffat, A.S. Plant genetics—Finding new ways to protect drought-stricken plants. Science 2002, 296, 1226–1229. [Google Scholar] [CrossRef] [PubMed]
- Weerakoon, W.M.W.; Maruyama, A.; Ohba, K. Impact of humidity on temperature-induced grain sterility in rice (Oryza sativa L.). J. Agron. Crop Sci. 2008, 194, 135–140. [Google Scholar] [CrossRef]


| Ref | Bio Climatic Index | Description |
|---|---|---|
| Tannual | Annual Mean Temperature (°C) | Average temperature over 12 months |
| Tseason | Temperature Seasonality (°C) | Standard deviation of the 12 mean monthly temperature values, multiplied by 100 (Standard deviation *100) |
| Twarm | Mean Temperature of Warmest Quarter (°C) | The warmest quarter of the year is firstly identified followed by the calculation of the average temperature for the 3 months in the warmest quarter |
| Tcold | Mean Temperature of Coldest Quarter (°C) | Same as Twarm but for the coldest quarter |
| Pannual | Annual Precipitation (mm) | Sum of the precipitation of each of the 12 months in a year |
| Pseason | Precipitation Seasonality (%) | Coefficient of variation of the 12 monthly precipitations |
| Pwet | Precipitation of Wettest Quarter (mm) | The wettest quarter of the year is firstly identified followed by the calculation of the precipitation for the 3 months in the wettest quarter |
| Pdry | Precipitation of Driest Quarter (mm) | Same as Pwet but for the driest quarter |
| GCM | Institution | References |
|---|---|---|
| BCC-CSM1-1 | Beijing Climate Center Climate System Model | [30] |
| CCSM4 | National Center for Atmospheric Research | [31] |
| GISS-E2-R | National Aeronautics and Space Administration | [32] |
| HadGEM2-AO | UK Met Office | [33] |
| HadGEM2-ES | UK Met Office | [34] |
| IPSL-CM5A-LR | IPSL Climate Modeling Center | [35] |
| MIROC-ESM-CHEM | Japan Agency for Marine-Earth Science and Technology | [36] |
| MIROC-ESM | Japan Agency for Marine-Earth Science and Technology | [36] |
| MIROC5 | Japan Agency for Marine-Earth Science and Technology | [37] |
| MRI-CGCM3 | Meteorological Research Institute | [38] |
| NorESM1-M | Norwegian Climate Centre | [39] |
| Annual Mean temp. (°C). | Annual Precipitation (mm) | CombI |
|---|---|---|
| ≥17 | <700 | 1—Warm/Dry |
| ≥17 | ≥700 <900 | 2—Warm/Moderate |
| ≥17 | ≥900 | 3—Warm/Wet |
| <17 | <700 | 4—Cool/Dry |
| <17 | ≥700 <900 | 5—Cool/Moderate |
| <17 | ≥900 | 6—Cool/Wet |
| Region | Mean temp. vs Annual prec. | |
|---|---|---|
| 1 | Vouga | 92 |
| 2 | Mondego | 82 |
| 3 | Tejo | 65 |
| 4 | Sado | 60 |
© 2019 by the authors. Licensee MDPI, Basel, Switzerland. This article is an open access article distributed under the terms and conditions of the Creative Commons Attribution (CC BY) license (http://creativecommons.org/licenses/by/4.0/).
Share and Cite
Fraga, H.; Guimarães, N.; Santos, J.A. Future Changes in Rice Bioclimatic Growing Conditions in Portugal. Agronomy 2019, 9, 674. https://doi.org/10.3390/agronomy9110674
Fraga H, Guimarães N, Santos JA. Future Changes in Rice Bioclimatic Growing Conditions in Portugal. Agronomy. 2019; 9(11):674. https://doi.org/10.3390/agronomy9110674
Chicago/Turabian StyleFraga, Helder, Nathalie Guimarães, and João A. Santos. 2019. "Future Changes in Rice Bioclimatic Growing Conditions in Portugal" Agronomy 9, no. 11: 674. https://doi.org/10.3390/agronomy9110674
APA StyleFraga, H., Guimarães, N., & Santos, J. A. (2019). Future Changes in Rice Bioclimatic Growing Conditions in Portugal. Agronomy, 9(11), 674. https://doi.org/10.3390/agronomy9110674