Article

Nondestructive and Continuous Fresh Weight Measurements of Bell Peppers Grown in Soilless Culture Systems

Department of Plant Science and Research Institute of Agriculture and Life Sciences, Seoul National University, Seoul 08826, Korea
*
Author to whom correspondence should be addressed.
Agronomy 2019, 9(10), 652; https://doi.org/10.3390/agronomy9100652
Submission received: 12 September 2019 / Revised: 15 October 2019 / Accepted: 17 October 2019 / Published: 18 October 2019
(This article belongs to the Special Issue Precision Agriculture)

Abstract

:
Fresh weight is a direct index of crop growth. It is difficult to continuously measure the fresh weight of bell peppers grown in soilless cultures, however, due to the difficulty in identifying the moisture condition of crops and growing media. The objective of this study was to develop a continuous and nondestructive measuring system for the fresh weight of bell peppers grown in soilless cultures considering the moisture content of growing media. The system simultaneously measures the trellis string’s supported weight and gravitational weight using tensile load cells. The moisture weight of growing media was calibrated during the growth period using changes in moisture content before and after the first irrigation of the day. The most stable time period for the measurement, from 03:00 to 06:00, was determined by analyzing the diurnal change in relative water content. To verify the accuracy of the system, the fruits, stems, leaves, and roots’ fresh weights were measured manually. The fresh weights measured by the developed system were in good agreement with those manually measured. The results confirm that our system can reliably and accurately measure fresh weights of bell peppers grown in soilless cultures. This method can be applied to continuous growth data collection for other crops grown in soilless cultures.

Graphical Abstract

1. Introduction

Bell peppers (Capsicum annuum L.) are an economically important vegetable widely consumed for their high mineral and vitamin content [1,2,3]. Because they are highly sensitive to environmental conditions, most bell peppers are grown in greenhouses with soilless culture systems, where the microclimate can be precisely controlled [4,5,6]. In these conditions, environmental control and growth techniques are commonly used to optimize biomass production of crops. Therefore, it is important to measure the crop weight, which is an indicator of biomass production itself and is used as a key parameter for crop growth models [7,8,9,10]. Manual measurements are the most common method to determine crop weight. However, this method is not only destructive, but also laborious. Therefore, a nondestructive and continuous crop weight measurement system is desired.
Several studies on the development of continuous fresh weight measurement systems have been conducted. Chen [11] and Kim [12] installed a compressive force load cell to measure the fresh weight of leafy vegetables in deep-flow or nutrient-film techniques. This technique is not applicable for soilless cultures of bell peppers using solid growing media, where the moisture content of growing media changes continuously from irrigation, drainage, and crop water uptake. Baas and Slooweg [13] installed a compressive load cell under gerbera-planted rockwool media, and used frequency domain reflectometry (FDR) sensors, which measured the volume of moisture in the growing media using permittivity, to calculate crop fresh weight by excluding the moisture weight of growing media. This method can be used to calibrate the moisture weight of growing media as it changes continuously throughout the day, but this method can only be applied to crops’ gravitational weight. Furthermore, it would be difficult to apply this method to crops partially supported by a string trellis such as tomatoes, cucumbers, melons, and bell peppers. Therefore, it is necessary to develop a system that can measure both gravitational and string trellis crop weights.
To measure the weight of crops that are supported by the string trellis, CropAssist was developed [14]. CropAssist measures the weight through a tensile load cell (upper load cell) installed between the aluminum bar where the string trellis is fixed and the greenhouse frame. The moisture change in growing media is measured using a compressive load cell (lower load cell) installed under the growing media. This system has been used to measure crop growth and transpiration rate in various environmental and growth conditions [15,16,17]. This method, however, is limited to crops supported entirely by string trellis, such as tomatoes and cucumbers. For bell peppers, the crop weight is mainly supported by the string trellis, but there is also another weight component to consider because, unlike tomatoes, bell peppers grow straight vertically due to the lignified stems. Therefore, a system is required for nondestructive and continuous fresh weight measurement, considering the following general cultivation of bell peppers: (1) Hydroponics using solid media; (2) weight of the crops is supported by string trellis; and (3) the crops grow straight vertically.
The objectives of this study were to develop a continuous and nondestructive measuring system for the fresh weight of bell peppers grown in soilless cultures considering the moisture content of growing media and to verify the performance of the developed system by comparing it with actual measured data.

2. Materials and Methods

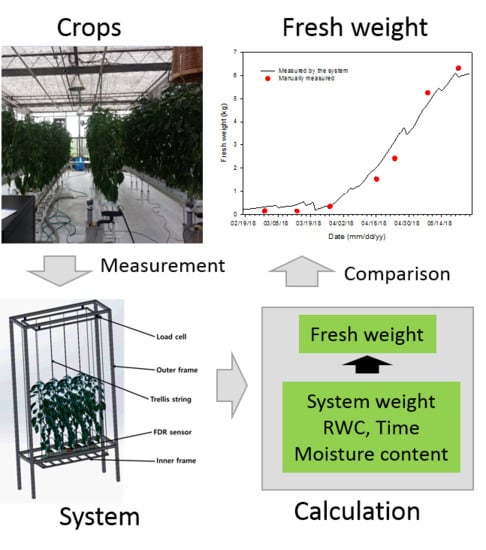
2.1. Fresh Weight Measurement System in a Soilless Culture Environment

The instrument consists of four components: An outer frame, an inner frame, load cells, and moisture sensors (Figure 1). The outer and inner frames were manufactured with HFS6-type aluminum profiles of 30 × 30 mm and HFS5-type aluminum profiles of 20 × 20 mm, respectively. The outer frame served as the main framework supporting the overall system. Rockwool slabs were placed on the lower part of the inner frame as the growing media, with four bell peppers planted on top of them. The crop was supported by a string trellis fixed to the upper part of the inner frame. Both the gravitational weight of the crop and rockwool growing media (downward force) and the weight supported by the string trellis (upward force) were supported by the inner frame. The inner and outer frames were connected with four S-beam tensile load cells (SBA-25, CAS, Yangju, Korea) with a 1 g resolution and a 0 to 25 kg measurement capability. The load cells were connected to an amplifier and conditioner module (CI-1500A, CAS, Yangju, Korea) to amplify and convert the electric signal to a proportional weight value, which was then sent to a data logger (CR-1000, Campbell Scientific, Logan, UT, USA). To measure changes in the moisture content, FDR sensors (WT100B, Mi-Rae Sensor, Seoul, Korea) were installed vertically in the middle of the growing media and recorded by the same data logger.

2.2. Growth Conditions

The experiments were conducted in a Venlo-type glasshouse located on the experimental farm of Seoul National University, Suwon, Korea (latitude, 37.3° N; longitude, 127.0° E). The vents on the greenhouse’s roof and sidewall automatically opened when the daytime temperature was higher than 26 °C. Forty-day-old bell pepper seedlings (Capsicum annuum L. ‘Fabris’) (Rijk Zwaan, De Lier, Netherlands) were used. On 8 February, 2018 (growth period 1) and on 30 October, 2018 (growth period 2), after two weeks of acclimatization at a nutrient concentration electrical conductivity (EC) of 2.0 dS/m, seedling with 5-6 nodes were transplanted into 0.9 * 0.2 * 0.1m (L * W * H) rockwool media (Grotop GT Master Dry, Grodan, Roermond, Netherlands) with a plant density of 3.3 plants/m2.
The EC and pH of the nutrient solutions were maintained at 2.6–3.0 dS/m and 5.5–6.5, respectively [6]. The plants were pruned to maintain two main stems, which were vertically trellised in a V-type canopy system [18]. Indoor solar radiation, temperature, CO2 concentration, and relative humidity were measured using a pyranometer (SP-110, Apogee Instruments, Logan, UT, USA), temperature sensor (CS220, Campbell Scientific, Logan, UT, USA), CO2 sensor (MH-Z14A, Winsen Electronics Technology, Zhengzhou, China), and relative humidity sensor (PCMini70, Gilwoo Trading, Seoul, Korea), respectively.

2.3. Fresh Weight Calculation

The FDR sensor measured the volumetric moisture content (v/v, %) in the growing media. A calibration factor between moisture weight and moisture content was calculated using the change in system weight measured by the load cell and the change in growing media moisture content measured by the FDR sensor before and after the first irrigation of the day:
Cf = (SWa − SWb)/(MCa − MCb)
where Cf is the weight-moisture content calibration factor (kg/%), SWa is the system weight after irrigation (kg), SWb is the system weight before irrigation (kg), MCa is the moisture content after irrigation (%), and MCb is the moisture content before irrigation (%).
The fresh weight of a crop depends on time of day because the water content, which affects the fresh weight, varies with weather and crop conditions [19]. Therefore, we measured the diurnal changes in relative water content (RWC) of the crop in order to select a time when RWC was relatively stable during the day. RWC was measured every hour over a 24-hour cycle during the days with (27 Feb.) and without (28 Apr.) indoor night heating according to Equation (2):
RWC = 100 ∗ (FW − DW)/(TW − DW)
where FW is the fresh weight of the samples after harvest, TW is the fully turgid weight of the samples in 4 °C distilled water for four hours, and DW is the dry weight of the sample after oven-drying at 70 °C for 48 hours [20]. The samples taken were less than 0.1 g and all measurements were repeated three iterations.

2.4. Growth Survey and Verification

To verify crop fresh weights measured by the developed system, we conducted a destructive crop growth survey. Measurements were taken from the crops on the system (fruits) and the adjacent crops grown simultaneously in the greenhouse where the system was installed (stems, leaves, and roots). The fresh weight of stems and leaves for crops of similar size and shape were measured by an electronic balance (FX-500i, A&D, Tokyo, Japan) every two weeks during the growth period. The fresh weight of fruits was calculated with an estimation regression of fruit length and fruit diameter [Equation (3)]. Fruit diameter and fruit length were measured by a digimatic caliper (CD-15CPX, Mitutoyo, Kanagawa, Japan) every two weeks.
FFW = 290.74 ∗ WF2 ∗ LF + 0.342
where FFW is the fruit fresh weight, WF is the fruit length, and LF is the fruit diameter. Data collected from the adjacent crops during the growth period were used for regression analysis (Figure A1).
Both the weight of the harvested crops and the weight of pinched crops were measured during the growth period. The roots of the crops were tightly attached to the growing media structures (Figure 2), so actual measurement of the roots’ fresh weight was impossible. Therefore, all of the growing media, including the roots, was harvested and dried in an oven (HB-501L, Hanbaek Science, Gyeonggi-do, Korea) at 70 °C for 48 hours on 10, 30, 75, and 113 days after transplanting (DAT). In order to calculate the dry root weight, the weight of the dried growing media containing the roots was subtracted from the weight of the initial growing media before planting the crops. The average root fresh weight was calculated indirectly using the ratio of dry and fresh root weight. The root weight was measured from one growing medium, and leaf and stem weights were measured from four plants. For verification, the total fresh weights determined using the destructive measurements were compared to those measured determined using the experimental system.

2.5. Statistical Analysis

To evaluate the accuracy of the developed system, the R2, root mean square error (RMSE), and d-statistic were calculated using statistical programs (SPSS, IBM, Armonk, NY, US) to represent the accuracy of the developed system. The d-statistic used the Willmot index [21] as an indicator of absolute accuracy. Pearson correlation analysis was performed using the same statistical program to analyze the correlation between crop growth and environmental factors. All figures were created using Sigmaplot (Systat Software, San Jose, CA, USA).

3. Results and Discussion

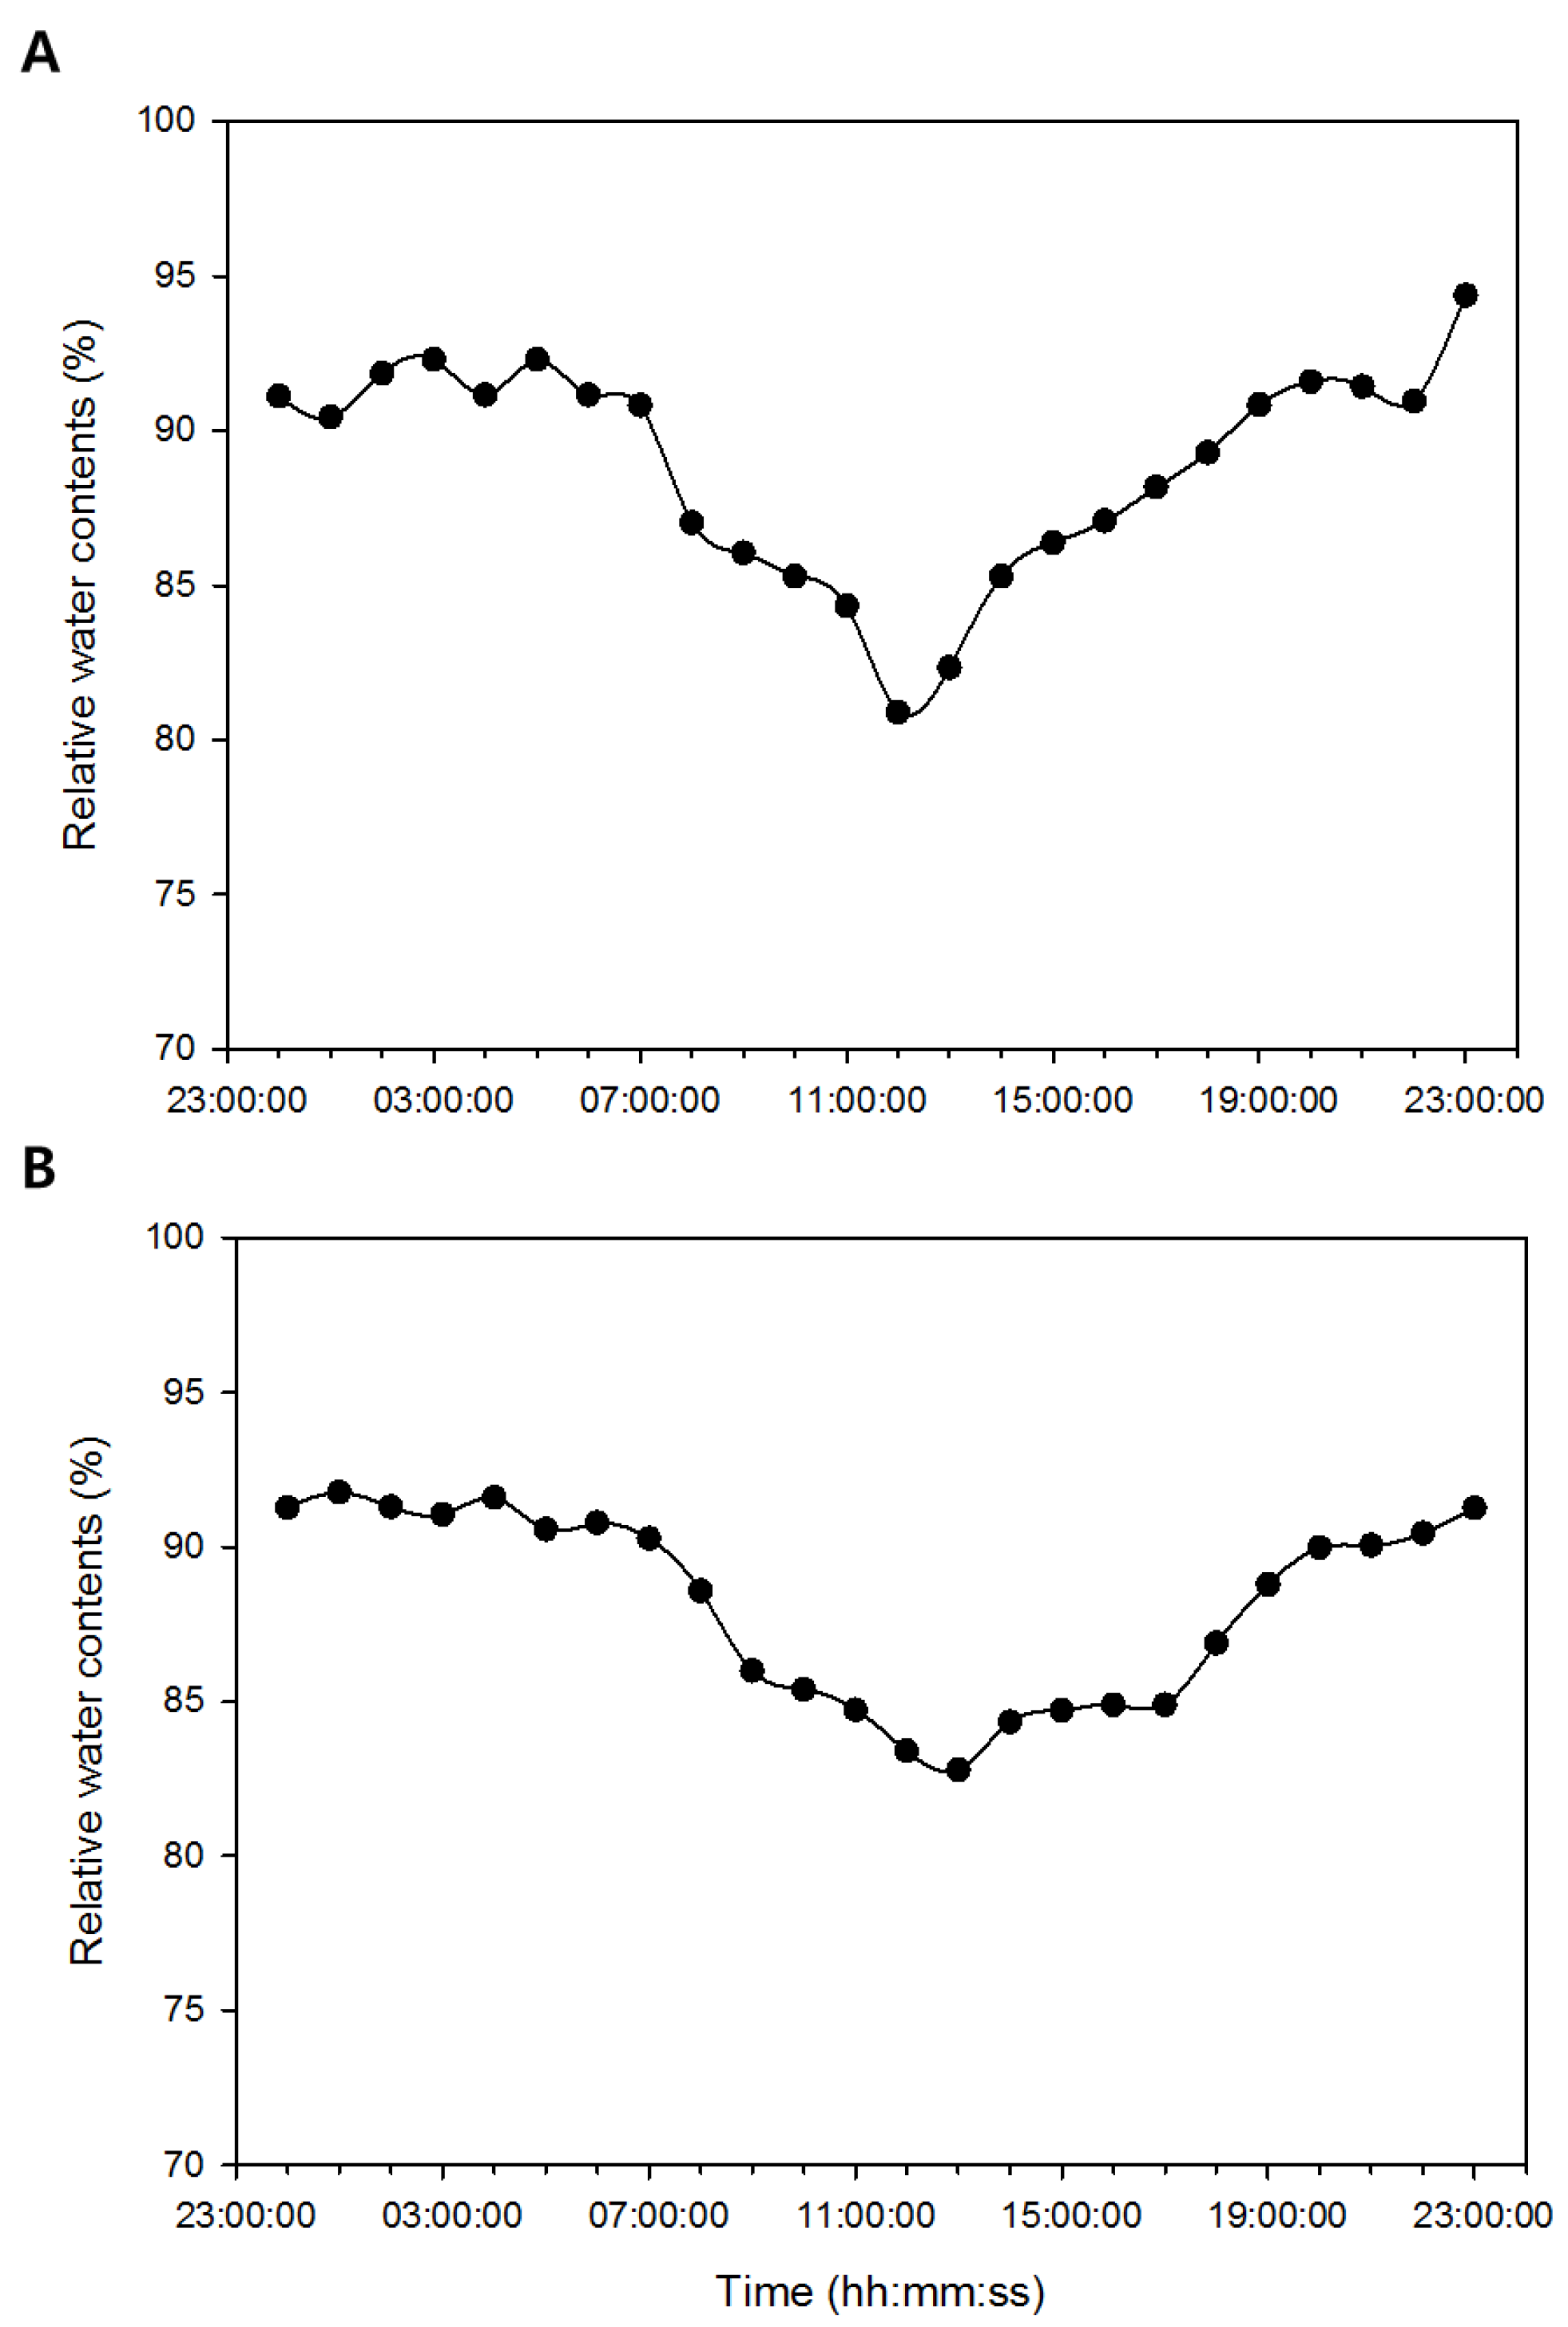
3.1. Diurnal Change in RWC

The RWC decreased from sunrise to noon and gradually increased afterward (Figure 3). In general, the RWC of crops is affected by ambient temperature, light intensity, and humidity during the day. At night, temperature and humidity are the main factors, which are significantly changed by night heating. The RWC when heating at night was rapidly decreased was compared to the RWC when heating at night. Although it measurements occurred over two different days, the RWC between 03:00 and sunrise was relatively stable with less than 3% variation. These results are consistent with previous daytime RWC measurements for various crops [22,23,24]. Recent studies have shown a time lag between crop water uptake and transpiration, causing a change in the crops’ RWC [22]. When transpiration begins with sunrise, roots uptake water when the RWC is below a certain level. This causes the continuous change in RWC during the day. Water loss continued throughout the day, but the crops stored the water after sunset and contained a constant level of water [25]. The average crop RWC does not show significant differences from night water content recovery except in extreme water stress conditions [26]. In soilless cultures, changes in RWC are minimal because the water content in the media is always maintained at an optimum level [27]. From our results, the appropriate time for fresh weight calculation was selected from 03:00 to before sunrise.

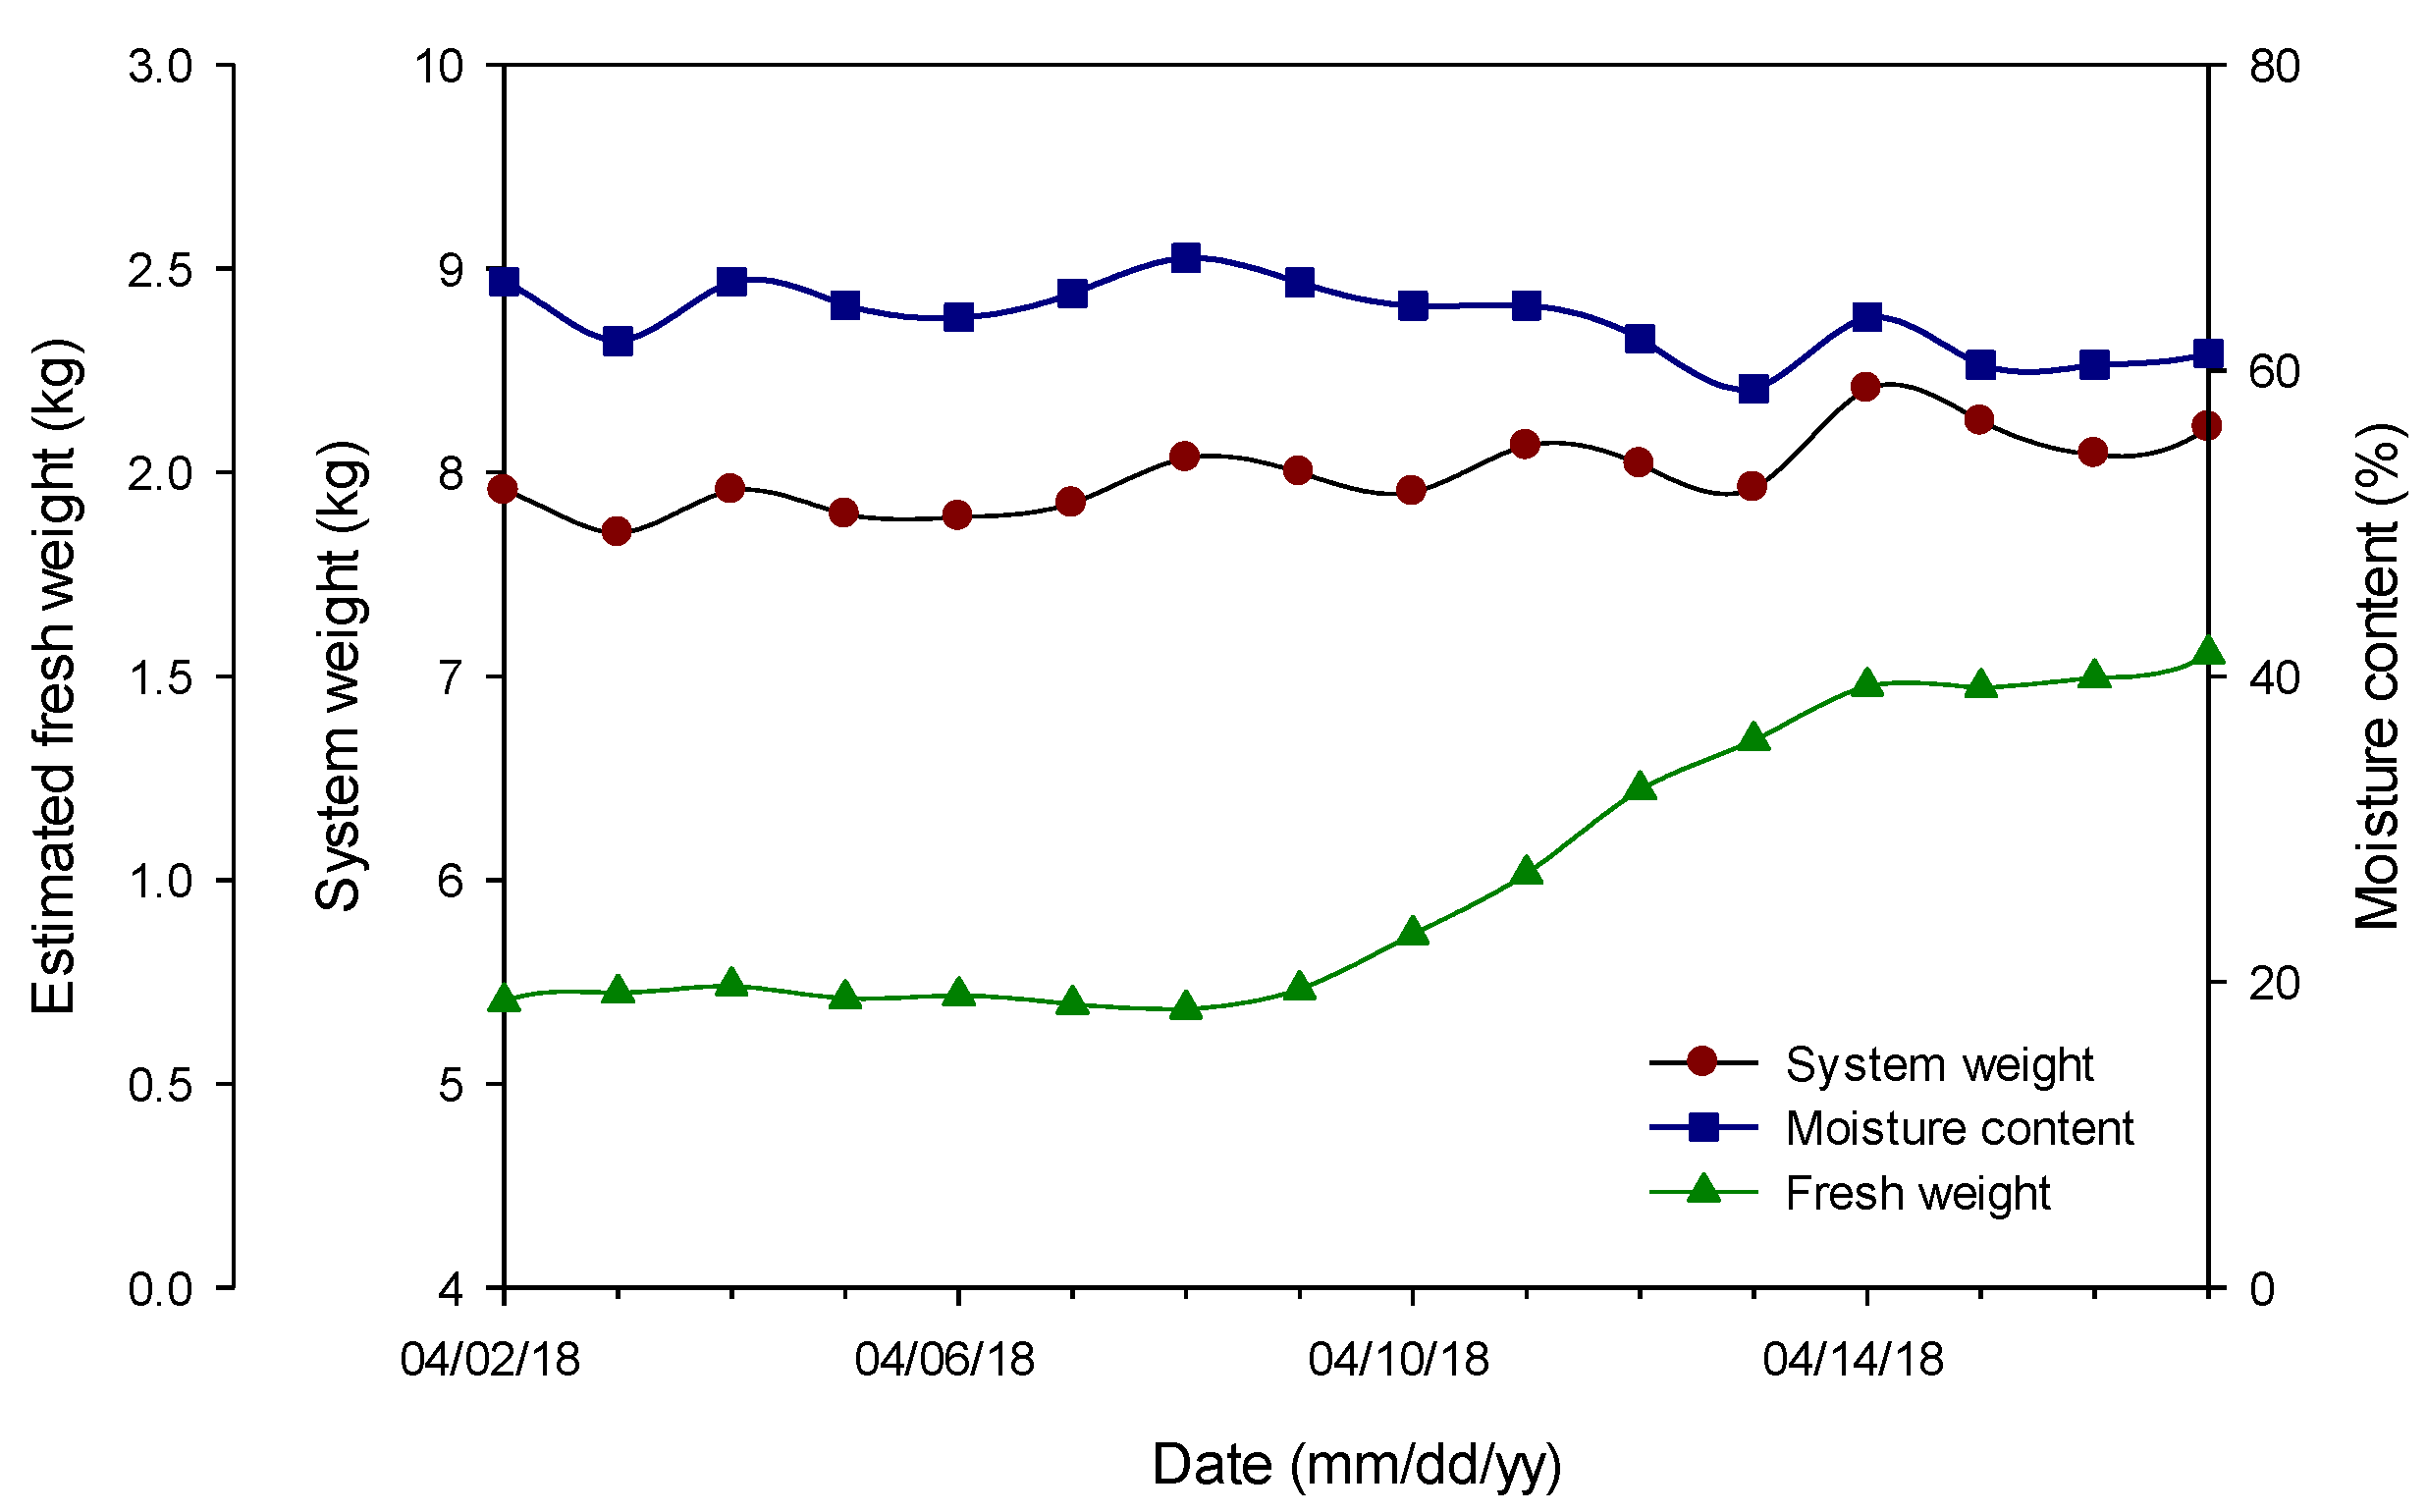
3.2. Weight-Moisture Content Calibration and Fresh Weight Calculation

We analyzed the changes in system weight and moisture content of growing media before and after the day’s first irrigation (Figure 4). Because the transpiration rate was less than 0.5 g/min at the time of first irrigation [6], the changes in total system weight and moisture content of growing media from transpiration were disregarded. Calibration factors (Equation 1, kg/%) were 0.072 ± 0.003 (growth period 1) and 0.068 ± 0.002 (growth period 2), respectively.
Previous studies [28,29] show the absolute value from the FDR sensor is affected by the growth period and environmental factors. In this study, however, the calibration factor did not change significantly between the growth periods. In soilless culture conditions, when the amount of irrigation is proportional to the amount of solar radiation, the root-zone area maintains stability [18,30]. This factor was substituted into the moisture content equation to calculate the fresh weight excluding the moisture weight in the growing media.
The changes in total system weight, growing media moisture content, and calculated fresh weight from 2 April to 17 April 2018 are shown in Figure 5. The total system weight varied with the moisture content, but the crop fresh weight increased throughout the period. In soilless culture conditions, the moisture weight of the growing media was a large proportion of total system weight, so the daily change in moisture weight in the growing media was excluded for accurate fresh weight measurement.

3.3. Destructive Crop Growth Survey

The root samples of the plants were taken from the growing media on 10, 30, 75, and 113 DAT (Table 1). The ratio of root dry weight to root fresh weight was 0.132, with no significant differences between growth stages. The ratio was multiplied with the measured root dry weight to calculate the root fresh weight by growth stage (Table 2). The root fresh weight at the early growth stage was about 14% of the total crop fresh weight. The proportion decreased to less than 10% after the middle growth stage.
More than 60% of the fresh weight at the last growth stages was reproductive parts, including fruit. For bell peppers, both vegetative and reproductive growth occurs simultaneously, with fruits being the most rapidly changing organ of the crops during growth period [31]. Unlike the continuous increase in the fresh weights of roots, stems, and leaves during the growth period, fruit abortion and harvest caused a discontinuous increase in total crop weight. Therefore, fruit fresh weight is considered important when measuring crop fresh weights.

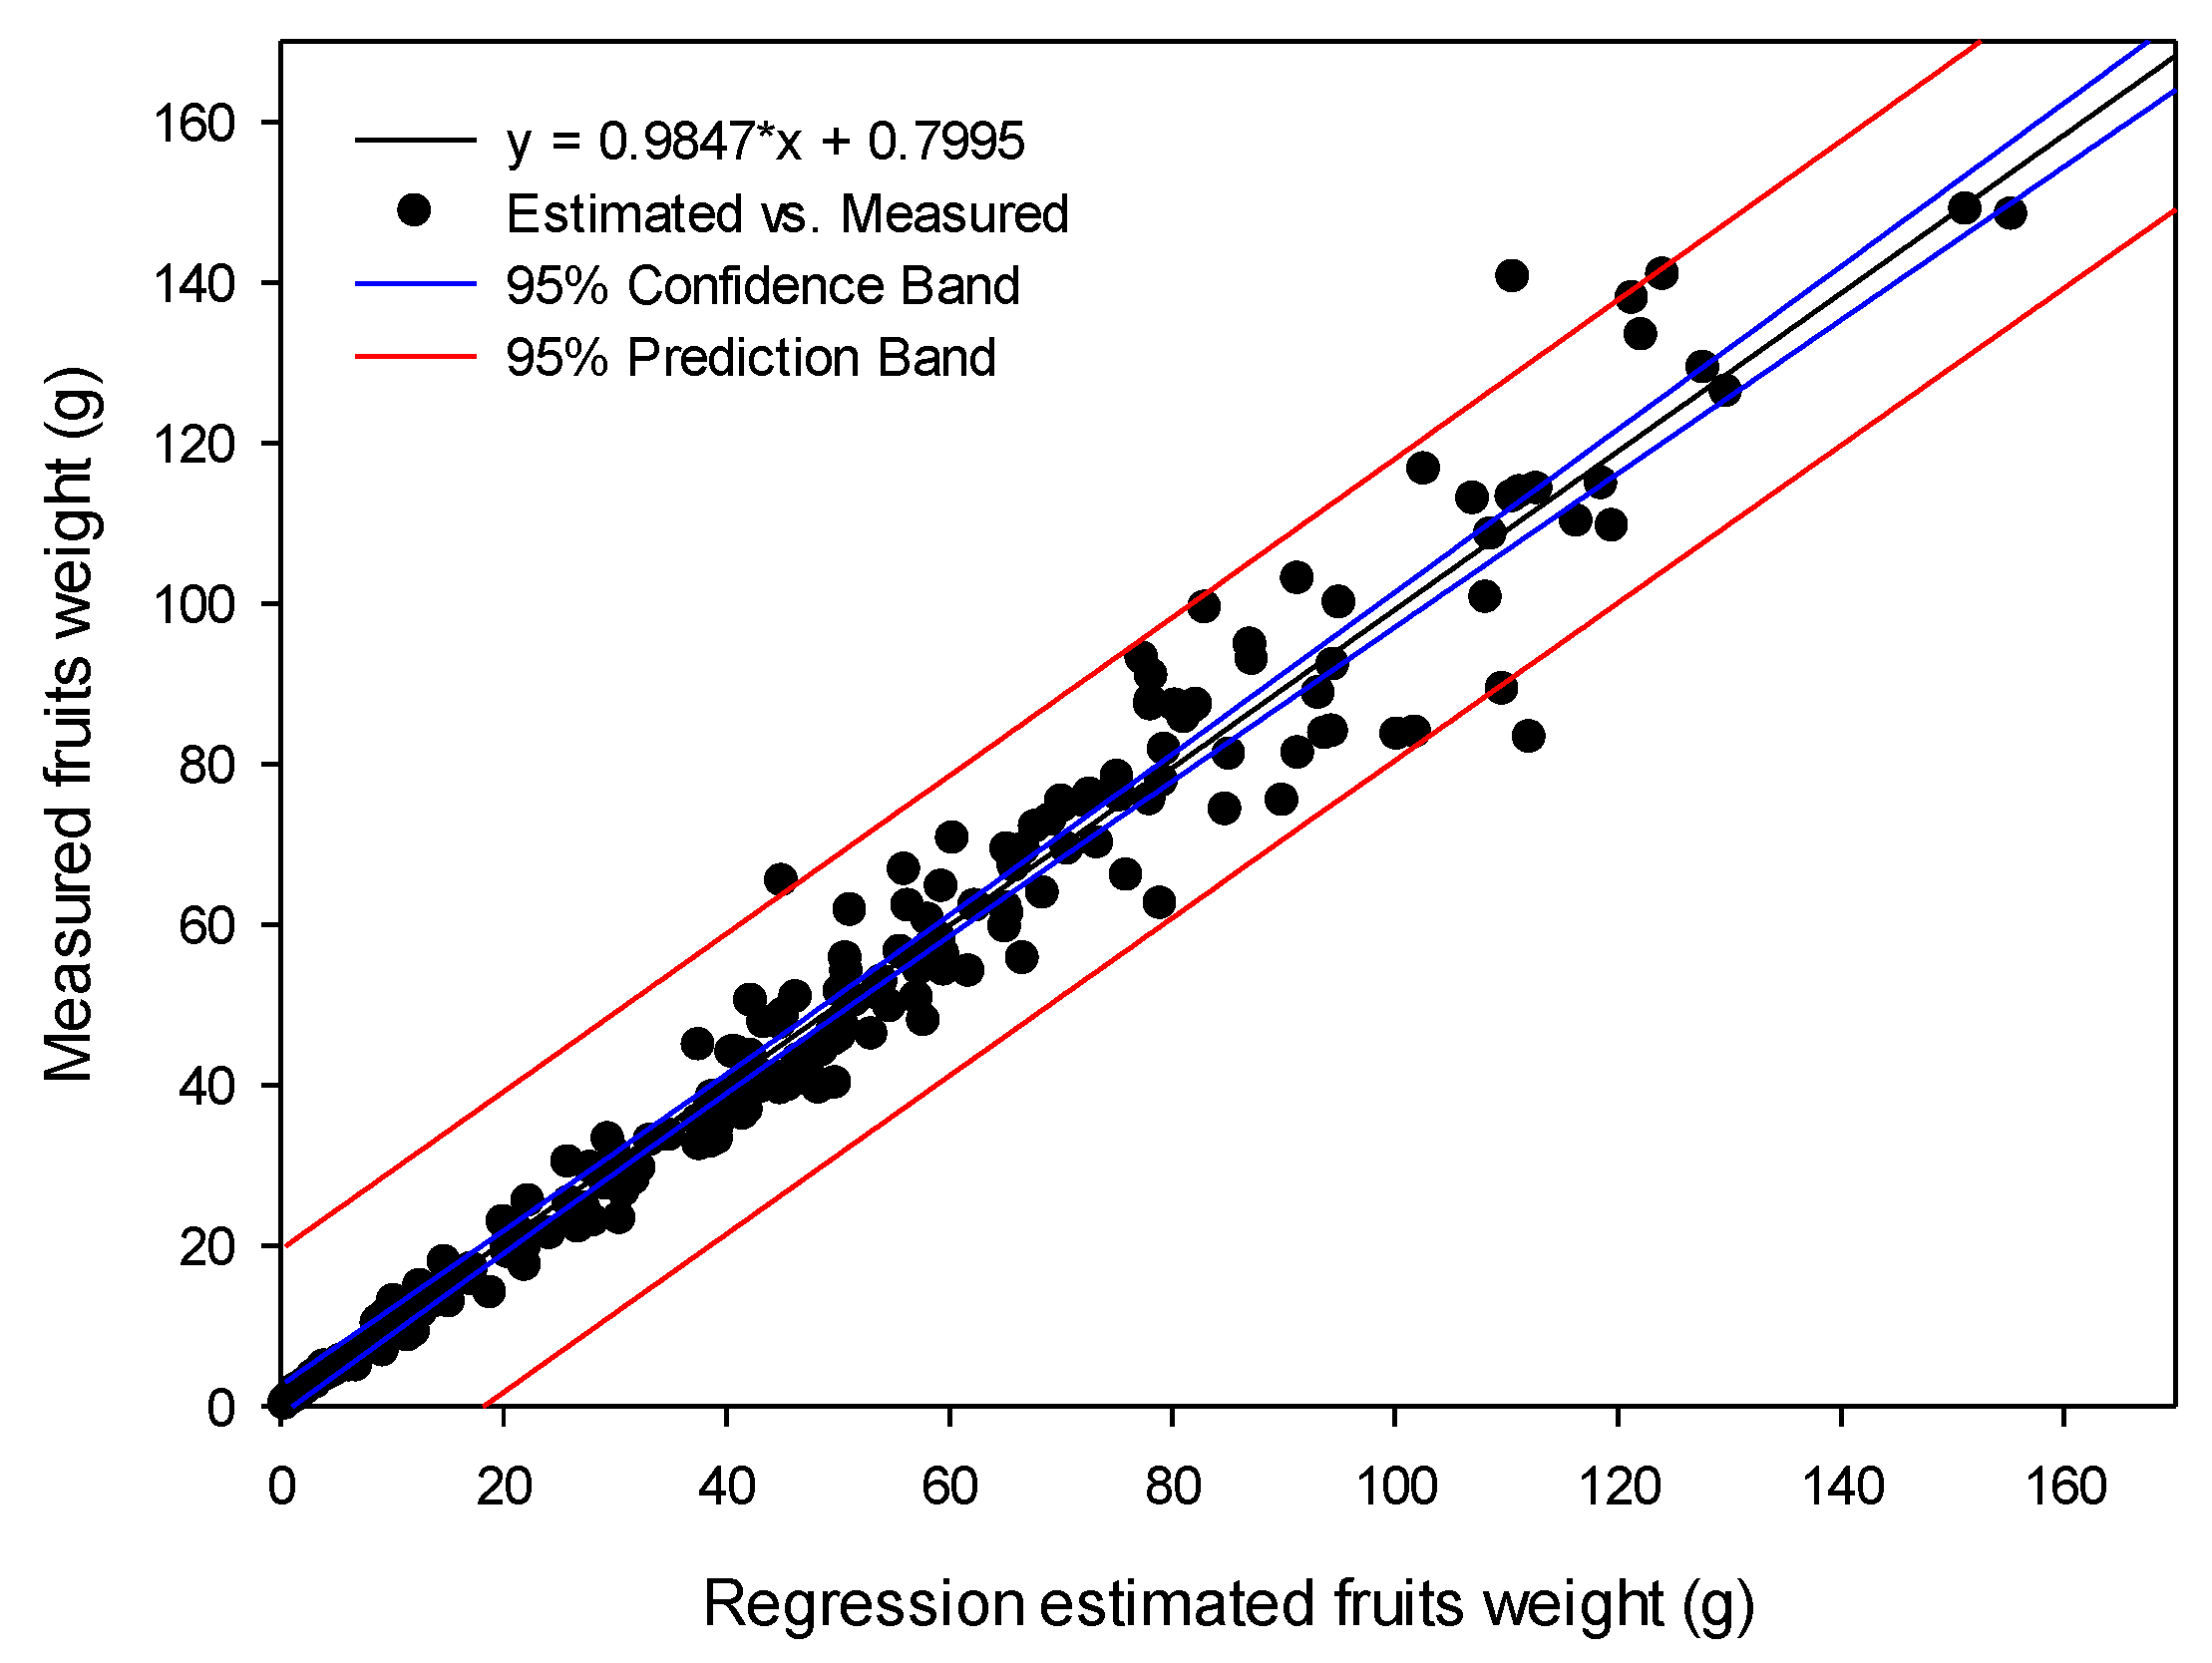
3.4. Continuous Changes in Fresh Weight and Its Verification

The crop fresh weight was calculated from measurements made between 03:00 and sunrise and included the total system weight, the moisture content of growing media, and the calibration factor. This allowed daily crop growth monitoring and recording during the growth period. Figure 6 shows the bell pepper’s fresh weight growth curves during the growth period. In the early stage, the changes in fresh weight were relatively small, but as the growth progressed, the growth rate first increased and then decreased, indicating a sigmoidal growth pattern. The bell pepper’s sigmoidal growth form [32] observed under general greenhouse conditions was confirmed using the experimental system; a significant decrease in crop fresh weight during the growth period was consistent with the fruit’s harvest date (Figure 6B).
Comparisons between the crop fresh weight measured by the experimental system and actual crop fresh weight are shown in Figure 7. A high linearity (linearity error < 1.725%) was obtained with R2 = 0.978 − 0.969, RMSE = 0.647 − 0.552, and d-statistic = 0.948 − 935 by growth periods. This accuracy was lower than other recent studies, where crop weights were measured using load cells ([33], error < 1.5%; [11], R2 = 0.997; [12], R2 = 0.998). Since these studies were conducted using deep-flow culture conditions with the roots free from the growth media, it was easier to measure the crop weight and roots with the load cells. However, compared to previous studies with roots fixed in growing media or soils [13,14], our experimental system showed high accuracy and proved its suitability for measuring the fresh weight of bell peppers in soilless cultures.
The following factors were considered: (1) In order to minimize the impact of continuous daily changes to RWC, the optimal time-zone was selected in a day; (2) the weight-moisture content calibration was conducted at the time of the first irrigation of the day when the effects of frequent irrigation and transpiration was minimal; and (3) the weight of roots was indirectly calculated using the ratio of root dry and fresh weights. We believe the developed system was the first to consider the growth characteristics of bell peppers grown in soilless culture and can be applied to not only bell peppers, but also to other crops.

3.5. Applicability and Limitations of the Developed System

As the crop growth could be continuously measured using the developed system, further analysis of the relationship between environmental conditions and crop growth was possible. Figure 8 shows the continuous changes in crop growth and environmental factors during the growth period.
The daily crop growth rate was calculated using the difference in fresh weight calculated between current and previous measurement days. Correlation analysis allowed us to interpret the continuous relationship between crop growth and environmental factors (Table 3). Temperature, light intensity, and CO2 concentration are the main environmental factors that determine the photosynthesis and calculate the biomass production in various crop growth models [7,8]. In this study, the temperature, light intensity, and relative humidity were highly correlated compared to the carbon dioxide concentration. This was due to the absence of CO2 enrichment during the growth period. The crop growth is determined by accumulated environments with time in the growth conditions. However, it is difficult to perform a time-series analysis between crops growth and environmental factors using crop growth data manually collected. The developed system allowed us to analyze the time series relationship through continuous measurements.
Recently, information and communication technologies have been used to improve crop yield and quality, as well as to reduce costs. The demand for big agricultural datasets is increasing [34,35]. As part of this data, information about environmental factors can be easily measured by various sensors. However, there are still limitations on collecting crop growth information. Our system can continuously and nondestructively monitor crop response to environmental conditions. Load cells, which are the main sensors used in our system, are durable, interact easily with various data collection systems, and require little maintenance after installation [36]. Also, in soilless culture conditions, changes in growing media moisture weight from irrigation, drainage, and crop water uptake are greater than daily crop growth. In order to detect this minute growth changes, load cells that can measure a fine weight are desired. At the same time, load cells should be able to support the weight of the entire cultivation system, including the growth media and the moisture in it, as well as the weight of the crop. This requires the maximum weight of tens of kilograms. A load cell with both high resolution and high maximum weight conditions is expensive, so it is necessary to select the appropriate level of load cells for the purpose.

4. Conclusions

A nondestructive and continuous measurement system for the fresh weight of bell peppers in soilless culture was developed. The system simultaneously measured the weight of the total cultivation system and the moisture contents of growing media using load cells and FDR sensors, respectively. The crop fresh weight was obtained by considering changes in system weight and moisture content before and after the first irrigation of the day and adequate time with stable relative water content. During the two growth periods, the fresh weights measured by the system were compared with those measured manually. Both comparisons showed good agreement, with R2 = 0.978 and 0.969, respectively. The developed system can be used to analyze the relationship between crop growth and environmental factors, and contribute to crop growth modelling with limited number of data.

Author Contributions

J.W.L. and J.E.S. conceived the research; J.W.L. performed the experiments; J.W.L. analyzed the results, and J.W.L. and J.E.S. prepared the manuscript; All authors read and approved the final manuscript.

Funding

This research was supported by iPET (Korea Institute of Planning and Evaluation for Technology in Food, Agriculture, Forestry and Fisheries) 319006-01, Ministry for Food, Agriculture, Forestry and Fisheries, Republic of Korea.

Acknowledgments

We thank Doo Sung Nam for his assistance with data collection and crop management.

Conflicts of Interest

The authors declare no conflict of interest.

Appendix A

Figure A1. Comparison of fruit fresh weights (FFW) measured manually and calculated with an estimation regression of fruit length (LF) and fruit diameter (WF). FFW = 290.74 ∗ WF2 ∗ LF + 0.342.
Agronomy 09 00652 g0a1

References

  1. Castro, S.M.; Saraiva, J.A.; Lopes-da-Silva, J.A.; Delgadillo, I.; van Loey, A.; Smout., C.; Hendrickx, M. Effect of thermal blanching and of high pressure treatments on sweet green and red bell pepper fruits (Capsicum annuum L.). Food Chem. 2008, 107, 1436–1449. [Google Scholar] [CrossRef]
  2. Frans, M.; Moerkens, R.; Van Gool, S.; Sauviller, C.; Van Laethem, S.; Luca, S.; Aerts, R.; Ceusters, J. Modelling greenhouse climate factors to constrain internal fruit rot (Fusarium spp.) in bell pepper. J. Plant Dis. Prot. 2018, 125, 425–432. [Google Scholar] [CrossRef]
  3. Wyenandt, C.A.; Kline, W.L.; Ward, D.L.; Brill, N.L. Production system and cultivar effects on the development of skin separation or “silvering” in bell pepper fruit. HortTechnology 2017, 27, 37–44. [Google Scholar] [CrossRef]
  4. Ngouajio, M.; Auras, R.; Fernandez, R.T.; Rubino, M.; Counts, J.W.; Kijchavengkul, T. Field performance of aliphatic-aromatic copolyester biodegradable mulch films in a fresh market tomato production system. HortTechnology 2008, 18, 605–610. [Google Scholar] [CrossRef]
  5. Sezen, S.M.; Yazar, A.; Eker, S. Effect of drip irrigation regimes on yield and quality of field grown bell pepper. Agric. Water Manag. 2006, 81, 115–131. [Google Scholar] [CrossRef]
  6. Shin, J.H.; Son, J.E. Development of a real-time irrigation control system considering transpiration, substrate electrical conductivity, and drainage rate of nutrient solutions in soilless culture of paprika (Capsicum annuum L.). Eur. J. Hortic. Sci. 2015, 80, 271–279. [Google Scholar] [CrossRef]
  7. Heuvelink, E. Evaluation of a dynamic simulation model for tomato crop growth and development. Ann. Bot. 1999, 83, 413–422. [Google Scholar] [CrossRef]
  8. Jones, J.W.; Dayan, E.; Allen, L.H.; Van Keulen, H.; Challa, H. A dynamic tomato growth and yield model (TOMGRO). Trans. ASAE. 1991, 34, 663–672. [Google Scholar] [CrossRef]
  9. Katsoulas, N.; Peponakis, K.; Ferentinos, K.P.; Kittas, C. Calibration of a growth model for tomato seedlings (TOMSEED) based on heuristic optimisation. Biosyst. Eng. 2015, 140, 34–47. [Google Scholar] [CrossRef]
  10. Martínez-Ruiz, A.; López-Cruz, I.L.; Ruiz-García, A.; Pineda-Pineda, J.; Prado-Hernández, J.V. HortSyst: A dynamic model to predict growth, nitrogen uptake, and transpiration of greenhouse tomatoes. Chil. J. Agric. Res. 2019, 79, 89–102. [Google Scholar] [CrossRef] [Green Version]
  11. Chen, W.T.; Yeh, Y.H.F.; Liu, T.Y.; Lin, T.T. An automated and continuous plant weight measurement system for plant factory. Front. Plant Sci. 2016, 7, 392. [Google Scholar] [CrossRef] [PubMed]
  12. Kim, J.; Kang, W.; Ahn, T.; Shin, J.; Son, J.E. Precise, real-time measurement of the fresh weight of lettuce with growth stage in a plant factory using a nutrient film technique. Hortic. Sci. Technol. 2016, 34, 77–83. [Google Scholar]
  13. Baas, R.; Slootweg, C. On-line acquisition of plant related and environmental parameters (plant monitoring) in gerbera: Determining plant responses. Acta Hortic. 2004, 654, 139–146. [Google Scholar] [CrossRef]
  14. Helmer, T.; Ehret, D.L.; Bittman, S. CropAssist, an automated system for direct measurement of greenhouse tomato growth and water use. Comput. Electron. Agric. 2005, 48, 198–215. [Google Scholar] [CrossRef]
  15. Ahmad, U.; Subrata, D.M.; Arif, C. Speaking plant approach for automatic fertigation system in greenhouse. arXiv 2013, arXiv:1303.1869. [Google Scholar]
  16. Ehret, D.L.; Hill, B.D.; Helmer, T.; Edwards, D.R. Neural network modeling of greenhouse tomato yield, growth and water use from automated crop monitoring data. Comput. Electron. Agric. 2011, 79, 82–89. [Google Scholar] [CrossRef]
  17. Story, D.; Kacira, M. Design and implementation of a computer vision-guided greenhouse crop diagnostics system. Mach. Vis. Appl. 2015, 26, 495–506. [Google Scholar] [CrossRef]
  18. Jovicich, E.; Cantliffe, D.J.; Stoffella, P.J.; Haman, D.Z. Bell pepper fruit yield and quality as influenced by solar radiation-based irrigation and container media in a passively ventilated greenhouse. HortScience 2007, 42, 642–652. [Google Scholar] [CrossRef]
  19. Ueda, M.; Nakamura, Y. Chemical basis of plant leaf movement. Plant Cell Physiol. 2007, 48, 900–907. [Google Scholar] [CrossRef]
  20. Luis, G.; Marco, G. Determination of relative water content. In Handbook of Plant Ecophysiology Techniques; Roger, M.J.R., Ed.; Kluwer Academic Publishers: New York, NY, USA, 2001; Volume 14, pp. 207–212. [Google Scholar]
  21. Willmott, C.J.; Robeson, S.M.; Matsuura, K. A refined index of model performance. Int. J. Climatol. 2012, 32, 2088–2094. [Google Scholar] [CrossRef]
  22. Himeno, S.; Azuma, W.; Gyokusen, K.; Ishii, H.R. Leaf water maintains daytime transpiration in young Cryptomeria japonica trees. Tree Physiol. 2017, 37, 1394–1403. [Google Scholar] [CrossRef] [PubMed] [Green Version]
  23. Klepper, B.; Browning, V.D.; Taylor, H.M. Stem diameter in relation to plant water status. Plant Physiol. 1971, 48, 683–685. [Google Scholar] [CrossRef] [PubMed]
  24. Rajagopal, V.; Balasubramanian, V.; Sinha, S.K. Diurnal fluctuations in relative water content, nitrate reductase and proline content in water-stressed and non-stressed wheat. Physiol. Plant. 1977, 40, 69–71. [Google Scholar] [CrossRef]
  25. Klein, T.; Cohen, S.; Paudel, I.; Preisler, Y.; Rotenberg, E.; Yakir, D. Diurnal dynamics of water transport, storage and hydraulic conductivity in pine trees under seasonal drought. iForest Biogeosci. For. 2016, 9, 710. [Google Scholar] [CrossRef]
  26. Flexas, J.; Ribas-Carbó, M.; Bota, J.; Galmés, J.; Henkle, M.; Martínez-Cañellas, S.; Medrano, H. Decreased Rubisco activity during water stress is not induced by decreased relative water content but related to conditions of low stomatal conductance and chloroplast CO2 concentration. New Phytol. 2006, 172, 73–82. [Google Scholar] [CrossRef] [PubMed]
  27. Ogbonnaya, C.I.; Sarr, B.; Brou, C.; Diouf, O.; Diop, N.N.; Roy-Macauley, H. Selection of cowpea genotypes in hydroponics, pots, and field for drought tolerance. Crop Sci. 2003, 43, 1114–1120. [Google Scholar] [CrossRef]
  28. Kang, S.; van Iersel, M.W.; Kim, J. Plant root growth affects FDR soil moisture sensor calibration. Sci. Hortic. 2019, 252, 208–211. [Google Scholar] [CrossRef]
  29. Skierucha, W.; Wilczek, A. A FDR sensor for measuring complex soil dielectric permittivity in the 10–500 MHz frequency range. Sensors 2010, 10, 3314–3329. [Google Scholar] [CrossRef]
  30. Nikolaou, G.; Neocleous, D.; Katsoulas, N.; Kittas, C. Effect of irrigation frequency on growth and production of a cucumber crop under soilless culture. Emir. J. Food Agric. 2017 29, 863–871. [CrossRef]
  31. Marcelis, L.F.M.; Heuvelink, E.; Baan Hofman-Eijer, L.R.; Den Bakker, J.; Xue, L.B. Flower and fruit abortion in sweet pepper in relation to source and sink strength. J. Exp. Bot. 2004, 55, 2261–2268. [Google Scholar] [CrossRef] [Green Version]
  32. Gijzen, H.; Heuvelink, E.; Challa, H.; Marcelis, L.F.M.; Dayan, E.; Cohen, S.; Fuchs, M. HORTISIM: A model for greenhouse crops and greenhouse climate. Acta Hortic. 1997, 456, 441–450. [Google Scholar] [CrossRef]
  33. Avotins, A.; Gruduls, J.; Apse-Apsitis, P.; Potapovs, A. Crop weight measurement sensor for IoT based industrial greenhouse systems. Agron. Res. 2018, 16, 952–957. [Google Scholar]
  34. Muangprathub, J.; Boonnam, N.; Kajornkasirat, S.; Lekbangpong, N.; Wanichsombat, A.; Nillaor, P. IoT and agriculture data analysis for smart farm. Comput. Electron. Agric. 2019, 156, 467–474. [Google Scholar] [CrossRef]
  35. O′Grady, M.J.; O′Hare, G.M. Modelling the smart farm. Inf. Process. Agric. 2017, 4, 179–187. [Google Scholar] [CrossRef]
  36. Kumar, R.; Chhabra, S.; Verma, A.S.; Gupta, A. Analysis of load cell. Int. J. Appl. Eng. Res. 2018, 13, 274–277. [Google Scholar]
Figure 1. A schematic diagram of the developed fresh weight measuring system using load cell and frequency domain reflectometry (FDR) sensors (A) and the data flow of the developed system (B).
Agronomy 09 00652 g001
Figure 2. Distribution of roots inside the rockwool growing medium.
Agronomy 09 00652 g002
Figure 3. Diurnal changes in relative water content in heated conditions at night ((A), 27 February 2018) and in unheated conditions at night ((B), 28 April 2018).
Agronomy 09 00652 g003
Figure 4. Changes in system weight (SW) and moisture content (MC) measured by load cells and frequency domain reflectometry sensors, respectively, before and after the irrigation. Subscripts a and b mean after and before irrigation, respectively.
Agronomy 09 00652 g004
Figure 5. Changes in total system weight, moisture content, and fresh weight from 2 April to 17 April 2018.
Agronomy 09 00652 g005
Figure 6. Changes in crop fresh weights measured by the developed system (line) and manual measurements (dot). (A) and (B) indicate growth periods 1 (8 February–28 May 2018) and 2 (30 October 2018–25 March 2019), respectively.
Agronomy 09 00652 g006
Figure 7. Comparison of crop fresh weights measured by the developed system and the actual measurements by the growth survey (dot) and the linear regression (black line). (A) and (B) indicate growth periods 1 (8 February–28 May 2018) and (30 October 2018–25 March 2019), respectively.
Agronomy 09 00652 g007
Figure 8. Crop growth rates measured by the system (A) and environmental conditions in the greenhouse (B) from 5 March to 26 March 2018. Daily crop growth rate was calculated as the difference in fresh weight calculated between current and previous measurement days.
Agronomy 09 00652 g008
Table 1. Sampled fresh and dry weights of the roots specific days after transplanting (DAT).
DATFresh Weight (g, A)Dry Weight (g, B)A/B
100.098 ± 0.021z0.013 ± 0.0010.133
301.206 ± 0.3270.165 ± 0.060.137
751.935 ± 0.4200.248 ± 0.0240.128
1131.117 ± 0.2460.147 ± 0.0130.132
Table 2. Growth survey results of roots, leaves, stems, and fruits per plant according to days after transplanting (DAT) for different growth periods. Root fresh weight was calculated with root dry weight and A/B ratio in Table 1. Growth periods 1 and 2 were 8 February–28 May 2018 and 30 October 2018–25 March 2019, respectively.
Growth PeriodDATRoot Dry
Weight (g)
Root Fresh
Weight (g)
Leaf Fresh
Weight (g)
Stem Fresh
Weight (g)
Fruit Fresh
Weight (g)
1200.650 z4.91219.779 ± 11.586 y35.864 ± 4.1911.738 ± 0.953
340.6474.86622.402 ± 3.98610.0398 ± 2.3731.182 ± 0.311
481.40710.58240.066 ± 18.72630.479 ± 11.9991.964 ± 0.626
684.79336.037165.687 ± 15.148124.935 ± 13.17159.295 ± 82.027
767.25654.555298.869 ± 45.735197.085 ± 13.42545.603 ± 25.274
917.26754.638301.019 ± 64.667195.685 ± 49.313762.398 ± 31.465
1047.29354.837312.207 ± 25.668199.720 ± 8.8231003.479 ± 221.610
2290.6354.50013.31825 ± 4.6457.395 ± 2.6240.568 ± 0.122
441.1559.32959.598 ± 18.16947.498 ± 5.46227.732 ± 29.648
583.90730.057132.838 ± 37.74599.262 ± 12.357139.211 ± 42.562
714.79340.556176.768 ± 29.590139.951 ± 14.957304.009 ± 101.153
856.92153.239201.902 ± 41.542151.156 ± 18.90112.534 ± 6.236
1017.16155.077258.571 ± 75.537196.274 ± 32.86249.459 ± 21.397
1137.25056.669340.491 ± 67.764200.019 ± 27.662160.932 ± 53.152
12710.39179.931421.408 ± 67.072301.940 ± 24.236262.037 ± 71.329
z Average value of four plants. y Mean ± standard deviation (n = 4).
Table 3. Correlation analysis of time series variables in growth and environment factors.
ValueTemperatureCO2 ConcentrationRadiationRelative Humidity
Average a0.510 **0.1570.545 **0.639 **
Maximum b−0.187 *0.1790.547 **0.692 **
Minimum c0.061−0.288 **0.353 **
*, ** Pearson correlation (r) significant at 0.05 and 0.01, respectively. a Average value of the day. b Maximum value of the day. c Minimum value of the day.

