Article

Weed Suppression in Only-Legume Cover Crop Mixtures

by
Heba Elsalahy
1,2,*,
Thomas Döring
3,
Sonoko Bellingrath-Kimura
1,4 and
Danny Arends
5
1
Department of Agronomy and Crop Science, Humboldt-University of Berlin, Albrecht-Thaer-Weg 5, 14195 Berlin, Germany
2
Faculty of Science, Botany and Microbiology Department, Assiut University, Assiut 71516, Egypt
3
Agroecology and Organic Farming Group, University of Bonn, Auf dem Hügel 6, 53121 Bonn, Germany
4
Research Area “Land Use and Governance”, Leibniz Centre for Agricultural Landscape Research (ZALF), Eberswalder Str. 84, 15374 Müncheberg, Germany
5
Animal Breeding Biology and Molecular Genetics, Albrecht Daniel Thaer-Institute for Agricultural and Horticultural Sciences, Humboldt University of Berlin, 14195 Berlin, Germany
*
Author to whom correspondence should be addressed.
Agronomy 2019, 9(10), 648; https://doi.org/10.3390/agronomy9100648
Submission received: 16 September 2019 / Revised: 3 October 2019 / Accepted: 15 October 2019 / Published: 17 October 2019
(This article belongs to the Special Issue Weed Management in Annual and Perennial Cropping Systems)

Abstract

:
Weed suppression is a potential benefit of cover crop mixtures, as species diversity may allow for combining early and late-season competition with weeds. Here, we studied if this is possible for only-legume mixtures containing species with different growth rates, by testing two legumes, alsike clover (AC; Trifolium hybridum L.) and black medic (BM; Medicago lupulina L.) in two field trials sown in 2016 and 2017. Five AC:BM ratios (100:0, 67:33, 50:50, 33:67, and 0:100) were grown at three densities (50%, 100%, and 150% of recommended seed density). Cover crop and weed aboveground biomass (CCB and WB, respectively) were harvested three times, after establishment in spring (H1), in summer (H2), and in autumn after mulching (H3). Compared to fallow plots, all monocultures and mixtures showed early-season weed suppression in terms of biomass production and more efficiency over time with an average reduction of 42%, 52%, and 96% in 2016, and 39%, 55%, and 89% in 2017 at H1, H2, and H3, respectively. Out of 54 mixture treatments, only eight mixtures showed stronger weed suppression than monocultures. Mixtures reduced WB by 28%, as an average value, in 2017 compared to the respective monocultures, but not significantly in 2016, indicating that the crop diversity effect on weeds was dependent on the growing environment. Weed suppression was significantly higher at 100% and 150% seed density than 50%, but no significant differences were determined between 100% and 150% seed density. After mulching, no density effect was observed on CCB and WB. In conclusion, AC and BM can be used as a keystone species on weed suppression for sustainable agriculture as they possess plasticity to suppress weeds when higher biomass productivity is limited by environmental conditions. However, their diversity effects are time and condition dependent. Appropriate seed density and mulching can successfully be employed in weed management, but seed density may not have an effect after mulching.

1. Introduction

Weeds are a serious biotic threat in agroecosystems affecting crop productivity and crop quality [1,2]. The estimated crop yield loss due to weeds is about 34% worldwide [3]. In conventional arable farming systems, the strategy of weed control relies heavily on synthetic herbicides. However, the reliance on herbicides in agriculture is currently posing problems such as risks to human health, environmental pollution, and the evolution of weeds that are resistant to herbicides [4]. In contrast, low-input agriculture and organic farming exploit approaches that aim for high crop competitiveness such as intercropping or cover crop mixtures to suppress weeds. These approaches provide an alternative pathway of self-regulation and resilience of the agroecosystems to meet environmental perturbations and secure sustainable agriculture [5,6,7].
Cover crops are introduced into the cropping system in two major ways: By growing them when the soil is not cultivated, or, alternatively, intercropping them with the main crop for a part of the growing season as living mulch [8,9]. In both systems, cover crops interfere with the development of weed populations through two mechanisms. First, the rapid and successful establishment of cover crops will hamper weed growth and development through niche pre-emption and competition [10,11]. However, the initial weed seedbank [12], weed response to the ambient conditions [13,14], and soil fertility [15,16] may interfere with the successful establishment of cover crops. Second, incorporated (green manures) or surface application of crop residues as mulch can effectively inhibit or retard germination and establishment of weeds [17,18]. This effect is due to allelopathic or physical effects, the stimulation of soil-borne pathogens, or a combination of these mechanisms [19,20]. Therefore, designing or optimizing a mixture of cover crops where the two mechanisms could be operating overtime would allow for an effective weed control.
Diversification of cropping systems by increasing the number of crop species grown together has been proposed as a means of ecological weed management in agroecosystems [6]. Reduced weed biomass in intercropping systems has been reported by several workers for cereal-grain legume [21], for pea-barley [22], for maize–legume [23], and for maize-faba bean [24]. These studies confirmed that species diversity maintains a highly asymmetric competition over weeds [25], but these relations still need to be investigated in further detail and compared with the effects of other agronomic options of weed control, e.g., increased seed density or mulching. Other studies have reported that species identity (species performance in a particular ecosystem function) outweighs the effect of species diversity on weed suppression [26,27]. Species identity is affected by species traits (species characteristics), e.g., species’ growth rate and species´ response to environmental conditions, which may reflect the overall performance of the species [28,29]. In this context, mixing species with different traits, e.g., different growth rates may create a temporal asynchrony in species growth dynamics, where the fast-growing species competes with the early-season weeds and the slow-growing species competes with the late-season weeds. This approach may provide an effective weed management over the whole growing season while decreasing the direct competition for resources between the mixed-species.
Perennial forage legumes in mixtures have demonstrated their ability to provide important ecosystem services [30], mainly via reducing the dependency on mineral fertilizer by fixing atmospheric nitrogen [23,31]. In addition, legume cover crop mixtures have also been observed to contribute to weed control [32,33,34]. In practice, perennial legumes are often combined with grasses, especially when they are grown for forage production. In this situation, the competition among legumes and non-legumes on weed suppression is likely to be largely influenced by nitrogen dynamics, thereby masking potential effects of any other traits that are related to competitive ability [21]. For this reason, we chose to focus on legume-only crops to understand the potential of forage legumes to suppress weeds, and, in this context, to study the potential of increasing crop diversity for better weed control.
Weed suppression by cover crops is the result of internal and external factors such as crop species and genotype, crop density, plant species diversity, and composition, then management practice such as cutting and mulching. The relative proportion of species can modify the crop species’ relative competitive strength [35,36]. According to the complementarity hypothesis, mixtures with more equal proportions (i.e., seed mixtures with greater species evenness) may be more productive [37] and less prone to weeds infestation [38,39,40]. Contrary to this hypothesis, many studies did not observe a pattern of greater biomass in equiproportional mixtures [25,35,41]. Moreover, increasing crop density usually resulted in decreased weed biomass [42,43]. In this context, a properly managed mixture is expected to have higher biomass productivity that intimately related to weed suppression [44,45].
In this study, we investigated two legume species alsike clover (AC; Trifolium hybridum L.) and black medic (BM; Medicago lupulina L.) in 15 treatments consists of five mixing ratios of AC:BM 100:0, 67:33, 50:50, 33:67, and 0:100 sown at three seed densities representing 50%, 100%, and 150% of the recommended seed density. The species were chosen based on several contrasting characteristics regarding growth rates, response to temperature, and water and growth habit. BM is a fast-growing perennial legume [29,46] that is well adapted to warm and dry conditions [47,48], has a short-medium growth habit that forms a superior ground cover, and regrows fast after cutting [49,50,51]. AC is a slow-growing perennial legume that is drought-sensitive and well adapted to cool and wet conditions [52,53] and has an upright growth habit with a single crown from which multiple florets are produced [54]. Therefore, the two legume species are supposed to represent asynchrony in growth rates and asynchrony in response to environmental conditions; thus, strongly suppressing weeds.
Specifically, we aimed to test whether a mixture of AC and BM has a potential ability to reduce the risk of yield losses and suppress weeds in varied environmental conditions (e.g., areas with uncertain rainfall). Here, we refer to weed suppression by reducing weed biomass, but we acknowledge that an important component of weed suppression is not covered by any measurements in our study, refers to the weed seedbank. Thus, our hypotheses are: (1) The two legume species differ in their ability to suppress weeds. (2) Mixtures of the two legume species suppress weeds better than expected from the average of the monocultures. (3) Equiproportional mixtures suppress weeds more strongly than other mixtures. (4) Higher seed densities lead to stronger weed suppression. (5) Mulching intensifies density effects as the mulch residues that result from planting high seed density allows for a thick cover above the ground, consequently higher weed suppression. (6) Weed biomass is negatively related to crop biomass productivity.

2. Materials and Methods
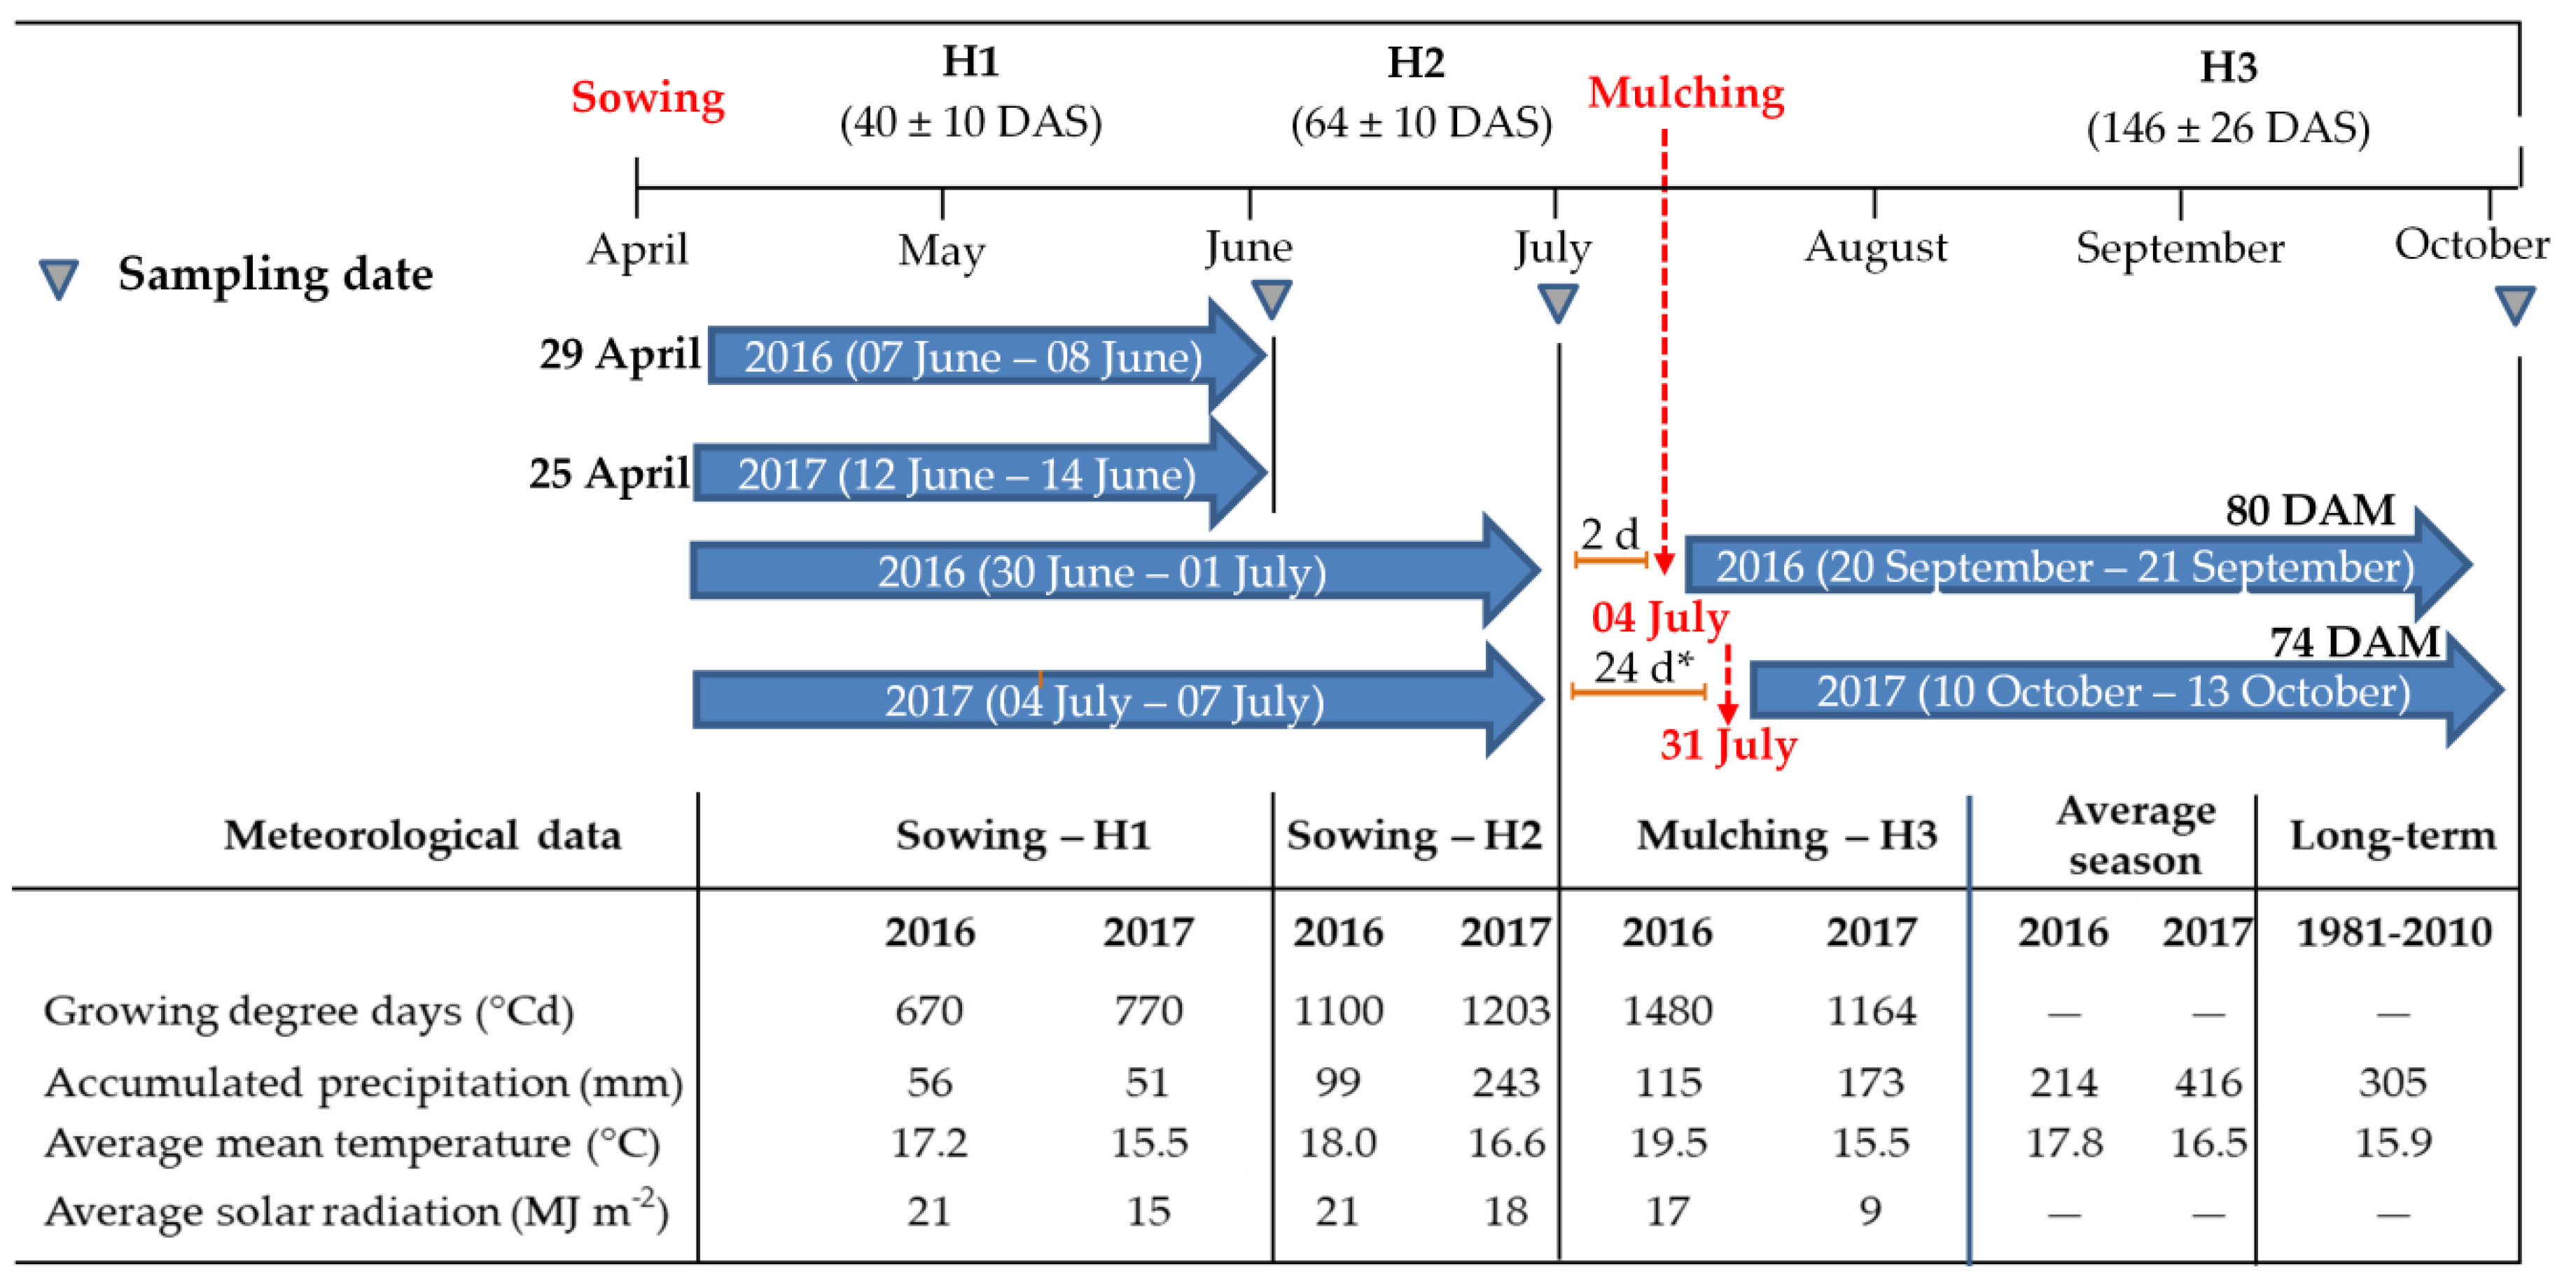
2.1. Study Sites

Two field trials were conducted on 2016 (field FU9) and on 2017 (field S5), respectively, at the experimental field station of the Humboldt University of Berlin in Dahlem (52°28′ N, 13°18′ E, 51 m above sea level). The two fields varied in soil fertility and soil type in the top 20-cm soil layer (Table 1). The crop sequence in both field trials was cereals—potato—winter wheat—legumes. All meteorological data at each harvest (H1, H2, and H3) during the growing season of each year are presented in Figure 1.

2.2. Experimental Design

The experimental design in both years was a randomized complete block design with three replicates in 2016 and four replicates in 2017. Plot size was 3 m × 9 m including plot margins. Each plot consisted of 20 rows with 13.5 cm spacing between rows. The selected species were alsike clover (cv. Dawn) and black medic (cv. Ekola). Five mixing ratios (MR) of AC:BM including 100:0, 67:33, 50:50, 33:67, and 0:100 were grown at three different sowing densities (Den) representing 50%, 100%, and 150% of recommended seed density.
The trial employed a response surface design (Figure S1) and included 16 variants per block, representing the monocultures of the two species at three densities (six variants), the three proportions at each seed density (nine variants), and a fallow plot as one further variant; this bare ground was used as a control plot for weed growth (Figure S2). Each of the 16 variants was assigned to one plot within a block. When the fallow is not included in the analysis, our design can also be considered as a two-factorial design with mixing ratios as one factor (with five levels), determined by the presence and proportion of the two legume species and seed density as the other factor (with three levels) (see Figure S1). The seeds were bought from the companies Deutsche Saatveredelung AG (DSV) and Camena-Samen for AC and BM, respectively.
Seed rates of AC and BM in monoculture in practice are reported as 10 and 15 kg ha−1, respectively [29]. These rates were modified to 7.6 and 17.6 kg ha−1 of AC and BM, respectively, according to their thousand grain weight (0.80 g for AC and 1.85 g for BM) in order to obtain an equal number of plants in the two monocultures. As a result, the absolute number of seeds in the monocultures at 100% relative seed density was 950 seeds m−2 for both species. This number of seeds was corrected for the percent of germination in each year. Based on this, the seeds were weighed for each plot, were thoroughly mixed in case of the mixtures, and were kept at room temperature (approximately 20 °C) for a few days before sowing in late April. Sowing depth was approximately 0.5 cm and was adjusted precisely in the field by using a sowing machine (Wintersteiger AG, Ried im Innkreis, Austria). Mulching in summer was done by cutting the crop and the weeds in all treatments including the zero-seed density control plots at approximately 4 cm height with a Uni-Mäher UMK 18 (from Gerhard Dücker KG Maschinenfabrik, Stadtlohn, Germany) and leaving the cut material on the plots.
The experimental layout contained buffer plots surrounding all main plots from the outside edge of the field with 1.5 m width. These buffer plots were planted with the highest density of the two-species equiproportional mixture. Dead seeds were used to be cultivated in the control plots to ensure consistent application of the sowing operation across all plots; here, seeds were killed by applying heat to the seeds in an oven at 100 °C for three consecutive days.

2.3. Weed Biomass and Cover Crop Biomass

We quantified cover crop and weed aboveground biomass (CCB and WB, respectively) in three harvest times, during spring, summer, and early autumn of each year. The time of harvest was based on calculating the growing degree days (GDD; °Cd) of BM by using a base temperature of 0.6 °C [56] to compare plants in similar growth stages across experimental years. Depending on these calculations the plants were specifically harvested at 670 ± 100 °Cd (40 ± 10 Days after Sowing; DAS) and 1100 ± 100 °Cd (64 ± 10 DAS) at H1 and H2, respectively.
After mulching, the degree days were calculated again for the regrowth of the plants; they represented 1480 °Cd in 2016 and 1164 °Cd in 2017. The difference in growing degree days (316 °Cd) was due to a delay in mulching by around 24 d after H2 in 2017 (Figure 1). The reason for this delay was related to rainy weather in 2017. In addition, the lower temperature during this period of plant regrowth extended the time required to reach the same degree days as in 2016. Despite all this, H3 was conducted around the same number of days after mulching in the two years (74 ± 6).
At each harvest, sampling was performed in a number of selected 0.5 m long rows only taken from the central seven m of the total nine m plot length. The total number of samples per each of the 16 variants was n = 12 (4 rows × 3 blocks) in 2016 and n = 16 (4 rows × 4 blocks) in 2017. The fresh samples were manually separated into three fractions of AC, BM, and all other species (which were considered as weeds). These sample fractions were then dried separately at 85 °C for 48 h to obtain the dry content. In addition, only in 2016, the weeds were identified as the species level in the selected 0.5 m of fallow plots and the monocultures of AC and BM at a density of 150% (Table S2) to characterize weed species composition on the site.
Mixture effect is one of the basic metrics to judge the performance of a mixture and its efficiency in biomass production and weed suppression. Here, we were interested in calculating the mixture effect only on weed suppression by subtracting the weed biomass in the mixture from the average weed biomass in the monoculture; Equation (1). When the weed biomass in the mixture is smaller than the weed biomass in the monoculture, it creates a negative size effect that indicates an efficiency of the mixture in weed suppression.
Mixture   Effect weed   suppression = WB Mixture WB Avg .   Monoculture

2.4. Statistical Analysis

Aiming to provide an easier interpretation of the results, data from each harvest were analyzed separately in each year (Yr) to determine the mixing ratio (MR) and the density (Den) effects and the interaction between them. CCB was normally distributed and homogenous with respect to variances, according to Shapiro test and Bartlett’s test, respectively. Weed biomass was not normally distributed and failed the homogeneity of variance test and was square-root-transformed to satisfy normality criteria and to homogenize variances.
To determine the Yr effect on the dependent variable (CCB and WB) at each harvest, a mixed linear model was used with Yr, MR, Den, Yr × MR, Yr × Den, MR × Den as fixed effects and block nested with row as random effects. Here, MR consisted of five levels, comprising the two monocultures and three mixtures with different species proportions.
Comparing different models using the plot nested in the block did not improve the model and showed higher AIC (Akaike Information Criterion) values [57]. Further statistical analysis was conducted for each year separately in each harvest by using mixed linear models with MR, Den and MR x Den as fixed effects and block nested with row as a random effect. The weedy fallow treatment was only included in analyzing WB at each harvest time to evaluate WB in the fallow treatments. After applying ANOVA, Tukey’s HSD tests at the 0.05 probability level were used to determine differences among the mean values of the mixing ratios at a given density and among the groups of seed densities by using the Agricola R-package [58].
To determine the mixture effect on weed suppression, we calculated contrasts of mixtures versus the average of their respective proportion-weighted monocultures. These absolute mixture effects were calculated for both CCB and WB. Absolute mixture effects were tested for significance by subjecting the contrasts to two-sided Welch’s t-tests against zero. Further, the effect of absolute mixture effect in the crops on the absolute mixture effects in weeds was tested with linear regression models. All statistical tests were performed using R (version 3.5.3) with R studio (version 1.1.383) [59].

3. Results

Depending on the climate data during the growing season, the experimental year of 2016 was characterized by a dry season with precipitation almost 30% less than the long-term average, while in 2017, it was a relatively wet season with precipitation almost 36% higher than the long-term average (Figure 1).

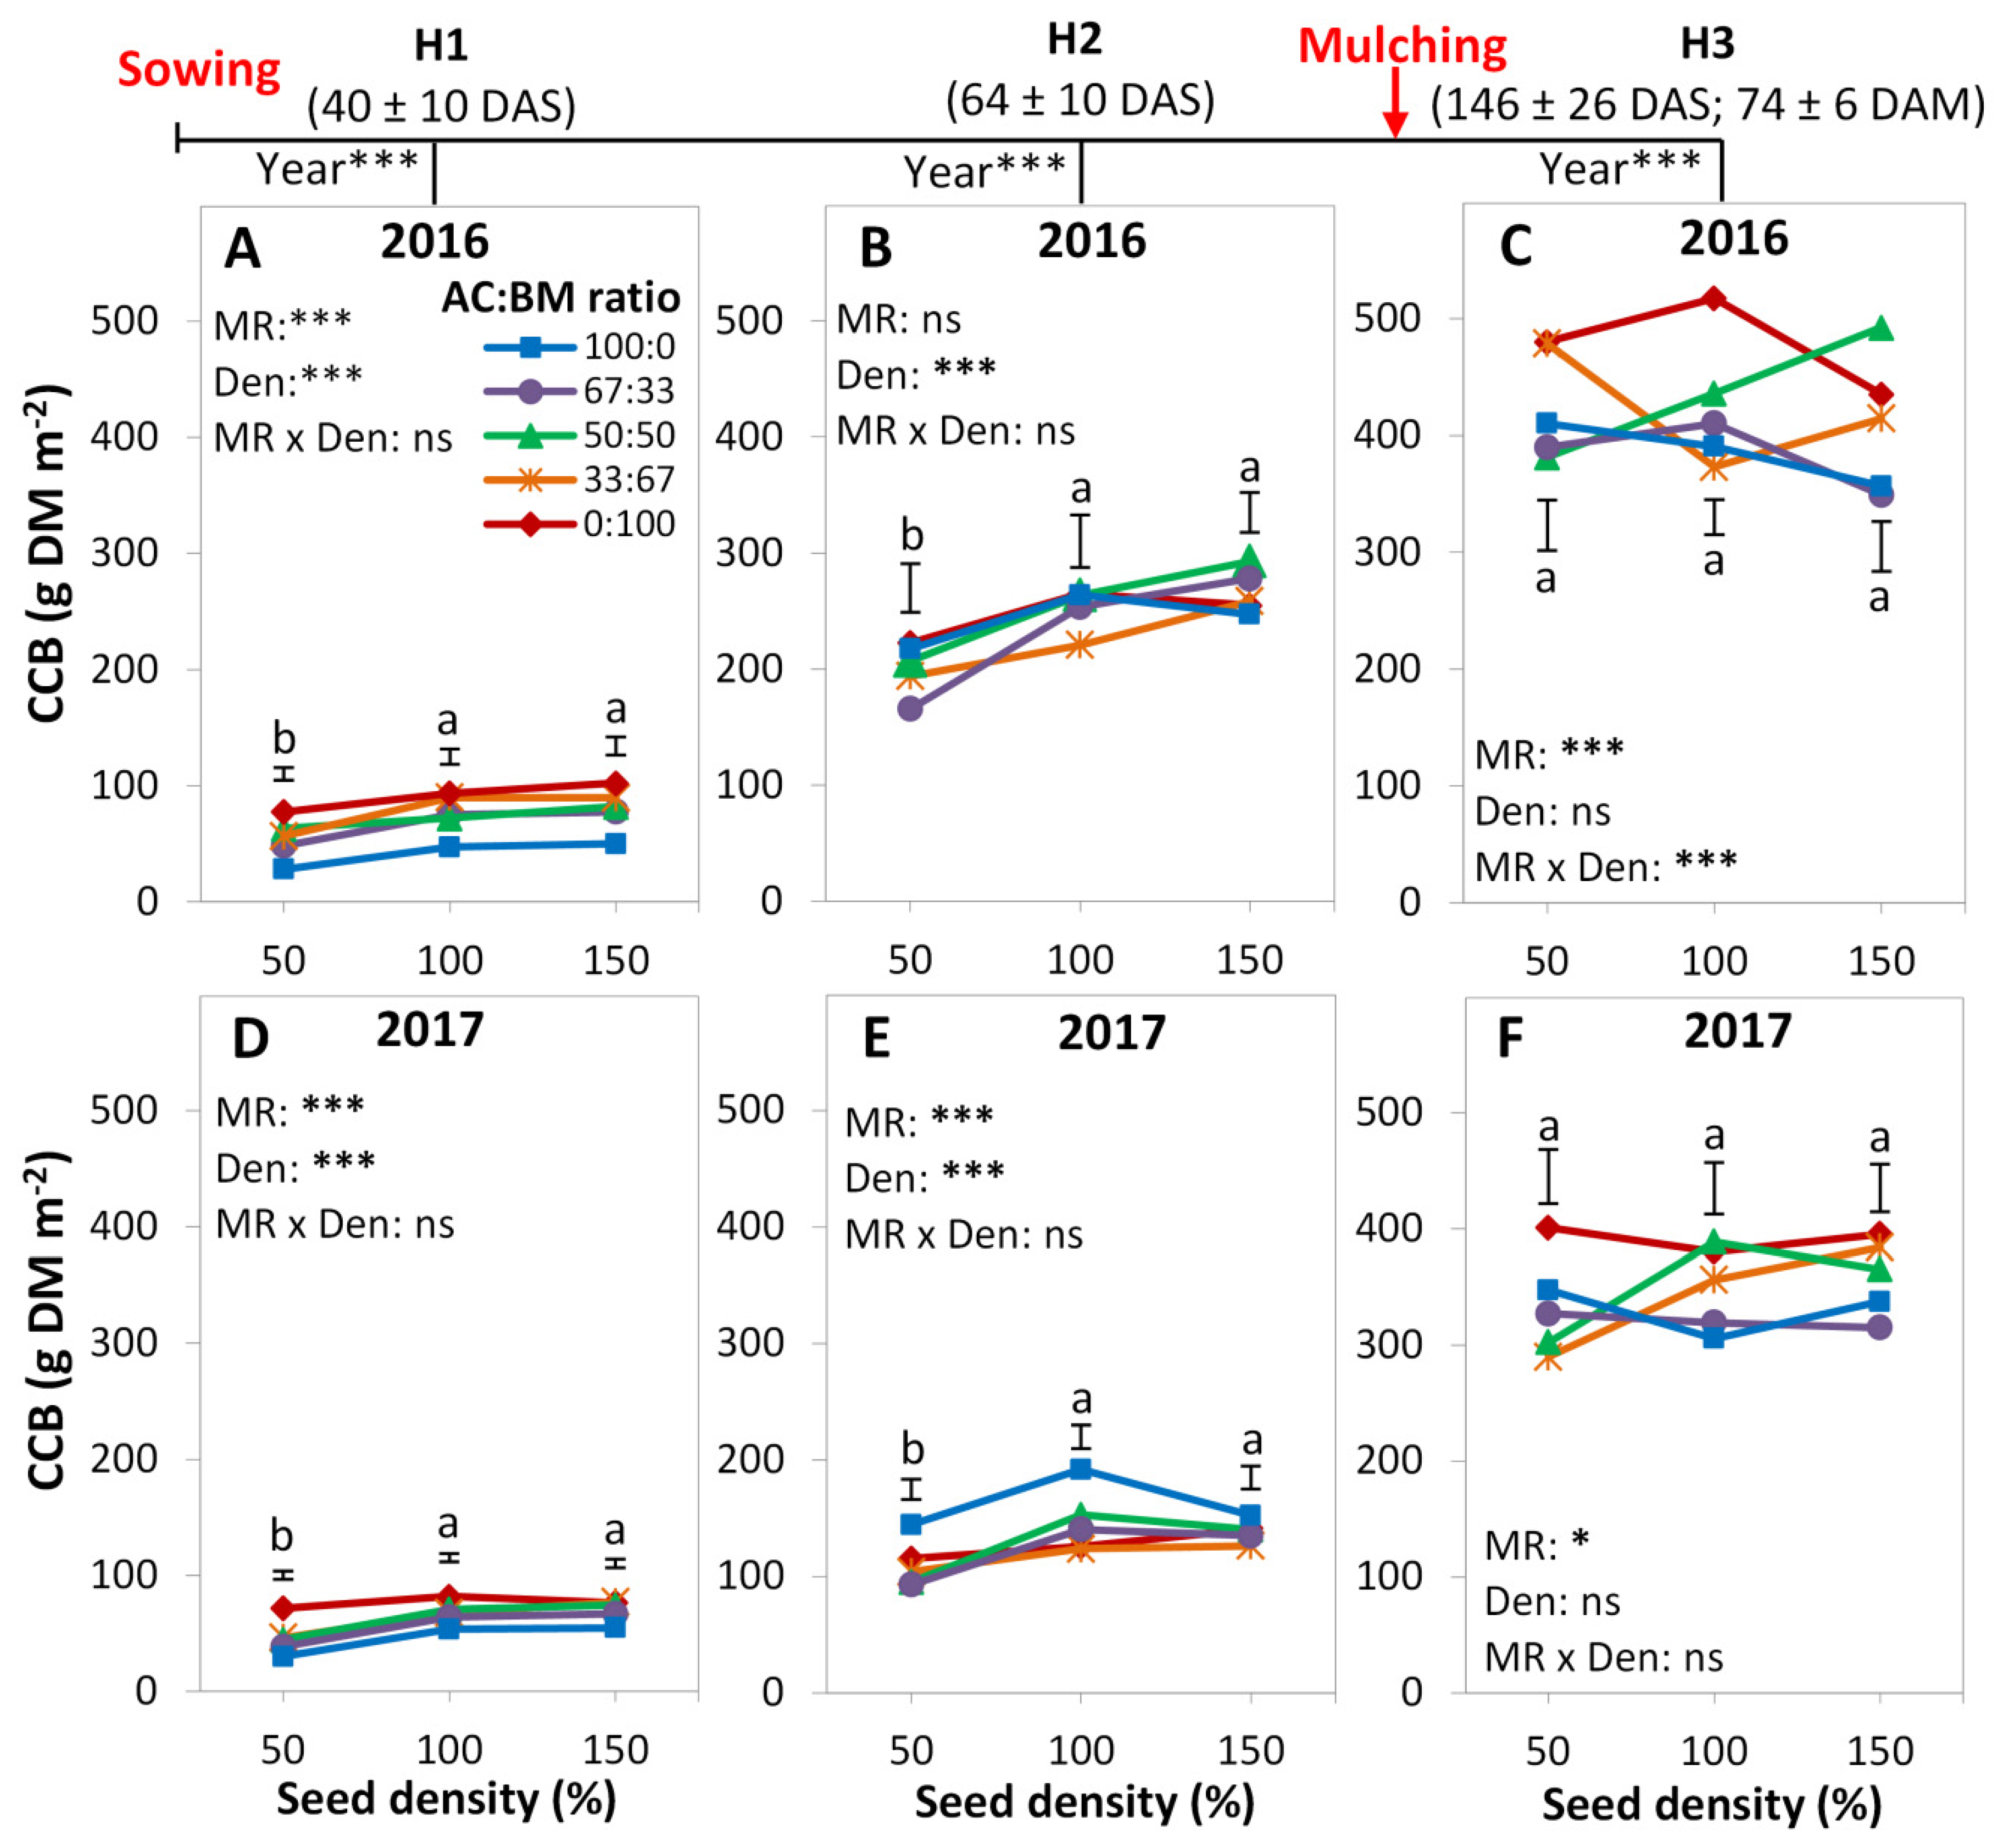
3.1. Cover Crop Biomass
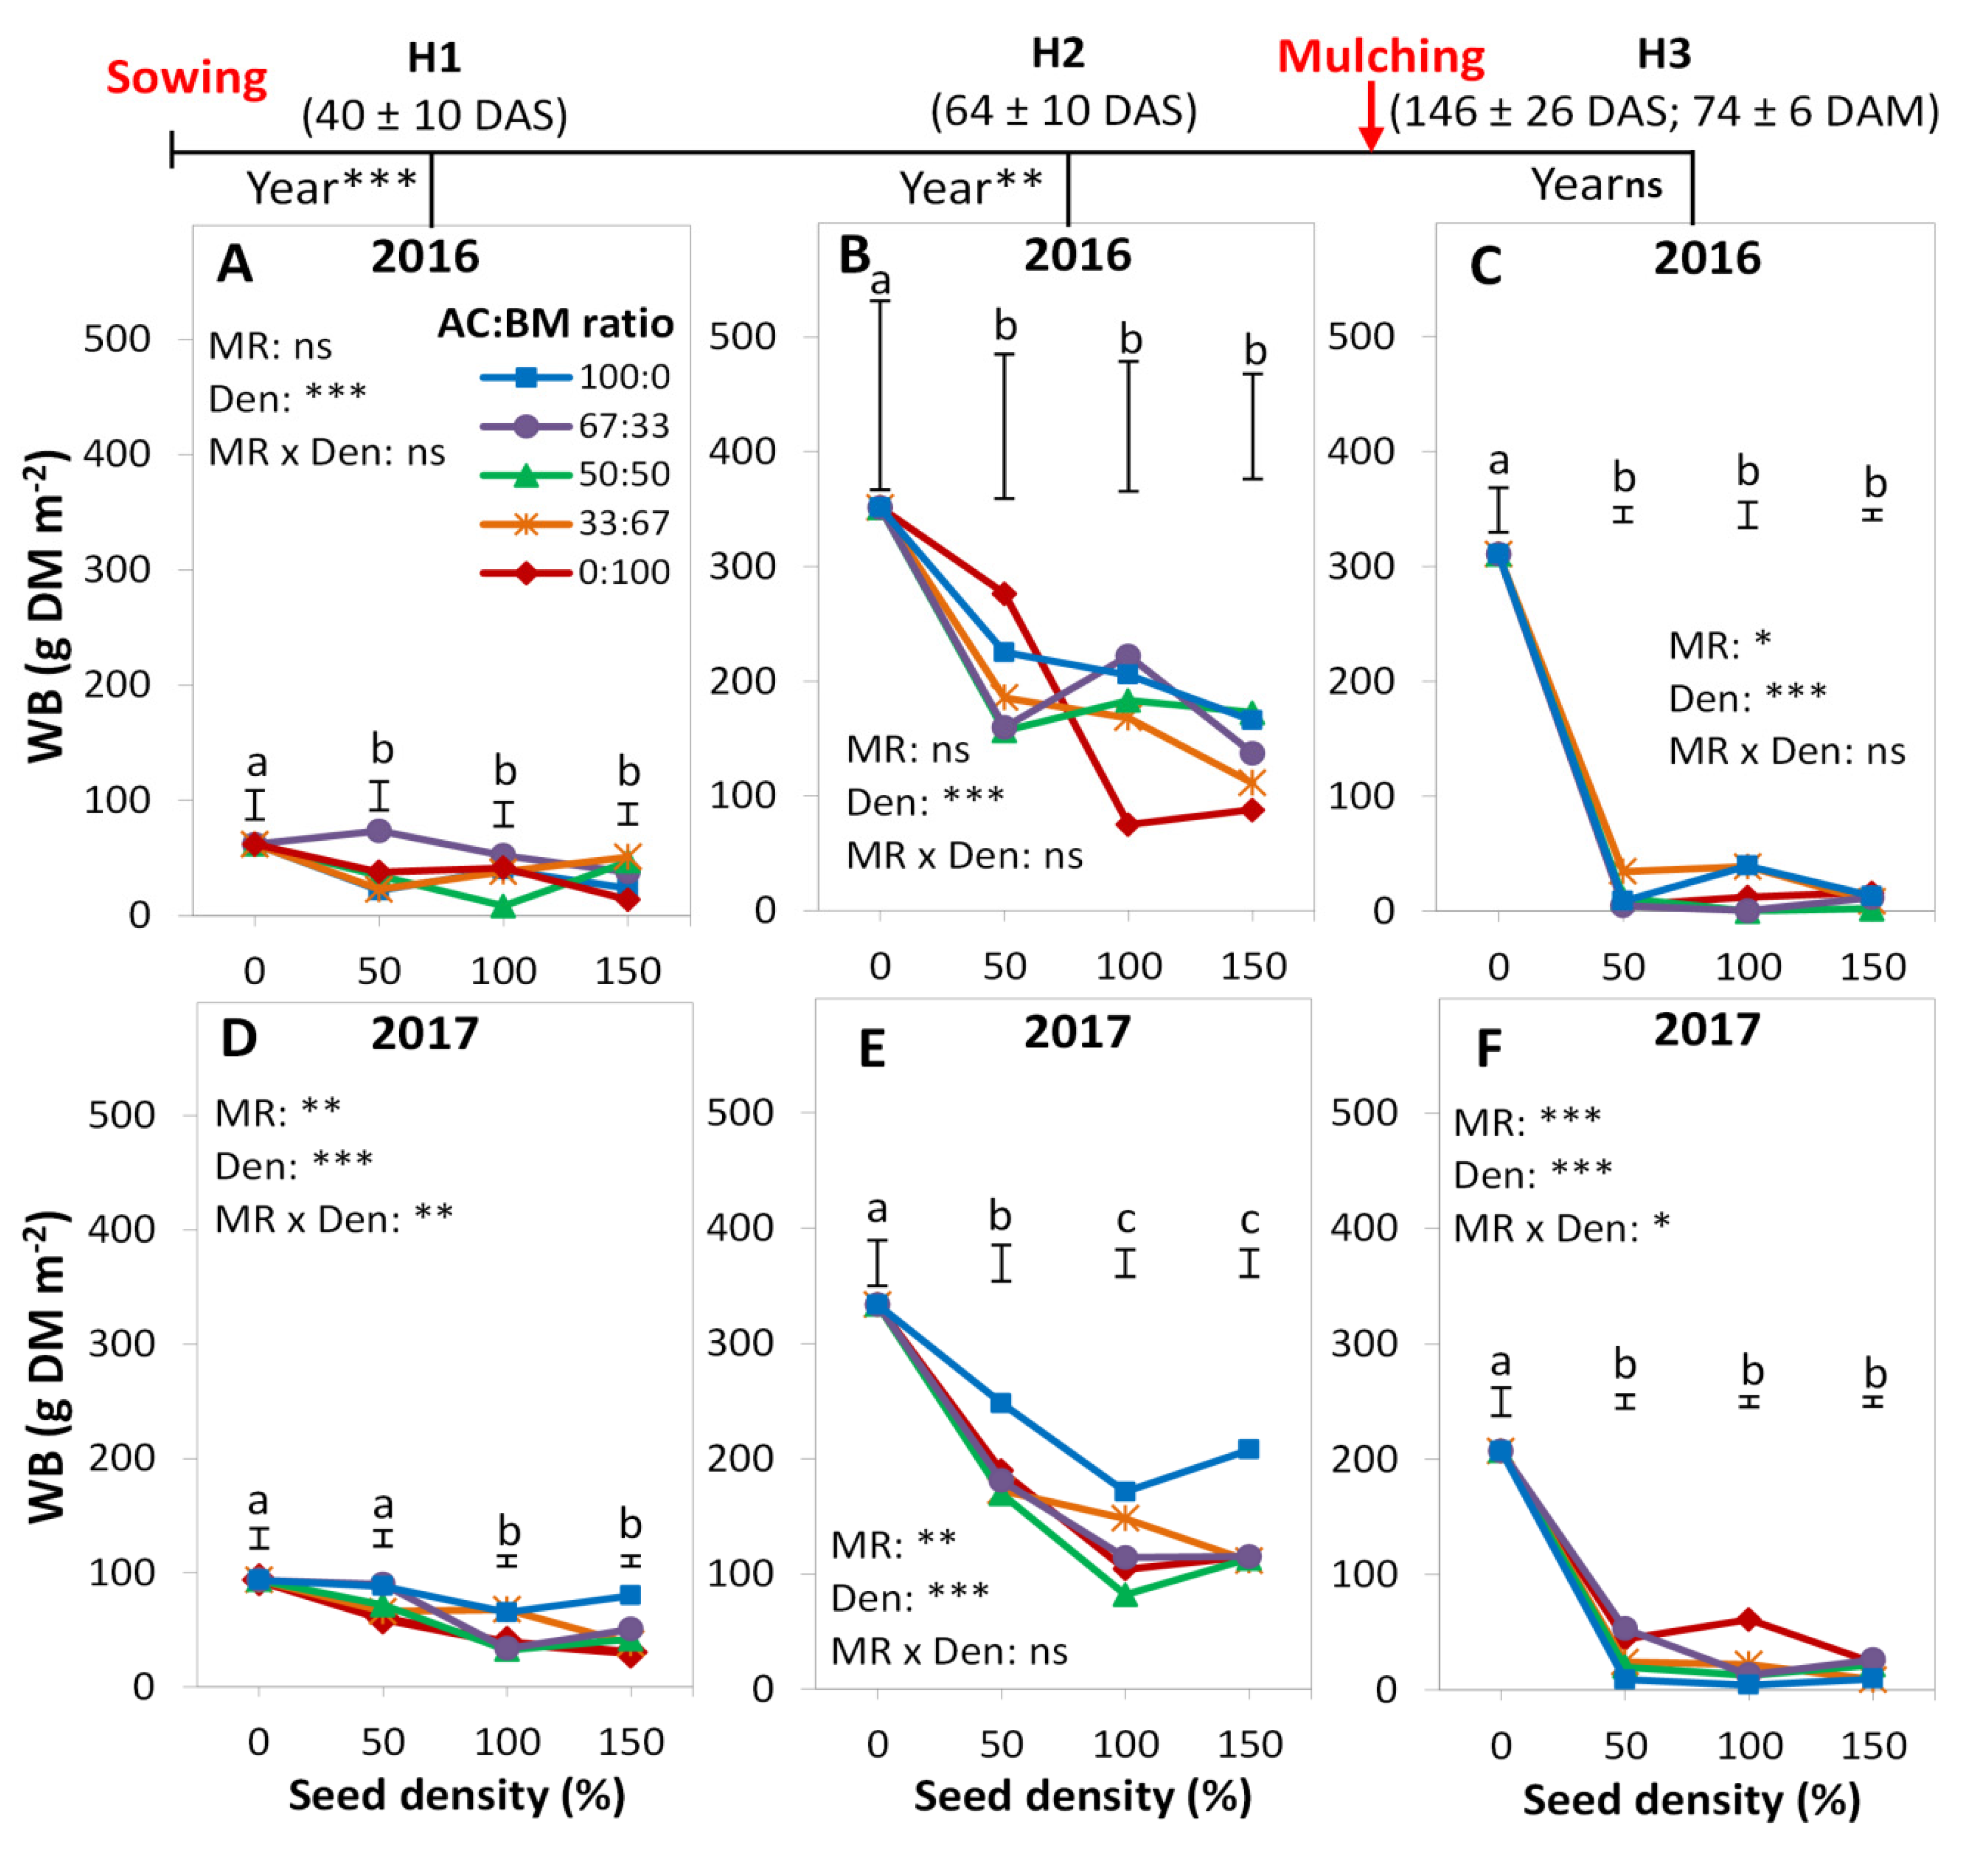
A strong and significant Yr effect was observed on mean CCB at each harvest time, with higher biomass values in 2016 than in 2017 by 12.9%, 45.0%, and 17.4% at H1, H2, and H3, respectively (Figure 2, Figure S5). In both years, the Den effect was significant only at H1 and H2. However, the MR effect was inconsistently significant at the different harvest times and not significant at all at H2 in 2016.
At H1, in both years, BM-monoculture was dominant at each given seed density, producing higher biomass up to 40.4% and 33.8 % in 2016 and 2017, respectively, than the other treatments. In contrast, AC-monoculture produced significantly the lowest CCB at each given seed density in comparison with the other treatments representing a reduction by 46.1% and 29.2% in 2016 and 2017, respectively. In the mixtures, a trend of producing less CCB was observed as the BM proportion decreased in the mixture. However, there was no significant difference between the three binary mixtures at any of the different densities (Figure 2A,D). The significant Den effect showed higher CCB at 100% and 150% seed density by 27.6% and 31.8%, respectively than 50%.
At H2, in both years, after crop establishment (ca. 30% of plants flowering), the dynamics of biomass productivity was highly depending on the growing conditions (weather and/or soil). Specifically, in 2016, no MR effect was observed while the Den effect was still significant and showed an increase in the CCB in an average of 20.5% and 24.4% at 100% and 150% seed density, respectively, in comparison to 50% seed density (Figure 2B). However, in 2017, significant effects were observed for MR and Den. In particular, AC-monoculture was significantly more productive than BM-monoculture by 20.2% and 34.5% at 50% and 100% seed density, respectively but not at density 150%. In the average of all mixing ratios, the Den effect was significant and showed an increase in CCB by 24.9% and 20.6% at 100% and 150% seed density, respectively, than the 50% seed density (Figure 2E).
At H3, in both years, the MR effect was again significant but stronger in 2016 than in 2017. The dynamics of plant regrowth after mulching showed similar dynamics as in H1, i.e., BM-monoculture produced the highest biomass than almost all the other treatments. An exception was in 2016 at density 150% when the equiproportional mixture produced higher CCB than the other mixtures, but significantly higher than the average monocultures by 24.4%. No density effect was observed after mulching and all the mixing ratios produced almost the same biomass at each given density. However, the CCB was significantly higher in 2016 than 2017 by 22.1%, 17.7%, and 12.2% at 50%, 100%, and 150%, respectively (Figure 2C,F).

3.2. Weed Biomass

The effect of the Yr on WB was gradually less significant over time, i.e., at H1, H2, and H3, respectively. The MR effect depended on the growing conditions and its strength increased over time (Figure 3A–F). However, in both years, the Den effect on weed suppression was always significant at each harvest with higher densities being associated with lower WB. The MR × Den interactions were not significant on WB, with the exception of those at H1 and H3 in 2017 (Figure 3).
At H1 in 2016, the MR effect was not significant, but the Den effect was significant and all the mixing ratios suppressed weeds effectively as the seed density increased. On average of the different mixing ratios, WB was reduced up to 44.1% at 150% seed density in comparison with the fallow plots (Figure 3A). On the contrary, in 2017, the MR effect was significant where AC-monoculture was the less suppressive at all seed densities and showed higher WB up to 49.9% at density 150% than the average of the other mixing ratios. In 2017, at the low seed density, WB did not differ significantly from the WB in the fallow plot. However, significant weed suppression has been observed at density 100% and 150% by 49.3% and 48.8%, respectively in comparison with the fallow plots (Figure 3D).
At H2, in 2016, only the Den effect was significant and WB decreased as the seed density increased, up to 61.6% at 150% seed density in comparison with the fallow plots (Figure 3B). In 2017, both MR and Den effects were significant and showed the same trend as in H1 of the same year; where again AC-monoculture was less suppressive and showed up to 45% more WB at 150% than the other treatments. The Den effect was significant at low density and reduced WB by 42.5%, in comparison with the fallow plot, but highly significant at density 100% and 150% and reduced WB by 62.9% and 60.3%, respectively (Figure 3E).
After mulching, at H3, WB decreased compared to H2 by 59.0% and 64.1% as mean values in 2016 and 2017, respectively (Figure 3B versus C, E versus F). The MR effect was significant in 2016; where the equiproportional mixture (50:50) was the most suppressive and showed up to 83.4% reduction in WB than the other mixing ratios. While, in 2017, the MR effect was highly significant but AC-monoculture was the most suppressive and reduced WB up to 73.8% than the other mixing ratios. Despite the high weed development in fallow plots (Figure 3C,F); all the cover crop treatments strongly reduced WB by 96% and 89% in 2016 and 2017, respectively. However, in an average of the different mixing ratios, the Den effect was not significant between the different treatments as seed density increased (Figure 3C,F).
In Figure 4, the linear correlation between CCB and WB revealed that the relationship between these two variables was dependent on the environment (a combination of trial year and trial site) and on the harvest time. In 2016, at H1 and H3, no significant relationship was found between CCB and WB, while at H2, the strength of the negative relationship between CCB and WB explained 96% of the variation (Figure 4B). Conversely in 2017, at H1 the linear relationship between WB and CCB explained 49% of the variation. No relation was observed at H2 and H3 (Figure 4D–F).
Out of 54 contrasts between mixtures and monocultures (2 trial years × 3 mixing proportions × 3 harvests × 3 seed densities), only eight contrasts showed significantly stronger weed suppression in mixtures than in their respective monocultures (Table 2). Within these contrasts, there was no obvious pattern with regard to the experimental factors, i.e., none of the variables (proportion, density and harvest time) showed a consistent influence on the mixture effect on weeds. However, pooled across all other factors (i.e., proportion, density and harvest time), mixing the legumes significantly reduced WB by 28%, as an average value, in 2017 compared to the respective monocultures, but not significantly in 2016 (Figure 5).

4. Discussion

The overarching goal of this study was to evaluate the ability of binary mixtures of only-legume forage species to suppress weeds, measured in the response of WB. We were also interested in learning whether the benefits of these mixtures would be consistent across different environmental conditions represented by three harvest times across the growing seasons (spring, summer, and early autumn seasons, the last after cover crop mulching, of two years 2016 and 2017). Here, we summarize and discuss the effects of the field trials with respect to cover crop species effect, diversity effects, proportion effects, density effects, mulching effects, site, and year effects.

4.1. Cover Crop Species Effect

Plant growth dynamics were similar in both years at the early stage of the establishment (H1), where BM-monoculture was dominant. This may be partly due to the fast growth rate of BM than AC, therefore it was expected for AC to be less competitive at the early growth stage [29,46]. The efficiency of BM in suppressing weed in both years likely confirms that rapid growth rate is a key trait for weed suppression [10,11]. However, the efficiency of AC in weed suppression at H1 in 2016 was comparable to the other treatments. This indicates that legume species with a slow growth rate may use alternative mechanisms such as allelopathy to suppress weeds at the early stage. It was widely reported that many species belonging to the genera Trifolium and Medicago release allelopathic compounds [60,61].
The dynamics of CCB at H2 after successful crop establishment were remarkably different, in both years, depending on the growing conditions. In 2016, the relatively dry conditions supported a better performance of both legume species in monocultures and mixtures than in 2017. Therefore, all treatments produced more or less equal biomass and suppressed weeds with the same efficiency. This finding was contrary to expectations for AC, as this species was supposed to be negatively affected by drought conditions [29,52,53] and consequently its strength to suppress weeds would be lower. The unexpectedly outstanding performance of AC in the dry season, in 2016, suggests that the effect of water level in limiting the growth of AC might be alleviated by other factors (e.g., soil physical, chemical, and biological properties).
In 2017, the significant increase in the biomass of AC-monoculture compared to the other treatments was a result of a heavy rain event experienced just 10 days before H2. This caused temporary waterlogging, which strongly affected the growth of BM in a negative way (e.g., plant yellowing). The negative response of BM in the wet conditions is in accordance with the literature [47,48]. However, the relative advantage of AC in these conditions did not result in a higher weed suppression capacity.
After mulching (H3), the dynamics of crop regrowth after mulching in both years were similar to H1, with the dominance of BM-monoculture over the other treatments. This suggests that the inherent characteristics of the plant species drive its growth and regrowth after mulching. Actually, BM is able to regrow after cutting through stoloniferous growth forming horizontal branched stem-like structure [49,50,51], whereas AC regrows after cutting by forming tiller-like branches at the crown that frequently develop into floral stem under favorable climatic and soil conditions [54]. In 2017, the strong ability of BM to recover, after mulching, after the stress event of heavy rains clearly demonstrated its resilient capacity to such events. However, BM is widely known for its better performance in dry conditions [29,46]. One of the main findings in this study suggests that AC and BM can be used as keystone species on weed suppression for sustainable agriculture in comparison with previous studies reported weed-suppressive effects of other legumes [32,33,34].

4.2. Diversity Effects

Diversity effects (mixing versus non-mixing) are expected to be strong in the case of mixing species with contrasting traits regarding growth rates, response to water and temperature [28,29]. This approach of diversification potentially entails higher efficiency of weed suppression via complementary and consistent biomass production across the whole season under variable environmental conditions [44,45]. In our study, despite the contrasting traits of the two legume species regarding growth rates, the observed diversity effects on weed suppression were mostly weak and inconsistent during the growing season (Table 2).
However, as an average over the whole season, mixtures significantly reduced WB compared to the monocultures only in 2017 (Figure 5). Therefore, our results show that diversity effects of legumes on weed suppression are partly in agreement with the expectations and observations made in previous studies [21,22,23,24]. These contradictory results make it more difficult to give any clear recommendations for farmers about whether or not mixing crops helps to suppress weeds. In our case, the results shown in Figure 5 and Table 2 suggest that although mixing species has the potential for weed suppression, the mixing effect is not always reliable and other practices need to be employed for effective weed control. Despite this, finding out a significant cumulative diversity effect of only-legume mixtures on weed suppression at least in one year is likely important to the intrinsic and functional value of legumes in agroecosystems. It indicates that the legacy effect of legume mixtures on weed suppression can be left during one growing season, but it depends on the growing conditions.
A potential explanation for the inconsistence of the diversity effect in the tested forage legume mixture on weed suppression is that species identity effects of the two legumes may have been comparatively strong, superseding any mixture effects [26,27]. In contrast to [25], our results present empirical evidence that species identity in legume mixtures is more important than species diversity. This may also include differential effects of the two legume species on some weed species. In both field trials, fat hen (Chenopodium album L.) and barnyard grass (Echinochloa crus galli L.) were dominant. Height measurements of the two weed species conducted after H2 in 2017 showed significant correlations with total WB (Figure S3) and confirmed that crop species identity effects on the weeds are strong. Moreover, the plant height of both weed species decreased with increasing crop density suggesting a strong competitive ability of AC and BM with fat hen and barnyard grass (Figure S4). Further, pot trials conducted with these weed species indicate that the two tested legumes showed differential allelopathic effects on these weeds [62].
A likely reason why we did not observe stronger diversity effects on weeds was the interference of temporal complementarity of the two legumes’ growth characteristics with mulching [28]. The potential of the two legumes to suppress weeds more strongly than is expected from their respective monocultures stems from their complementary growth characteristics over time: While BM grows fast and suppresses early weeds; later weed growth is inhibited by the slow-growing AC. However, by the time AC’s potential can be exploited, mulching takes place, thereby essentially resetting the conditions, and favouring BM, which in comparison to AC is faster to regrow after being cut.

4.3. Proportion Effects

Our study further provided an opportunity to test the potential effects of the variations of legume proportions within the mixtures on weed suppression. It was hypothesized that the increasing crop species evenness supports stronger weed suppression [38,39]. Possible mechanisms include the fact that the species that are evenly distributed in space may use resources more equitably and produce a competitive environment that is difficult for weeds to invade [36,38,39,40]. The results reported here only partially agree with this hypothesis.
At H1, species proportions played no role in weed suppression at the early growth stage. This may be related to the slow interaction between the two species at the early stage AC has a slow growth rate. This means that the approach of increasing evenness for efficient weed suppression might be not reliable at the early stage.
At H2, in 2017, the trend of the equiproportional mixture to be more suppressive than the other mixtures is in agreement with previous studies reporting that mixtures with greater species evenness are less prone to weeds infestation [7,39].
At H3, after mulching, the equiproportional mixture was almost, but not consistently more suppressive than the other mixtures. Here, the proportion effect is in line with some studies reported that evenness in mixtures is less likely to be a factor affecting WB [25,35,41]. From an agronomic viewpoint, our results across the whole season show that the changing species proportion in legume mixtures is not a hugely influential force on weed suppression.

4.4. Density Effects

At H1 and H2, we found that doubling crop density from 50% to 100% significantly increased weed suppression, confirming that high density increases the competitive interactions and resource use between cover crop species to ensure effective weed suppression [36,42,43]. However, no significant difference has been found between the seed densities 100% and 150% indicates that the recommended seed density of the selected legume species is sufficient for weed suppression. The efficiency of weed suppression at H2 (Figure 3B,E) is mainly a result of the deprivation of weeds from sunlight and space by increasing crop competition after successful establishment specifically at higher seed density [36,41]. Our results confirm that legume cover crops are able to suppress weeds efficiently as living mulches at high density.
At H3, after mulching, observing no density effect on CCB and WB is additional evidence for species-specific characteristics of AC and BM to compensate for low density. This finding is of practical importance in sustainable agriculture, as it confirms that after mulching adjusting seed density is of less importance on productivity and weed suppression. Based on this finding less concern can be given to seed density when mulching of cover crop is planned within the season or in long-term agricultural management practices (e.g., managed grassland), but on the condition that the species can compensate after cutting or after mulching.

4.5. Relationship between Crop Biomass and Weed Biomass

Although many studies hypothesized that the increase in biomass production was intimately related to greater weed suppression [44,45], we have found that this relationship between CCB and WB can be weak and inconsistent in forage legume crops (Figure 4). A key mechanism behind a rigorous relationship between CCB and WB is complementary, which occurs when there is asynchrony in species growth rates and/or in species responses to environmental. In our study, the contrasting traits of legume species in the mixture allowed for complementary that were time and condition dependent. However, the efficient weed suppression in the two years reveals that there is a parallel mechanism used by AC and BM independent of time and condition which is mostly allelopathy. Our finding indicates that the allelopathic ability of these two species is constitutive and it gives the two species plasticity to suppress weeds when the higher biomass productivity is limited by the environmental conditions.

4.6. Mulching Effects

In both years, at H3, weeds in the legume-plots were inhibited by the mulching and did not grow up; therefore, WB was significantly lower than H2. Comparing the fallow with any of the treatments with the cover crop confirms that mulching a legume cover crop strongly reduces WB. Three general mechanisms can be distinguished that may underlie this observation: (1) Cutting may lead to direct mortality, or reduced growth, of weeds in particular if the top-growth is removed at lower levels below 7 cm [63]; the reduction in biomass is evident from the comparison between H2 and H3 in the fallow plots. (2) Differential recovery from cutting between weeds, especially annual ones, and the forage legumes may lead to a shift in the competitive balance towards the crop; and (3) residues of legumes (and weeds) left as a dead mulch may contribute to weed suppression; either (a) as a physical barrier, (b) through reduced light transmittance to the soil surface [18], and (c) by release of allelochemicals [17,19,20] that reduce weed seedling growth. Due to this last mechanism, caution should be taken when the mulch of these two legume species come to practice in crop rotation because some unwanted consequences on the subsequent cash crop might be implemented. In fact, it has been reported that species that are suppressive to weeds might be suppressive to other crops [21].
An explanation as for why we did observe weeds after mulching in the fallow plots, (Figure 3C,F) despite the physical barrier of the dead plant residues above the soil surface may be related to three main potential reasons: (1) Some late-season weeds may have started to germinate immediately after cutting; (2) small weeds may have been left untouched by the mower and continued to grow; (3) recalcitrant weeds may have regrown even after cutting; indeed, we did observe that some species were able to regrow after mulching, e.g., barnyard grass (Echinochloa crus galli L.), mostly from individual un-cut tillers of cut plants.

4.7. Site and Year Effects

The variation in CCB and WB between the two fields in the study site was primarily the result of the different growing conditions for the cover crops and the weeds in the two years. In all treatments, at H1, CCB was generally lower in 2017 than 2016, whereas WB was higher even in the fallow plot (Figure 2A,D). The reduced CCB may be due to the low soil fertility in the field S5 (2017) than in FU9 (2016), specifically phosphorous that was 48.2% lower in 2017 than in 2016 (Table 1). This may have directly or indirectly affected legume growth as it is known that legumes need adequate amounts of phosphorous (P) for N2-fixing nodules (e.g., [16]). However, the higher WB in the same year, even in the fallow, indicates that the limited nutrient levels in 2017 did not reduce WB (Figure 3D). This finding is in line with studies reported that low soil fertility could be less resistant to weed invasion if it supports small competitive biomass leading to an increase in weed growth and establishment [15,39]. In addition, greater weed suppression in low-productive soil was also reported in a previous study [23].
An alternative explanation to the variation in CCB and WB between the two fields could be related to differences in the abundance of weeds in the seedbank as the initial seedbank can influence the success of cover crops on weed management [12]. Additionally, in both years the plants experienced different growth conditions that may have affected weed population dynamics as a function of ecological interactions within and between plant populations, nutrient, and water limitation, rainfall, and temperature [13]. Specifically, in 2017 the low temperature (Figure 1) at the early growth stage may have increased the prevalence of competitive weed species and this effect is in agreement with [14].

5. Conclusions

Both studied species, AC and BM, provide evidence for their ability to suppress weeds in monocultures and mixtures. However, the effectiveness of weed control by these legumes is time-dependent, species-dependent, and density-dependent (only before mulching). Further, species identity (or functional identity) in legume mixtures had a stronger effect than species diversity, with weed suppression in mixtures being stronger than in the respective monocultures only in one of the two study years. Thus, the crop diversity effect on weeds was dependent on the growing environment. The equiproportional mixture of legumes showed a weak trend to be more suppressive to weeds and was inconsistently more productive than a mixture dominated by either of the component species.
In addition, the effect of seed density on weed suppression depends on harvest time; higher density reduces weeds but no density effect is observed after mulching, indicating that compensatory growth against low density increases over time. Weed suppression in only-legume binary mixtures is partially related to high CCB productivity and depends on time and the environment. Moreover, mixture effects in the crop and weed suppression are time-dependent (within one season), but not all time-dependent effects are consistent. On the basis of this finding, the strength of weed suppression in the average of all treatments over the two years (40% shortly after establishment, 50% at the flowering stage, and 90% after mulching) indicates that legumes develop different mechanisms to suppress weeds, potentially including chemical (allelopathy) and physical effects. It also suggests that legumes have wide flexibility to be used in different locations for the purpose of weed suppression in marginal areas or ecological revegetated areas as biofertilizers.
Further research is needed to investigate the potential use of allelopathy at the early stage of legume growth to support our new finding and to determine if it is dependent on species, cultivar, and environmental conditions. In addition, it would be of great importance to understand which factors in the soil would alleviate the drought effect on drought-sensitive species such as AC to consider these factors for higher crop productivity and efficient weed suppression in dry-prone areas. Moreover, future studies with more focus on weed suppression are recommended to investigate an appropriate approach to use these two legumes in agriculture systems (e.g., by comparing leaving and removing the cut plant materials). We also suggest a research question regarding using AC and BM in environmental engineering and landscape management to suppress weeds or to use them as natural herbicides while increasing soil fertility.

Supplementary Materials

The following are available online at https://www.mdpi.com/2073-4395/9/10/648/s1, Figure S1: The Mixture design response surface methodology for different combinations of AC and BM, Figure S2: The design of the two field experiments, Figure S3: Relationship between weeds’ heights of Fat-hen (Chenopodium album L.), and Barnyard grass (Echinochloa crus-galli L.; Ech) and total WB, Figure S4: Weed height of Fat-hen (Chenopodium album L.) and Barnyard grass (Echinochloa crus-galli L.) in response to cover crops of AC and BM in monocultures and three binary mixtures, Figure S5: WB and CCB averaged across all treatments at three harvest times in 2016 and 2017; Table S1: Model output of the linear mixed model describing the mixing effects of AC and BM on CCB and WB, Table S2: List of the most common weeds in 2016 recorded in the fallow plots and at high density (150% of the recommended seed density) of AC and BM in monocultures.

Author Contributions

H.E. and T.D. conceived and designed the experiments, conducted the experiments, and collected the data. T.D. provided the facilities and advised on the preparation of materials. H.E. and T.D. wrote the manuscript. H.E., T.D., S.B.-K., and D.A. performed the statistical tests. S.B.-K. read and edited the manuscript. All authors approved the final manuscript.

Funding

This research was funded by the Jameel Scholarship at Humboldt-University, Berlin, Germany [Ph.D. project].

Acknowledgments

The Jameel Scholarship at Humboldt University, Berlin, Germany, is greatly appreciated for its financial support. We thank Timo Kautz and Christina-Luise Roß (Humboldt-University of Berlin, Department of Agronomy and Crop Science) for valuable suggestions and comments on the manuscript and the staff at the Humboldt-University research station in Dahlem for technical support during the two-field experiment.

Conflicts of Interest

The authors declare no competing financial interests.

References

  1. Chauhan, B.S.; Gill, G.S. Ecologically based weed management strategies. In Recent Advances in Weed Management; Chauhan, B.S., Mahajan, G., Eds.; Springer: New York, NY, USA, 2014; pp. 1–11. [Google Scholar]
  2. Abouziena, H.F.; Haggag, W.M. Weed Control in Clean Agriculture: A Review. Planta Daninha 2016, 34, 377–392. [Google Scholar] [CrossRef]
  3. Oerke, E.C. Crop losses to pests. J. Agric. Sci. 2006, 144, 31–43. [Google Scholar] [CrossRef]
  4. Westwood, J.H.; Charudattan, R.; Duke, S.O.; Fennimore, S.A.; Marrone, P.; Slaughter, D.C.; Swanton, C.; Zollinger, R. Weed Management in 2050: Perspectives on the Future of Weed Science. Weed Sci. 2018, 66, 275–285. [Google Scholar] [CrossRef] [Green Version]
  5. Lithourgidis, A.S.; Dordas, C.A.; Damalas, C.A.; Vlachostergios, D.N. Annual intercrops: An alternative pathway for sustainable agriculture. Aust. J. Crop Sci. 2011, 5, 396–410. [Google Scholar]
  6. Lemessa, F.; Wakjira, M. Cover crops as a means of ecological weed management in agroecosystems. J. Crop Sci. Biotechnol. 2015, 18, 133–145. [Google Scholar] [CrossRef]
  7. Finney, D.M.; Kaye, J.P. Functional diversity in cover crop polycultures increases multifunctionality of an agricultural system. J. Appl. Ecol. 2017, 54, 509–517. [Google Scholar] [CrossRef]
  8. Lorin, M.; Jeuffroy, M.H.; Butier, A.; Valantin-Morison, M. Undersowing winter oilseed rape with Frost-Sensitive legume living mulches to improve weed control. Eur. J. Agron. 2015, 71, 96–105. [Google Scholar] [CrossRef]
  9. Hiltbrunner, J.; Jeanneret, P.; Liedgens, M.; Stamp, P.; Streit, B. Response of weed communities to legume living mulches in winter wheat. J. Agron. Crop Sci. 2007, 193, 93–102. [Google Scholar] [CrossRef]
  10. Fradgley, N.S.; Creissen, H.E.; Pearce, H.; Howlett, S.A.; Pearce, B.D.; Döring, T.F.; Girling, R.D. Weed Suppression and Tolerance in Winter Oats. Weed Technol. 2017, 31, 740–751. [Google Scholar] [CrossRef] [Green Version]
  11. Weidlich, E.W.A.; von Gillhaussen, P.; Delory, B.M.; Blossfeld, S.; Poorter, H.; Temperton, V.M. The Importance of Being First: Exploring Priority and Diversity Effects in a Grassland Field Experiment. Front. Plant Sci. 2017, 7, 1–12. [Google Scholar] [CrossRef]
  12. Teasdale, J.R.; Mangum, R.W.; Radhakrishnan, J.; Cavigelli, M.A. Weed seedbank dynamics in three organic farming crop rotations. Agron. J. 2004, 96, 1429–1435. [Google Scholar] [CrossRef]
  13. Ramesh, K.; Matloob, A.; Aslam, F.; Florentine, S.K.; Chauhan, B.S. Weeds in a Changing Climate: Vulnerabilities, Consequences, and Implications for Future Weed Management. Front. Plant Sci. 2017, 8, 95. [Google Scholar] [CrossRef] [PubMed]
  14. Ferrero, R.; Lima, M.; Davis, A.S.; Gonzalez-Andujar, J.L. Weed Diversity Affects Soybean and Maize Yield in a Long Term Experiment in Michigan, USA. Front. Plant Sci. 2017, 8, 1–10. [Google Scholar] [CrossRef] [PubMed]
  15. Ruisi, P.; Frangipane, B.; Amato, G.; Frenda, A.S.; Plaia, A.; Giambalvo, D.; Saia, S. Nitrogen uptake and nitrogen fertilizer recovery in old and modern wheat genotypes grown in the presence or absence of interspecific competition. Front. Plant Sci. 2015, 6, 1–10. [Google Scholar] [CrossRef] [PubMed]
  16. Sulieman, S.; Tran, L.S.P. Phosphorus homeostasis in legume nodules as an adaptive strategy to phosphorus deficiency. Plant Sci. 2015, 239, 36–43. [Google Scholar] [CrossRef]
  17. Mahmood, A.; Ihsan, M.Z.; Khaliq, A.; Hussain, S.; Cheema, Z.A.; Naeem, M.; Daur, I.; Hussain, H.A.; Alghabari, F. Crop Residues Mulch as Organic Weed Management Strategy in Maize. Clean-Soil Air Water 2016, 44, 317–324. [Google Scholar] [CrossRef]
  18. Ranaivoson, L.; Naudin, K.; Ripoche, A.; Affholder, F.; Rabeharisoa, L.; Corbeels, M. Agro-Ecological functions of crop residues under conservation agriculture. A review. Agron. Sustain. Dev. 2017, 37, 1–17. [Google Scholar] [CrossRef]
  19. Caamal-Maldonado, J.A.; Jiménez-Osornio, J.J.; Torres-Barragán, A.; Anaya, A.L. The use of allelopathic legume cover and mulch species for weed control in cropping systems. Agron. J. 2001, 93, 27–36. [Google Scholar] [CrossRef]
  20. Reddy, P.P. Crop Residue Management and Organic Amendments. In Agro-Ecological Approaches to Pest Management for Sustainable Agriculture; Springer: Singapore, 2017; pp. 29–41. [Google Scholar]
  21. Bedoussac, L.; Journet, E.P.; Hauggaard-Nielsen, H.; Naudin, C.; Corre-Hellou, G.; Jensen, E.S.; Prieur, L.; Justes, E. Ecological principles underlying the increase of productivity achieved by Cereal-Grain legume intercrops in organic farming. A review. Agron. Sustain. Dev. 2015, 35, 911–935. [Google Scholar] [CrossRef]
  22. Corre-Hellou, G.; Dibet, A.; Hauggaard-Nielsen, H.; Crozat, Y.; Gooding, M.; Ambus, P.; Dahlmann, C.; von Fragstein, P.; Pristeri, A.; Monti, M.; et al. The competitive ability of Pea-Barley intercrops against weeds and the interactions with crop productivity and soil N availability. Field Crop. Res. 2011, 122, 264–272. [Google Scholar] [CrossRef]
  23. Bilalis, D.; Papastylianou, P.; Konstantas, A.; Patsiali, S.; Karkanis, A.; Efthimiadou, A. Weed-Suppressive effects of Maize-Legume intercropping in organic farming. Int. J. Pest Manag. 2010, 56, 173–181. [Google Scholar] [CrossRef]
  24. Stoltz, E.; Nadeau, E. Effects of intercropping on yield, weed incidence, forage quality and soil residual N in organically grown forage maize (Zea mays L.) and faba bean (Vicia faba L.). Field Crop. Res. 2014, 169, 21–29. [Google Scholar] [CrossRef]
  25. Connolly, J.; Sebastià, M.T.; Kirwan, L.; Finn, J.A.; Llurba, R.; Suter, M.; Collins, R.P.; Porqueddu, C.; Helgadóttir, Á.; Baadshaug, O.H.; et al. Weed suppression greatly increased by plant diversity in intensively managed grasslands: A Continental-Scale Experiment. J. Appl. Ecol. 2018, 55, 852–862. [Google Scholar] [CrossRef] [PubMed]
  26. Smith, R.G.; Atwood, L.W.; Warren, N.D. Increased productivity of a cover crop mixture is not associated with enhanced agroecosystem services. PLoS ONE 2014, 9, e97351. [Google Scholar] [CrossRef]
  27. Cong, W.F.; Suter, M.; Lüscher, A.; Eriksen, J. Species interactions between forbs and Grass-Clover contribute to yield gains and weed suppression in forage grassland mixtures. Agric. Ecosyst. Environ. 2018, 268, 154–161. [Google Scholar] [CrossRef]
  28. Yu, Y.; Makowski, D.; Stomph, T.J.; van der Wopke, W. Robust increases of land equivalent ratio with temporal niche differentiation: A Meta-Quantile regression. Agron. J. 2016, 108, 2269–2279. [Google Scholar] [CrossRef]
  29. Döring, T.F.; Baddeley, J.A.; Brown, R.; Collins, R.; Crowley, O.; Cuttle, S.; Howlett, S.A.; Jones, H.E.; Mccalman, H.; Measures, M.; et al. Using Legume-Based mixtures to enhance the nitrogen use efficiency and economic viability of cropping systems: Project Report (RD-2007-3447). HGCA/Agric. Hort. Dev. Board 2013, 190. [Google Scholar]
  30. Finn, J.A.; Kirwan, L.; Connolly, J.; Sebastià, M.T.; Helgadottir, A.; Baadshaug, O.H.; Bélanger, G.; Black, A.; Brophy, C.; Collins, R.P.; et al. Ecosystem function enhanced by combining four functional types of plant species in intensively managed grassland mixtures: A 3-Year Continental-Scale field experiment. J. Appl. Ecol. 2013, 50, 365–375. [Google Scholar] [CrossRef]
  31. Stagnari, F.; Maggio, A.; Galieni, A.; Pisante, M. Multiple benefits of legumes for agriculture sustainability: An overview. Chem. Biol. Technol. Agric. 2017, 4, 1–13. [Google Scholar] [CrossRef]
  32. Storkey, J.; Döring, T.; Baddeley, J.; Marshall, A.; Roderick, S.; Jones, H. Modelling the ability of legumes to suppress weeds. Asp. Appl. Biol. 2011, 109, 53–58. [Google Scholar]
  33. Döring, T.F.; Storkey, J.; Baddeley, J.A.; Collins, R.P.; Crowley, O.; Howlett, S.A.; Jones, H.E.; McCalman, H.; Measures, M.; Pearce, H.; et al. Weeds in Organic Fertility-Building Leys: Aspects of Species Richness and Weed Management. Org. Farming 2017, 3. [Google Scholar] [CrossRef]
  34. Dhamala, N.R.; Eriksen, J.; Carlsson, G.; Søegaard, K.; Rasmussen, J. Highly productive forage legume stands show no positive biodiversity effect on yield and N2-Fixation. Plant Soil 2017, 417, 169–182. [Google Scholar] [CrossRef]
  35. Emery, S.M.; Gross, K.L. Dominant species identity, not community evenness, regulates invasion in experimental grassland plant communities. Ecology 2007, 88, 954–964. [Google Scholar] [CrossRef] [PubMed]
  36. Hauggaard-Nielsen, H.; Andersen, M.K.; Jørnsgaard, B.; Jensen, E.S. Density and relative frequency effects on competitive interactions and resource use in pea-barley intercrops. Field Crop. Res. 2006, 95, 256–267. [Google Scholar] [CrossRef]
  37. Kirwan, L.; Lüscher, A.; Sebastià, M.T.; Finn, J.A.; Collins, R.P.; Porqueddu, C.; Helgadottir, A.; Baadshaug, O.H.; Brophy, C.; Coran, C.; et al. Evenness drives consistent diversity effects in intensive grassland systems across 28 European sites. J. Ecol. 2007, 95, 530–539. [Google Scholar] [CrossRef]
  38. Tracy, B.F.; Renne, I.J.; Gerrish, J.; Sanderson, M.A. Effects of plant diversity on invasion of weed species in experimental pasture communities. Basic Appl. Ecol. 2004, 5, 543–550. [Google Scholar] [CrossRef]
  39. Tracy, B.F.; Sanderson, M.A. Forage productivity, species evenness and weed invasion in pasture communities. Agric. Ecosyst. Environ. 2004, 102, 175–183. [Google Scholar] [CrossRef]
  40. Polley, H.W.; Wilsey, B.J. Reductions in grassland species evenness increase dicot seedling invasion and spittle bug infestation. Ecol. Lett. 2002, 5, 676–684. [Google Scholar] [Green Version]
  41. Sanderson, M.A.; Brink, G.; Stout, R.; Ruth, L. Grass-Legume proportions in forage seed mixtures and effects on herbage yield and weed abundance. Agron. J. 2013, 105, 1289–1297. [Google Scholar] [CrossRef]
  42. Bulson, H.A.J.; Snaydon, R.W.; Stopes, C.E. Effects of plant density on intercropped wheat and field beans in an organic farming system. J. Agric. Sci. 1997, 128, 59–71. [Google Scholar] [CrossRef]
  43. Weiner, J.; Andersen, S.B.; Wille, W.K.M.; Griepentrog, H.W.; Olsen, J.M. Evolutionary Agroecology: The potential for cooperative, high density, Weed-Suppressing cereals. Evol. Appl. 2010, 3, 473–479. [Google Scholar] [CrossRef] [PubMed]
  44. Finney, D.M.; White, C.M.; Kaye, J.P. Biomass production and carbon/nitrogen ratio influence ecosystem services from cover crop mixtures. Agron. J. 2016, 108, 39–52. [Google Scholar] [CrossRef]
  45. Bybee-Finley, K.; Mirsky, S.B.; Ryan, M.R. Crop Biomass Not Species Richness Drives Weed Suppression in Warm-Season Annual Grass–Legume Intercrops in the Northeast. Weed Sci. 2017, 65, 669–680. [Google Scholar] [CrossRef]
  46. Clark, A. Managing Cover Crops Profitably. In Sustainable Agriculture Research and Education, 3rd ed.; Sustainable Agriculture Network: Beltsville, MD, USA, 2007; pp. 1–244. [Google Scholar]
  47. FAO. Ecocrop, Data Sheet, Black medic (Medicago Lupulina). Available online: http://ecocrop.fao.org/ecocrop/srv/en/dataSheet?id=7654 (accessed on 15 September 2019).
  48. Floulds, W. Response To Soil Moisture Supply in Three Leguminous Species: I.; Growth, Reproduction and Mortality. New Phytol. 1978, 80, 535–545. [Google Scholar] [CrossRef]
  49. Dzyubenko, N.I.; Dzyubenko, E.A. Crops. Medicago lupulina L.-Black medic. In Interactive Agricultural Ecological Atlas of Russia and Neighboring Countries. Economic Plants and their Diseases, Pests and Weeds; 2009; Available online: http://www.agroatlas.ru/en/content/cultural/Medicago_lupulina_K/index.html (accessed on 15 September 2019).
  50. Watschke, T.L.; Dernoeden, P.H.; Shetlar, D.J. Managing Turfgrass Pests, 2nd ed.; CRC Press: London, UK, 2013; p. 519. [Google Scholar]
  51. Heuzé, V.; Thiollet, H.; Tran, G.; Hassoun, P.; Lebas, F. Feedipedia, Black medic (Medicago lupulina), a program by INRA, CIRAD, AFZ, and FAO. Available online: https://www.feedipedia.org/node/277 (accessed on 15 September 2019).
  52. Chapman, H.M.; Dodds, K.G.; Keoghan, J.M. Evaluation of the agronomic potential of pasture legume introductions on droughty outwash soils. N. Z. J. Agric. Res. 1990, 33, 21–27. [Google Scholar] [CrossRef]
  53. Sheaffer, C.C.; Ehlke, N.J.; Albrecht, K.A.; Peterson, P.R. Forage Legumes: Clovers, Birdsfoot Trefoil, Cicer Milkvetch, Crownvetch and Alfalfa, 2nd ed.; Agric. Exp. Stn.: Saint Paul, Minnesota, 2003; pp. 608–2003. [Google Scholar]
  54. Fairey, D.T. Alsike clover. Commun. Branch Agric. Can. 1989, 30, 410–415. [Google Scholar]
  55. Agricultural Climatology of the Humboldt-University of Berlin. Available online: https://www.agrar.hu-berlin.de/de/institut/departments/dntw/agrarmet/service/wo (accessed on 15 September 2018).
  56. Tribouillois, H.; Dürr, C.; Demilly, D.; Wagner, M.H.; Justes, E. Determination of germination response to temperature and water potential for a wide range of cover crop species and related functional groups. PLoS ONE 2016, 11, 1–16. [Google Scholar] [CrossRef]
  57. Burnham, K.P.; Anderson, D.R.; Huyvaert, K.P. AIC model selection and multimodel inference in behavioral ecology: Some background, observations, and comparisons. Behav. Ecol. Sociobiol. 2011, 65, 23–35. [Google Scholar] [CrossRef]
  58. De Mendiburu, F. Agricolae: Statistical Procedures for Agricultural Research. R package version 1.3-0. 2019. Available online: https://CRAN.R-project.org/package=agricolae (accessed on 15 September 2019).
  59. R Core Team language and environment for statistical computing. R Foundation for Statistical Computing; R Core Team language and environment for statistical computing: Vienna, Austria, 2019; Available online: https://www.R-project.org/. (accessed on 1 August 2019).
  60. Chon, S.U.; Jennings, J.A.; Nelson, C.J. Alfalfa (Medicago sativa L.) autotoxicity: Current Status. Allelopath. J. 2006, 18, 57–80. [Google Scholar]
  61. Liu, Q.; Xu, R.; Yan, Z.; Jin, H.; Cui, H.; Lu, L.; Zhang, D.; Qin, B. Phytotoxic allelochemicals from roots and root exudates of Trifolium pratense. J. Agric. Food Chem. 2013, 61, 6321–6327. [Google Scholar] [CrossRef]
  62. Elsalahy, H.; Bellingrath-Kimura, S.; Döring, T. Allelopathic effects in species mixtures of legumes. In Proceedings of the Improving Sown Grasslands through Breeding and Management, Proceedings of the Joint 20th Symposium of the European Grassland Federation and the 33rd Meeting of the EUCARPIA, Zurich, Switzerland, 24–27 June 2019; Huguenin-Elie, O., Studer, B., Kölliker, R., Reheul, D., Probo, M., Barre, P., Feuerstein, U., Roldán-Ruiz, I., Mariotte, P., Hopkins, A., Eds.; Organising Committee: Zurich, Switzerland, 2019; p. 128. [Google Scholar]
  63. Abu-Dieyeh, M.; Watson, A. Impact of mowing and weed control on broadleaf weed population dynamics in turf. J. Plant Interact. 2005, 1, 239–252. [Google Scholar] [CrossRef] [Green Version]
Figure 1. Schedule of the two field experiments and the meteorological data including the accumulated precipitation (mm), average mean temperature (°C), and average radiation (MJ m−2) during three harvest times (H1, H2, and H3) in the years 2016 and 2017 (Source: Agricultural Climatology of the HU-Berlin, Dahlem; [55]). DAS: Days After Sowing, DAM: Days After Mulching. “*” was mentioned to clarify the reason for the delay in mulching in 2017.
Agronomy 09 00648 g001
Figure 2. Cover crop aboveground biomass (CCB) of alsike clover (AC) and black medic (BM) contained 15 treatments of five mixing ratios (MR) of AC:BM (100:0, 67:33, 50:50, 33:67, and 0:100) sown at three seed densities (Den) represent 50%, 100%, and 150% of the recommended seed density and harvested three times (H1; panel A and D, H2; Panel B and E, and H3; Panel C and F) per growing seasons of 2016 (Panel A, B, and C) and 2017 (Panel D, E, and F). Vertical bars represent Tukey’s HSD.test (p < 0.05) at a given seed density. Different letters above the vertical bars indicate significant differences among the densities, based on ANOVA followed by Tukey’s HSD test (p < 0.05). Asterisks indicate significant effects of the MR, Den, and the interaction between them according to ANOVA; *** = p < 0.001, ** = p < 0.01, * = p < 0.05, ns = not significant.
Agronomy 09 00648 g002
Figure 3. Weed biomass (WB) emerged in the fallow plots and with cover crop of alsike clover (AC) and black medic (BM) contained 15 treatments of five mixing ratios (MR) of AC:BM (100:0, 67:33, 50:50, 33:67, and 0:100) sown at three seed densities (Den) represent 50%, 100%, and 150% of the recommended seed density and harvested three times (H1; panel A and D, H2; panel B and E, and H3; panel C and F) per growing season of 2016 (Panel A, B, and C) and 2017 (Panel D, E, and F). Vertical bars represent Tukey’s HSD test (p < 0.05) at a given seed density. Different letters above the vertical bars indicate significant differences among the densities, based on ANOVA followed by Tukey’s HSD test (p < 0.05). Asterisks indicate significant effects of MR, Den, and the interaction between them according to ANOVA; *** = p < 0.001, ** = p < 0.01, * = p < 0.05, and ns = not significant.
Agronomy 09 00648 g003
Figure 4. Linear correlation between the cover crop aboveground biomass (CCB) and weed biomass (WB); the cover crop species are alsike clover (AC) and black medic (BM) contained 15 treatments of five mixing ratios (MR) of AC:BM (100:0, 67:33, 50:50, 33:67, and 0:100; colored in symbols blue, violet, green, orange, and red, respectively), sown at three seed densities (Den) represent 50%, 100%, and 150% of the recommended seed density, and harvested three times (H1; panel A and D, H2; panel B and E and H3; panel C and F) per growing season of 2016 (Panel A, B, and C) and 2017 (Panel D, E, and F).
Agronomy 09 00648 g004
Figure 5. Weed biomass (WB) in the fallow plots, monocultures, and mixtures of two legume cover crops of alsike clover (AC) and black medic (BM) in two years 2016 and 2017. The treatments of the cover crop contained five mixing ratios of AC:BM (100:0, 67:33, 50:50, 33:67, and 0:100) sown at three seed densities (50%, 100%, and 150% of the recommended seed densities). The WB was harvested three times during the season at H1: In spring (40 ± 10 days after sowing; DAS), H2: In summer (64 ± 10 DAS), and H3: In autumn (146 ± 26 DAS). The vertical error bars represent standard error (SD/10). Different letters above the vertical bars indicate significant differences among the means of the fallow plots, monocultures, and mixtures across the three harvest times, based on ANOVA followed by Tukey’s HSD test (p < 0.05).
Agronomy 09 00648 g005
Table 1. Summary of soil physical and chemical properties at FU9 and S5 fields for the top 20 cm of the soil profile.
Site (Year)Soil TypepH Organic Matter NPK MgCa Fe Soil Texture
SandClaySilt
%mg kg−1%
FU9 (2016)Sandy clay loam6.31.240.1325190521471735469229
S5 (2017)Sandy loam5.60.720.09121833712425044761410
Table 2. Mixture effect on weed suppression for three binary mixtures of alsike clover (AC) and black medic (BM) in comparison with average monocultures in two years 2016 and 2017 at three harvest times (H1: 40 ± 10 days after sowing (DAS), H2: 64 ± 10 DAS, and H3: 146 ± 26 DAS). The mixtures included three mixing ratios of AC:BM 67:33, 50:50, and 33:67 sown at three seed densities (50%, 100%, and 150% of the recommended seed density). Abbreviations are MixB: A mixture dominated by BM, MixC: A mixture of equal proportions of the two species, MixA: AMixture dominated by AC, Avg_mono: Average monocultures of both species. Asterisks indicate a significant difference according to Welch’s t-test at p < 0.05. Mixture effect = WBMixture – WBAvg. Monoculture. All negative values of size effect indicate suppressive mixtures.
Density (%)Contrast: Mixture vs. Average of Respective Monocultures20162017
H1H2H3H1H2H3
Effect SizepEffect SizepEffect SizepEffect SizepEffect SizepEffect SizeP
50MixB-Avg_mono−7.00.49−65.10.4927.40.13−7.90.48−46.50.05 *−2.30.81
MixC-Avg_mono4.70.81−94.00.304.30.27−2.60.87−49.30.05 *−6.70.50
MixA-Avg_mono43.60.19−91.10.34−2.40.4815.90.31−37.90.3426.60.14
100MixB-Avg_mono−2.40.8927.80.7912.80.5815.70.02 *10.50.73−10.50.14
MixC-Avg_mono−32.20.01 **43.00.59−25.90.07−19.60.03 *−55.90.05 *−19.90.07
MixA-Avg_mono11.80.5381.60.44−25.60.07−18.30.03 *−23.50.37−12.50.24
150MixB-Avg_mono32.10.09−15.80.79−6.30.23−17.20.17−50.30.05 *−7.90.15
MixC-Avg_mono28.20.02 *45.80.36−12.5< 0.01 **−13.40.09−48.10.064.70.48
MixA-Avg_mono19.20.1710.20.90−3.00.63−4.40.57−46.40.099.30.46
*** = p < 0.001, ** = p < 0.01, * = p < 0.05.

