Article

Potential of Cultivating Dry Season Maize along a Hydrological Gradient of an Inland Valley in Uganda

1
National Agricultural Research Organization, National Crops Resources Research Institute, P.O. Box Kampala 7084, Uganda
2
Agroecology and Organic Farming, Institute of Crop Science and Resource Conservation, University of Bonn, Auf dem Hügel 6, 53121 Bonn, Germany
3
Africa Rice Center (AfricaRice), P.O. Box 1690, Antananarivo 101, Madagascar
4
Institute of Crop Science and Resource Conservation, University of Bonn, Karlrobert-Kreiten-Str. 13, 53115 Bonn, Germany
*
Author to whom correspondence should be addressed.
Agronomy 2019, 9(10), 606; https://doi.org/10.3390/agronomy9100606
Submission received: 11 September 2019 / Revised: 29 September 2019 / Accepted: 30 September 2019 / Published: 2 October 2019
(This article belongs to the Section Innovative Cropping Systems)

Abstract

:
Inland valley wetlands with higher soil moisture than surrounding uplands offer a yet unexplored opportunity for increasing maize production in East Africa. For three consecutive years, we conducted field experiments to assess the potential of an inland valley in Central Uganda for producing dry season maize. A randomized complete block design was used with six treatments including farmer’s practice, unfertilized control, organic and inorganic fertilizer applications at high and low rates. These were repeated four times at each of the three hydrological positions of the inland valley (fringe, middle, and center). The maize grain yield of 3.4 t ha−1 (mean across treatments and years) exceeded the national yield average by 42%. High and sustained soil moisture in the center position of the inland valley was associated with the highest grain yields irrespective of the year. Due to soil moisture deficit in the fringe and middle hydrological positions, grain yields were not only lower but also highly variable. Intensive manuring with a combination of green and poultry manure produced high yields that were comparable to those with mineral fertilizers (both at 120 kg N ha−1). Lower amounts of either mineral or organic fertilizer (60 kg N ha−1) provided no yield gain over the unfertilized control. Inland valley wetlands, thus, offer promise for farmers to harvest an additional maize crop during the dry season, thus contributing to farm income and regional food security.

1. Introduction

Maize (Zea mays) is the most important staple crop grown in East Africa [1]. The grains form an important part of the food and feed system of the region providing more than 19% of the dietary calorie supply for the population [2] and contributing 30%−50% of the household income of smallholder farmers, who produce about 90% of the maize. The per capita annual consumption of maize grain in Kenya, Tanzania, and Uganda amounts to 103, 73, and 31 kg, respectively [3]. Maize is also a major constituent of animal feeds, and a growing demand for animal products by a rapidly growing urban middle class is further driving regional maize demand [4]. Currently, Tanzania alone uses up to 800,000 MT of maize as animal feeds, while Kenya and Uganda use only about 350,000 [5] and 260,000 MT [6], respectively.
Maize in East Africa is predominantly grown in smallholder farms under rainfed conditions with low fertilizer input. The dependence on rainfall increases the vulnerability of these farming systems to climate variability [7]. Accordingly, a high spatial–temporal variability in rainfall increasingly affects maize yields, causing both food insecurity and reduced income of rural households [8].
In contrast, wetlands are highly productive, potentially arable, and low-drought-risk areas that could be used to enhance crop production [9]. They store soil moisture for long periods, thus providing residual moisture for crop growth during the dry season, when no rainfed crops can be grown in upland fields [10]. Wetlands also act as sinks where soil organic matter and nutrients accumulate, making wetland soils more fertile and productive than those of the surrounding uplands [11]. Accordingly, shifting crop production from uplands to wetlands constitutes an important coping mechanism for smallholder farmers against yield losses caused by drought and declining soil fertility. However, wetlands must be farmed with caution. Over-exploitation can undermine important wetland functions related to other non-provisioning ecosystem services [12,13]. Unregulated clearing and draining of wetlands for expanding agricultural production areas and the associated modification of hydrological regimes and nutrient fluxes can lead to irreversible wetland degradation. Pollution resulting from overuse of fertilizers and pesticides can adversely impact natural biota (and fish) and undermine the ecological functions of many wetlands.
In Uganda, wetlands cover an estimated 3 million hectares [14]. Seventy five percent of these wetlands are seasonal, meaning that they may flood during the wet season, while conserving sufficient soil moisture to sustain crop production during the dry season [14]. Currently, only about 7% (157,000 ha) of the seasonal wetlands in Uganda are cropped [14], leaving some 2 million hectares for potential future agricultural use. The agricultural census of 2010 showed that 2.4 million MT of maize grain is produced in Uganda from an area of 1.1 million hectares annually [15]. This may be increased significantly with a reasonable expansion of the agricultural use of wetland. Since seasonal wetlands are dispersed throughout the country and occur in almost all regions of Uganda, a large number of rural agricultural households could benefit from cultivating dry season maize on residual soil moisture in inland valley wetlands.
Occasionally, smallholder farmers in Uganda opt for cultivating maize in wetland margins (fringe zones), although yield losses occur due to drought or insufficient soil moisture. Rarely do farmers cultivate the wetter middle or center zones of valley wetlands. The farmers’ decision to cultivate wetlands is often guided by indigenous knowledge rather than policy recommendations as technical guidelines for the sustainable use of wetlands are not available [16]. Few studies have attempted to assess the suitability of seasonal wetlands for crop intensification. Little or no attention has been paid to the agronomic relevance of the different hydrological positions of the wetlands (fringe, middle, and center). A zonal differentiation, however, is likely to determine wetland suitability (grain yield and yield stability) since soil attributes and water dynamics greatly vary between these positions [9]. In this study, we investigated the suitability of the different hydrological positions of an inland valley wetland in Central Uganda for producing dry season maize and tested its response to different crop management options including mineral and organic fertilizers. In Uganda, availability of and farmers’ access to mineral fertilizers is limited [17], especially in rural areas where application rates are <15 kg N ha−1. Organic amendments, on the other hand, are widely available, though highly variable in quality. Applications rates for organic amendments in maize are <100 kg N ha−1 [17]. We also estimated the grain yield gain of improved crop management over the farmer’s practice at different hydrological positions. Findings from this study may guide the development of inland valley wetlands for crop production in East Africa.

2. Materials and Methods

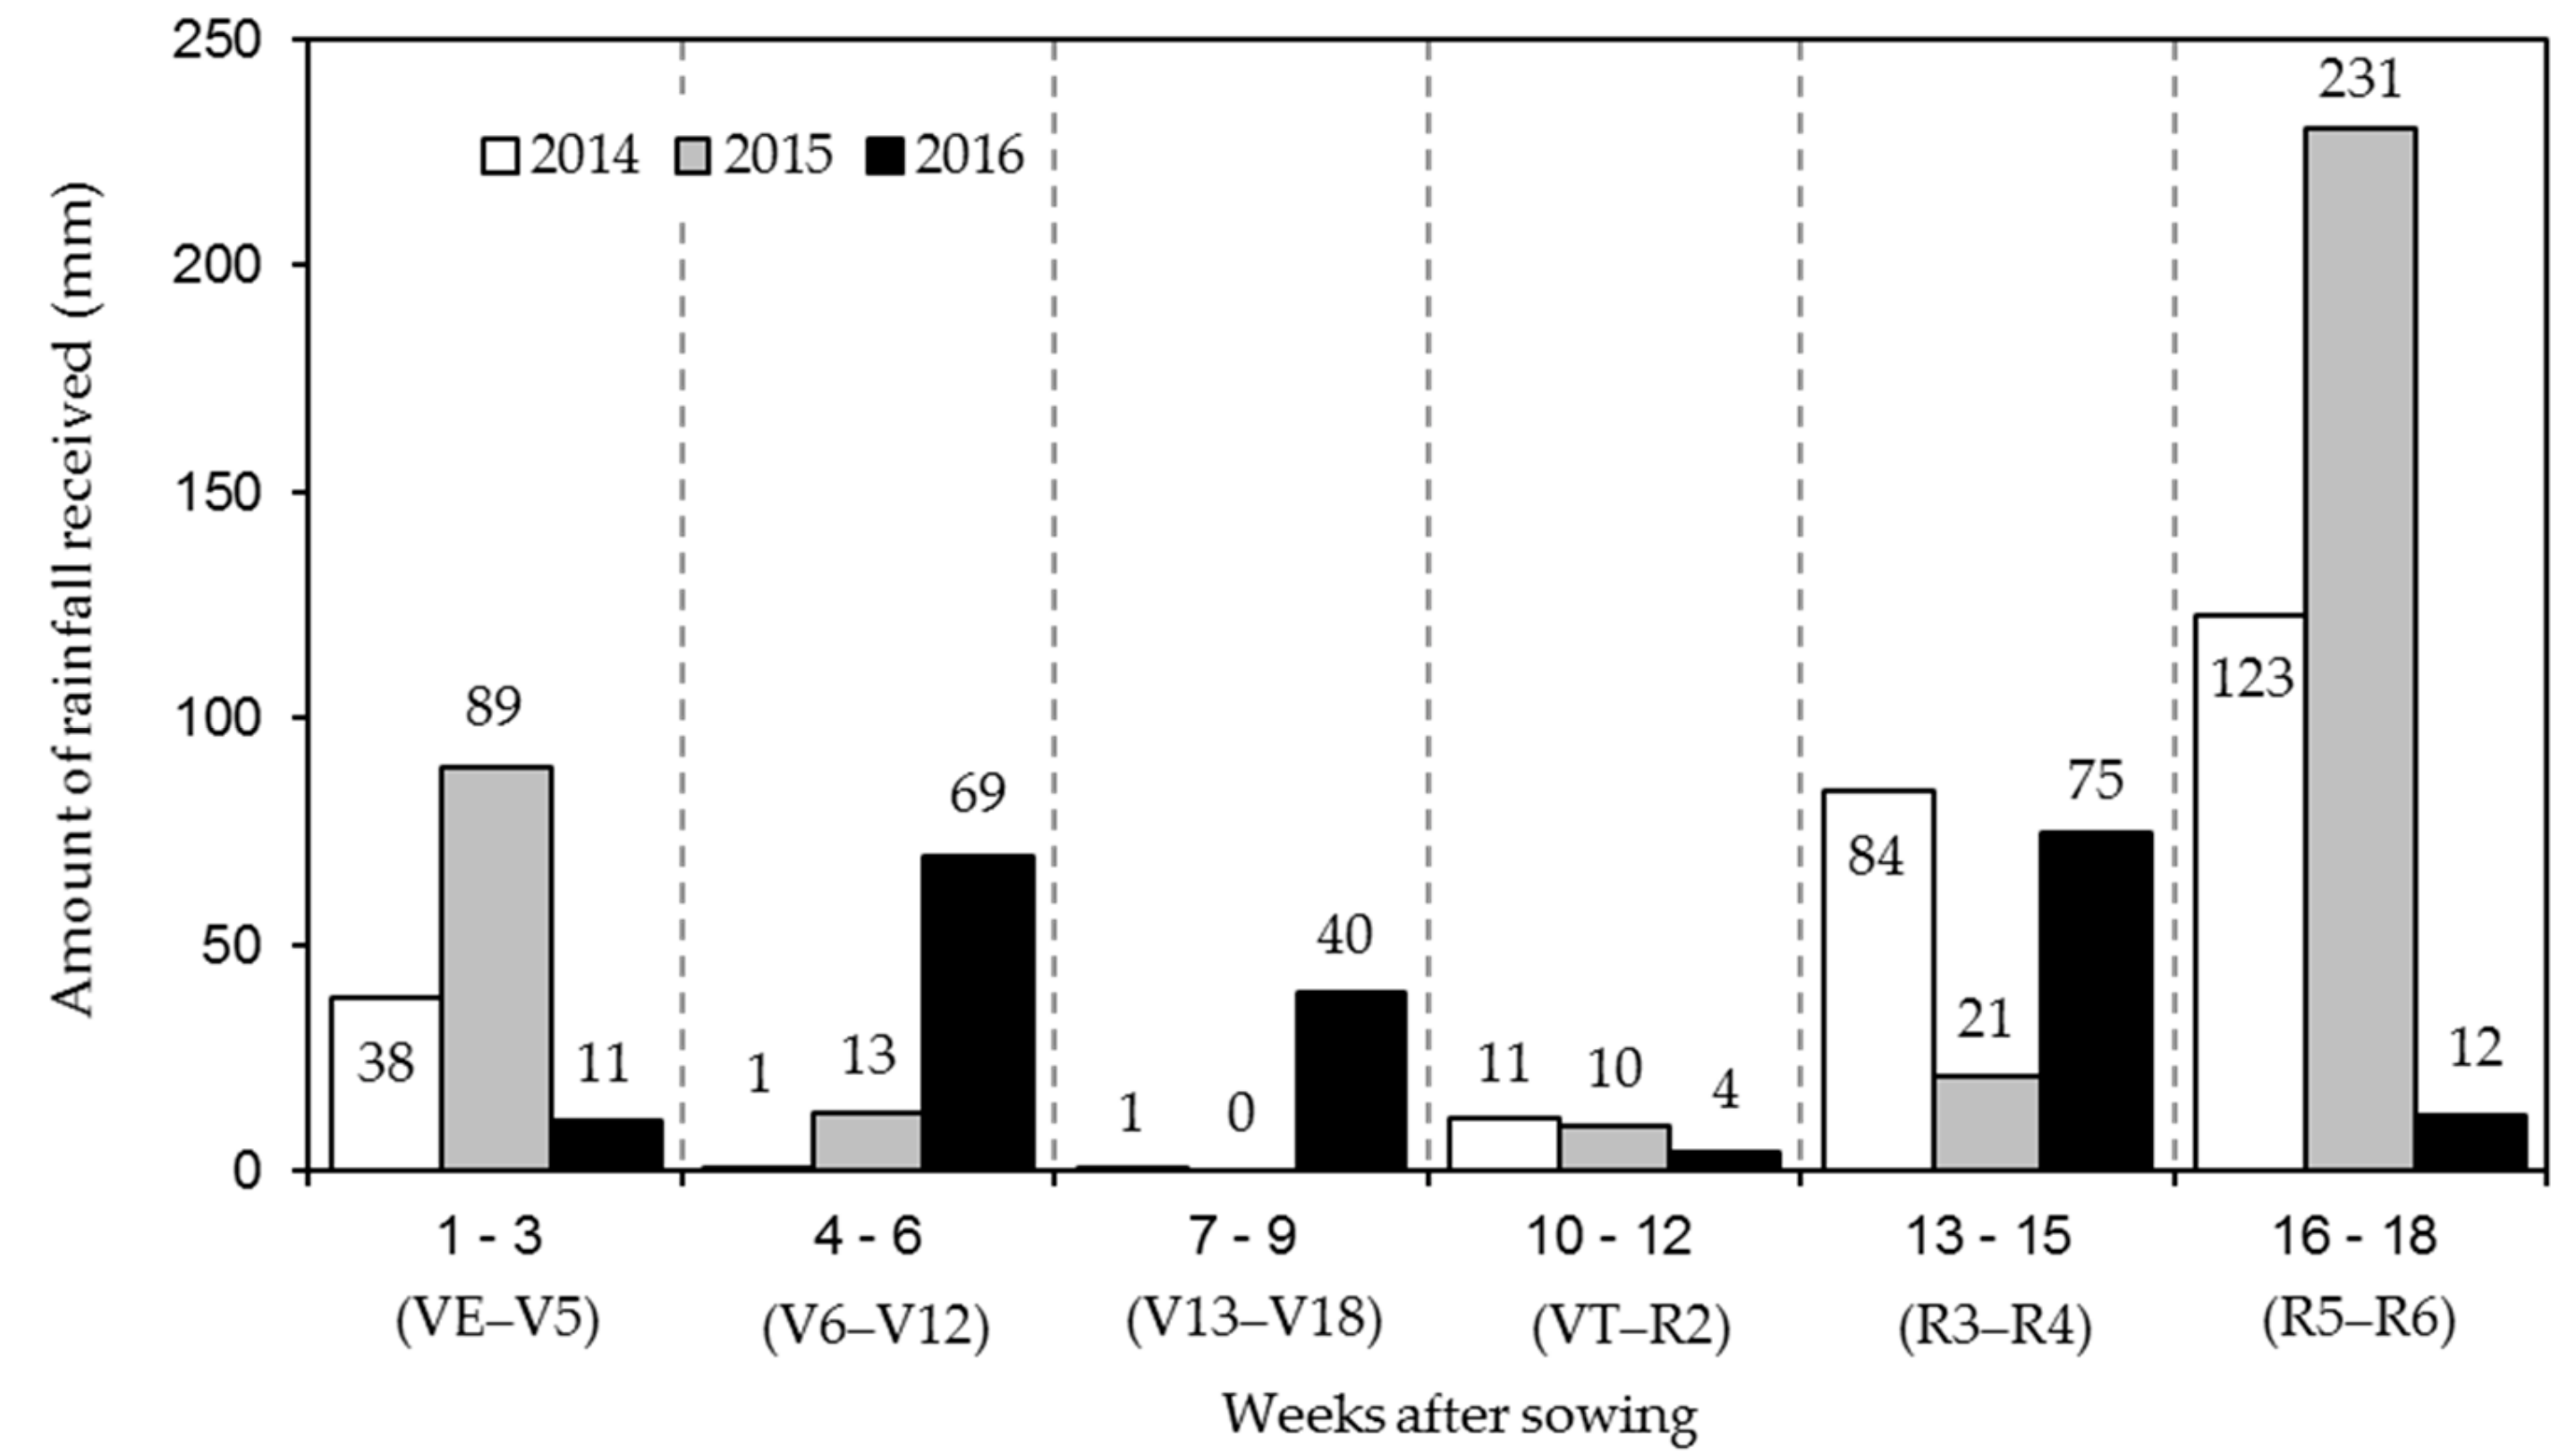
2.1. Description of the Experimental Site

The experiments were conducted for three seasons; December 2014 to April 2015, December 2015 to April 2016, and June to October 2016, in an inland valley at Nakyesasa village located within the National Crops Resources Research Institute (NaCRRI) campus in Namulonge, Uganda (00°31.12′ N, 32°38.34′ E, 1160 m above sea level). Mean annual precipitation at NaCRRI is 1275 mm, with two distinct rainy and dry seasons. December, January, and February are dry months (long dry season), followed by short rains in March, April, and May. June and July are also generally dry (short dry season), while August, September, October, and November are the wettest (long rains). Based on data from 2004 to 2012, the mean pentad minimum and maximum temperatures at NaCRRI is 16.4 and 29.0 °C, respectively, while the variation in daylight hours within a year is less than five minutes per day [18]. In the course of the experiment, rainfall and temperature data were collected and are presented in Figure 1. The data are presented to correspond with the different maize growth stages as described by [19]. The minimum temperature in all the years ranged from 14 to 20 °C, while the maximum temperature ranged from 27 to 34 °C. Average relative humidity in 2014, 2015, and 2016 ranged from 45%–82%, 62%–82%, and 65%–80%, respectively.
The experimental site was partitioned into three hydrological positions selected to correspond to three physical positions within the inland valley wetland (fringe, middle, and center), and the positions differed in soil attributes and water availability (Figure 2). The hydrological positions/sites were separated from each other by 20 m wide strips of natural (indigenous) vegetation, which remained undisturbed throughout the duration of the experiments.
In the Namulonge inland valley, loamy soils prevail, with a predominance of silty loam Gleysols [20]. Other physical soil properties varied across the hydrological positions. The soil organic carbon contents were 1.6%, 2.1%, and 2.5% in the fringe, middle, and center positions, respectively, while the soil bulk density was 1.3, 1.2, and 1.1 g cm−3, in that order. Figure 3 shows soil moisture at different hydrological positions of the inland valley.

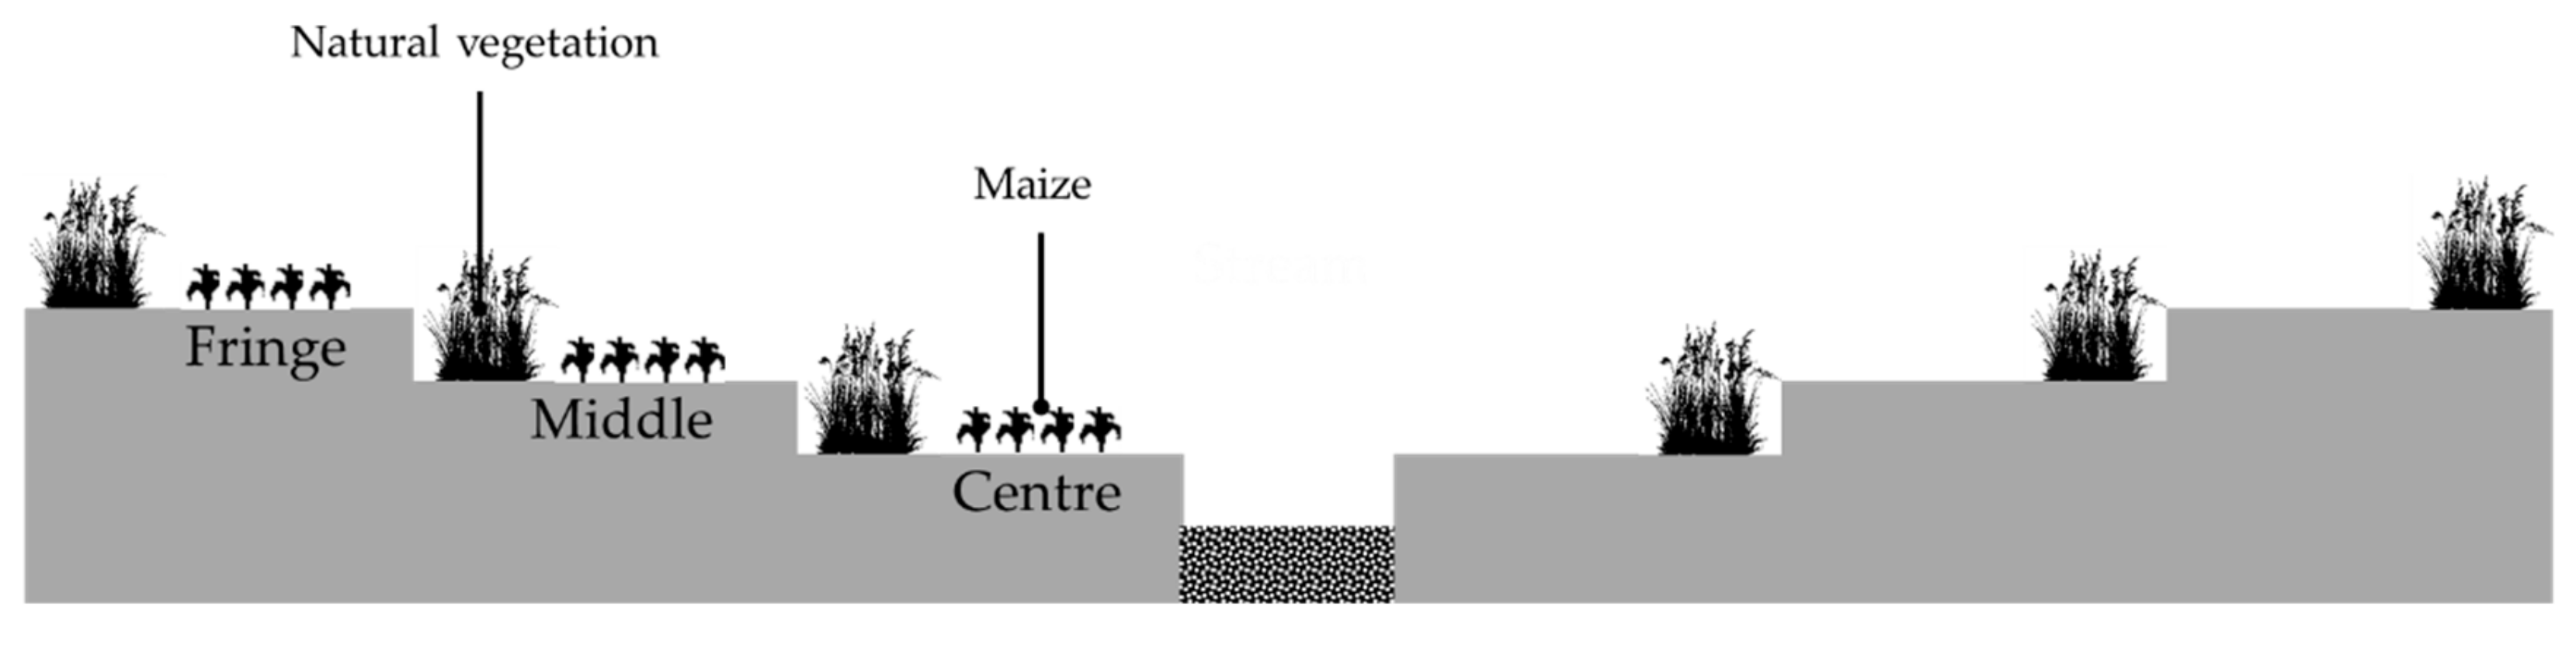
2.2. Experimental Design and Setup

The field trial was set up as a one-factorial randomized complete block design (RCBD) comprising six treatments of different crop management options (Table 1) replicated four times and repeated at each of the three hydrological positions/sites of the inland valley, with a common layout across positions/sites. The trials were repeated over three years on the same plots potentially resulting in cumulative treatment effects. The area of the individual experimental plots was 36 m² (6 m by 6 m) separated on all sides by a 1 m tilled and non-cropped border. All experimental plots were tilled twice by hand hoe. The first stage of tilling was done to a depth of about 20 cm to break the hard surface and remove deep rooted weeds. During the second stage of tilling, large clods of soil were broken down into finer particles and the field was levelled, ready for seeding.
Experimental plots to be treated with green manure were then sown with Lablab purpureus at a plant-to plant spacing of 50 cm × 50 cm corresponding to a plant population of 40,000 plants ha−1. Lablab was grown for two months and incorporated into the soil one week before seeding maize. Before soil incorporation, the above-ground Lablab biomass was harvested, dried, weighed, and analyzed for N, P, and K contents. The moisture content of the Lablab was determined gravimetrically later. The moisture and N contents were used to compute the amount of fresh green manure to apply per plot to achieve the target of 60 kg N ha−1. The NPK contents of lablab were 4.2:0.2:2.5 in 2014, 4.5:0.3:3.0 in 2015 and 4.6:0.2:2.2 in 2016. In a few plots, biomass accumulation by Lablab was insufficient to supply 60 kg N ha−1. In these cases, Lablab addition was complemented with fresh biomass of Lablab grown ex situ in an adjacent field plot during the same period.
Poultry manure was applied one week after maize seeding. It was made up of partially composted bedding material (coffee husks) and manure from birds used in a commercial poultry facility (UgaChick Poultry Breeders in Uganda). Before application, a composite sample of the manure was analyzed for its N, P, K, and moisture contents. The NPK contents of the poultry manure determined on a dry weight basis were 1.4:0.3:1.4 in 2014, 1.9:0.4:1.3 in 2015 and 2.3:0.5:1.5 in 2016. The N and moisture contents of the poultry manure were used to calculate the manure application rate to supply 60 kg N ha−1. The application rate varied between different batches of poultry manure because of differences in N and moisture contents. The poultry manure was uniformly spread and worked into the soil using hand hoes. The intensive organic fertilizer treatment (120 kg N ha−1) consisted of a combined application of Lablab and poultry manure, each providing 60 kg N ha−1, while the treatment with a low rate of manure was made up of only Lablab green manure at 60 kg N ha−1.
After the incorporation of organic amendments, all plots were finely tilled with hand hoes and seeded with the medium duration (120 days) hybrid maize variety “Longe-10H” at a 45 cm × 45 cm spacing at two kernels per hill. These were later thinned to a final plant density of five plants m−2. All treatments were weeded twice by hand hoe at the six- and 12-leaf stages, except for the control (farmer’s practice), which was weeded only once at the six-leaf stage. The treatment with low fertilizer application consisted of urea (60:0:0 kg NPK ha−1), while the high mineral fertilizer treatment consisted of a combination of urea, triple super phosphate (TSP), and Potassium chloride (KCl) providing 120, 60, and 60 kg of N, P, K ha−1, respectively. Urea was applied in two split applications with 60% N applied basally at seeding and 40% as top dressing at the six-leaf stage [19]. TSP and KCl were all basally applied [21]. No pesticides were used in the trials.

2.3. Measurements

Measurements of plant height and relative leaf chlorophyll content (chlorophyll-meter value) were taken at tasseling from 30 plants randomly selected from the six inner rows of each plot. A Minolta SPAD-502 chlorophyll meter (Konica-Minolta, Japan) was used to measure the relative leaf chlorophyll content. Measurements were taken on the first fully expanded leaf from the top, halfway between the leaf tip and collar, and midway between the leaf midrib and edge. At tasseling, ten plants were selected randomly from the third and fourth inner rows of each plot and harvested at ground level (stem base), chopped, and dried to a constant weight at 70 °C to determine dry matter content.
Ears were harvested from 40 maize plants (corresponding to 8 m2), taken from the eight inner rows of each plot, to assess grain yield. The grain yield of each plot was determined by shelling and taking the grain weight of all ears harvested. The grain yield was adjusted to 15.5% moisture content.
The grain yield gain of improved crop management was computed as the difference between yield achieved under the farmer’s practice and yield under the other crop management options. These were computed separately for each crop management option and hydrological position. Treatment means within positions were averaged for the years and used to compute zonal grain yield gains.
Agronomic N-use efficiency (aNUE) was calculated as
YN − YN0∕Nr
where YN was the grain yield obtained with an applied N rate of Nr, while N0 was grain yield without N fertilizer [22].

2.4. Statistical Analysis

Statistical analysis was done using the Statistical Tool for Agricultural Research (IRRI, Los Banos, Philippines) [23]. Data were subjected to a combined analysis of variance (ANOVA) in a randomized complete block design (RCBD), where years (seasons) were considered random effects while treatments and hydrological positions were taken as fixed effects. The three hydrological positions were taken as independent experimental locations because of differences in soil attributes and prevailing hydrological conditions. Means were separated by Fisher’s protected least significant difference (LSD).

3. Results

3.1. Leaf Relative Chlorophyll Content

There were generally no significant differences in the leaf relative chlorophyll content of maize across hydrological positions. Mean leaf relative chlorophyll content values at the center, middle, and fringe were 43.3, 41.6, and 41.8 respectively. However, the values varied significantly with crop management (Figure 4). The mineral fertilizer treatments tended to stick out with higher leaf relative chlorophyll content values.

3.2. Maize Growth and Biomass Productivity

There was a significant zonal effect on the growth of maize. The maize at the center was significantly taller and produced considerably higher biomass compared with the fringe and middle hydrological positions. The mean height of the maize at the center, middle, and fringe was 1.7, 1.4, and 1.3 m, respectively. Similarly, the mean biomass productivity at the center, middle, and fringe was 3.6, 2.4, and 2.1 ha−1, respectively.
Likewise, significant differences in the response of maize to crop management were noted (Table 2). The lowest values for plant height and above-ground biomass were generally observed under the farmer’s practice, while the highest biomass was recorded with application of high rates of both mineral and organic fertilizer. No significant differences in height and above-ground biomass were noted between the non-amended control and low rates of organic and mineral fertilizers. The general response patterns to crop management were similar across hydrological positions.

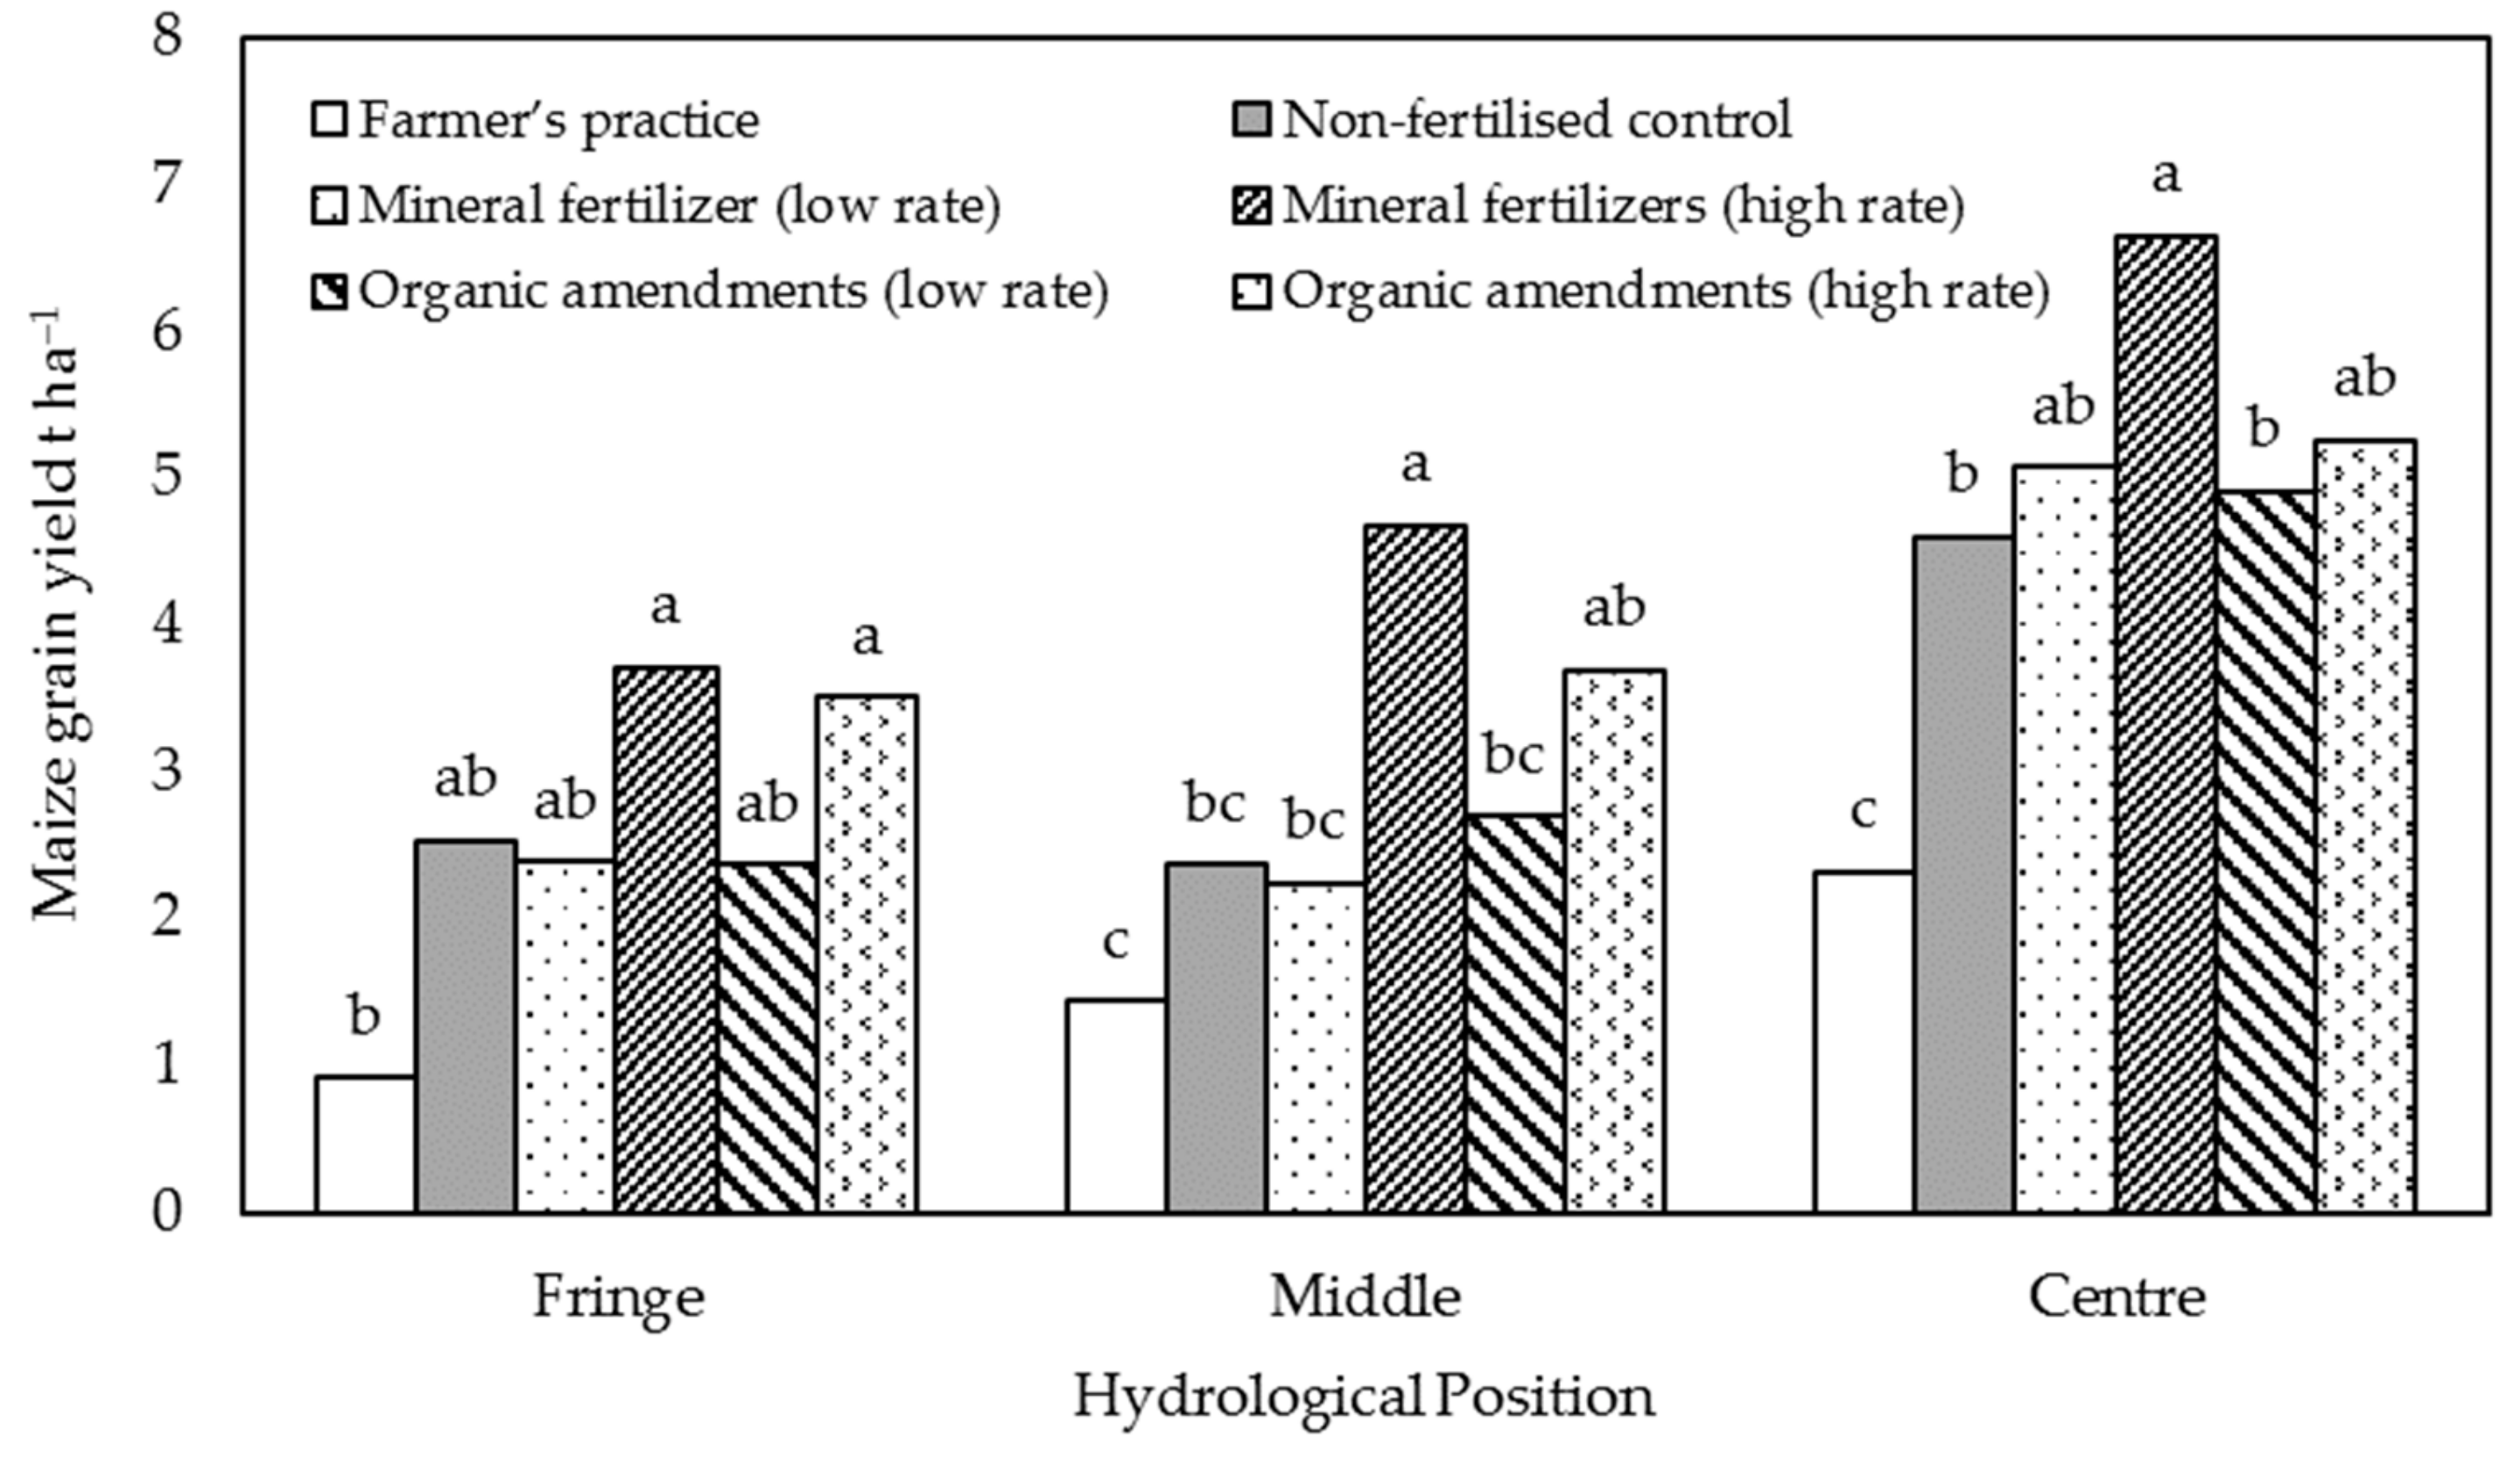
3.3. Maize Grain Productivity

The overall grain yield mean across treatments and seasons was 3.4 t ha−1. A general outlook of grain yield performance of maize at different hydrological positions is presented in Figure 5. Grain yield increased significantly toward the center of the inland valley that is 2.6, 2.9, and 4.8 t ha−1 at the fringe, middle, and center, respectively (Figure 5). Grain yield under different crop management options ranked as follows from the highest to the lowest; mineral fertilizers—high rate (5 t ha−1), organic amendments—high rate (4.2 t ha−1), organic amendments—low rate (3.3 t ha−1), mineral fertilizer—low rate (3.2 t ha−1), non-fertilized control (3.2 t ha−1), and the farmer’s practice (1.6 t ha−1). Consistently, grain yields under the farmer’s practice were significantly lower than under other crop management options.

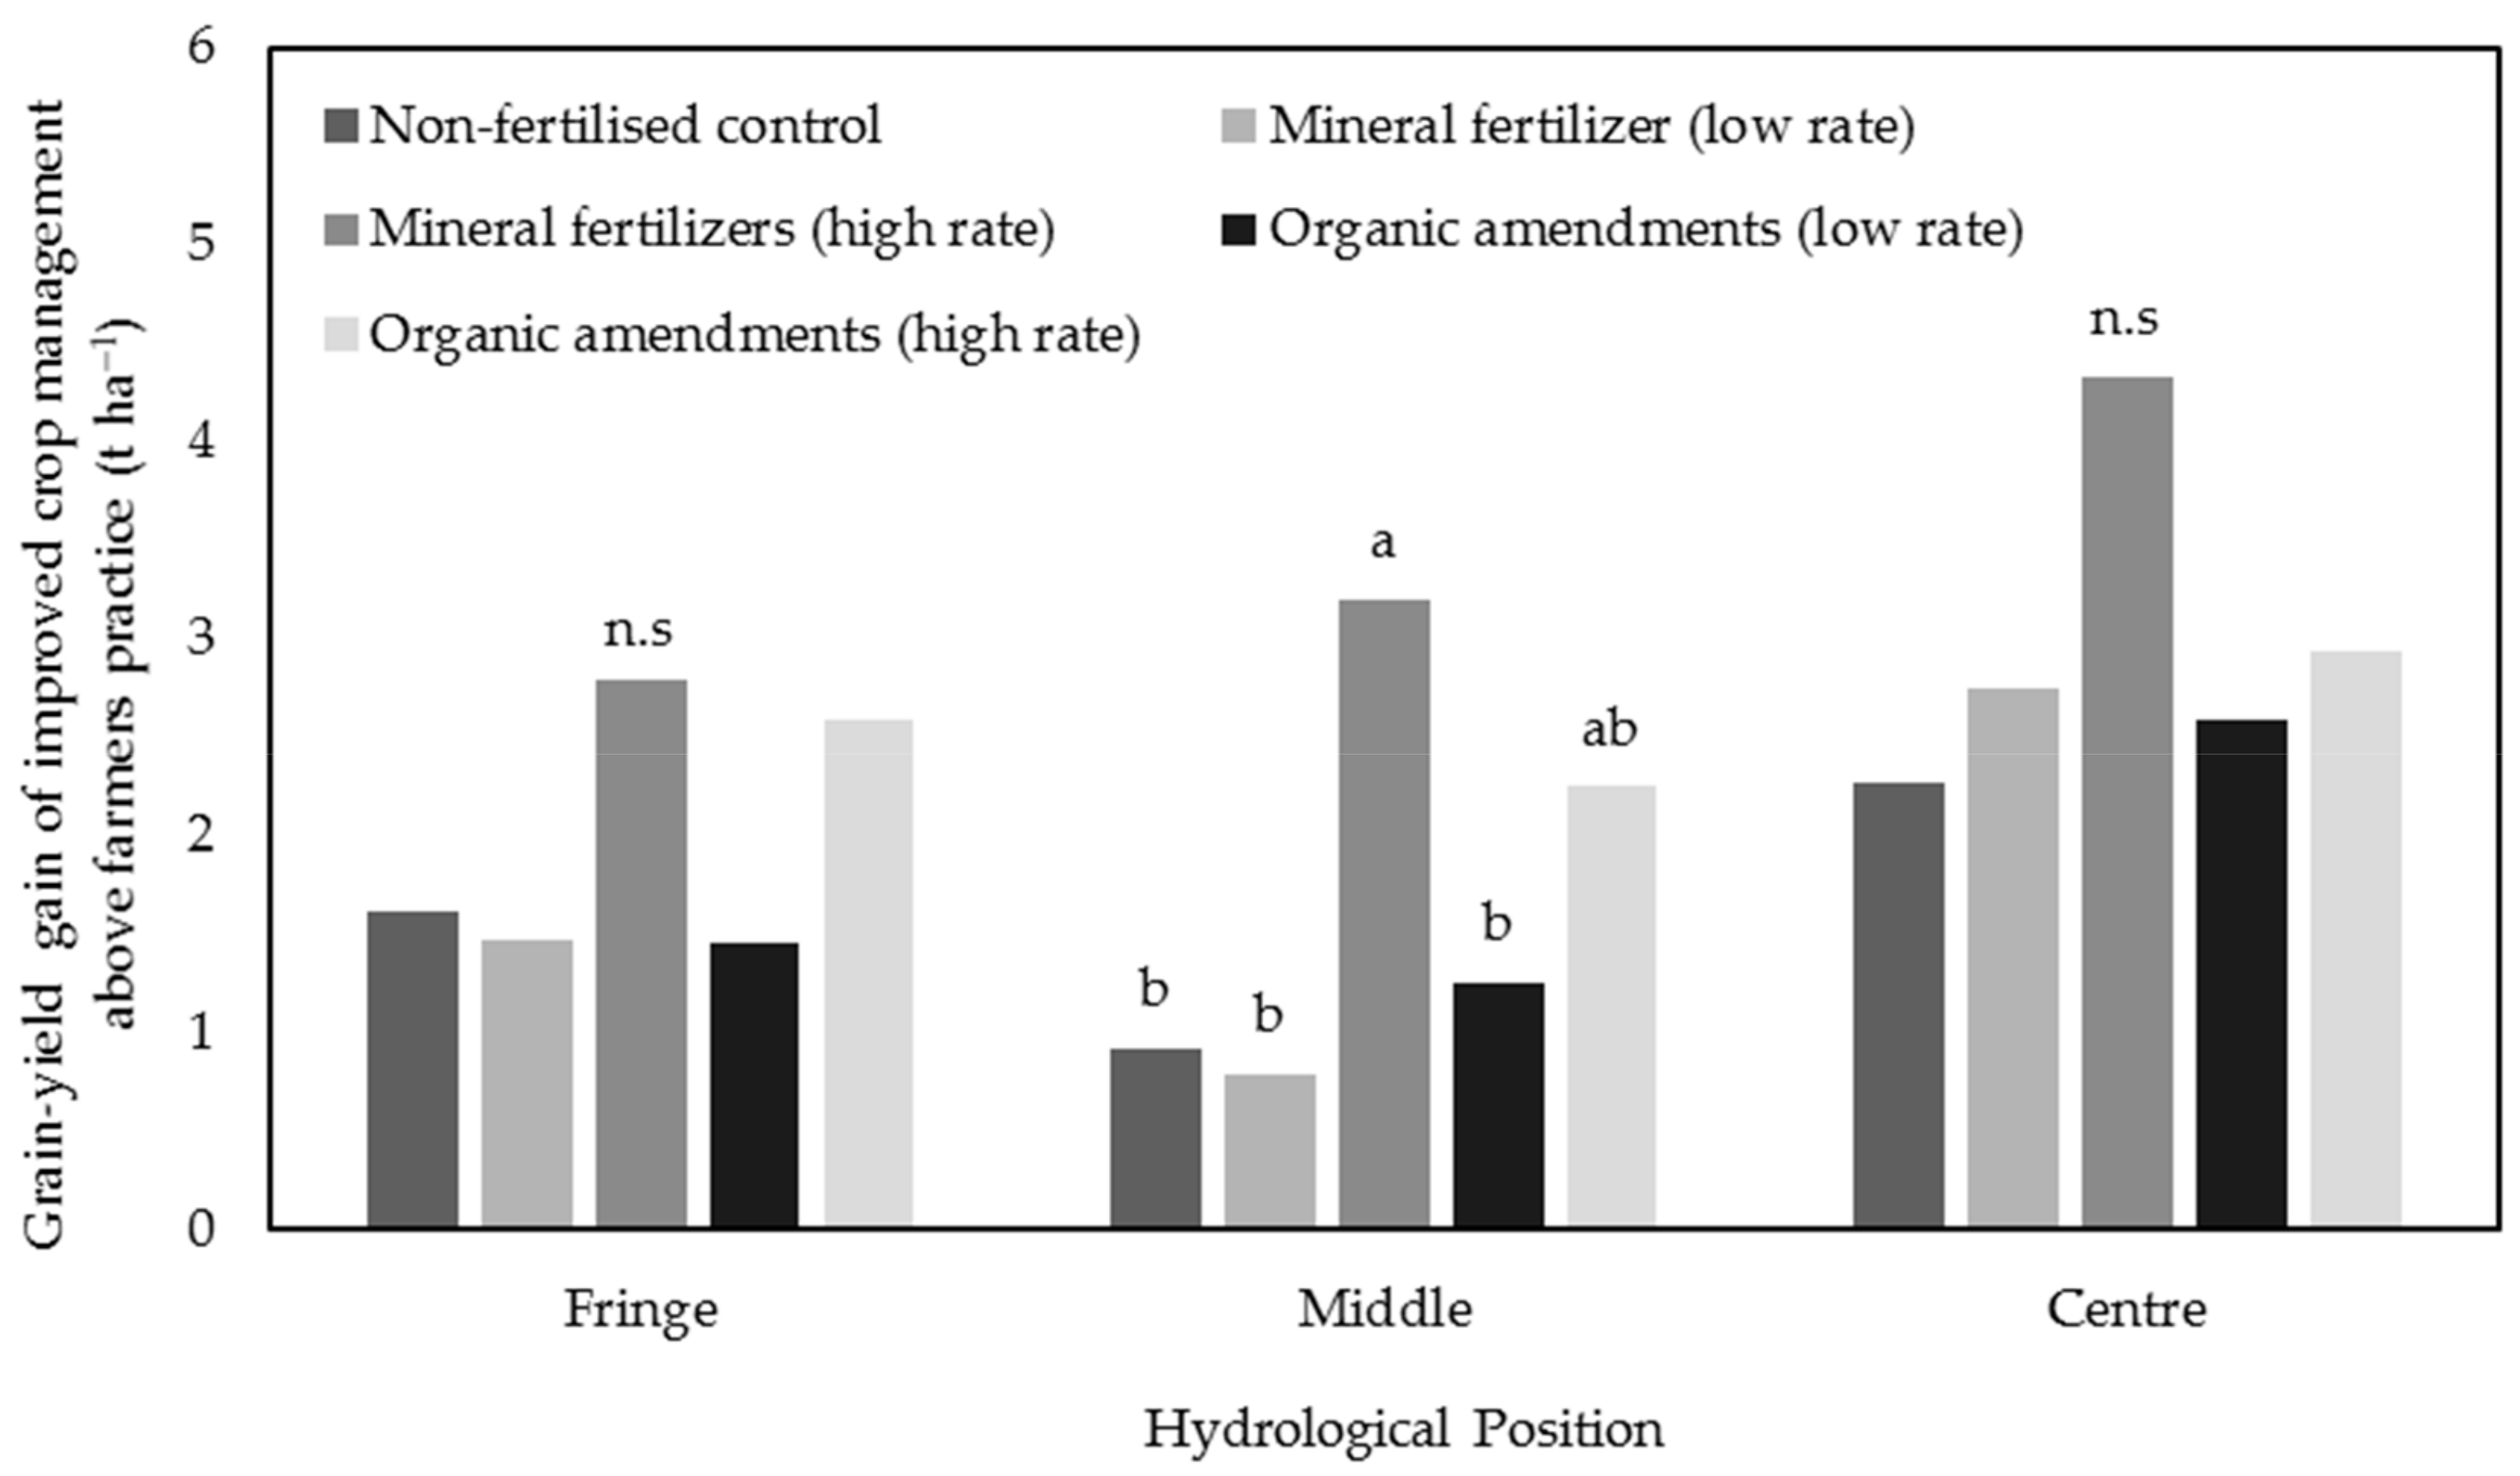
3.4. Grain Yield Gain of Improved Crop Management

Maize grain yield gain computed as the difference between yield achieved under the farmers practice and yield under other crop management options increased significantly toward the center of the inland valley that is 2.0, 1.7, and 3.0 t ha−1 at the fringe, middle, and center, respectively. We also found significant differences in the grain yield gain related to different crop management options (Figure 6).

3.5. Agronomic N-Use Efficiency (aNUE)

There was a significant increase in the agronomic use efficiency of applied mineral or organic nitrogen (aNUE) from 3.2 in the fringe to 9.0 kg of grain per kg N in the center position. On the other hand, we noted significant differences in aNUE between treatments, being generally low at lower rates of applied N and vice versa, irrespective of the N source (Table 3). The variation in aNUE between treatments was more pronounced in the fringe and middle hydrological positions than in the central hydrological positions (Table 3).

4. Discussion

The aim of this research was to assess the suitability and potential of an inland valley wetland in Namulonge for the production of maize in the dry season. During the dry season, smallholder farmer food stocks normally diminish constantly from the time of harvest onward leaving them without food just two months after harvest. We hypothesized that inland valley wetlands could potentially be used to produce dry season maize as a way of supplementing the main rainy season’s harvest, which may fail sometimes due to rainfall anomalies. Our results showed that inland valley wetlands can indeed be utilized for maize production in the dry season. The average grain yield of maize in the Namulonge inland valley during the dry season over the study period was 3.4 t ha−1. This was 42% above the estimated national production average of largely upland maize [3]. A similar study in Zimbabwe showed that smallholder farmers could realize 2–3 t ha−1 of maize grain in seasonal wetlands as compared to just 1.0 t ha−1 in the uplands [24], representing additional yield of more than 100%–200%. However, we also found that the productivity of dry season maize in the inland valley varies with: (1) hydrological position and (2) crop management as discussed in the following sections.

4.1. Effect of Hydrological Position

Maize growth, biomass, and grain productivity were significantly higher at the center of the inland valley, and lower, yet similar at the fringe and middle positions. These high inter-zonal differences in maize growth, biomass, and grain productivity were probably related to the variability in soil moisture and fertilizer-use efficiency along the slope of the inland valley. A related study [20] at the same experimental site showed that soil moisture was generally higher at the center of the inland valley and decreased up-slope toward the fringe position (Figure 2). They also found that soils at the center remained saturated for a longer time following precipitation when compared to the fringe and middle positions probably due to the higher levels of silt and soil organic carbon. Bulk density and clay content increased significantly toward the fringe by 25% and 13%, respectively, while silt and soil organic carbon decreased by 47% and 15% toward the fringe. A high soil organic carbon content and low soil bulk density indicate the potential for a high water-holding capacity of soil [11,25,26], which is an important factor for dry season maize production. Hence residual soil moisture alone may be insufficient to optimize grain productivity at the elevated inland valley positions (fringe) with larger depth to groundwater and higher soil moisture deficit [19]. A similar result was reported by Maddonni and Martínez-Bercovich [27]. We also found in this study that the agronomic N-use efficiency of applied fertilizer increased toward the center of the inland valley (Table 3), which might explain in-part the higher yields at the center as compared to the other hydrological positions. Hence grain yields at the center of the inland valley remained high and relatively stable owing to prolonged soil moisture availability (buffering drought) and therefore better utilization of applied nutrients. It is therefore less risky to produce dry season maize at the center of the inland valley, as compared to the fringe and middle hydrological positions. However, with supplementary irrigation, production risks at the fringe and middle may be reduced to a great extent.

4.2. Effect of Crop Management

Overall, the highest grain yields were recorded with mineral fertilizers (high rate), followed by organic amendments (high rate), organic amendments (low rate), mineral fertilizer (low rate), non-fertilized control, and then the farmer’s practice, in that order. This result indicates that a high rate of organic amendments can produce comparable maize growth and grain yields as the high rate of mineral N fertilizers when soil moisture is not limiting [28]. While maize under the farmer’s practice was only weeded once, other treatments were weeded twice, resulting in significant yield increases (Figure 5).
On the other hand, grain yield response of maize to fertilizers varied along the hydrological gradient, being higher toward the center as indicated by the higher N fertilizer-use efficiency in this position. This was probably associated with the variation in soil moisture along the slope of the inland valley, being higher toward the center, which enhanced fertilizer-use efficiency. Soil moisture is known to strongly affect nutrient release and utilization [29].
Applying green manure and chicken manure all at once before seeding presented similarly high leaf relative chlorophyll content values (above 45.5) at tasseling as the high rate of mineral N fertilizer applied in two split applications. This indicates that green manure and chicken manure when applied simultaneously before seeding maize can provide adequate all-season supply of N comparable to a two-split application of mineral N. Leaf relative chlorophyll content values below 43.4 in maize taken on leaf five at the six-leaf stage generally indicate a need for supplemental N [28]. Our results suggest that a one-time application of green manure plus chicken manure as in the high rate of organic amendments is potentially able to maintain adequate supply of N to maize similar to a split application of mineral nitrogen. According to [29], there is often a relatively slow buildup (or release) of soil nitrate following incorporation of green manure, and appropriately timed application of quick-release forms of N fertilizer can supplement green manuring in a maize-based cropping system. Poultry manure tends to be richer in N [30] with nitrate levels nearly 10 times greater than in green manure [31]. Similarly, ammonium in the poultry manure is higher than in green manure [31]. Hence, it can be assumed that for the high rate of organic amendments in our experiment, N from poultry manure was sufficiently available early in the season, while N from green manure only became available at later maize growth stages.
One peculiar observation that emerged from this study is that the low rates of mineral and organic fertilizers did not produce a noticeable grain yield gain over the unfertilized control (Figure 5). One possible explanation for this could be the generally high inherent soil N fertility status in the inland valley, whereby small incremental amounts of applied N fertilizers (interacting with available soil moisture) do not produce a substantial yield increase. Crop yield response to applied fertilizers depends on the soil nutrient-supplying capacity. There is often a low yield response from applied fertilizers when nutrient release from the soil is high [32]. Total N (measured by dry combustion at 950 °C) in the surface soil (0–25 cm) of the experimental site was 0.35%, 0.23%, and 0.53% at the fringe, middle, and center. The total N of most cultivated soils ranges between 0.06% and 0.5% [33].
In the same way, nutrient-use efficiency is often low at high levels of available soil nutrients, and small amounts of externally applied nutrients do not produce large yield responses [34]. However, low responses may also indicate undiagnosed micronutrient deficiencies, which were not investigated in this study. Another possible reason why the low rates of mineral and organic fertilizers did not produce a clear grain yield gain over the unfertilized control could be that the response of maize to applied N depends on P and K levels, which were rather low in these two treatments (Table 2). In a similar study, application of P and K fertilizers in combination with N was critical for securing high yields in maize [35]. In another study, grain yield of maize increased by up to 36% when N fertilizer was applied to maize together with P and K compared with no P and K fertilizer [36]. Hence application of 60 kg N kg ha−1 through mineral and organic fertilizers with low levels of P and K (Table 2) might have induced P or K nutrient deficiency stress, retarding the overall growth of maize with a concomitant reduction in yield.

5. Conclusions

Inland valley wetlands can potentially be used to produce maize outside of the main rainy cropping season. At 3.4 t ha−1, average productivity of maize in the inland valley exceeded the national average of largely upland maize by 42%. The center of the inland valley with a higher soil moisture content than the other positions showed the greatest potential for producing dry season maize, especially when rainfall was deficient. The grain yield at risk due to rainfall deficiency was high at the fringe and middle hydrological positions—hence the need for occasional supplementary irrigation. Repeated application of organic fertilizers at high rates by combining green manure (L. purpureus) and poultry manure can produce comparable maize grain and stover yields as high mineral N fertilizer rates. Taken together, therefore, these results suggest that inland valley wetlands can be utilized to grow maize during the dry season, thereby, allowing farmers to squeeze in more harvests and contribute to farm income generation and regional food security. However, for sustainability, the cultivation of inland wetlands must be guided by sound policies and technical guidelines.

Author Contributions

Conceptualization, D.N., M.B., and U.K.; data curation, S.A.; formal analysis, S.A.; Funding acquisition, D.N., M.B., and U.K.; Investigation, S.A. and U.K.; Methodology, D.N., M.B., and U.K.; Project administration, D.N., K.S., M.B., and U.K.; Resources, D.N., K.S., M.B., and U.K.; Supervision, D.N., K.S., M.B., and U.K.; validation, M.B. and U.K.; Visualization, D.N., M.B., and U.K.; Writing—original draft, S.A.; Writing—review and editing, S.A., D.N., K.S., M.B., and U.K.

Funding

This research was conducted under the GlobE: Wetlands in East Africa project, which was funded by the German Federal Ministry of Education and Research (FKZ: 031A250 A-H), with additional funding provided by the German Federal Ministry of Economic Cooperation and Development.

Acknowledgments

Many thanks to all colleagues of the GlobE: Wetlands in East Africa project, who provided data and assistance. The authors thank Isaac Ndawula, Sam Okirya, Lozio Makesa, Jesca Nassolo, Nagirinya Justine, and Kayongo Augustine for assistance with field work and data collection.

Conflicts of Interest

The authors declare no conflict of interest. The funders had no role in the design of the study; in the collection, analyses, or interpretation of data; in the writing of the manuscript; or in the decision to publish the results.

References

  1. Daly, J.; Hamrick, D.; Guinn, A. Maize Value Chains in East Africa F-38202-RWA-1; International Growth Centre: London, UK, 2016. [Google Scholar]
  2. Smale, M.; Byerlee, D.; Jayne, T. Maize Revolutions in Sub-Saharan Africa; Michigan State University: East Lansing, MI, USA, 2011. [Google Scholar]
  3. Drought Tolerant Maize for Africa DT Maize: A quarterly bulletin of the drought tolerant maize for Africa Project. DT Maize 2015, 4, 1–4.
  4. Lukuyu, B.A.; Baker, D.; Baltenweck, I.; Poole, E.J.; Kabi, F.; Katongole, C.; Nadiope, G.; Byarugaba, A.A.; Kugonza, J.; Wabwire, R. The Concentrate Feeds Supply Chain in Uganda: Emerging Trends and Implications on Quality and Access to Smallholder Farmers and Chain Efficiency; East Africa Dairy Development Project: Nairobi, Kenya, 2013. [Google Scholar]
  5. United States Department of Agriculture. Kenya Corn, Rice and Wheat Grain and Feed Annual Report 2016; United States Department of Agriculture: Washington, DC, USA, 2016.
  6. Ahmed, M.; Ojangole, S. Analysis of Price Incentives for Maize in Uganda for the Time Period 2005–2013; FAO: Rome, Italy, 2014. [Google Scholar]
  7. Cairns, J.E.; Hellin, J.; Sonder, K.; Araus, J.L.; MacRobert, J.F.; Thierfelder, C.; Prasanna, B.M. Adapting maize production to climate change in sub-Saharan Africa. Food Secur. 2013, 5, 345–360. [Google Scholar] [CrossRef] [Green Version]
  8. NEPAD. African Agriculture: Transformation and Outlook; NEPAD: Midrand, South Africa, 2013. [Google Scholar]
  9. Sakané, N.; Alvarez, M.; Becker, M.; Böhme, B.; Handa, C.; Kamiri, H.W.; Langensiepen, M.; Menz, G.; Misana, S.; Mogha, N.G.; et al. Classification, characterisation, and use of small wetlands in East Africa. Wetlands 2011, 31, 1103–1116. [Google Scholar] [CrossRef]
  10. Jogo, W.; Hassan, R. Balancing the use of wetlands for economic well-being and ecological security: The case of the Limpopo wetland in southern Africa. Ecol. Econ. 2010, 69, 1569–1579. [Google Scholar] [CrossRef] [Green Version]
  11. Scoones, I. Wetlands in drylands: Key resources for agricultural and pastoral production in Africa. AMBIO A J. Hum. Environ. 1991, 20, 366–371. [Google Scholar]
  12. McCartney, M.; Rebelo, L.M.; Senaratna Sellamuttu, S.; de Silva, S. Wetlands, Agriculture and Poverty Reduction; International Water Management Institute: Colombo, Sri Lanka, 2010. [Google Scholar]
  13. Nabahungu, N.L.; Visser, S.M. Contribution of wetland agriculture to farmers’ livelihood in Rwanda. Ecol. Econ. 2011, 71, 4–12. [Google Scholar] [CrossRef]
  14. Wetlands Management Department, Ministry of Water and Environment of Uganda; UBOS; ILRI; WRI. Mapping a Better Future: How Spatial Analysis can Benefit Wetlands and Reduce Poverty in Uganda; WRI: Washington, DC, USA, 2009.
  15. Uganda Bureau of Stastistics. Summary Report on Uganda Census of Agriculture; Uganda Bureau of Stastistics: Kampala, Uganda, 2010.
  16. Rebelo, L.M.; McCartney, M.P.; Finlayson, C.M. Wetlands of Sub-Saharan Africa: Distribution and contribution of agriculture to livelihoods. Wetl. Ecol. Manag. 2010, 18, 557–572. [Google Scholar] [CrossRef]
  17. Matsumoto, T.; Yamano, T. Optimal Fertilizer Use on Maize Production in East Africa. Emerg. Dev. Agric. East. Africa 2011, 117–132. [Google Scholar] [CrossRef]
  18. Tsuboi, T.; Asea, G.; Maruyama, A.; Matsumoto, S.; Miyamoto, K.; Goto, A.; Justin, E.S.; Inubushi, K.; Ikeda, R.; Takagaki, M.; et al. Effects of rainfall, continuous cropping, and fertilizer on yield and yield components of an upland NERICA variety: A statistical analysis of a long- term field experiment in Uganda. Trop. Agric. Dev. 2018, 62, 78–93. [Google Scholar]
  19. Ritchie, S.W.; Hanway, J.J.; Benson, G. How a Corn Plant Develops; Iowa State University: Ames, IA, USA, 1986. [Google Scholar]
  20. Gabiri, G.; Diekkrüger, B.; Leemhuis, C.; Burghof, S.; Näschen, K.; Asiimwe, I.; Bamutaze, Y. Determining hydrological regimes in an agriculturally used tropical inland valley wetland in Central Uganda using soil moisture, groundwater, and digital elevation data. Hydrol. Process. 2018, 32, 349–362. [Google Scholar] [CrossRef]
  21. Badu-Apraku, B.; Fakorede, M.A.B.; Menkir, A.; Sanogo, D. Conduct and Management of Maize Field Trials Conduct and Management; IITA: Ibadan, Nigeria, 2012. [Google Scholar]
  22. Cassman, K.G.; Peng, S.; Olk, D.C.; Ladha, J.K.; Reichardt, W.; Dobermann, A.; Singh, U. Opportunities for increased nitrogen-use efficiency from improved resource management in irrigated rice systems. F. Crop. Res. 1998, 56, 7–39. [Google Scholar] [CrossRef]
  23. IRRI. Statistical Tool for Agricultural Research (STAR) 2014; IRRI: Los Banos, Philipines, 2014. [Google Scholar]
  24. Nyamadzawo, G.; Wuta, M.; Nyamangara, J.; Nyamugafata, P.; Chirinda, N. Optimizing dambo (seasonal wetland) cultivation for climate change adaptation and sustainable crop production in the smallholder farming areas of Zimbabwe. Int. J. Agric. Sustain. 2015, 13, 23–39. [Google Scholar] [CrossRef]
  25. Carter, M.R. Soil Quality for Sustainable Land Management. Agron. J. 2010, 94, 38. [Google Scholar] [CrossRef]
  26. Mzuku, M.; Khosla, R.; Reich, R.; Inman, D.; Smith, F.; MacDonald, L. Spatial Variability of Measured Soil Properties across Site-Specific Management Zones. Soil Sci. Soc. Am. J. 2005, 69, 1572. [Google Scholar] [CrossRef]
  27. Maddonni, G.Á.; Martínez-Bercovich, J. Row Spacing, Landscape Position, and Maize Grain Yield. Int. J. Agron. 2014, 2014, 1–12. [Google Scholar] [CrossRef] [Green Version]
  28. Piekkielek, W.P.; Fox, R.H. Use of a Chlorophyll Meter to Predict Sidedress Nitrogen. Agron. J. 2010, 84, 59. [Google Scholar] [CrossRef]
  29. Phiri, R.H.; Kanyama-Phiri, G.Y.; Snapp, S. Soil nitrate dynamics in relation to nitrogen source and landscape position in Malawi. Agrofor. Syst. 1999, 47, 253–262. [Google Scholar] [CrossRef]
  30. Bernal, M.P.; Alburquerque, J.A.; Moral, R. Composting of animal manures and chemical criteria for compost maturity assessment. A review. Bioresour. Technol. 2009, 100, 5444–5453. [Google Scholar] [CrossRef]
  31. Chae, Y.M.; Tabatabai, M.A. Mineralization of Nitrogen in Soils Amended with Organic Wastes1. J. Environ. Qual. 2010, 15, 193. [Google Scholar] [CrossRef]
  32. Chuan, L.; He, P.; Pampolino, M.F.; Johnston, A.M.; Jin, J.; Xu, X.; Zhao, S.; Qiu, S.; Zhou, W. Establishing a scientific basis for fertilizer recommendations for wheat in China: Yield response and agronomic efficiency. F. Crop. Res. 2013, 140, 1–8. [Google Scholar] [CrossRef]
  33. Bremner, J.M. Nitrogen-total. In Methods of Soil Analysis; Sparks, D., Ed.; Soil Science Society of America: Madison, WI, USA, 1996; pp. 1085–1121. [Google Scholar]
  34. Dibb, D.W. The Mysteries (Myths) of Nutrient Use Efficiency. Better Crop. 2000, 84, 3–5. [Google Scholar]
  35. Liu, K.; Ma, B.L.; Luan, L.; Li, C. Nitrogen, phosphorus, and potassium nutrient effects on grain filling and yield of high-yielding summer corn. J. Plant. Nutr. 2011, 34, 1516–1531. [Google Scholar] [CrossRef]
  36. Osborne, S.L. Enhancing corn production through the use of starter fertilizer in the northern Great Plains. Commun. Soil Sci. Plant. Anal. 2005, 36, 2421–2429. [Google Scholar] [CrossRef]
Figure 1. Amount of rainfall received (three-week intervals) in the years 2014, 2015, and 2016 during the trials. Insets are the corresponding growth stages of maize as described by [19]. Correspondingly, maize-plant development is divided into vegetative (V) and reproductive (R) stages. Subdivisions of the V stages are designated numerically as V1, V2, V3, etc. through V(n), where (n) represents the last leaf stage before VT for the variety under consideration. The first and last V stages are designated as VE (emergence) and VT (tasseling).
Agronomy 09 00606 g001
Figure 2. Cross-section of the inland valley showing the different hydrological positions and overview of experiment setup.
Agronomy 09 00606 g002
Figure 3. Mean soil moisture content along the soil profile at different hydrological positions of the inland valley. Data adopted from Gabiri et al. 2018 [20].
Agronomy 09 00606 g003
Figure 4. Leaf relative chlorophyll content values of maize at tasseling from three hydrological positions and under different crop management options.
Agronomy 09 00606 g004
Figure 5. Grain yield of maize (t ha−1) at three hydrological positions and under different crop management options at an inland valley in Namulonge.
Agronomy 09 00606 g005
Figure 6. Grain yield gain of improved crop management above the farmer’s practice at different hydrological positions.
Agronomy 09 00606 g006
Table 1. Crop management options tested at three hydrological positions within an inland valley wetland in Uganda during three dry cropping seasons (2014–2016).
TreatmentsNPKFertilizer Application Rate
kg ha−1kg ha−1 Season−1
Farmer’s practice (weeded once)000
Non-fertilized control (weed free)000
Mineral fertilizer—low rate (weed free)6000130 urea
Mineral fertilizers—high rate (weed free)1206060261 urea + 130 TSP + 100 Potassium chloride (KCl)
Organic amendments—low rate (weed free)603355929 Lablab purpureus (Linnaeus) Sweet (fresh weight basis)
Organic amendments—high rate (weed free)12018795929 L. purpureus + 6758 poultry manure (fresh weight basis)
TSP: Triple super phosphate; lablab: green manure of in situ grown Lablab purpureus.
Table 2. Comparison of maize growth and biomass productivity under different crop management options at three hydrological positions (fringe, middle, and center) of an inland valley in Namulonge averaged over three seasons.
Crop Management Plant Height (m)Above-Ground Biomass at Tasseling (t dm ha−1)
FringeMiddleCenterFringeMiddleCenter
Farmer’s practice (weeded once)1.08 d1.23 c1.58 c1.32 c1.68 c2.69 c
Non-fertilized control1.27 c1.23 c1.86 b1.97 bc1.76 c3.45 bc
Mineral fertilizer (low rate)1.34 bc1.20 c1.86 b1.85 bc1.66 c3.0 bc
Mineral fertilizers (high rate)1.61 a1.77 a2.12 a3.35 a3.90 a4.54 a
Organic amendments (low rate)1.28 c1.36 bc1.85 b1.72 bc2.13 c3.88 ab
Organic amendments (high rate)1.49 ab1.52 b1.91 b2.52 ab2.98 b3.63 b
LSD (5%)0.170.20.160.930.770.81
Along columns, means with the same letter are not significantly different.
Table 3. Agronomic N-use efficiency (aNUE) in kg grain per kg N for different N-management options in maize grown in Namulonge inland valley wetland.
Crop Management FringeMiddleCenterOverall Mean
Mineral fertilizer (low rate) −2.5 b−2.2 c81.1 b
Mineral fertilizers (high rate)9.8 a19.3 a17.115.4 a
Organic amendments (low rate)−2.7 b5.6 bc5.22.7 b
Organic amendments (high rate)8.2 a11.1 ab5.58.2 ab
Mean3.28.49.06.9
LSD (5%)912.6n.s9.8
Within columns, aNUE values with the same letter are not significantly different from each other.

