Article

Actinobacteria Structure in Autogenic, Hydrogenic and Lithogenic Cultivated and Non-Cultivated Soils: A Culture-Independent Approach

by
Agnieszka Wolińska
1,*,
Dorota Górniak
2,
Urszula Zielenkiewicz
3,
Agnieszka Kuźniar
1,
Dariusz Izak
3,
Artur Banach
1 and
Mieczysław Błaszczyk
4
1
Department of Biology and Biotechnology of Microorganisms, The John Paul II Catholic University of Lublin; Konstantynów St. 1 I, 20-708 Lublin, Poland
2
Department of Microbiology and Mycology, University of Warmia and Mazury in Olsztyn; Oczapowskiego St. 1a, 10-719 Olsztyn, Poland
3
Department of Microbial Biochemistry, Institute of Biochemistry and Biophysics PAS; Pawińskiego St. 5a, 02-206 Warsaw, Poland
4
Department of Microbial Biology, Warsaw University of Life Sciences; Nowoursynowska 159/37 St., 02-776 Warsaw, Poland
*
Author to whom correspondence should be addressed.
Agronomy 2019, 9(10), 598; https://doi.org/10.3390/agronomy9100598
Submission received: 12 August 2019 / Revised: 25 September 2019 / Accepted: 27 September 2019 / Published: 29 September 2019

Abstract

:
The aim of the study was to determine the Actinobacteria structure in cultivated (C) versus non-cultivated (NC) soils divided into three groups (autogenic, hydrogenic, lithogenic) with consideration its formation process in order to assess the Actinobacteria sensitivity to agricultural soil use and soil genesis and to identify factors affecting their abundance. Sixteen C soil samples and sixteen NC samples serving as controls were taken for the study. Next generation sequencing (NGS) of the 16S rRNA metagenomic amplicons (Ion Torrent™ technology) and Denaturing Gradient Gel Electrophoresis (DGGE) were applied for precise determination of biodiversity. Generally, greater abundance of Actinobacteria in the NC soils relative to the C soils was found. Moreover, it was indicated that the actinobacterial diversity depended on both the soil genesis and the land use; however, this effect directly depended on the particular family and genera. Two factors: redox potential (Eh) and total carbon (TC) seemed to had a significant effect on the diversity of Actinobacteria. More precisely, Actinobacteria from the NC soils displayed a greater affinity for each other and were clearly influenced by Eh, whilst those from the C soils were mostly influenced by TC.

1. Introduction

The Actinobacteria phylum contains six classes, 59 families, and over 200 bacterial genera (www.bacterio.net) commonly widespread in all environments except for some extreme ones [1,2,3]. This phylum is mostly represented by relatively numerous taxonomic units among cultivable bacteria [4,5,6,7,8]; however, also culture-independent techniques have recently been applied for identification of Actinobacteria [9,10,11]. Actinobacteria are highly metabolically and physiologically diverse. They are represented by either Gram-positive or Gram-variable aerobes, facultative aerobes or anaerobes, and chemo-organotrophs [1] with high guanine and cytosine content in their DNA [12]. The presence of Actinobacteria in soils is important from the ecological point of view, as they are able to metabolize organic matter and possess an ability to remove pesticides, heavy metals, and other soil contaminants [1,13]. Moreover, they can produce bioactive metabolites, vitamins, siderophores, enzyme inhibitors, pigments, biosurfactants, phytotoxins, and enzymes important for degradation of complex polymers [1,2,3,14]. However, in some cases, harmful effects known as actinobacterial plant, animal, and human diseases can also be caused by Actinobacteria [12]. The majority of phytopathogenic features were found in Corynebacterium, whereas Actinomyces, Mycobacterium, Dermatophilis, Renibacterium, and Rhodococcus are responsible for human and animal diseases [12]. Thus, comprehensive knowledge of the structure and distribution of Actinobacteria in the soil environment is extremely desirable, as it can help to recognize positive or dangerous effects of the presence of Actinobacteria and, secondly, it can provide understanding of the impact of global environmental changes on the world’s microbial communities [2]. Until recently, Actinobacteria have been mainly studied with conventional (culturing) methods [4,5,6]; however, Next Generation Sequencing - NGS techniques are currently applied for better recognition of the soil microbiota diversity [2,15,16,17,18,19,20].
It is known that soil chemical properties are relevant to soil microbial structure [17]. The most important factors affecting soil microbial communities include temperature, moisture, and carbon and nitrogen content [2,21]. All of them are regarded as regulators of microbial activities in soil environments. Liu et al. [2] presented an effect of temperature on Actinobacteria abundance. It was assumed that temperature regulated most of the microbial metabolic activities. At lower temperature, the respiration level and enzymatic activity decrease; furthermore, the nutrient availability for microorganisms is affected by temperature as well [2,16,21]. Another factor with significance for microorganisms is soil moisture, which has an impact on their internal regulation mechanism [22]. More importantly, moisture is responsible for proper soil aeration status. In this context, aerobic Actinobacteria are particularly sensitive to the concentration of dissolved oxygen [23]. Moreover, soil moisture (like temperature) has an impact on the availability of soil nutrients [2,24]. Here, it should be strongly emphasized that nutrient (carbon, nitrogen) availability is the major limitation for microbial growth, abundance, and activity [2,25]. Liu et al. [2] proved that the Actinobacteria structure was positively correlated with carbon and nitrogen concentrations in the soil. In contrast, Sul et al. [26] noted higher Actinobacteria abundance (especially in relation to the subclass Rubrobacteridae) in soils with low carbon content. The inconsistency of these findings probably arises from the heterogeneity of the soil environment [27], as is difficult to unify the carbon content in different soil types and climatic zones. Analogically, the influence of nitrogen onthe soil microbial composition was studied [26,28] and a positive relationship between Actinobacteria and nitrogen concentrations was reported by Ramirez et al. [29] and Liu et al. [2]. This may result from the fact that nitrogen alters soil acidity and mediates microbial enzymatic and physiological metabolism [30]. Considering this knowledge, it should be emphasized that studies related to the impact of environmental parameters on microbial communities, including Actinobacteria, are worth continuing, as each additional result provides new data on the still unrecognized world of microorganisms and their environmental interdependencies.
To our knowledge, the structure of Actinobacteria in arable and non-cultivated soils is still poorly recognized. Usually, Streptomyces is demonstrated as the dominant genus in the soil environment in the description of this phylum [12] carried out with culture-dependent techniques, which is not always clear, as shown by our metagenomic (culture-independent) research.
We hypothesized that Actinobacteria structure could be dependent on the mode of land use, and the soil formation processes (soil genesis). Thus, the novelty of this study consists in the recognition and connection of theActinobacteria structure with the genesis of auto-, hydro-, and lithogenic soils, as well as the indication on genera sensitive and/or resistance to the agricultural land use. Thus, the main goals of this study performed with metagenomic and denaturing gradient gel electrophoresis techniques were to determine: (1) the community structure of Actinobacteria in cultivated and non-cultivated soils, representing three origin types, with identification of genera that are sensitive and resistant to agricultural activity and (2) the major environmental parameters influencing the distribution of Actinobacteria.

2. Materials and Methods
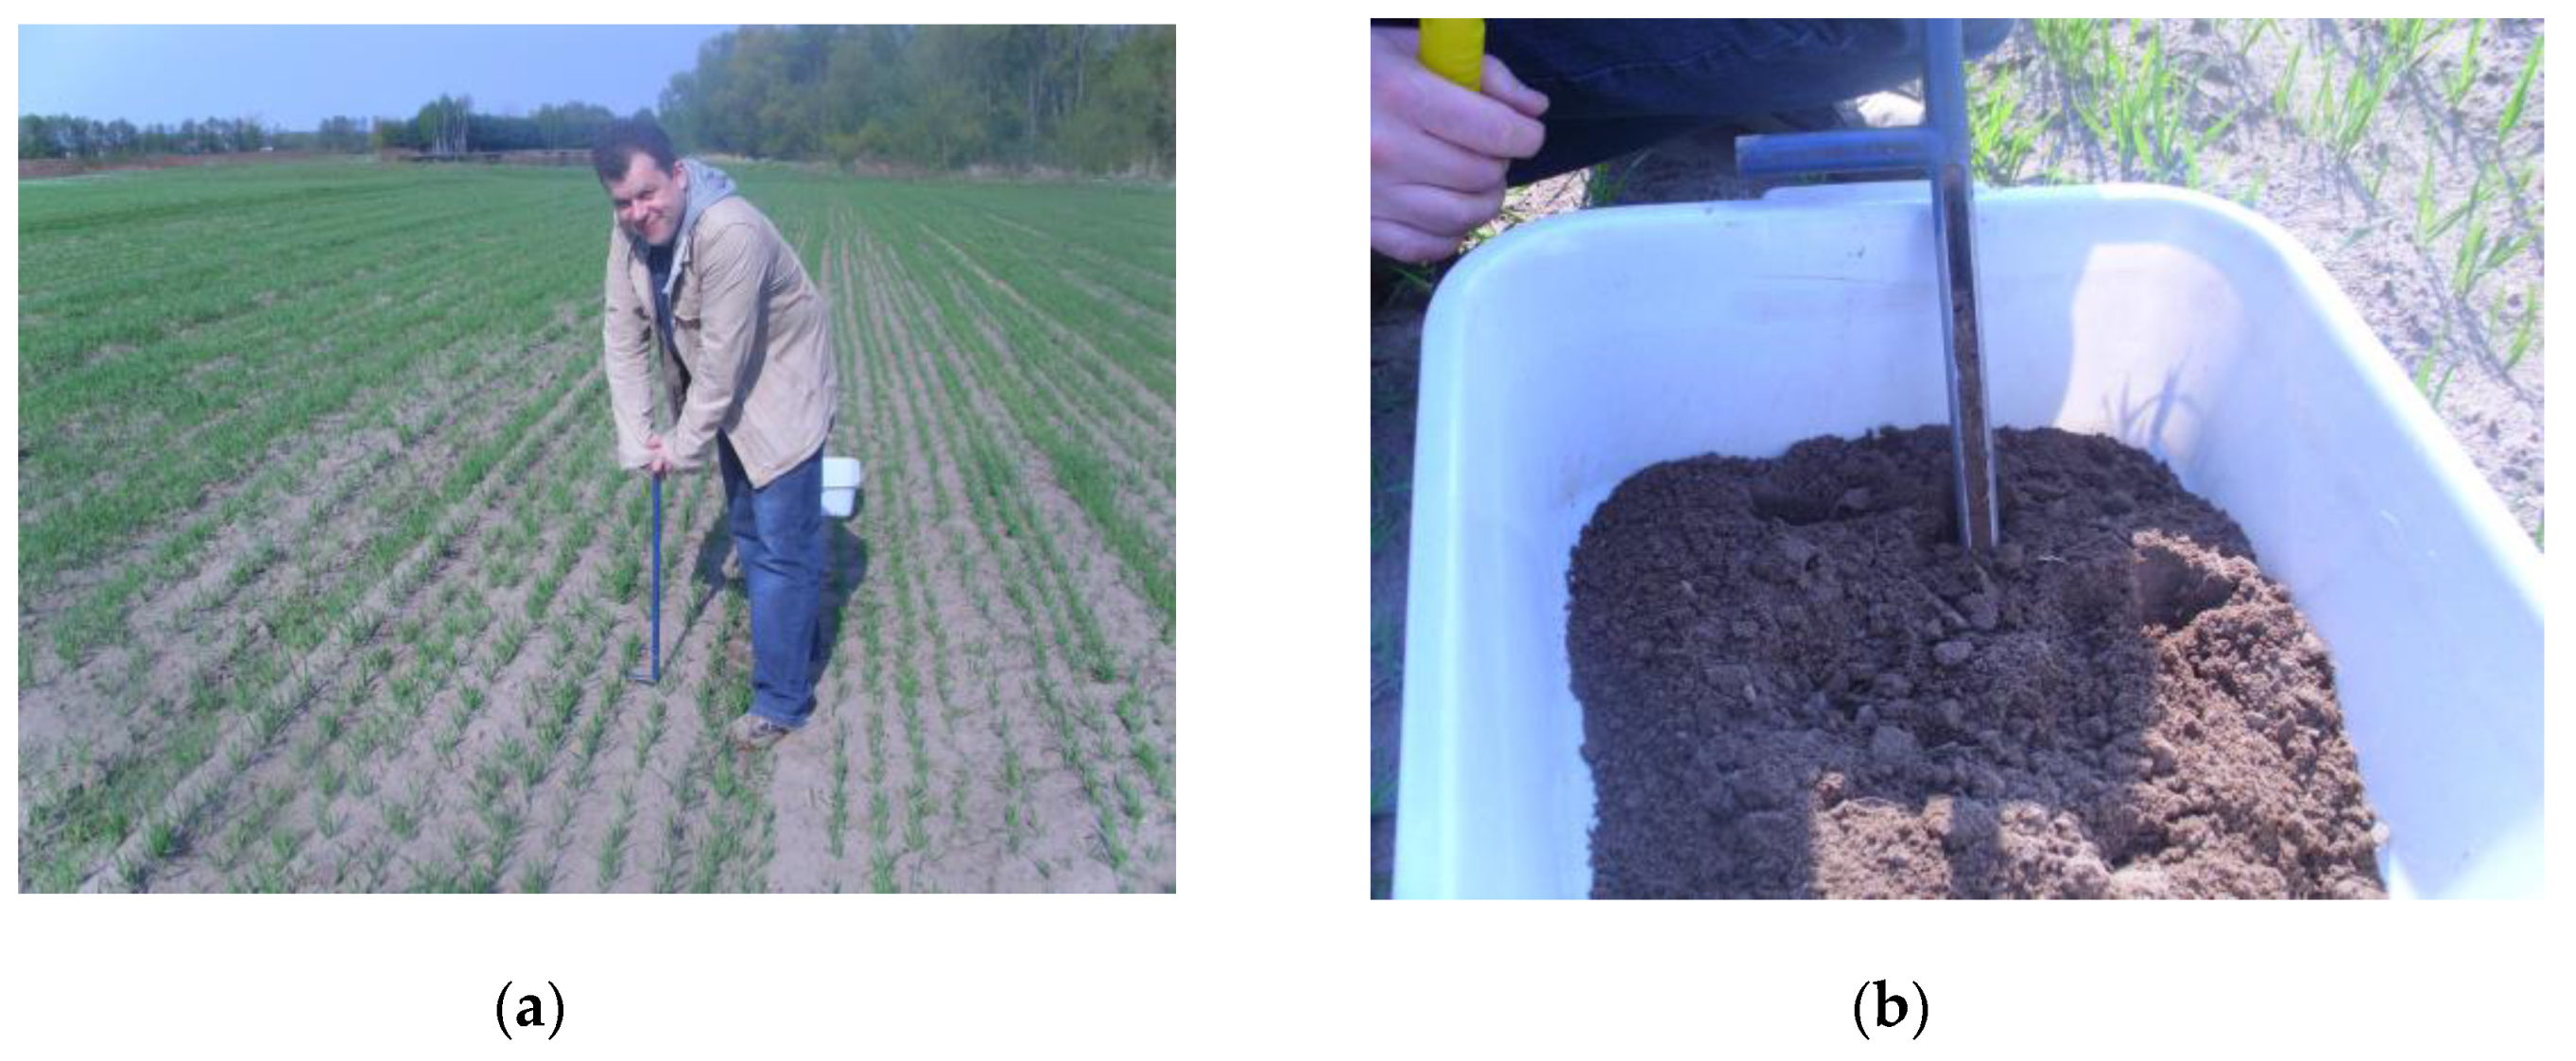
2.1. Soil Sampling

Soil materials were collected at the beginning of the spring season (before vegetation started) in the south-east part of Poland, Lubelskie voivodeship (51°13′N, 22°54′E), which has a borderline humid continental climate with cold and dump winters and warm summers [20]. The collected soil materials (Table 1) were grouped based on the soil formation process into 3 units: (1) autogenic—formed from loess material (including Luvisols, Arenosols, and Phaeozems) (2) hydrogenic—formed under an effect of stagnant water (including Gleysols and Luvisols), and (3) lithogenic—formed from limestone (including Leptosols).
The soils were sampled according to Polish Norm Rules [31], dedicated to soil sampling from cultivated sites for biological analyses. 10 x 10 m squares were selected for each of the sample sites (Table 1), and minimum 50 random samples were taken with use of Egner’s bow (Figure 1a) from the surface layer (0–20 cm) from each site [20]. The random samples were combined and homogenized into one representative sample for each of the sixteen sites (Figure 1b).
The same pattern was applied while taking the controls (non-cultivated and non-forested areas) located in close proximity (max. to 50 m) to the cultivated soils and belonging to the same soil types as the agricultural soils [20]. Consequently, 16 samples for arable soils (coded C—as cultivated) and for non-cultivated sites (coded NC—as non-cultivated) were obtained. The scheme of soil sampling was presented in our previous study [18]. In laboratory conditions, each sample was air-dried and sieved through a 2-mm mesh.

2.2. Soil Chemical Characteristics

All chemical parameters included in the current study were described and discussed in our previous studies [18,19,28]. The methods for determination of the moisture content, acidity (pH), and the concentrations of nitrogen biogenic forms (NH4–N, NO3–N, and NO2–N) were presented in Wolińska et al. [18]. The measurements of total carbon (TC) were described in Wolińska et al. [28], while the determination of PO4P was presented in Wolińska et al. [19].

2.3. DNA extraction and Next Generation Sequencing

DNA from the soils was extracted within 24 h after sampling, according to a modified method described by Tomczyk-Żak et al. [32]. The modification step was described in Wolińska et al. [19].
Next Generation Sequencing (NGS) of the 16S rRNA gene metagenomic amplicons was realized with the Ion TorrentTM technology (Ion PGM™, Life Technologies, Guilford, CT, USA). PCR amplifications were performed using Ion 16S™ Metagenomics Kit following the manufacturer’s recommendations, except that the number of cycles was reduced to 18. Sequencing (Ion 318™ Chip Kit v2) was performed in the Laboratory of Microarrays Analyses in Warsaw (IBB PAS) according to manufacturer’s protocols.

2.4. Bioinformatic Analysis

MOTHUR v.1.34.4. software (University of Michigan, MI, USA), was used for analysis of the DNA sequencing data obtained [33]. All reads were dereplicated and aligned to the mothur-formatted version of the Silva reference-database (silva.nr_v119) according to Quast et al. [34]. Afterwards, chimeras were removed using UCHIME [35]. Finally, the sequences were clustered into Operational Taxonomic Units (OTUs) based on a 97% similarity threshold [18]. Diversity indices and rarefaction curves were calculated using algorithms implemented in the Mothur software v.1.34.4 (University of Michigan, MI, USA).

2.5. Denaturing Gradient Gel Electrophoresis

The dominant Actinobacteria communities were distinguished by DGGE analysis performed with a D-Code Universal Mutation Detection System (BioRad Laboratories, Hercules, CA, USA). 16S rRNA gene fragments of Actinobacteriawere amplified from purified DNA using Actinobacteria specific primers [5]: 243F (5′-GGATGAGCCCGCGGCCTA-3′) and general eubacterial reverse primer 1378R (5′-CGGTGTGTACAAGGCCCGGGAACG-3′). A 1 µL volume (roughly 2–10 ng in an undiluted form) of each DNA was amplified by a PCR mixture containing 5 µL of 10×·buffer (Sigma Aldrich Co. Saint Luis, MO, USA), 6.0 µL of 25mM MgCl2 (Sigma Aldrich Co.), 2.5 µL of 10% (wt/vol) bovine serum albumin (Sigma Aldrich Co.), 1 µL of 10 mM dNTP (Sigma Aldrich Co.), 5 pmol of each primer, 0.4 µL (2U) TaqDNA polymerase (Sigma Aldrich Co.), and PCR-grade water up to the final volume of 50 µL.
The PCR products were checked in 1% agarose gels and used for nested PCR-amplification with GC-clamped eubacterial forward primer [4] 968F (5′-CGCCCGCCGCGCGCGGCGGGCGGGGCGGGGGCACGGGGGGAACGCGAAGAACCTTAC-3′) and reverse primer 1378R (5′-CGGTGTGTACAAGGCCCGGGAACG-3′). The template DNA from the actinobacteria-specific amplification was 10 fold diluted for nested PCR-amplification. The PCR reaction consisted of a 0.5–1 µL volume of the template DNA from the actinobacteria-specific amplification, 10 pmol of each primer, 1 µL of 10 mM dNTP solution, 5 µL of 10×·buffer (Sigma Aldrich Co.), 6.0 µL of 25 mM MgCl2 (Sigma Aldrich Co.), 0.4 µL (2U) TaqDNA polymerase (Sigma Aldrich Co.), and PCR-grade water up to the final volume of 50 µL. The PCR products were checked as previously described and further analysed in DGGE gels.
Next, the samples were loaded in 6% acrylamide gels with a denaturing gradient of 40–55% (where 100% denaturant is 7M urea and 40% formamide). Each well was loaded with 20 µL of the PCR product and the gels were run at 150 V for 5 h at 60 oC. The electrophoretic products were stained with gentle agitation of the gel for 30 min in 100mLof 1×TAE containing 5 µL of 1:10.000 commercial stock dilution of SYBR Gold nucleic acid stain (Invitrogen, Life Technologies) in dimethyl sulfoxide—DMSO. DGGE banding patterns were visualized in Appendix A (Figure A1) with UV transillumination and photographed using the Gel Doc 2000 gel documentation system (BioRad Laboratories). Three independent electrophoretic runs were made for each set of samples. DGGE gel images were analysed by Quantity One software in the GelDoc gel documentation system (BioRad Laboratories). The gel bands were identified using GelCompar software to create the presence-absence matrix described by Crump and Hobbie [36].

2.6. Statistical Analysis and Biodiversity Indices Calculation

Canonical correspondence analysis (CCA) was conducted to determine the Actinobacteria–environment relationships. Microbiological data for each sample were analysed in relation to all environmental parameters measured. The similarity was assessed with the Dice coefficient, and clustering analysis was performed using the unweighted pair-group method and arithmetic averages (UPGMA) for construction of the dendrogram. Species richness was determined by the number of bands resolved by PCR-DGGE in one sample line.
Two-way ANOVA test was used to study the effects of soil genesis and the mode of land use on the actinobacterial abundance. The analysis was performed for the most abundant families and genera. Tukey’s testpost hoc was used for assessment of differences between the groups. Significance was assumed at p-value < 0.05. All data were analysed statistically using Statistica version 10 (StatSoft Inc., Tulsa, OK, USA) and Canoco ver. 4.5 for Windows [37] for the correspondence analysis.
The Shannon-Weaver diversity index and Simpson index of dominance were calculated according to Vivas et al. [38]. H’– the Shannon-Weaver index of general diversity is an indicator of general species diversity and is known as a measure of diversity that combines species richness (the number of species in a sample) and their relative abundance. Lower values of H’ indicate more diversity while higher values indicate less diversity. Simpson’s Diversity Index - D’is a measure of diversity that takes into account the number of present species, as well as the relative abundance of each species. The D’ index has a value between 0 and 1. As species richness and evenness increase, the diversity increases. In this index, 1 represents infinite diversity and 0 denotes no diversity. 1/D—Simpson index of dominance (as the index increases, the diversity increases). S—the number of OTUs for DGGE profiles. At the same time, these indicators were also calculated for all samples from the two designated groups (cultivated soils and non-cultivated soils) as well as the Sorenson similarity index.

3. Results

3.1. Chemical Characteristics of Autogenic, Hydrogenic and Lithogenic Soils

Detailed chemical features of each of the 16 studied soil units ± standard deviation—SD are presented in Table 2, whereas averaged values of chemical factors in the C and NC samples representing auto-, hydro-, and litho-genic soils are summarized in Appendix A (Table A1).
The differences between soil genesis and soil use were the cause of the differences in their chemical properties. Generally, at the time of sampling (early spring), soil moisture oscillated between 7.61–11.83% and 10.72–15.90% for the C and NC soils, respectively. In terms of soils genesis, the lowest moisture was determined for the hydrogenic soils, whilst the highest moisture was exhibited by the lithogenic soil types. Soil acidity (pH) was substantially lower in the C soils (5.12–5.65) than in the control samples (5.98–6.14). Regardless of the land use and formation process, each soil was well oxygenated and no oxygen deficits were noted in any case. Redox potential (Eh) was at the level of 486.7–547.55 mV in the C soils and reached slightly lower values in the NC soils (445.43–536.5 mV).
Among the biogenic forms of nitrogen, nitrate nitrogen (N–NO3) dominated in both the C and NC soil samples, but their concentration was much higher in the C sites (19.83–55.07 mg/kg) than in the NC soils (6.55–11.97 mg/kg). The share of the other two forms of nitrogen was less significant and amounted to 0.11–0.14 mg/kg and 0.09 mg/kg for ammonium nitrogen (N–NH4) and nitrite nitrogen (N–NO2), respectively, in the C soils. In turn, in the NC soils, N–NH4 oscillated between 0.53 and 1.83 mg/kg, and N–NO2 ranged from0.11 and 0.39 mg/kg. The concentration of phosphates was higher in the C soils (3.38–7.41 mg/kg) in comparison to the control samples (0.80–3.25 mg/kg).

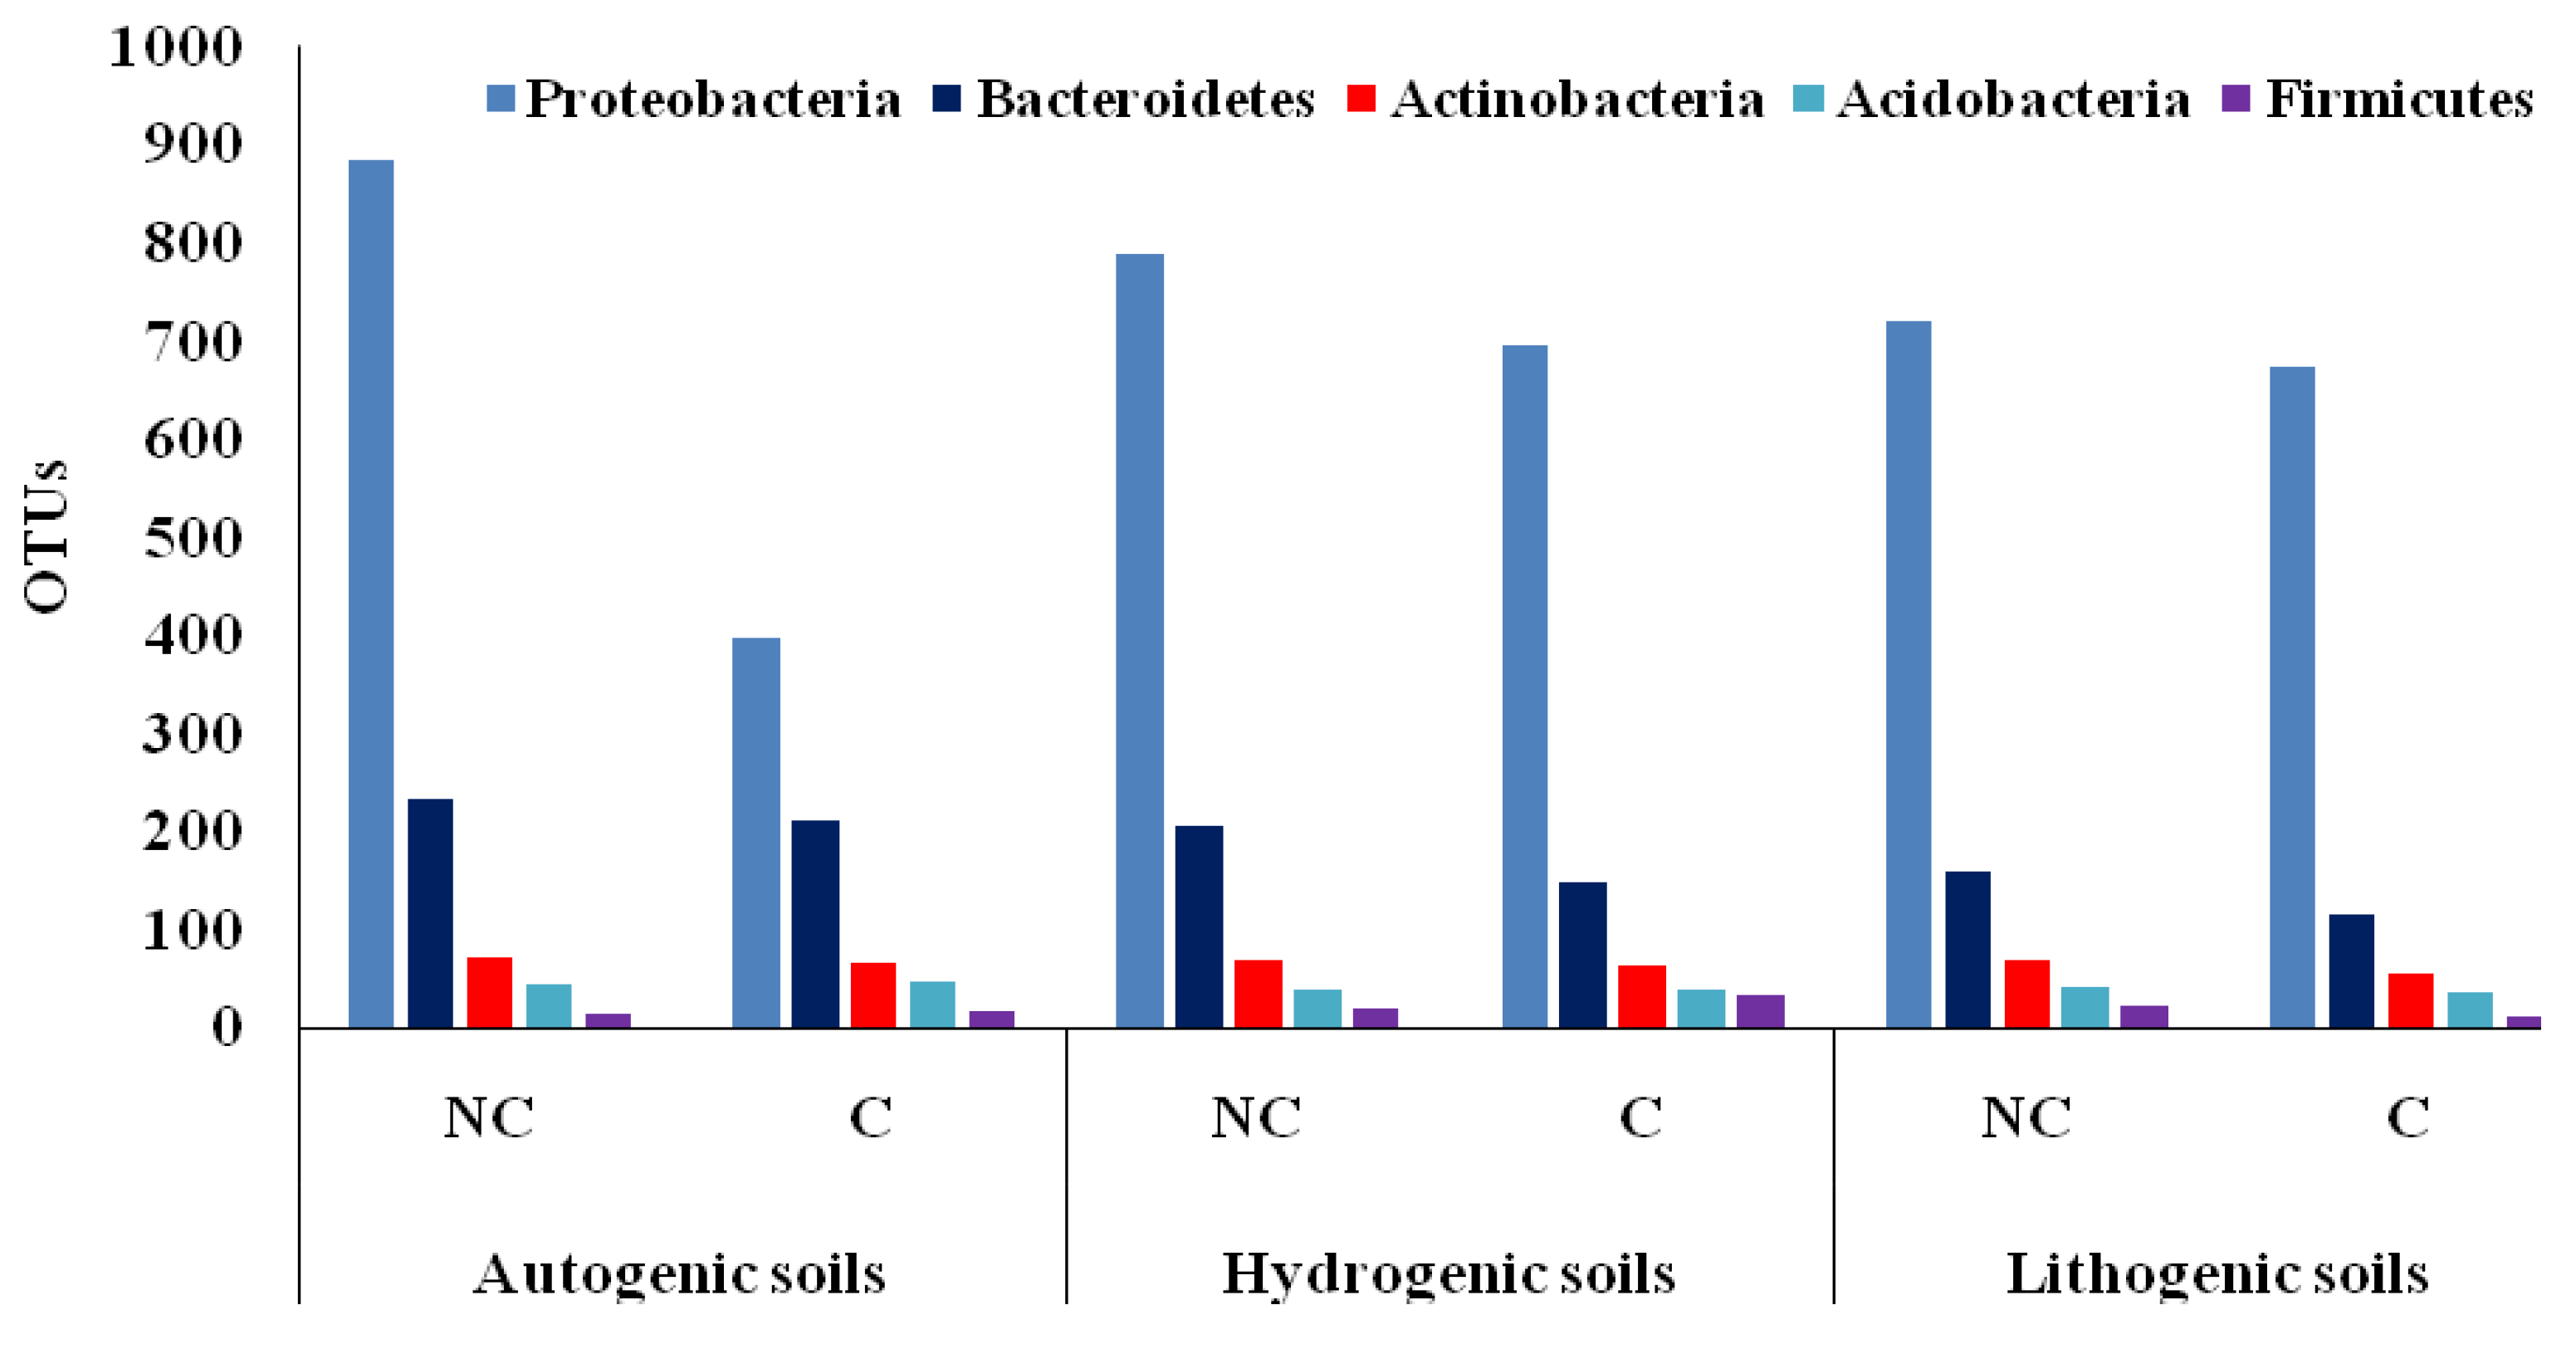
3.2. Biodiversity in Cultivated and Non-Cultivated Soils at the Phylum Level

Rarefaction curves were generated for all samples (Figure A2). Although the estimate of Good’s coverage of biodiversity in all of the soil samples was high (between 0.88 and 0.96), the rarefaction analyses evidenced that the communities were rather moderately sampled. As shown in Figure A2, the rarefaction curves did not reach a plateau for any sample, even for the sample with the highest number ofsequence reads (over 48,000; 3NC), indicating that many more reads would be required to capture the entire diversity.
The total number of 5 9804 OTUs was metagenomically detected in the studied soils. The bacterial structure in the C and NC soils with their classification according to the soil genesis are shown in Figure 2.
Proteobacteria turned out to be the unquestionable dominants in the studied soils, as their abundance was in the range of 720–885 OTUs (58.94% of the total relative abundance) in the NC soils and 398–695 OTUs (57.44%) in the C soils. Bacteroidetes were subdominant (160–234 and 116–211 OTUs for NC and C, respectively, constituting 15.37% and 11.5% of the total relative abundance), whereas Actinobacteria were in the third place in the bacterial structure of the analysed soils with 68–72 OTUs in the NC soils (5.19% of the total relative abundance) and 55–65 OTUs (4.75% of the total relative abundance) in C (controls soils). Acidobacteria ranked fourth in the structure of soil bacteria in the Lublin region with 38–44 OTUs in NC (2.87% of the total relative abundance) and 35–46 OTUs in C (3.25% of the total relative abundance). The abundance of Firmicutes OTUs was much lower than that of the dominants and amounted to 14–21 (1.25% of the total relative abundance) and 12-34 (1.51% of the total relative abundance) for C and NC, respectively.

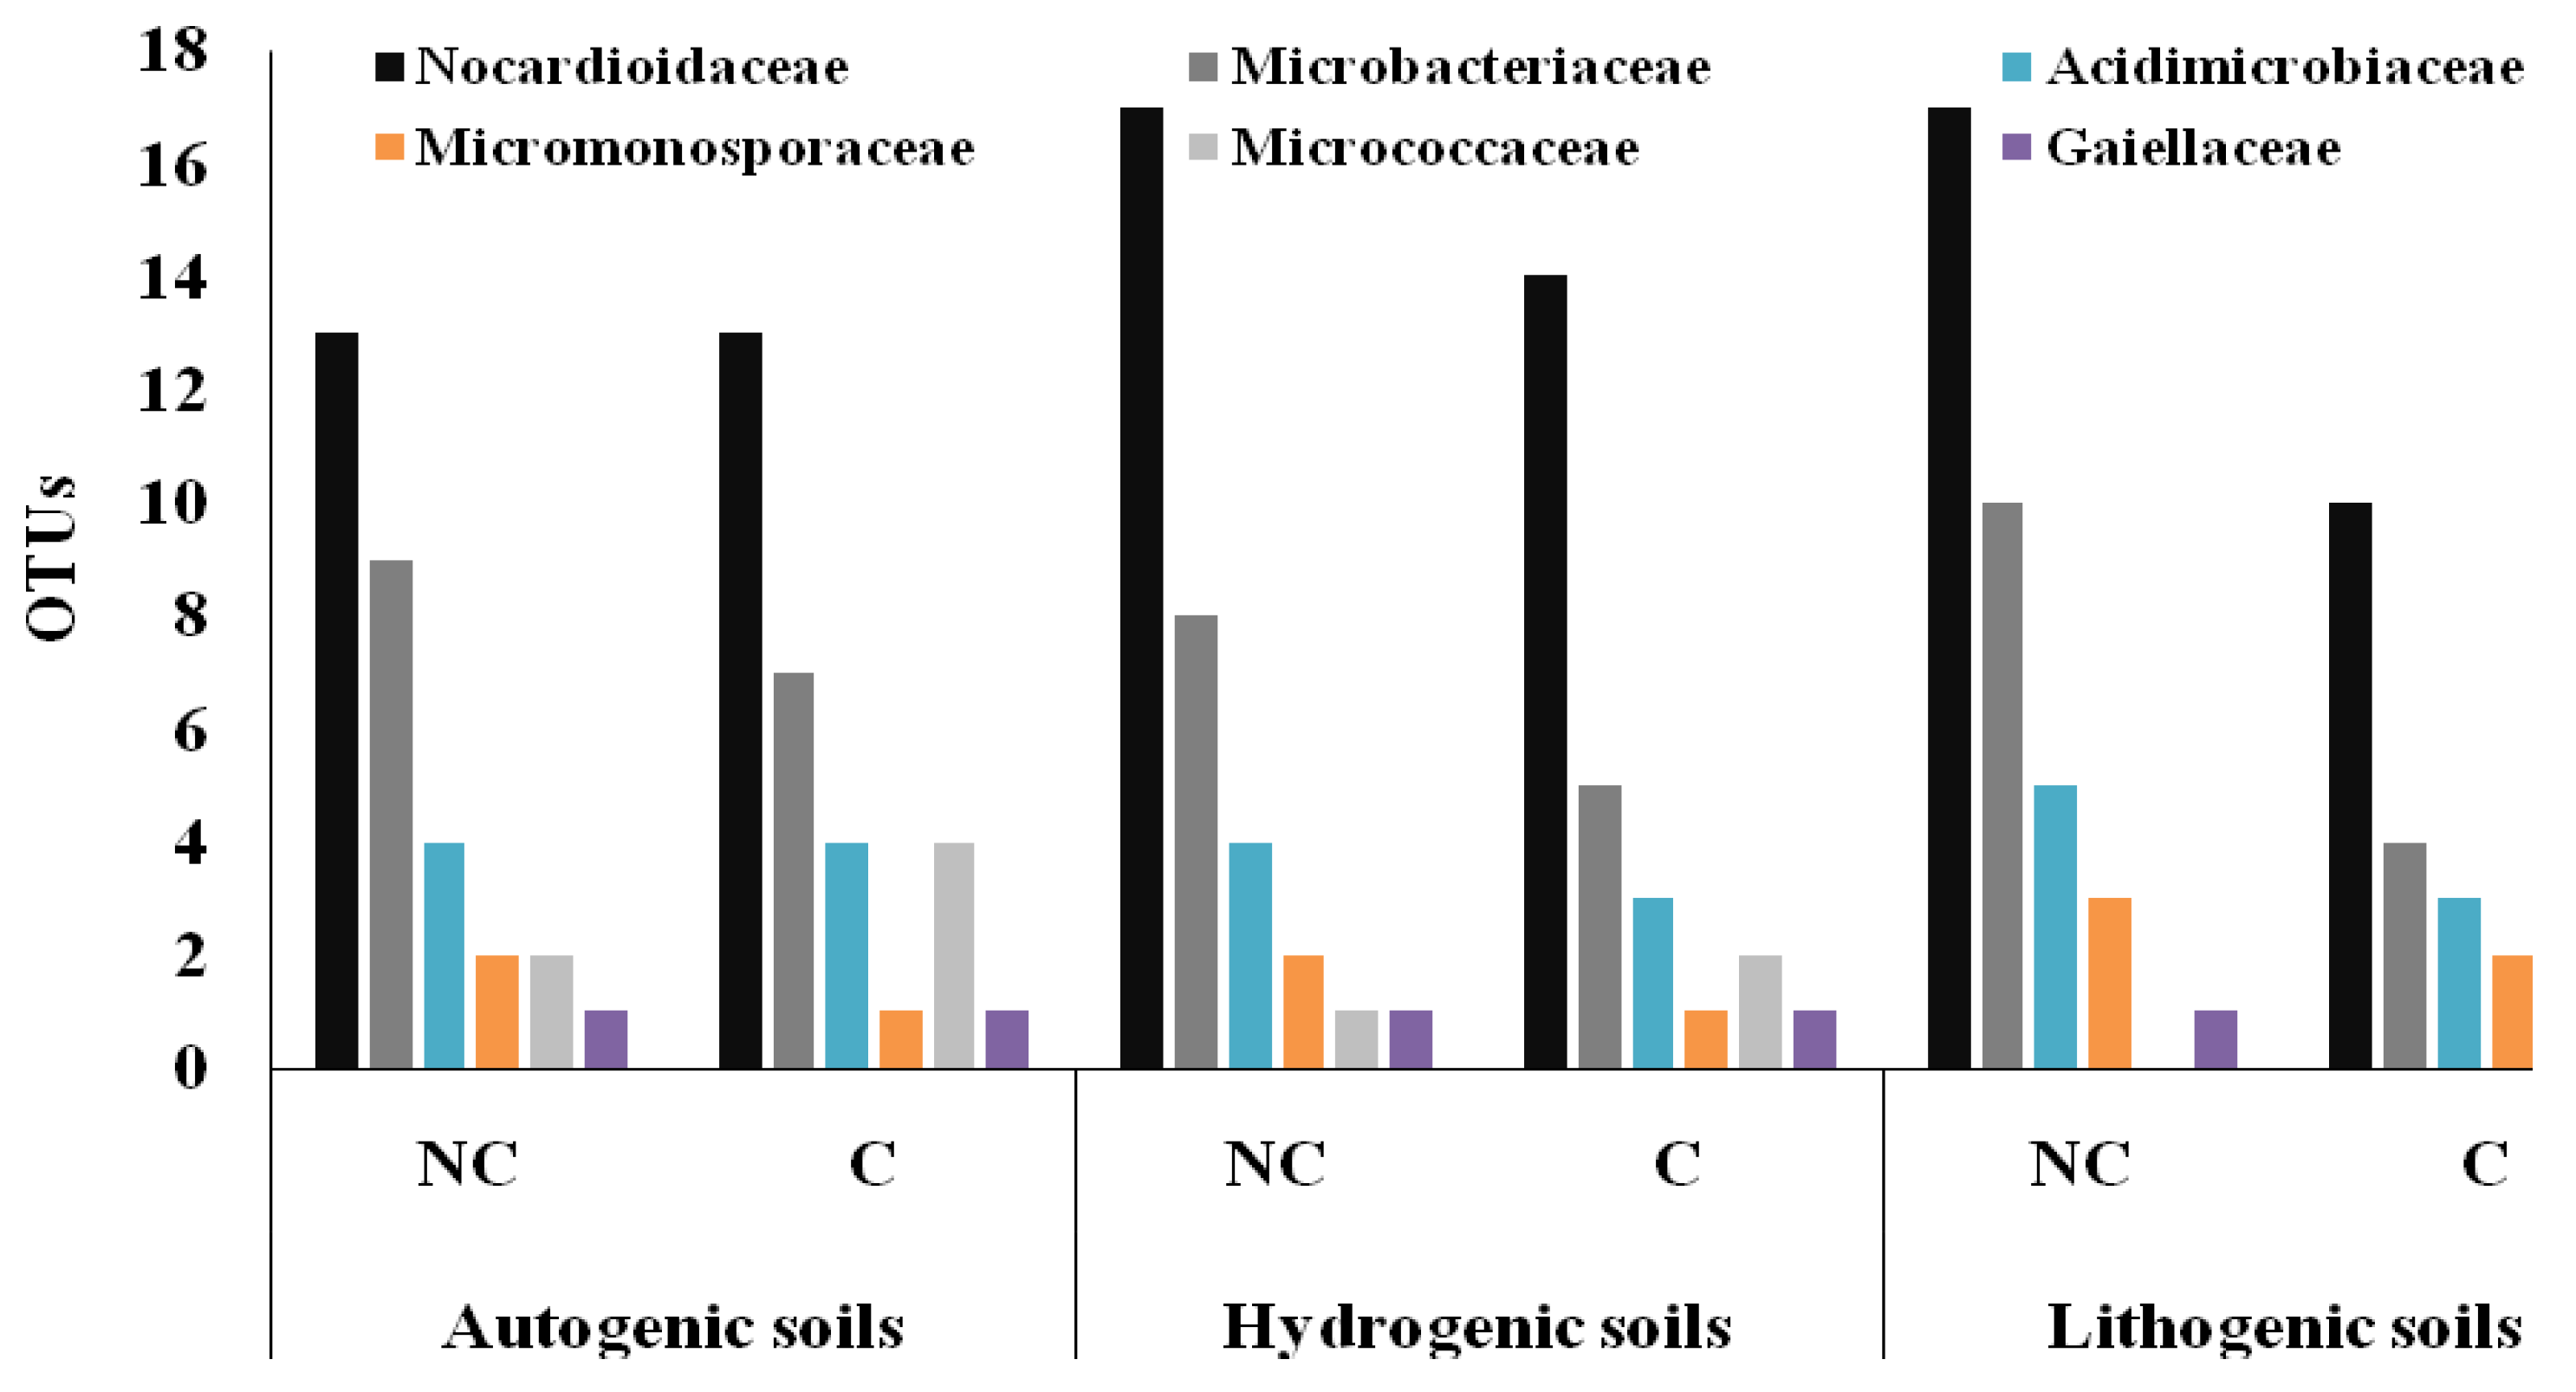
3.3. Structure of Actinobacteria in Arable and Non-Cultivated Soils at the Family Level

Figure 3 shows the structure of Actinobacteria determined by NGS at the family level in the three genetic soil types, with indication of families that are sensitive to agricultural soil use, i.e., displaying a decrease in OTUs in the C soils, and families that are resistant to agricultural practices, exhibiting an increase in OTUs in the C soils compared to the NC sites.
The family Nocardioidaceae seemed to be a clear dominant in both the NC and C soils of the Lublin region. This trend was maintained regardless of the soil type or origin, but the hydrogenic and lithogenic NC soils seemed to be a more preferable niche for Nocardioidaceae colonization than autogenic soils. The number of Nocardioidaceae representatives was at a similar level in the NC and C variants of the autogenic soils (13 OTUs), 17 OTUs were detected in the NC hydro- and lithogenic soils and 10–14 OTUs in the C lithogenic and hydrogenic soils, respectively.
The family Microbacteriaceae appeared to be a sub-dominant of Actinobacteria in the Polish C and NC soils. It was sensitive to agricultural treatment and, irrespective of the soil genesis, showed reduced abundance in the C soils compared to the control soils (NC). The decrease in the number of OTUs was estimated at 60, 37.5, and 22% in the C litho-, hydro-, and autogenic soils, respectively.
Acidimicrobiaceae having the third place in the Actinobacteria structure in terms of numbers was also sensitive to the agricultural land use. The number of Acidimicrobiaceae OTUs ranged from 3 to 4 OTUs in the C variant of the hydrogenic, autogenic, and lithogenic soils and from 4 to 5 OTUs in the NC soils, respectively. In the case of this family, the NC lithogenic soils seemed to be the most preferred niche for colonization. Another family of Actinobacteria reacting by a decrease in the number of OTUs in the C soils, compared to NC, was Micromonosporaceae with their 30–50% reduction of abundance in all the genetic soil types studied. In contrast, resistance to cultivation was demonstrated by the family Micrococcaceae, where the number of OTUs was higher in the NC soils (2–4 OTUs) compared to the C soils (1 OTU); however, their presence in the lithogenic soils was detected. The least numerous in the Actinobacteria structure was the family Gaiellaceae with 1 OTUs in the C and NC autogenic and hydrogenic soils and 1–2 OTUs in the NC and C lithogenic soils.

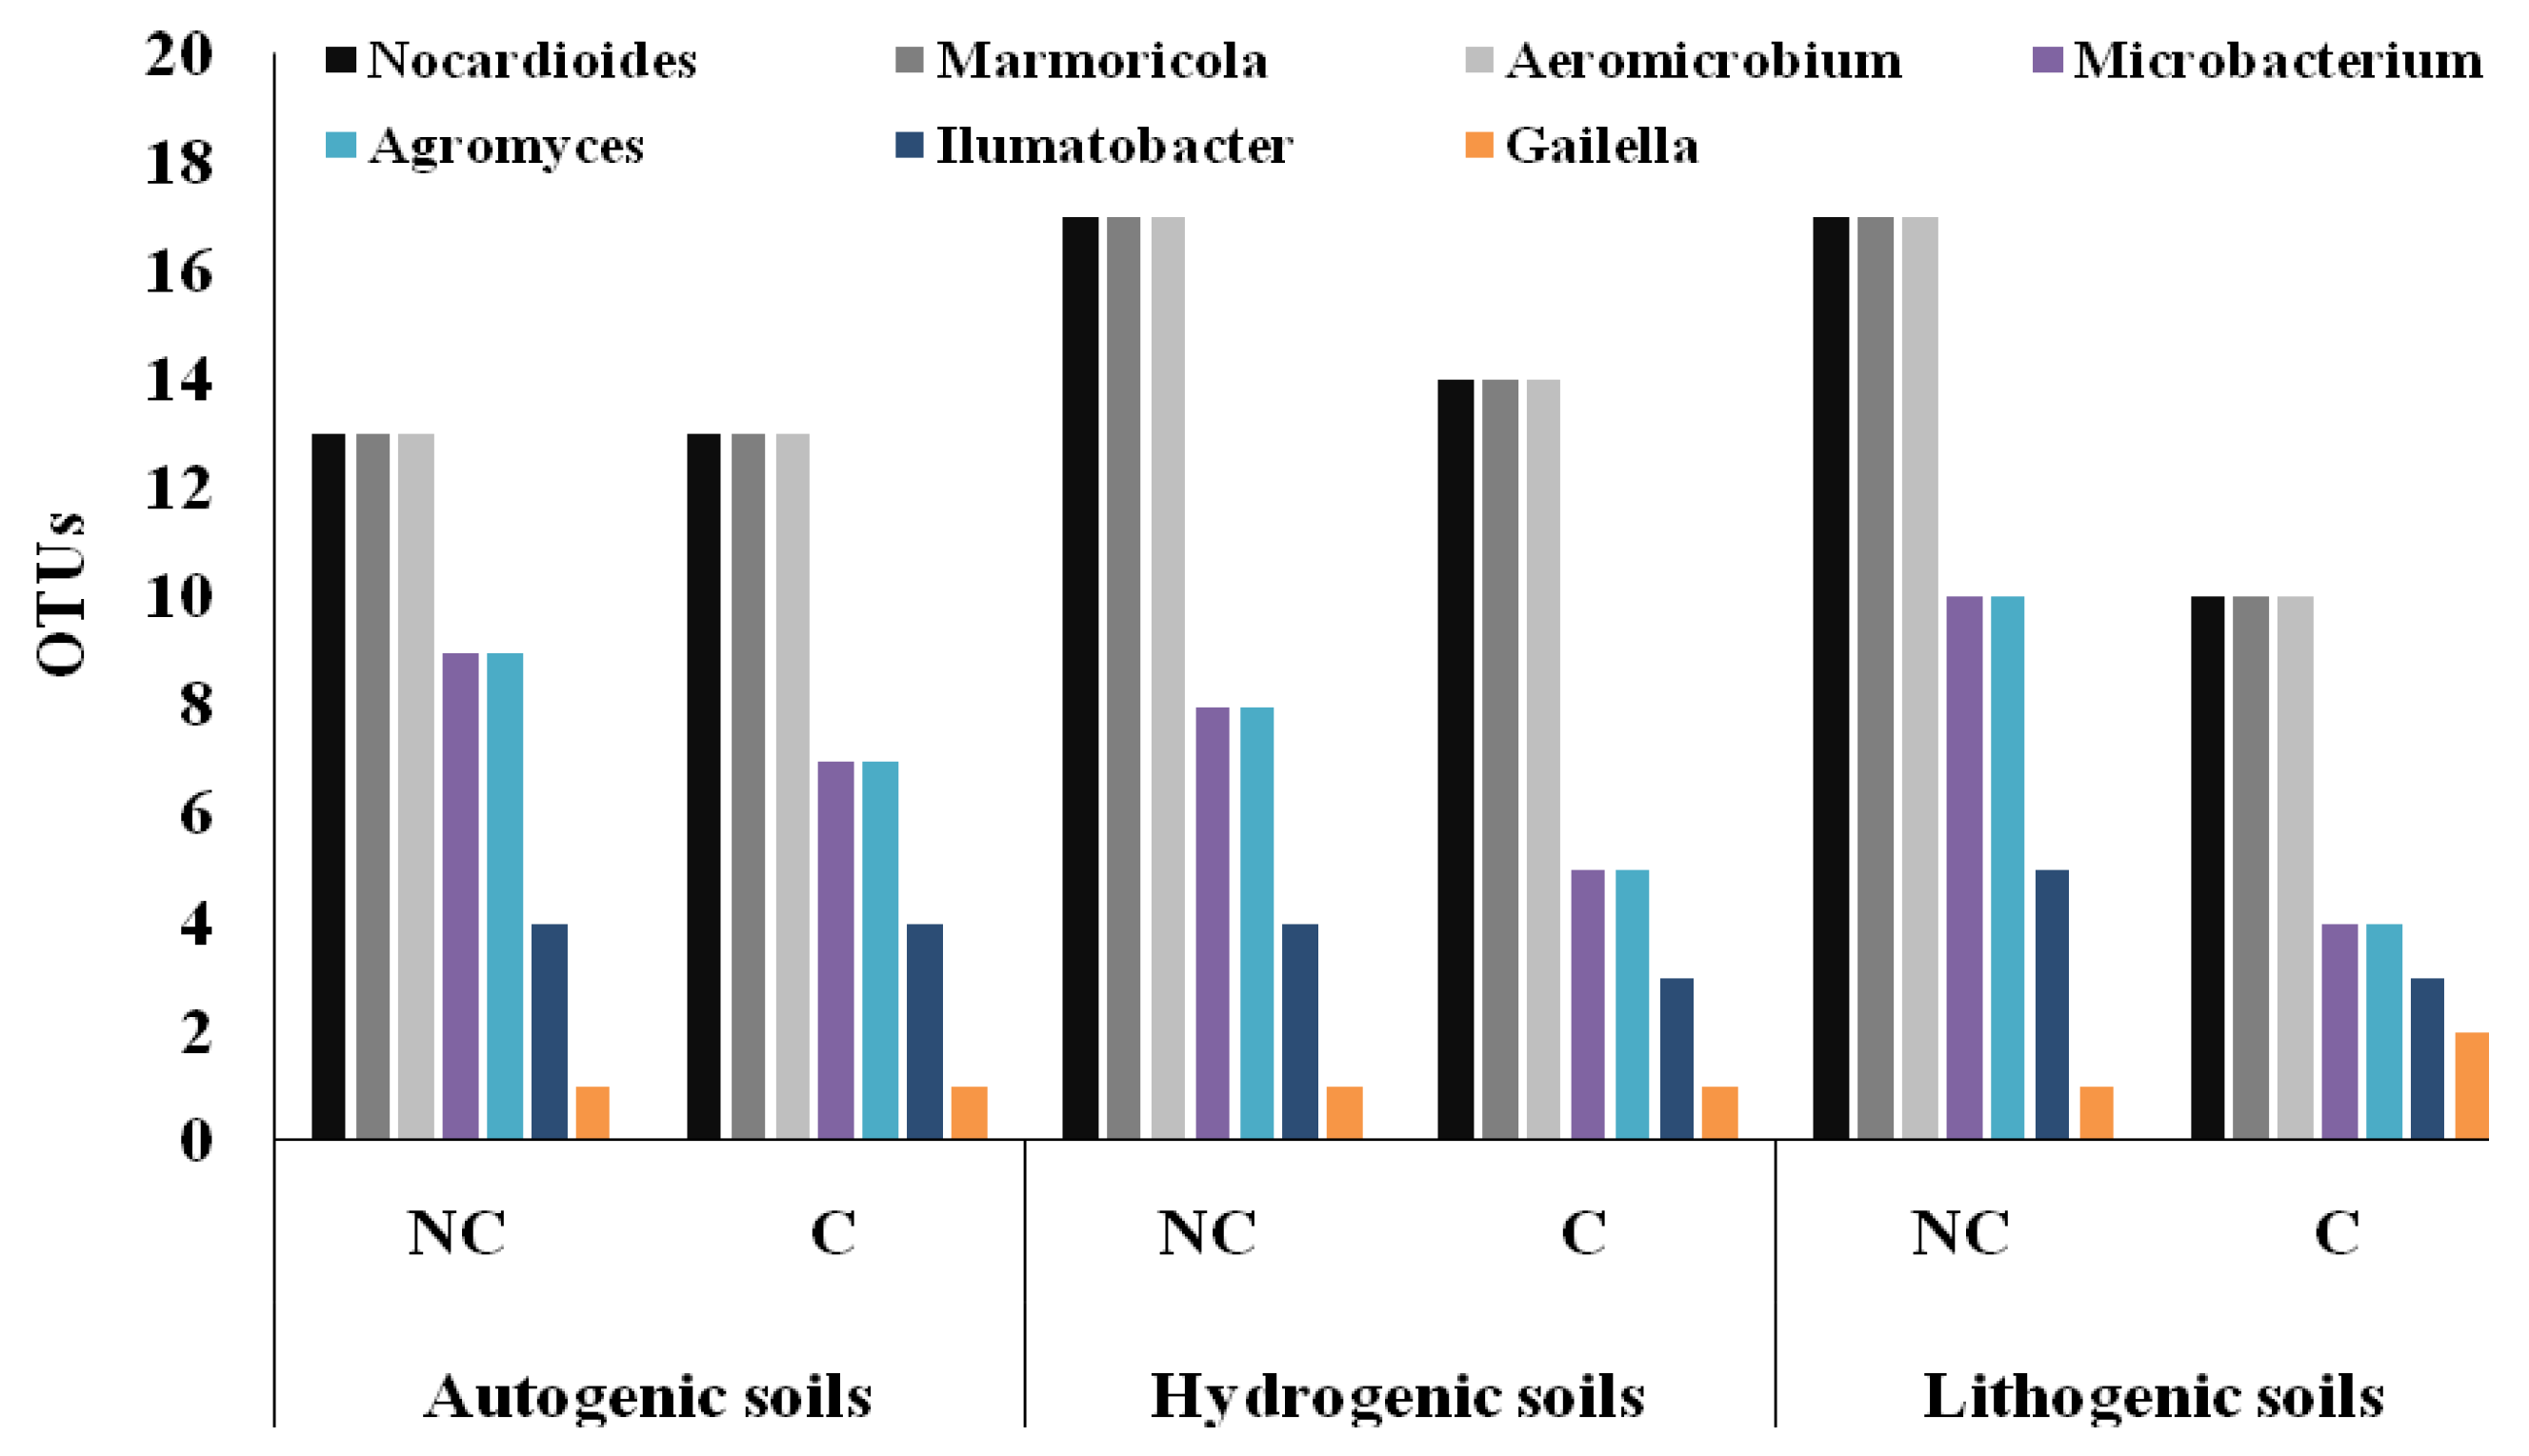
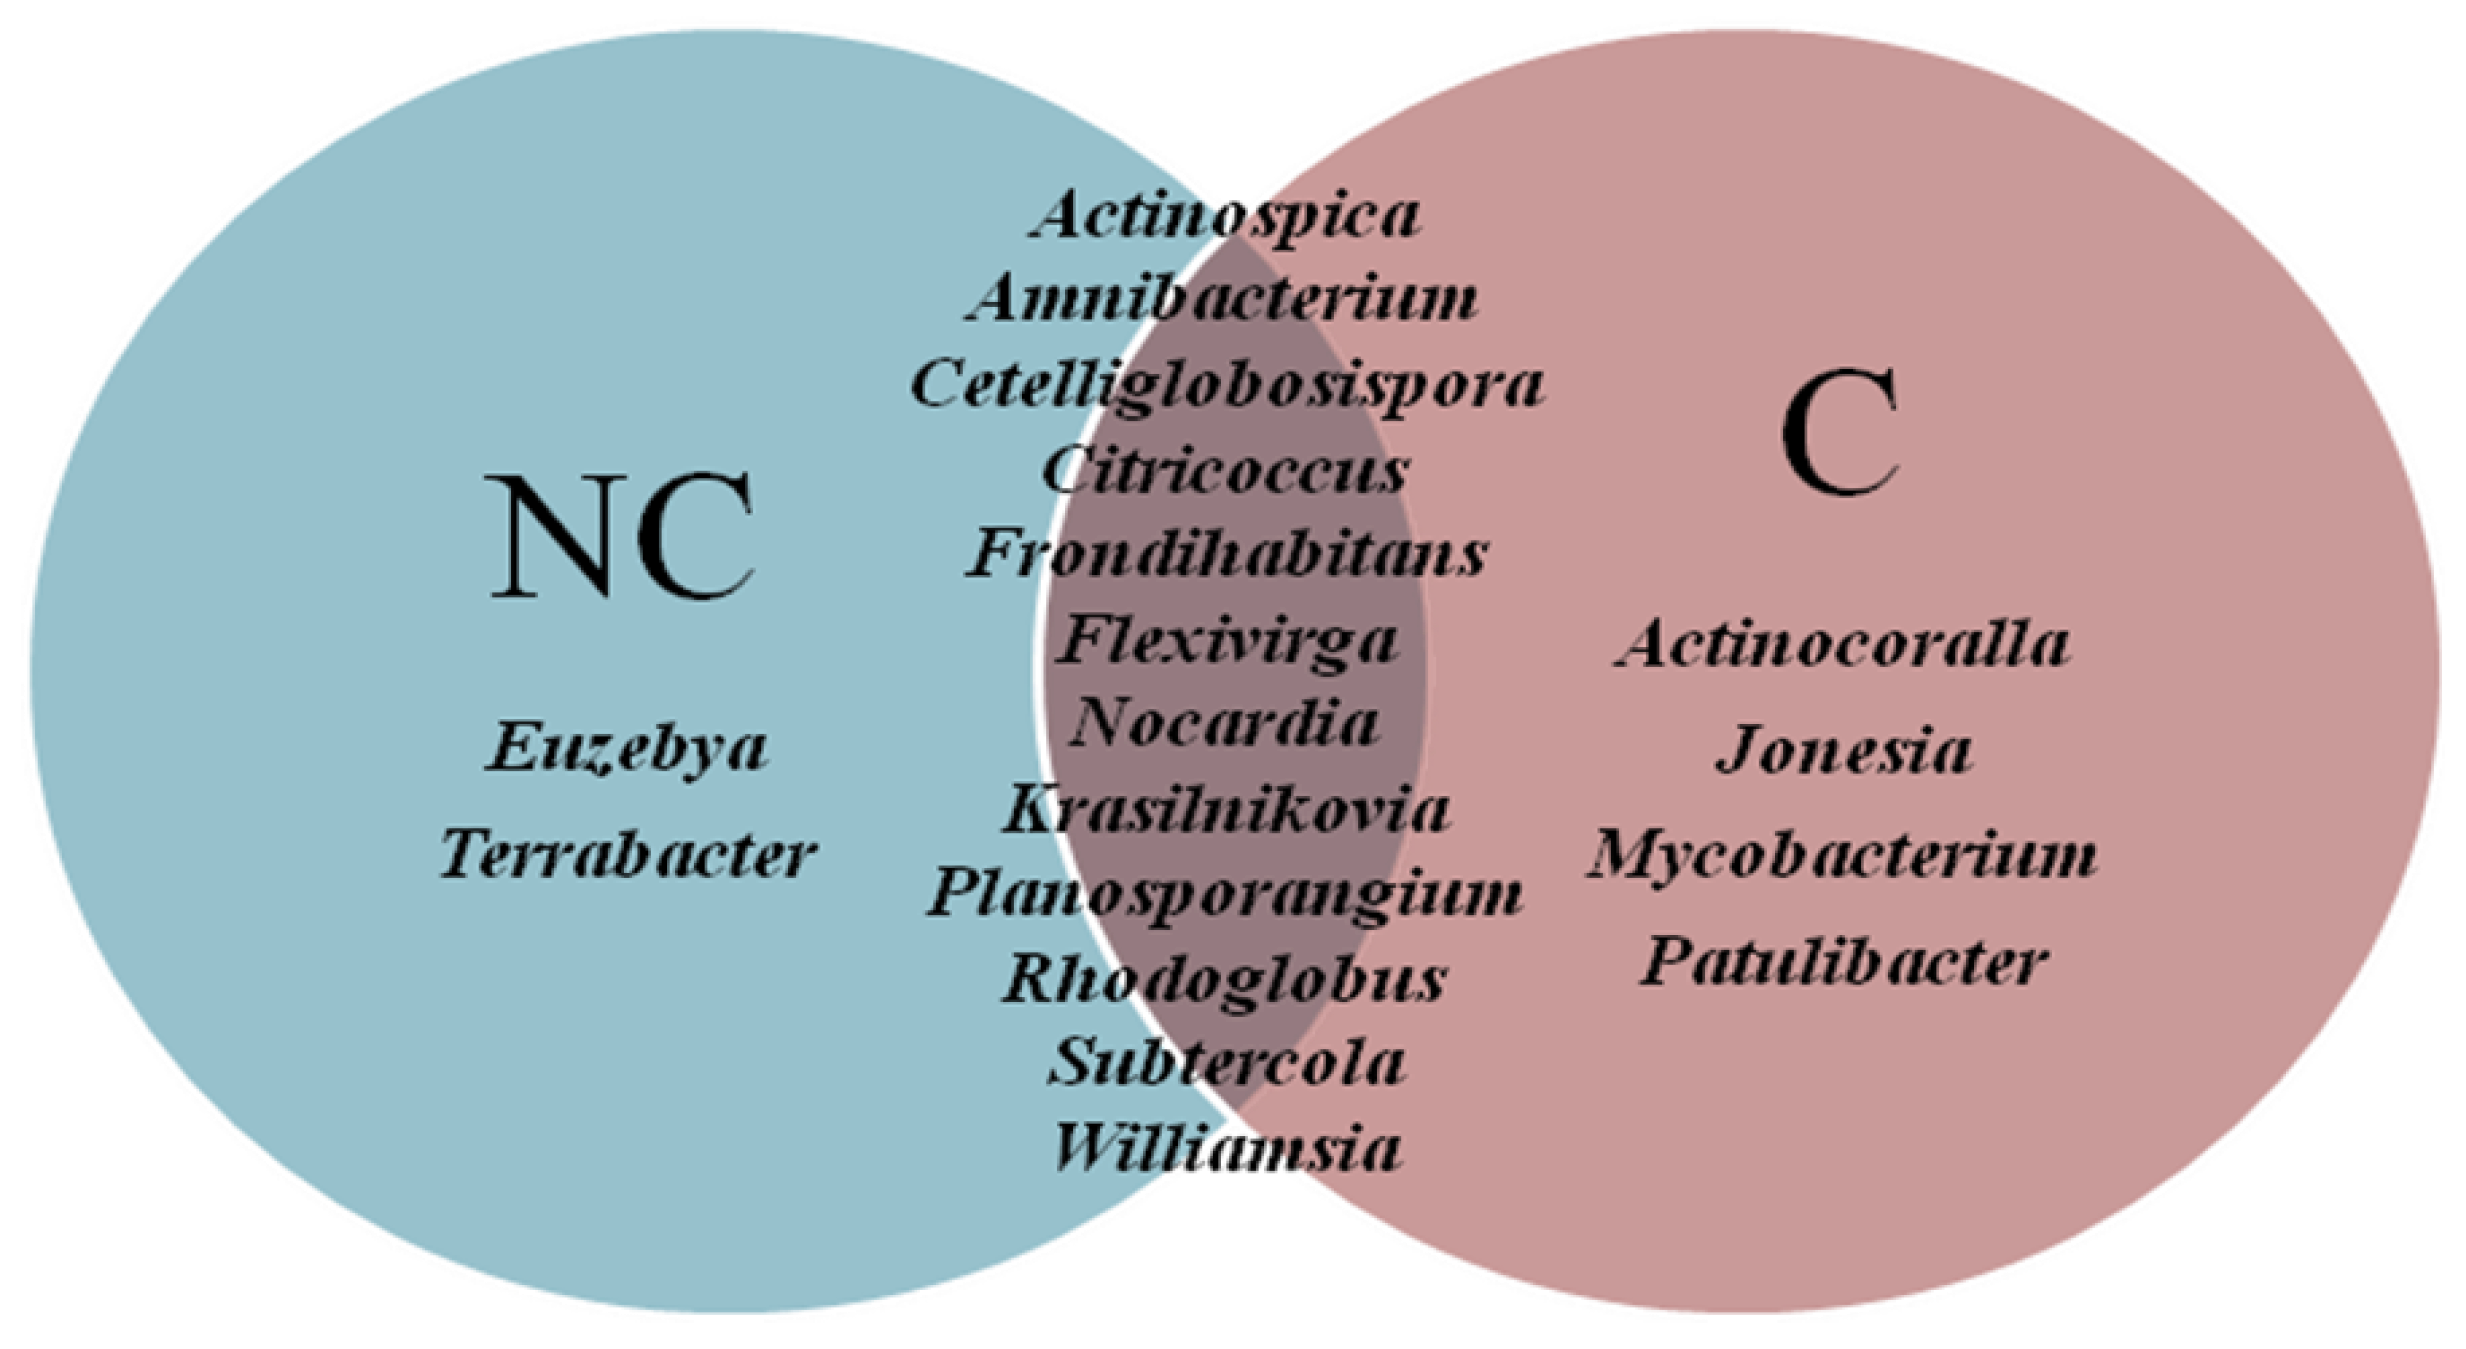
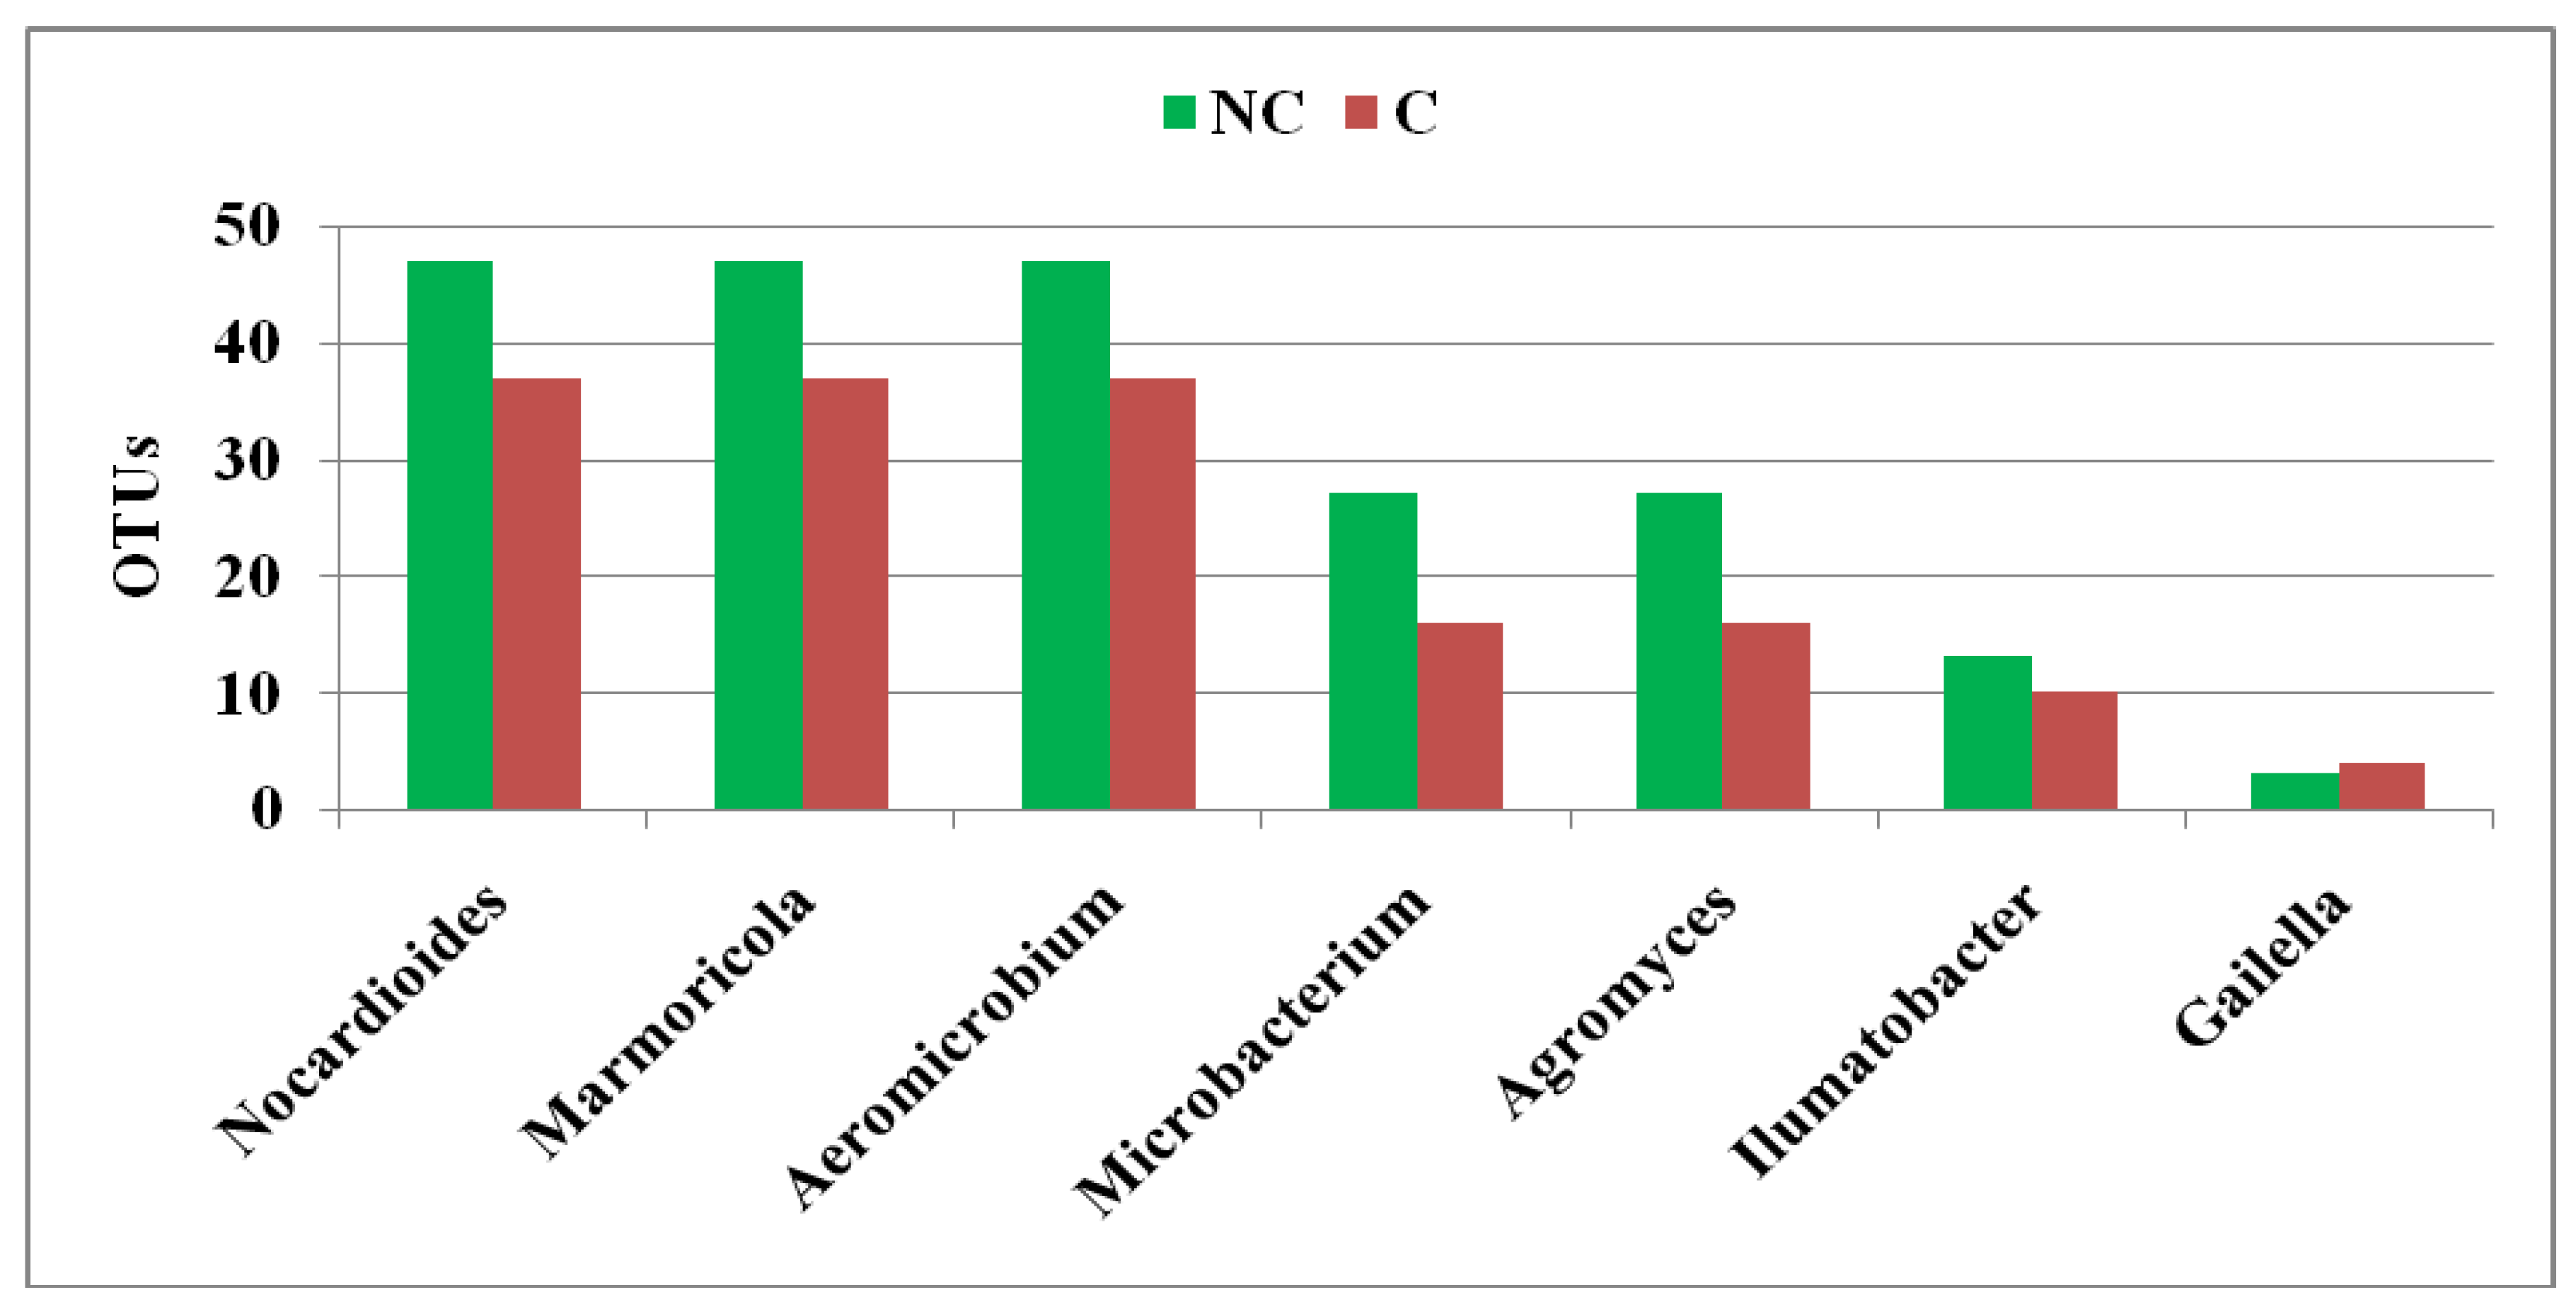
3.4. Structure of Actinobacteria in Arable and Non-Cultivated Soils at the Genus Level

Figure 4 shows the structure of Actinobacteria determined by NGS at the genus level in the three genetic soil types, with indication of genera that are sensitive to agricultural soil use, i.e., displaying a decrease in OTUs in the C soils and genera that are resistant to agricultural practices, exhibiting an increase in OTUs in the C soils compared to the NC sites.
As in the dominant family Nocardioidaceae, the actinobacterial genera Nocardioides, Marmoricola, and Aeromicrobium dominated in the studied NC and C soils, irrespective of their formation process. Nevertheless, their abundance was higher in the NC soils (Figure A3) than in C.
Relatively large numbers in the Actinobacteria structure were represented by two genera Microbacterium and Agromyces from the family Microbacteriaceae. Interestingly, their number was determined by the soil genesis and land use, and the highest abundance was found in the NC lithogenic soils (10 OTUs), followed by the NC hydrogenic and autogenic soils (9 and 8 OTUs, respectively), Figure 4, Figure A3.
At the same time, the number of OTUs in the C variant was 7, 5, and 4 for the auto-, hydro-, and lithogenic soils, respectively. The trend observed in the OTU reduction in the C soils in comparison to the NC sites in each analysed soil groups may suggest that each of the genera is sensitive to agricultural practices (Figure 4).
Ilumatobacter, belonging to Acidimicrobiaceae, also demonstrated sensitivity to the agricultural use of the soils, but only in hydrogenic and lithogenic soils, where a 25–40% decrease in the OTU number was noted in the C soils, respectively, in relation to the NC variant. In the autogenic soils, the same level of Ilumatobacter (4 OTUs) was noted, regardless of the C/NC combination.
Gaiella was the least numerous genus in the studied soils with 1-2 OTU in the C and NC autogenic and hydrogenic soils (Figure 4). In contrast to the aforementioned types, the number of Gailella was slightly higher in the C soils than in NC (Figure A3). Interestingly, the largest known genus of Actinobacteria usually described as most abundantly represented in soils is not included in the presented graphs, as the number of Streptomyces representatives in our study was negligible, likewise that of the family Streptomycetaceae.
Specific and common actinobacterial taxons in the NC and C samples are visualized in Venn’s diagram (Figure 5).
It was found that 12 actinobacterial genera seemed to be common for both sites (NC and C): Actinospica, Amnibacterium, Cetelliglobosispora, Citricoccus, Frondihabitans, Flexivirga, Nocardia, Krasilnikovia, Planosporangium, Rhodoglobus, Subtercola, and Williamsia.
Actinobacterial genera specific for the C sites only were limited to Actinocorallia, Jonesia, Mycobacterium, and Patulibacter, whereas those characteristic for the NC soils were represented by Euzebya and Terrabacter (Figure 5).

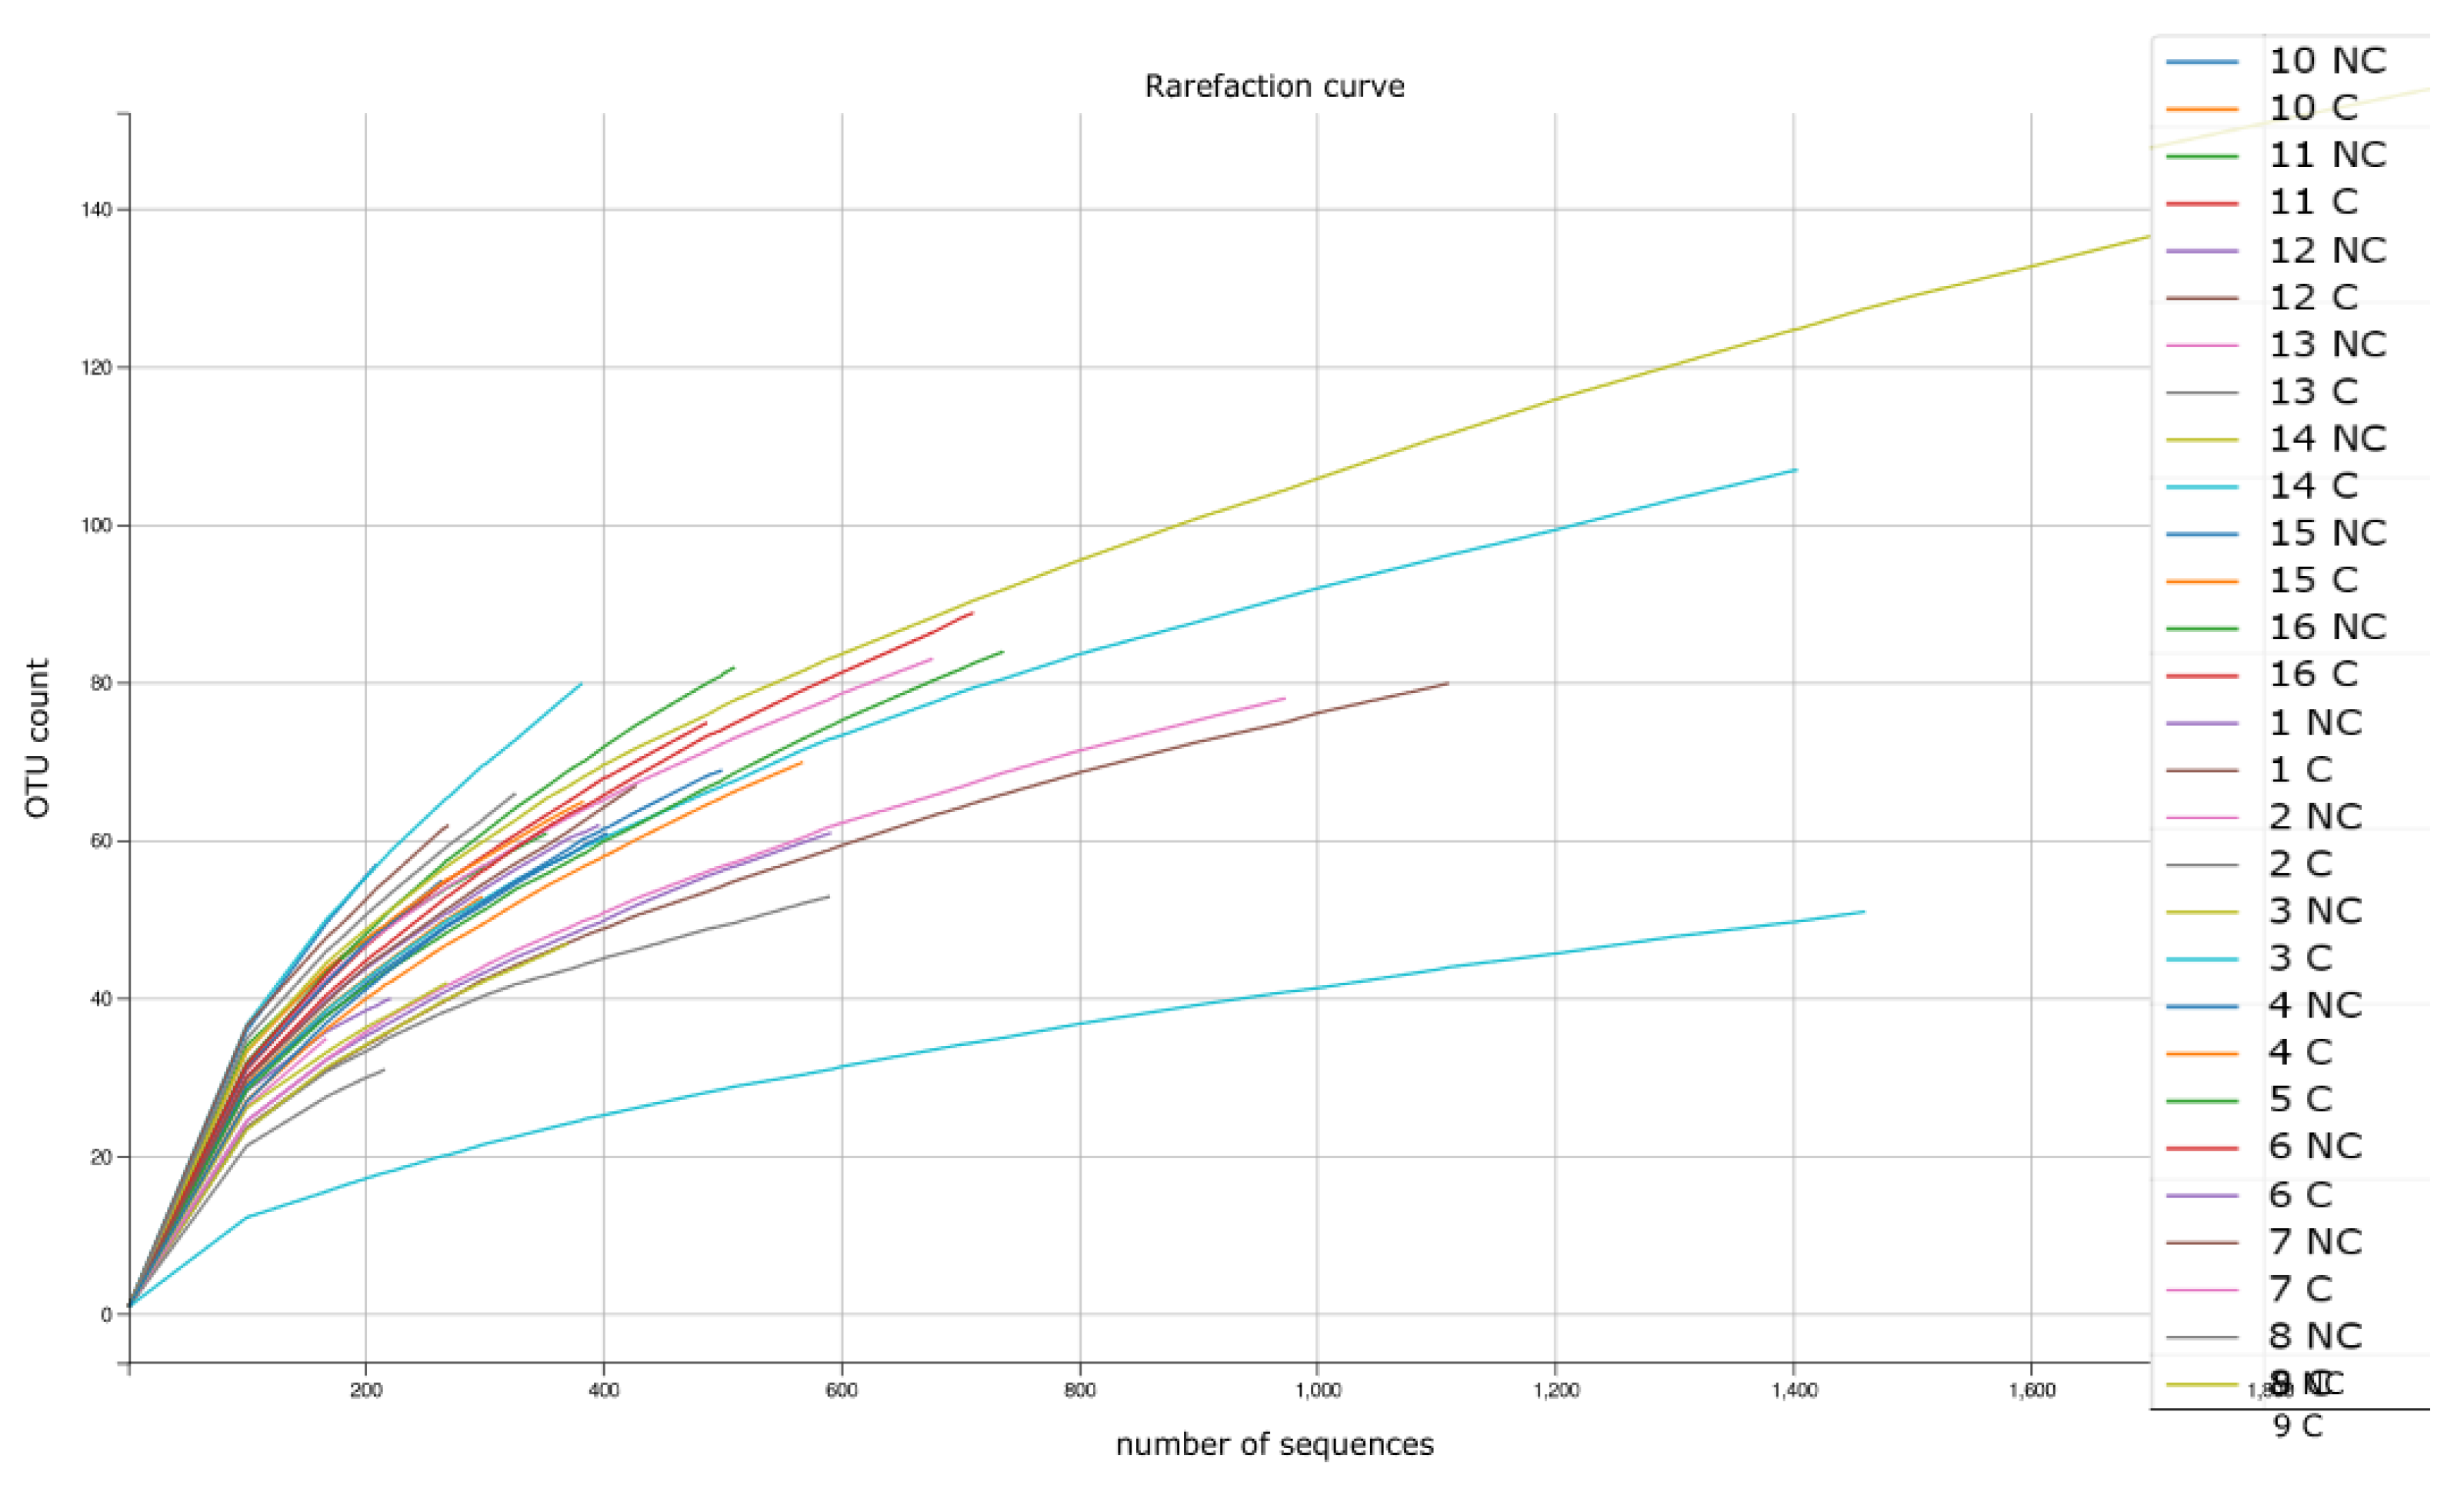
3.5. Biodiversity Indices Calculated Based on NGS Analysis

The biodiversity indicators obtained from the NGS analyses were calculated in accordance with the result presentation scheme (division into three soil genetic groups) and shown in Table 3.
The Shannon diversity (H’) index ranged from 2.86 in the C autogenic soil samples to 3.08 in the C lithogenic soil samples. In the NC variant, H’ was slightly higher, i.e., between 2.87 and 3.13. The Simpson’s biodiversity index (D) in all of the samples was very low, ranging between 0.07 in the C lithogenic soils to 0.14 in the NC autogenic soil samples. Also, the 1/D index had higher values in the NC variant (10.28–14.00) of each soil types in comparison to the C soils (9.90–11.74). Each of the diversity estimators (Table 3) indicated highly heterogeneous ecosystems and higher actinobacterial biodiversity in the NC rather than C soils.

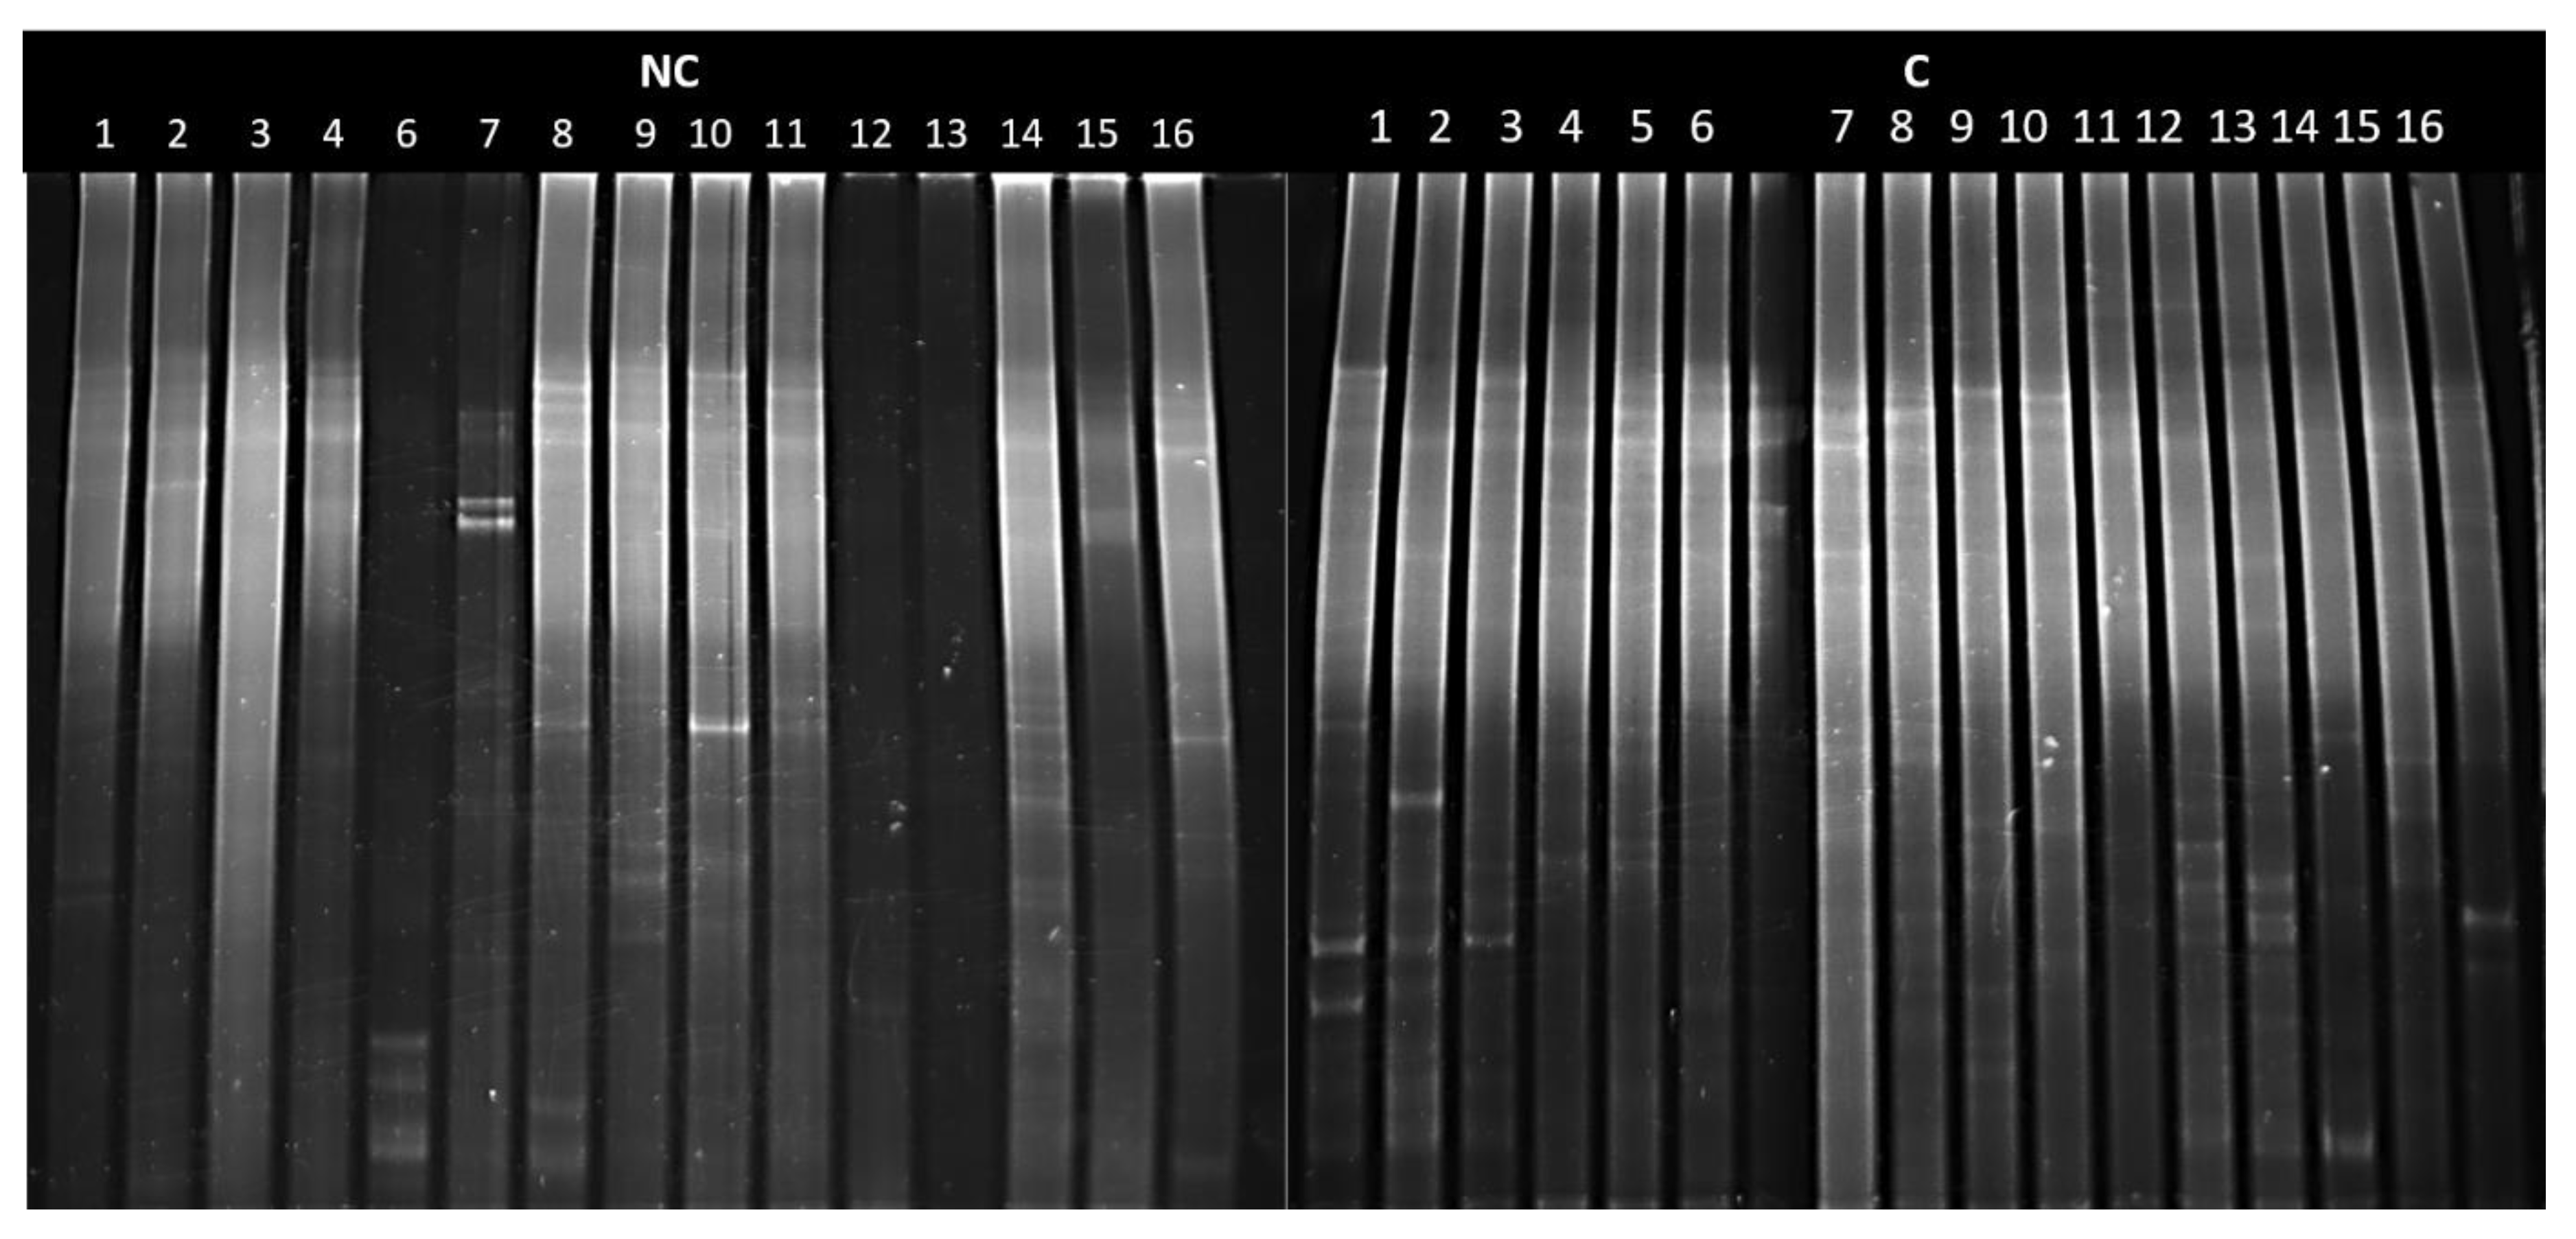
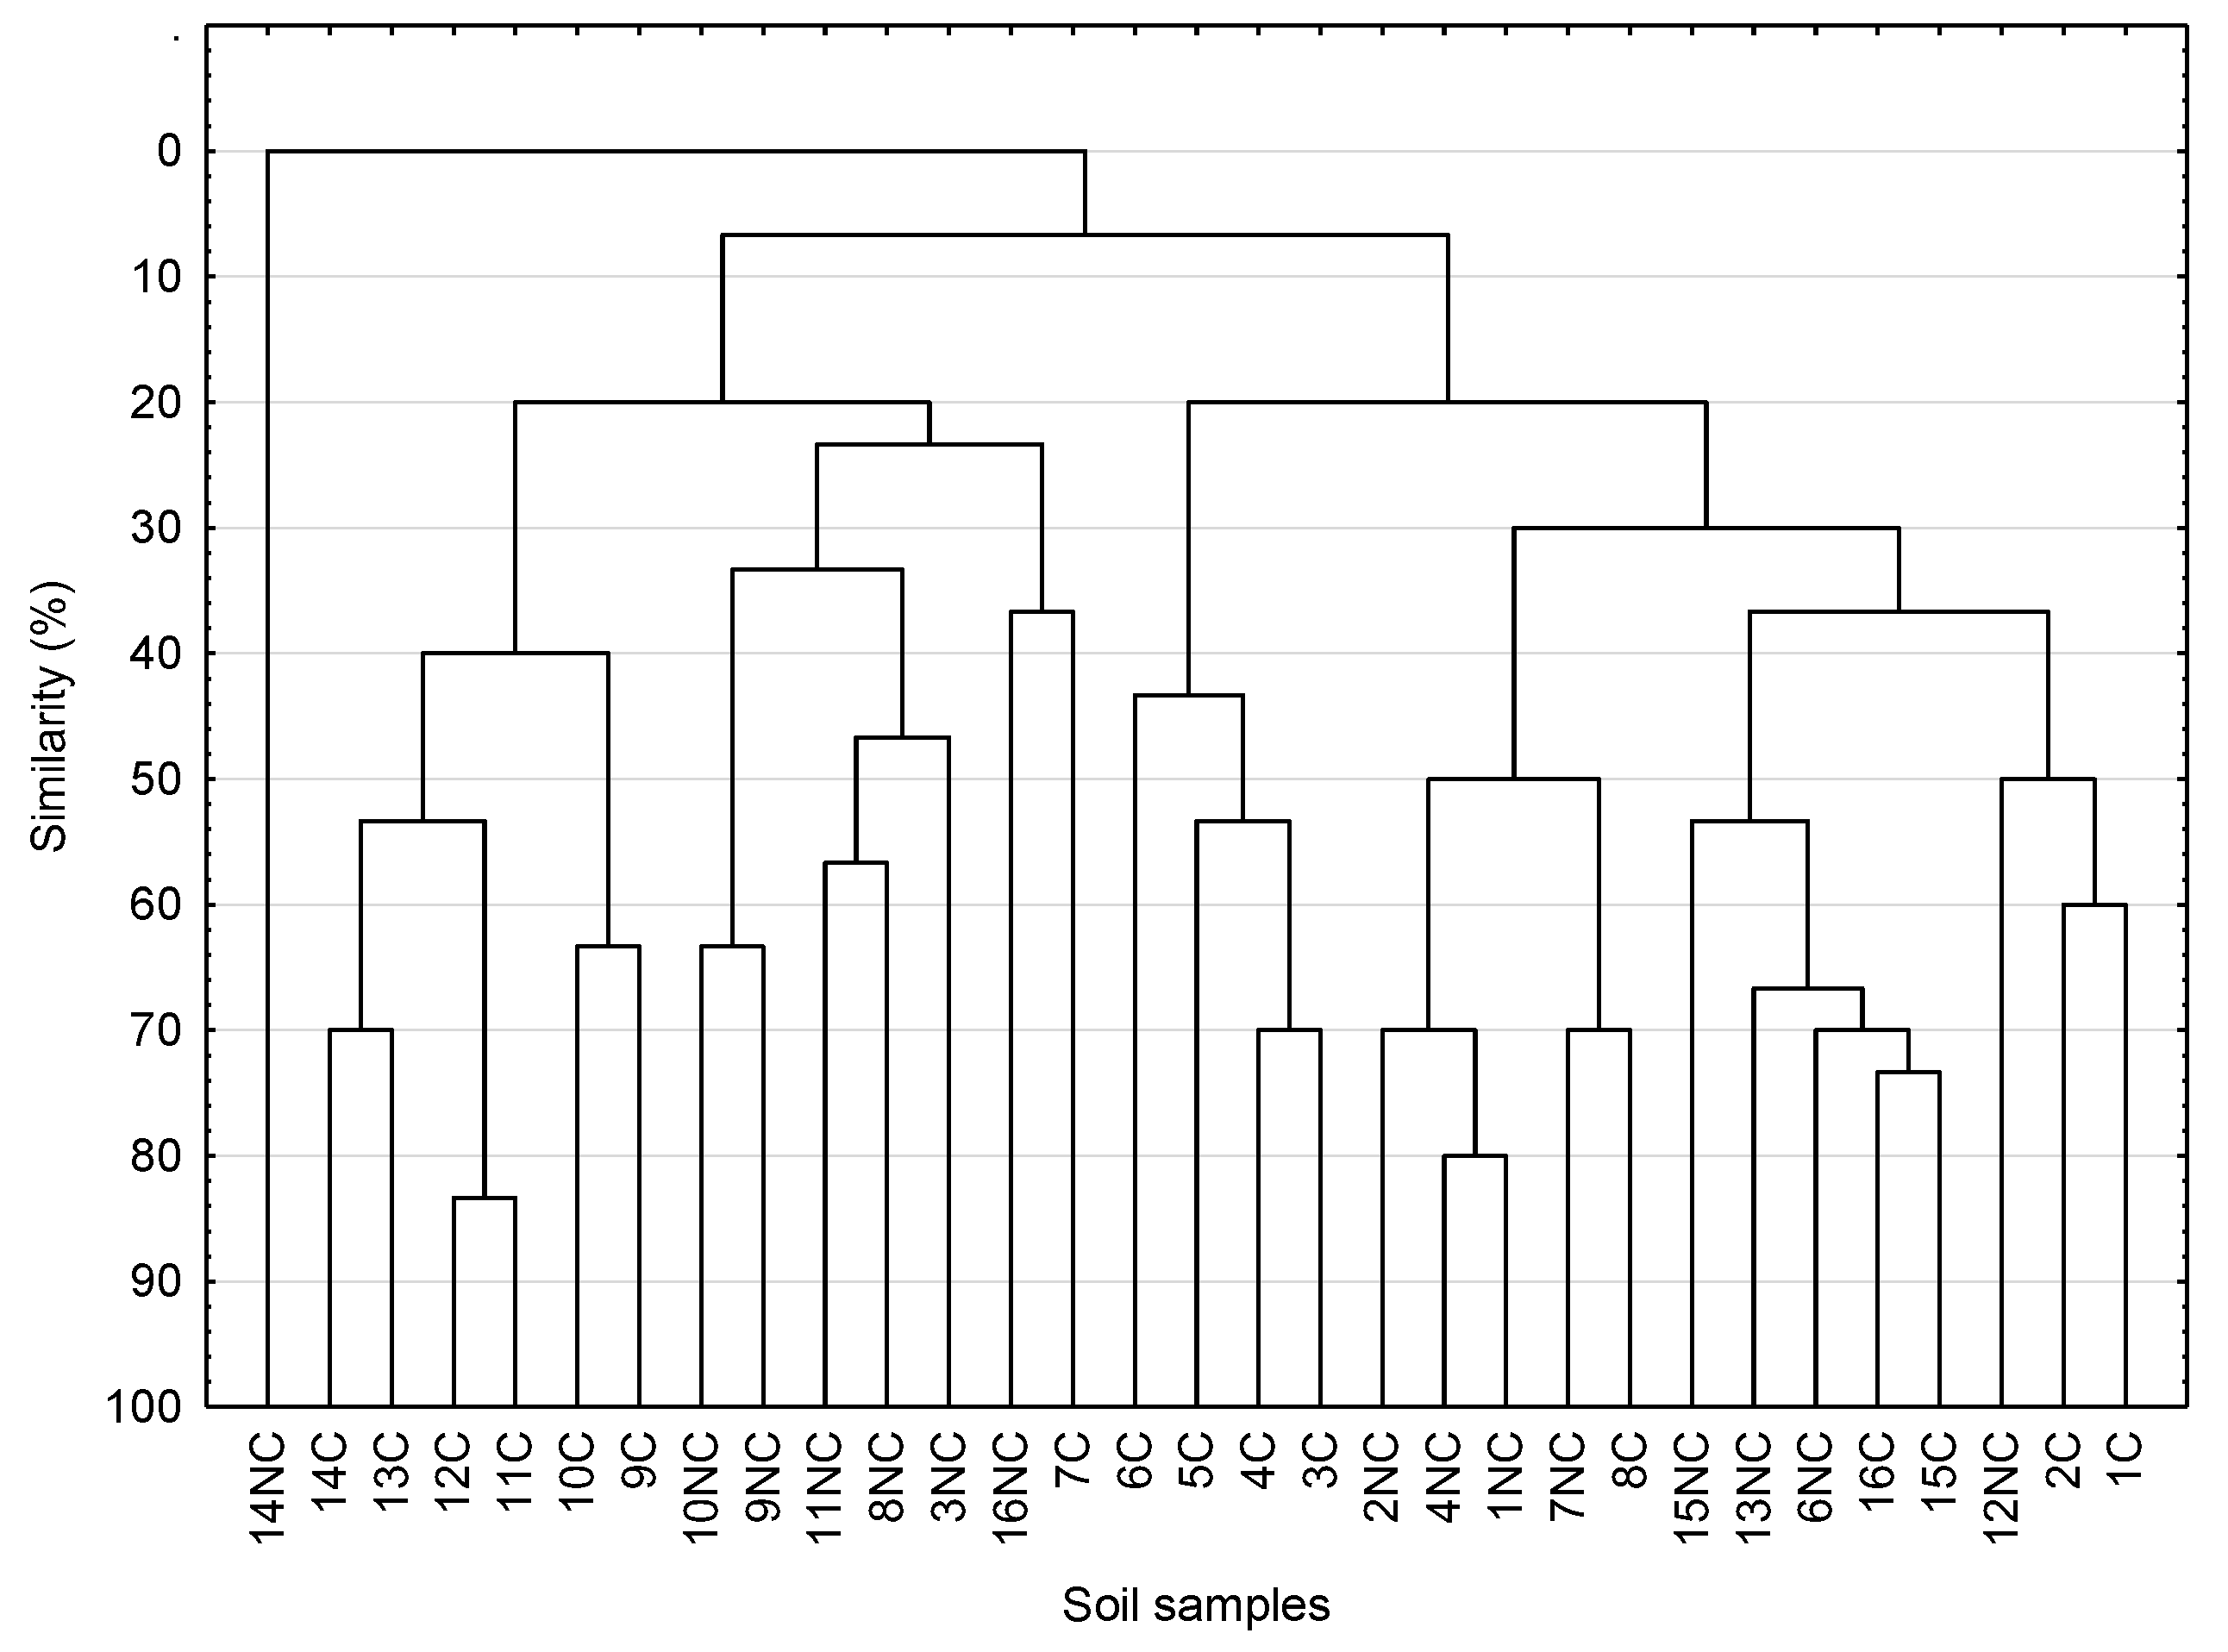
3.6. DGGE analysis of Actinobacteria in Arable and Control Soils with Biodiversity Indices

The analysis of DGGE profiles evidenced differences in the structure of the dominant Actinobacteria phylotypes (Table 4, Figure A4).
In the tested soil samples (NC and C), a total of 54 dominant OTUs were found and the DGGE profiles indicated that the actinobacterial diversity in the studied soils depended both on soil genesis and on the land use. A similar number of OTUs was noted in the NC soil samples in comparison to the C soil samples, which generally supported the NGS findings. In other words, there were no significant changes in the number of dominant Actinobacteria OTUs in soil samples subjected to agrotechnical treatment compared to the non-cultivated (control) soils.
Analysis of variance for the effect of two factors (soil genesis, mode of land use) on the number of actinobacterial families and genera is presented in Table A2 and Table A3, respectively. It has been shown that the influence of these factors is not unambiguous and directly depends on the families and genera of Actinobacteria. The number of representatives of the Nocardioidaceae, Microbacteriaceae, and Micrococcaceae families were significantly influenced by both the soil genesis and the land use mode, while the numbers of other families (Acidimicrobiaceae, Micromonosporaceae, Gaiellaceae) were not significantly affected by any of these factors (Table A2). In the case of the tested actinobacterial genera (Table A3), a significant impact of soil use (6 genera) rather than soil genesis (4 genera) was observed. However, neither of the two factors influenced the abundance of the Gailella genus (Table A3).
The total biodiversity analysis (Table 5) of the dominant phylotypes for individual DGGE pathways assessed with the Shannon-Weaver index showed greater biodiversity of Actinobacteria phylotypes in the non-cultivated soils (H’NC = 9.34) relative to the cultivated soils (H’C = 8.77).
Nevertheless, the Simpson diversity index (D) in C soils calculated for all DGGE profiles amounted to 0.27 and was slightly higher in the NC variant (0.34); this may have been caused by the fact that, with the similar number of OTUs in the NC soils, the scattering of Actinobacteria species in relation to the C soils was smaller.
The Simpson index of dominance (1/D) calculated for all DGGE patterns describing the ‘abundance-weighted true diversity’ of Actinobacteria species in the C soils amounted to 3.35 and reached a level of 2.90 in NC. Consequently, there were greater numbers of clearly dominant Actinobacteria communities in the C soils, compared to the control soils, which exhibited lower numbers of abundant phylotypes. According to the Sorenson coefficient (0.133) calculated based on the DGGE profiles for the tested C and NC samples, these communities do not overlap considerably or exhibit similarity.
In general, these biodiversity indices values differ from those calculated from NGS (Table 3), probably due to the so-called sequencing depth, which shows much more detailed biodiversity than DGGE showing the main and dominant taxons. Nevertheless, the general trend was similar in both methods, and higher diversity indices were noted in the NC samples and lower values were recorded in the C soils.

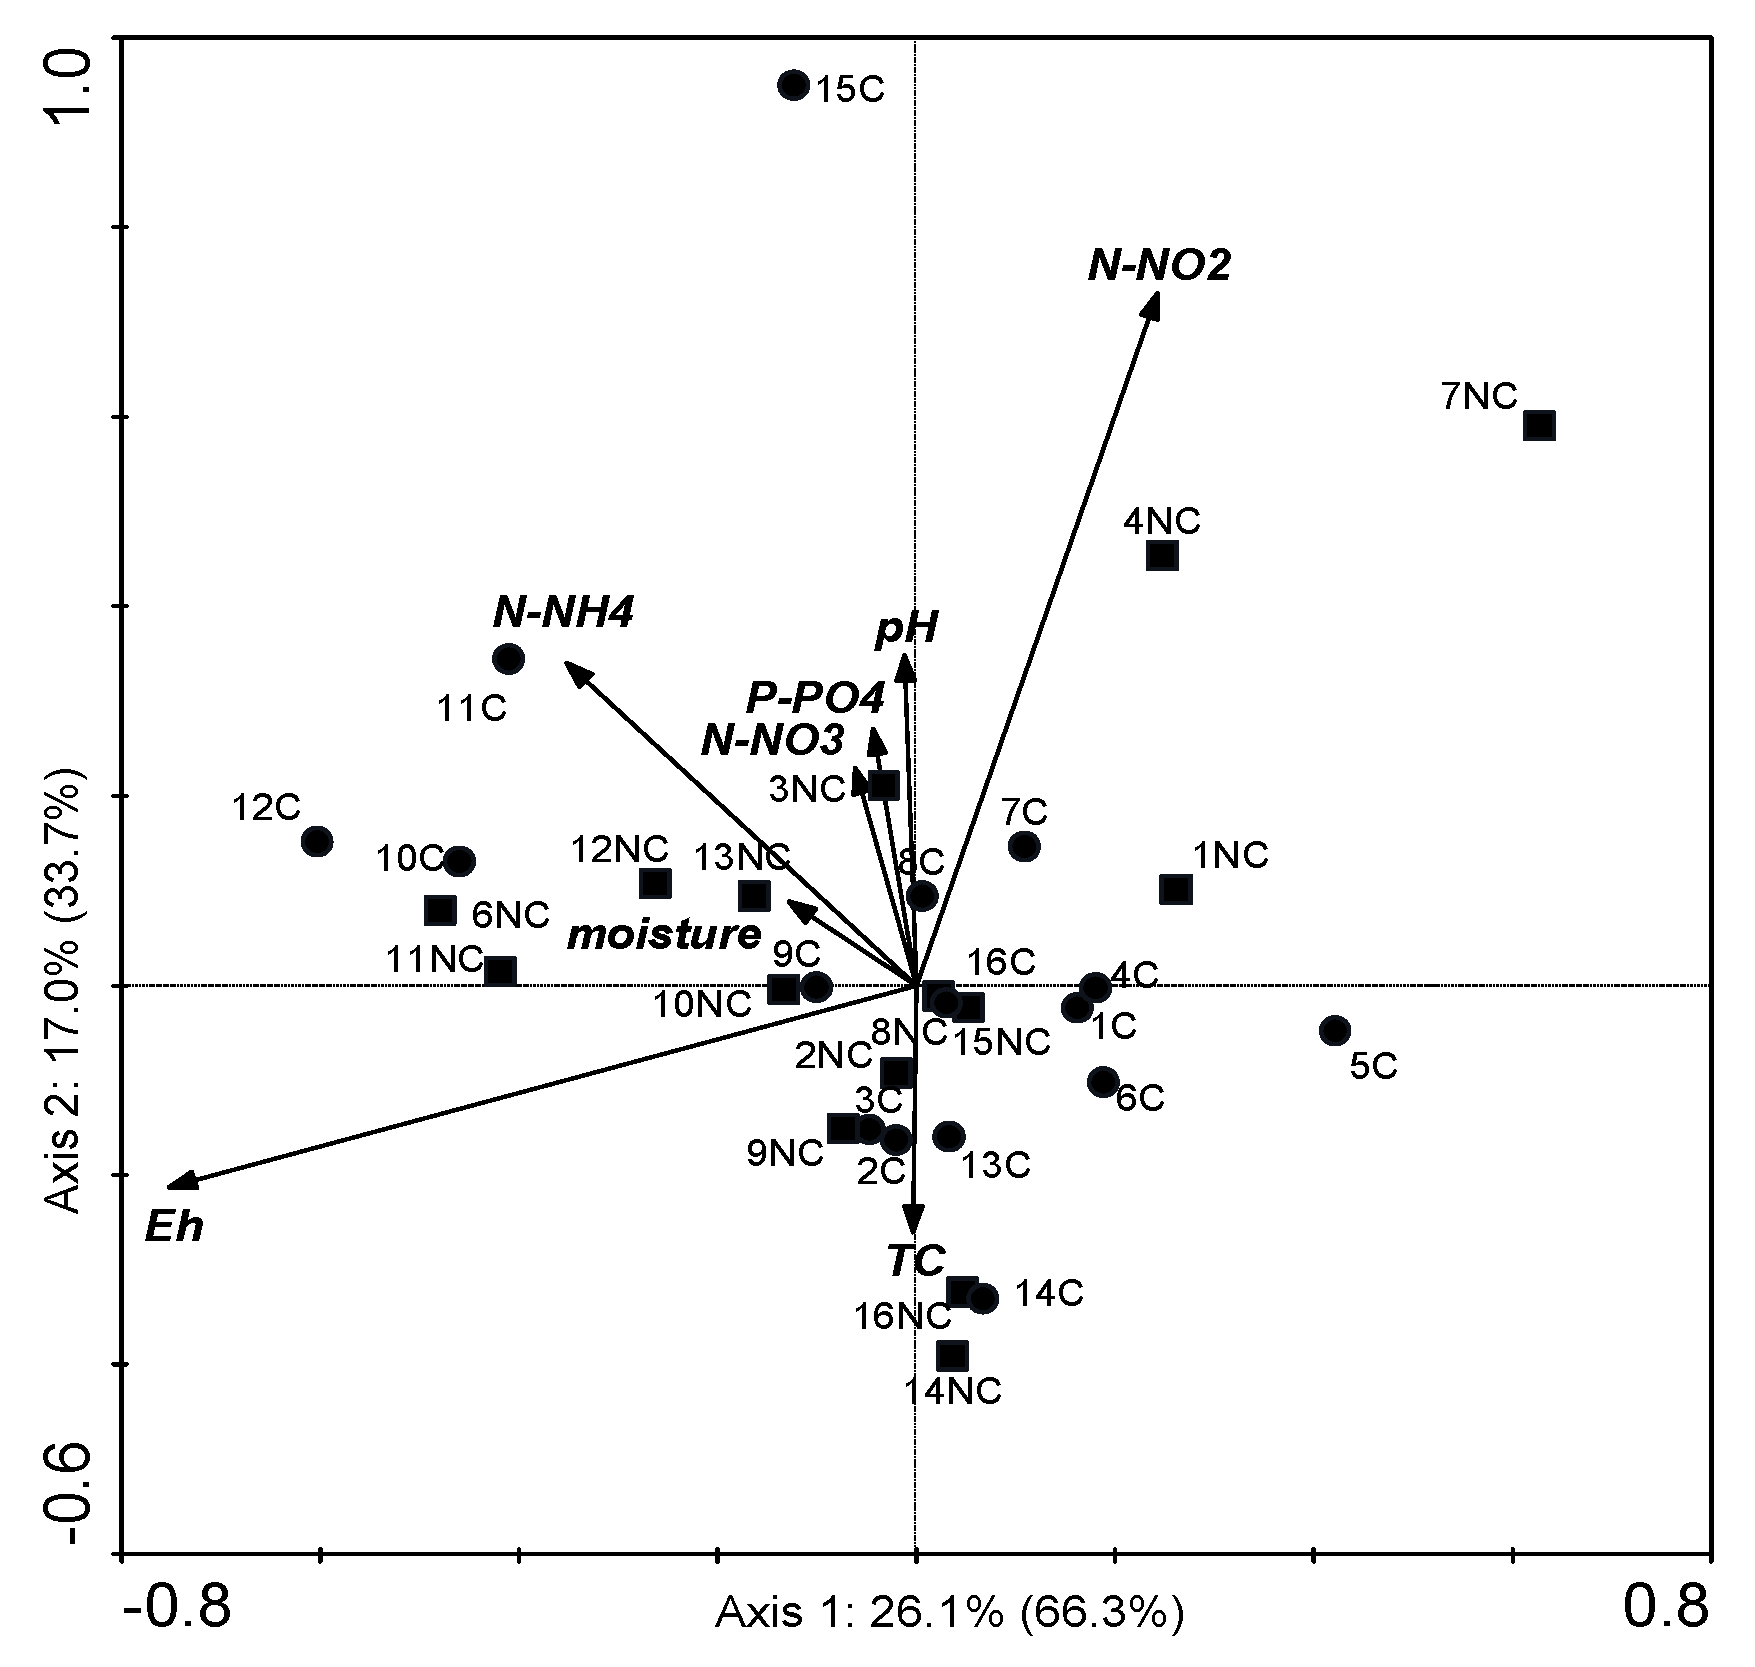
3.7. Canonical Correspondence Analysis for the POSITIONs and Chemical Factors

The canonical correspondence analysis (CCA) demonstrated that Eh and TC were the main statistically significant factors (p < 0.05) influencing the diversity of Actinobacteria in the analysed soils (Figure 6). The first axis explains 26.1% of the sample variability and the second axis explains 17.0%.
It is possible to assume that Actinobacteria in the NC soils displayed a greater affinity for each other and were clearly influenced by Eh, whereas the diversity of Actinobacteria in the C soils was mostly influenced by the carbon content. Additionally, in most of the NC soils, the pH and nitrogen content, in particular its two forms: N–NH4 and N–NO2, had an impact on the diversification of Actinobacteria. In turn, N–NO3 seemed not to exert a significant effect on the Actinobacteria population in the studied soils. Similarly, soil moisture did not influence clearly the differentiation of the dominant Actinobacteria phylotypes in both C and NC soils.

4. Discussion

The fact that soils under systematic and long-term cultivation have different chemical properties than uncultivated ones treated as wastelands (without any human intervention) has been known and documented for a long time [20,28,32,33,34,35,36,37,38,39,40,41]. Usually, a decrease in pH to acidic conditions and a drop of TC in C soils in relation to NC sites have been confirmed [21,28,40,42]. Changes in the chemical parameters in the soils of the Lublin region analysed in the current study have already been discussed before [18,19,21]. Here, we assumed that not only the land use but also the soil formation process (soil genesis, Table A1) had an influence on chemical soil differentiation. Besides pH and TC changes, also variations in the biogenic forms of nitrogen and phosphorus were revealed in the autogenic, hydrogenic, and lithogenic soils (Table A1, Table 2). Nitrate nitrogen dominated in the C lithogenic soils, followed by the autogenic soils. In turn, the highest concentrations of phosphates were detected in the C autogenic soils whilst their content in the hydrogenic and lithogenic soils was similar. Differences in the concentrations of biogenic elements and other chemical features have a significant impact on the biodiversity of bacteria, including Actinobacteria populations. It should be emphasised that no similar analyses of an Actinobacteria community in C soils of Poland and any other countries have been performed so far. Therefore, the present results provide the first insight into the Actinobacteria community structure in C soils versus NC. Besides the land use, soil origin and soil chemistry appeared to be statistically significant determinants of the Actinobacteria community structure. Several studies performed earlier revealed a close interaction between soil properties and microbial biodiversity [20,43], nevertheless, the driving forces that have an indirect effect on microbial community structures are far from being clear [43], possibly due to the heterogeneity of the soil environment.
Autogenic soils formed on loess material are the most-widely represented soils in Poland covering c.a. 85% of Poland’s territory, hence the highest representativeness of these soil types in our soil collection (9 units of the 16 investigated ones, Table 1). Hydrogenic soils formed under the influence of stagnant water are sub-dominants and cover c.a. 13% of the territory of Poland. The smallest group of Polish soils comprises lithogenic soils formed from limestone and occupying about 2% of Poland’s area. Our previous studies demonstrated that the autogenic group of soils were characterized by the highest microbial biodiversity expressed as the number of OTUs in the case of Potential Nitrogen-Fixing bacteria [18], Bacteroidetes and Flavobacterium as the dominant genus [19], and Proteobacteria with dominance of the Betaproteobacteria class [20]. Metagenomic analyses performed on the NC and C soils of the Lublin region evidenced that Proteobacteria, Bacteroidetes, Actinobacteria, Acidobacteria, and Firmicutes were dominant phyla in the general bacterial structure [18,19,20], followed by Elusimicrobia, Chlorobi, Chloroflexi, Gemmatimonadetes, Planctomycetes, Spirochaeta, and Verrucomicrobia [18]. The phylum Bacteroidetes had the second largest number of OTUs in the range from 101 to 316 OTUs for the microbiome of the NC soils and from 63 to 259 OTUs for the C soils [19].Furthermore, irrespective of the soil classification system (genesis and orders), it was noted that the numbers of Bacteroidetes were significantly reduced in C soils as a presumable effect of long-term soil cultivation [19]. Therefore, we recommended this phylum as a sensitive biological indicator of agricultural soil use [19]. A similar bacterial structure as that presented in the current study was found by Wang et al. [17] in Chinese soils under tobacco cultivation. They also reported that Proteobacteria was the most abundant phylum, whereas Actinobacteria were presented as sub-dominants. Generally, in the studied soil sets (NC and C), the bioinformatic tests identified 118 families and 305 genera [20]. Among them, 10 families and eight genera were recommended as sensitive indicators of soil fatigue: Sphingomonadaceae>Chitinophagaceae>Flavobacteriaceae>Oxalobacteraceae>Acetobacteraceae>Myxococcaceae>Comamonadaceae>Pseudomonadaceae>Burkholderiaceae>Rhodanobacteraceae; and Pelomonas>Ramlibacter>Flavobacterium>Rhizobacter>Steroidobacter>Cellvibrio>Halliangium>Pseudomonas [20]. Their sensitivity was confirmed by a decrease in the number of OTUs in the C soils, in comparison to the NC sites. We also indicated that, besides agricultural land use, another factor—the soil genesis (origin) is important in the aspect of preference for colonization of niches by soil bacteria [20]. As described above, Actinobacteria most frequently inhabited autogenic soils followed by the hydrogenic and lithogenic group (Figure 2). This is a beneficial trend, as autogenic soils predominate in Poland and their high biodiversity is most desirable. As presented in the current study, also hydrogenic and lithogenic soils could be considered as an optimal ecological niche for colonization by the Actinobacteria population, because the fluctuations between the numbers of OTUs were generally negligible. Yet, an opposite trend was found in respect to the Potential Nitrogen Fixing (PNF) group of bacteria inhabiting NC and C soils of Lubelskie voivodeship [18], as their abundance was directly connected with the soil formation process and most of them inhabited the autogenic group, whereas the lowest number of PNF bacteria was evidenced in the lithogenic soils [18]. Moreover, our former results demonstrated that Polish C soils are decidedly dominated by PNF bacteria belonging to the β- Proteobacteria class and the Burkholderia genus, whereas bacteria of α-Proteobacteria class and Devosia genus were identified as subdominants [18].
As demonstrated earlier [21], land-use practices seemed to be important factors influencing biodiversity, because the DGGE analysis determined the clustering into groups more than the soil type. In the current study, we wanted to verify whether Actinobacteria are also dependent on the land-use practice; hence, the DGGE technique was applied parallel to the NGS analysis. However, in contrast to the total results of biodiversity in Lubelskie soils when the DGGE profiles based on the diversity of 16S rRNA bacterial gene clearly demonstrated two separate clusters for C and NC soils [21], the DGGE results in the case of Actinobacteria were not as clear (Figure A4).
The NC soils were characterized by higher biodiversity of Actinobacteria than the C soils, which was confirmed by the values of the Shannon-Wiener coefficient (H’) and the Simpson index of dominance (1/D). This is in agreement with our previous observations for the same soils in respect to entire bacterial communities [21], where the calculated Simpson index of dominance suggested that C soils contained more specifically dominant communities (18.9–21.7) compared to NC soils, where the phylotype richness was lower (18.8–20.4).Carbonetto et al. [15] observed that Actinobacteria were more abundant in NC than C soils.
The metagenomic analyses allowed recognition of the Actinobacteria structure in the C and NC soils at the level of dominant families (Figure 3) and genera (Figure 4). The culture-independent results have proved that Streptomyces is not always the dominant genus in the soil environment. In the case of Lubelskie voivodeship soils, the actinobacterial genera Nocardioides, Marmoricola, and Aeromicrobium as well as the family Nocardioidaceae, which were found as dominant in the alpine grasslands ecosystem, clearly dominated [2]. Wang et al. [17] observed an increase in the abundance of Nocardioides and Agromyces in healthy soils, which proves that they are beneficial microorganisms. Consequently, the abundance of Nocardioides may suggest that the studied Lubelskie soils can be classified as healthy. It should be emphasized that the ability to degrade toxic environmental pollutants and chemicals as well as the involvement in the turnover of the organic matter cycle are important features of Nocardioides species [44]. Some species are specialized in utilization of such dangerous compounds as chloroaromatics, dibenzofurans [45], and herbicides, i.e., atrazine [46]. Members of the family Nocardioidaceae inhabit varied environments: soils, polluted soils, waters, plants, deserts, oligotrophic habitats, wastewater, etc. [47]. Representatives of Nocardioides are chemoorganotrophic, catalase-positive, mesophilic bacteria with respiratory metabolism [44]. Another representative of Nocardioidaceae in the Lubelskie soils was the genus Marmoricola. The presence of Marmoricola in soils is preferable because most of the species utilize a sole source of carbon (i.e., glucose, D-mannitol) and they are classified as catalase-positive and oxidase-negative organisms [44]. An optimal pH for Marmoricola growth is neutrophilic or slightly alkaliphilic, oscillating between 5.1 and 12.1 [44]. In the current study, despite the fact that pH was rather acidic and oscillated from 5.12 to 6.57, depending on the land use (NC, C) and soil genesis (Table 1), it was in the range tolerated by this genus, which may explain its large presence in soils. Besides soils, Marmoricola was detected in volcanic ash [48] and marine sediments [49]. Aeromicrobium, i.e., the third dominant genus of Nocardioidaceae identified in the Lubelskie soils, most frequently colonized hydrogenic and lithogenic soils. Cui et al. [50] and Siddiqi et al. [51] isolated Aeromicrobium from gingseng field soil in South Korea. The genus comprises Gram-positive, aerobic, non-sporulating, non-mycelial, catalase-positive, and oxidase-negative Actinobacteria, which can produce the macrolide antibiotic erythromycin [50,51,52]. Besides soils, strains of the genus were also isolated from deserts [52], marine samples [53], air [54], and Pu’er tea [55].
Ilumatobacter belonging to the family Acidimicrobiaceae identified in our study displayed sensitivity to soil genesis in respect to the hydrogenic and lithogenic soils. In the literature database, Ilumatobacter is described as a mesophilic, neutrophilic, aerobic, Gram-positive bacterium having enzymes required for biosynthesis of vitamins (K, B6) [56]. Similarly, Agromyces display beneficial properties as well, as they can improve soil nutrient availability, promote plant growth [57], play an important role in xylan degradation by production of xylanase [58], and are applicable for production of agrochemicals and pharmaceuticals [59]. Moreover, Agromyces representatives showed positive catalase and oxidase reactions as well as antiviral and antitumor activities [59]. In our study, Agromyces and Microbacterium seemed to be sensitive to the agricultural land use (decrease in the OTU number in the C soils and an increase in the NC variant) and strongly dependent on the soil genesis (preference for colonization of the NC lithogenic and autogenic soils as an optimal niche). There are more beneficial properties of Microbacteria, as they have recently been found to live as endosymbionts in marine sponges [12] and to exhibit a fast phenol degradation rate in soils at pH 3.5–8.0, with optimum efficiency at pH 7.0 [60]. Some microbacterial strains display important biochemical features that make them suitable to be used in the chemical industry, i.e., they are able to synthesize several enzymes, produce exopolysaccharides, and have tetracycline resistance genes [59]. In the Actinobacteria structure of the Lublin soils, the Gaiella genus was detected as well (Figure 4). The ecological functions of Gailella are not well recognized. It is known that Gaiella are Gram-negative, aerobic, catalase and oxidase positive bacteria, sensitive to soil pH [61]. An optimal pH for Gaiella growth is in the range of 6.5–7.5, but they do not grow at pH 5.0 and pH 9.0 [61]. Thus, given the pH range in our soils, it can be concluded that they did not constitute an optimal environment for the growth and presence of the bacteria, which explains such low abundance of Gaiella in the Actinobacteria structure.
Euzebya and Terrabacter were noted to be specific taxons for the NC soils, whereas Actinocorallia, Jonesia, Mycobacterium, and Patulibacter were detected in the C soils only (Figure 5). It is worth to emphasize that the presence of Euzebya is associated with clean and healthy soils [62,63]; hence, its presence was detected in the NC (considered as healthy, non-degraded) soils. Terrabacter is an ecologically important actinobacterial genus in the soil environment with an ability to carbonate minerals and bio-mineralize heavy metals [64,65].The presence of Jonesia was earlier reported in agricultural soils [64], similar to Mycobacterium [66,67] and confirmed in our study as a characteristic taxon for the C soils. Actinocorallia is known as a rare genus of Actinobacteria associated mainly with endophytic environments [68,69]; thus, its presence in the C soils is a little surprising, in contrast to Patulibacter, which was isolated from soils earlier [70].
In this study, we also attempted to determine the relationship between chemical parameters and Actinobacteria abundance in C and NC soils, and found that two of them, i.e., Eh and TC, seemed to be the most important factors. In turn, the influence of other factors was not as significant and depended on the land use (Figure 6). In many papers, the effect exerted by pH on the Actinobacteria structure was emphasized [12,71,72,73]. As suggested by Anadan et al. [12], Actinobacteria are widely distributed in soil with high sensitivity to acid and low pH. Generally, soils with near neutral pH usually exhibit higher bacterial diversity and number of bacteria than acidic ones [28,71,73]. Moreover, a decrease in soil pH toward acidic conditions is responsible for a decrease in the available carbon content [74] and is thus regarded as an environmental filter for selecting specific microbial groups and regulating soil microbial composition [72]. Liu et al. [2] determined environmental factors influencing Actinobacteria in alpine grasslands. They found significance (p < 0.05) of the following parameters: soil moisture, pH, temperature, total and available nitrogen, and organic carbon. In our study, the slight effect exerted by pH, N–NH4, and N–NO2 was only noted for Actinobacteria inhabiting the NC soils, whilst the effect of moisture was not statistically confirmed.

5. Conclusions

The culture-independent analysis presented in this study provides the first insight into the Actinobacteria community structure in Polish C versus NC soils. Actinobacteria have been shown to be represented in the soils abundantly, occupying the third place in the bacterial structure at the phylum level.
Generally, there was greater abundance of Actinobacteria in the NC soils relative to the C soils. Despite this fact, in respect to our hypothesis, it has been evidenced that the Actinobacteria structure is dependent both on the soil genesis and on the mode of land use; however, the effect of these factors directly depends on the particular family and genus.
However, some actinobacterial families (Nocardioidaceae, Microbacteriaceae, Acidomicrobiaceae, Micromonosporaceae) and genera (Agromyces, Microbacterium, Nocardioides, Marmoricola, Aeromicrobium, and Ilumatobacter) seemed to be sensitive to agricultural treatment and displayed a decrease in abundance in the C soils when compared to NC.
Resistance to cultivation was demonstrated by only one family: Micrococaceae as their number of OTUs in the autogenic and hydrogenic soils was higher in the NC variant than in the C soils. Due to the beneficial functions fulfilled by Actinobacteria in the soil environments, their abundance may indicate soil health.
Nocardioides, Marmoricola, and Illumatobacter were the dominant taxons both in the NC and C soils, whereas representatives of the two actinobacterial genera: Euzebya and Terrabacter were specific and connected with the NC sites only. Furthermore, four genera were identified as specific for the C soils: Actinocorollia, Mycobaterium, Patulibacter, and Jonesia.
Our results also highlight that Eh and TC were the main statistically significant factors affecting Actinobacteria diversity, wherein Actinobacteria from the NC soils displayed a greater affinity for each other and were clearly influenced by Eh, whilst TC mostly influenced the Actinobacteria population in the C soils.
Is it possible to assume that we have demonstrated the existence of strong conservatism in the Actinobacteria community, which does not allow large changes in their quantitative and qualitative composition under the influence of chemical parameters, except for the effect exerted by Eh and TC depending on the land use.

Author Contributions

Conceptualization, A.W. and M.B.; methodology, D.G., A.K., A.B. and U.Z.; software, D.G., D.I., A.B. and U.Z.; formal analysis, D.G., A.K., D.I. and U.Z.; investigation, A.W., D.G., U.Z., A.K. and A.B.; writing—original draft preparation, A.W.; writing—review and editing, M.B. and U.Z.; visualization, A.K. and A.W.; supervision, M.B.; funding acquisition, A.W.

Funding

This project was partly funded by the National Science Centre (Poland), grant no. DEC-2013/09/D/NZ9/02482.

Acknowledgments

The authors are grateful for Marek Pazur from the Institute of Agrophysics Polish Academy of Sciences in Lublin (Poland) for his participation in the field trips and help in precise location of places for soil sampling, according Bank of Soil Samples localization.

Conflicts of Interest

The authors declare no conflict of interest.

Appendix A

Table A1. Averaged values of chemical parameters in the three genetic types of soils (C-cultivated, NC- control, non-cultivated soils).
FactorAutogenicHydrogenicLithogenic
CNCCNCCNC
Moisture a11.7613.207.6110.7211.8315.90
pH5.656.145.125.985.586.57
Eh b486.70445.43547.55536.50496.05469.98
TC a1.172.461.442.451.113.69
N-NO3 c19.836.5511.317.0255.0711.97
N-NO2 c0.090.390.090.110.090.11
N-NH4 c0.110.530.141.500.131.83
P-PO4 c7.413.253.381.463.930.80
a—%; b—mV; c—mg/kg.
Table A2. Effect of soil genesis and mode of land use on the abundance of the most representative families of Actinobacteria. The effects are represented as p-values of two-way ANOVA. Bolded values indicate significant effects.
FactorSoil GenesisLand Use
Family
Nocardioidaceae0.0050.000
Microbacteriaceae0.0010.000
Acidimicrobiaceae0.5480.051
Micromonosporaceae0.1480.053
Micrococcaceae0.0000.024
Gaiellaceae0.5490.445
Table A3. Effect of soil genesis and mode of land use on the abundance of the most representative genera of Actinobacteria. The effects are represented as p-values of two-way ANOVA. Bolded values indicate significant effects.
FactorSoil GenesisLand Use
Genus
Nocardioides0.0050.000
Marmoricola0.0050.000
Aeromicrobium0.0050.000
Microbacterium0.0600.000
Agromyces0.0600.000
Ilumatobacter0.0040.005
Gaiella0.5480.445
Figure A1. Denaturing gradient gel electrophoresis (DGGE) banding patterns of 16S rRNA gene fragments generated from Actinobacterial DNA amplified by nested PCR isolated from the studied soil samples. NC—non cultivated soils, C—cultivated soils.
Agronomy 09 00598 g0a1
Figure A2. Rarefaction curves for the observed OTUs in the C and NC Lublin Region soils at a genetic distance of 0.01.
Agronomy 09 00598 g0a2
Figure A3. Differences in dominant actinobacterial taxons at the genus level between the NC and C soils.
Agronomy 09 00598 g0a3
Figure A4. Cluster analysis by UPGMA similarity of Actinobacteria DGGE banding patterns between soil samples (NC—non-cultivated, C—cultivated). The number before C and NC indicates the soil sample number.
Agronomy 09 00598 g0a4

References

  1. Alvarez, A.; Saez, J.M.; Costa, J.S.D.; Colin, V.L.; Fuentes, M.S.; Cuozzo, C.A.; Benimeli, C.S.; Polti, M.A.; Amoroso, M.J. Actinobacteria: Current research and perspectives for bioremediation of pesticides and heavy metals. Chemosphere 2017, 166, 41–62. [Google Scholar] [CrossRef] [PubMed]
  2. Liu, X.; Cong, J.; Lu, H.; Xue, Y.; Wang, X.; Li, D.; Zhang, Y. Community structure and elevational distribution pattern of soil Actinobacteria in alpine grasslands. Acta Ecol. Sin. 2017, 37, 213–218. [Google Scholar] [CrossRef]
  3. Elbendary, A.A.; Hessain, A.M.; El-Hariri, M.D.; Seida, A.A.; Moussa, I.M.; Mubarak, A.S.; Kabli, S.A.; Hemeg, H.A.; Jakee, J.K.E. Isolation of antimicrobial producing Actinobacteria from soil samples. Saudi J. Biol. Sci. 2018, 25, 44–46. [Google Scholar] [CrossRef] [PubMed]
  4. Nübel, U.; Engelen, B.; Felske, A.; Snaidr, J.; Wieshuber, A.; Amman, R.I.; Ludwig, W.; Backhaus, H. Sequence heterogeneities of genes encoding 16S rRNAs in Paenibacillus polymyxa detected by temperature gradient gel electrophoresis. J. Bacteriol. 1996, 178, 5636–5643. [Google Scholar] [CrossRef] [PubMed]
  5. Heuer, H.; Krsek, M.; Baker, P.; Smalla, K.; Wellington, E.M.H. Analysis of Actinomycete communities by specific amplification of genes encoding 16S rRNA and gel electrophoresis separation in denaturing gradients. Appl. Environ. Microbiol. 1997, 63, 3233–3241. [Google Scholar]
  6. Ma, T.; Wang, X.W.; Ruan, J.S.; Liu, N.; Huang, Y. Actinomycete flora in soil of differently degraded alpine grassland in Three River Source Area. Microbiology 2008, 35, 1879–1883. [Google Scholar]
  7. Hussain, E.I.; Jacob, J.H.; Shakhatreh, M.A.K.; Al-Razaq, M.A.A.; Juhmani, A.S.F.; Cornelison, C.T. Detection of antibiotic—Producing Actinobacteria in the sediment and water of Ma’in thermal sprongs (Jordan). GERMS 2018, 8, 191–198. [Google Scholar] [CrossRef]
  8. Rangseekaew, P.; Pathom-aree, W. Cave Actinobacteria as producers of bioactive metabolites. Front. Microbiol. 2019, 10, 387. [Google Scholar] [CrossRef]
  9. Assis, D.A.M.; Rezende, R.P.; Dias, J.C.T. Use of metagenomics and isolation of Actinobacteria in Brazil’s atlantic rainforest soil for antimicrobial prospecting. ISRN Biotech. 2014, 2014, 909601. [Google Scholar] [CrossRef]
  10. Van Dorst, J.M.; Hince, G.; Snape, I.; Ferrari, B.C. Novel culturing techniques select for heterotrophs and hydrocarbon degraders in a subantarctic soil. Sci. Rep. 2016, 6, 36724. [Google Scholar] [CrossRef]
  11. Adam, D.; Maciejewska, M.; Naome, A.; Martinet, L.; Coppieters, W.; Karim, L.; Baurain, D.; Rigali, S. Isolation, characterization and anitibacterial activity of hard-to-culture Actinobacteria from cave moonmilk deposits. Antibiotics 2018, 7, 28. [Google Scholar] [CrossRef] [PubMed]
  12. Anandan, R.; Dharumadurai, D.; Manogaran, P.M. An introduction to Actinobacteria. In Actinobacteria-Basics and Biotechnological Applications; Dhanasekaran, D., Jiang, Y., Eds.; InTech Open: London, UK, 2016; Volume 1, pp. 1–37. [Google Scholar]
  13. Polti, M.; Aparicio, J.D.; Benimeli, C.S.; Amoroso, M.J. Simultaneous bioremediation of Cr(VI) and lindane in soil by Actinobacteria. Int. Biodeter. Biodegr. 2014, 88, 48–55. [Google Scholar] [CrossRef]
  14. Manivasagan, P.; Venkatesan, J.; Sivakumar, K.; Kim, S.K. Marine actinobacterial metabolites: Current status and future perspectives. Microbiol. Res. 2013, 168, 311–332. [Google Scholar] [CrossRef] [PubMed]
  15. Carbonetto, B.; Rascovan, N.; Alvarez, N.; Mentaberry, A.; Vazquez, M.P. Structure, composition and metagenomic profile of soil microbiomes associated to agricultural land use and tillage systems in Argentine Pampas. PLoS ONE 2014, 9, e99949. [Google Scholar] [CrossRef] [PubMed]
  16. Ding, J.J.; Zhang, Y.G.; Deng, Y.; Cong, J.; Lu, H.; Sun, X.; Yang, C.Y.; Yuan, T.; Van Nostrand, J.D.; Li, D.Q.; et al. Integrated metagenomic and network analysis of soil microbial community of the forest timberline. Sci. Rep. 2015, 5, 7994. [Google Scholar] [CrossRef] [PubMed]
  17. Wang, R.; Zhang, H.; Sun, L.; Qi, G.; Chen, S.; Zhao, X. Microbial community composition is related to soil biological and chemical properties and bacterial wilt outbreak. Sci. Rep. 2017, 7, 343. [Google Scholar] [CrossRef]
  18. Wolińska, A.; Kuźniar, A.; Zielenkiewicz, U.; Banach, A.; Izak, D.; Stępniewska, Z.; Błaszczyk, M. Metagenomic analysis of some potential nitrogen-fixing bacteria in arable soils at different formation processes. Microb. Ecol. 2017, 73, 162–176. [Google Scholar] [CrossRef] [PubMed]
  19. Wolińska, A.; Kuźniar, A.; Zielenkiewicz, U.; Izak, D.; Szafranek-Nakonieczna, A.; Banach, A.; Błaszczyk, M. Bacteroidetes as a sensitive indicator of agricultural soil usage revealed by culture-independent approach. Appl. Soil Ecol. 2017, 119, 128–137. [Google Scholar] [CrossRef]
  20. Wolińska, A.; Kuźniar, A.; Zielenkiewicz, U.; Banach, A.; Błaszczyk, M. Indicators of arable soils fatigue—Bacterial families and genera: A metagenomic approach. Ecol. Ind. 2018, 93, 490–500. [Google Scholar] [CrossRef]
  21. Wolińska, A.; Górniak, D.; Zielenkiewicz, U.; Goryluk-Salmonowicz, A.; Kuźniar, A.; Stępniewska, Z.; Błaszczyk, M. Microbial biodiversity in arable soils is affected by agricultural practices. Int. Agrophys. 2017, 31, 259–271. [Google Scholar] [CrossRef] [Green Version]
  22. Cong, J.; Yang, Y.F.; Liu, X.D.; Lu, H.; Liu, X.; Zhou, J.Z.; Li, D.Q.; Yin, H.Q.; Ding, J.J.; Zhang, Y.G. Analyses of soil microbial community compositions and functional genes reveal potential consequences of natural forest succession. Sci. Rep. 2015, 5, 10007. [Google Scholar] [CrossRef] [PubMed] [Green Version]
  23. Davidson, E.A.; Janssens, I.A. Temperature sensitivity of soil carbon decomposition and feedbacks to climate change. Nature 2006, 440, 165–173. [Google Scholar] [CrossRef] [PubMed]
  24. Niu, J.; Zhou, X.Q.; Jang, N.; Wang, Y.F. Characteristics of soil microbial communities under dry and wet condition in Zoige alpine wetland. Acta Ecol. Sin. 2011, 31, 474–482. [Google Scholar]
  25. Liu, L.; Gundersen, P.; Zhang, T.; Mo, M. Effects of phosphorus addition on soil microbial biomass and community composition in three forest types in tropical China. Soil Biol. Biochem. 2012, 44, 31–38. [Google Scholar] [CrossRef]
  26. Sul, W.J.; Asuming-Brempong, S.; Wang, Q.; Tourlousse, D.M.; Penton, C.R.; Deng, Y.; Rodrigues, J.L.M.; Adiku, S.G.K.; Jones, J.W.; Zhou, J.Z.; et al. Tropical agricultural land management influences on soil microbial communities through its effect on soil organic carbon. Soil Biol. Biochem. 2013, 65, 33–38. [Google Scholar] [CrossRef] [Green Version]
  27. Liu, J.J.; Sui, Y.Y.; Yu, Z.H.; Shi, Y.; Chu, H.Y.; Jin, J.; Liu, X.B.; Wang, G.H. High throughput sequencing analysis of biogeographical distribution of bacterial communities in the black soils of northeast China. Soil Biol. Biochem. 2014, 70, 113–122. [Google Scholar] [CrossRef]
  28. Wolińska, A.; Szafranek-Nakonieczna, A.; Banach, A.; Błaszczyk, M.; Stępniewska, Z. The impact of agricultural soil usage on activity and abundance of ammonyfying bacteria in selected soils from Poland. Springer Plus 2016, 5, 565. [Google Scholar] [CrossRef]
  29. Ramirez, K.S.; Craine, J.M.; Fierer, N. Consistent effects of nitrogen amendments on soil microbial communities and processes across biomes. Glob. Chang. Biol. 2012, 18, 1918–1927. [Google Scholar] [CrossRef]
  30. Cong, J.; Liu, X.D.; Lu, H.; Xu, H.; Li, Y.D.; Deng, Y.; Li, D.Q.; Zhang, Y.D. Available nitrogen is the key factor influencing soil microbial functional gene diversity in tropical rainforest. BMC Microbiol. 2015, 15, 167. [Google Scholar] [CrossRef] [PubMed]
  31. Chemical and Agricultural Soil Analyses. Soil Sampling; PN-R-04031; PKN: Warsaw, Poland, 1997. (In Polish)
  32. Tomczyk-Żak, K.; Kaczanowski, S.; Drewniak, Ł.; Dmoch, Ł.; Skłodowska, A.; Zielenkiewicz, U. Bacteria diversity and arsenic mobilization in rock biofilm from an ancient gold and arsenic mice. Sci. Total Environ. 2013, 461, 330–340. [Google Scholar] [CrossRef]
  33. Schloss, P.D.; Westcott, S.I.; Ryabin, T.; Hall, J.R.; Hartmann, M.; Hollister, E.B.; Lesniewski, R.A.; Oakley, B.B.; Parks, D.H.; Robinson, C.J.; et al. Introducing mothur: Open-source, platform independent, community-supported software for describing and comparing microbial communities. Appl. Environ. Microbiol. 2009, 75, 7537–7541. [Google Scholar] [CrossRef] [PubMed]
  34. Quast, C.; Pruesse, E.; Yilmaz, P.; Gerken, J.; Schweer, T.; Yarza, P.; Peplies, J.; Glöckner, F.O. The SILVA ribosomal RNA gene database project: Improved data processing and web-based tools. Nucleic Acids Res. 2013, 41, 590–596. [Google Scholar] [CrossRef] [PubMed]
  35. Edgar, R.C.; Haas, B.J.; Clemente, J.C.; Quinee, C.; Knight, R. UCHIME improves sensitivity and speed of chimera detection. Bioinformatics 2011, 27, 2194–2200. [Google Scholar] [CrossRef] [PubMed] [Green Version]
  36. Crump, B.C.; Hobbie, J.E. Synchrony and seasonality in bacterioplankton communities of two temperate rivers. Limnol. Ocean 2005, 50, 1718–1729. [Google Scholar] [CrossRef]
  37. Ter Braak, C.J.F.; Šmilauer, P. CANOCO Reference Manual and CanoDraw for Windows User’s Guide: Software for Canonical Community Ordination (Version 4.5); Microcomputer Power: Ithaca, NY, USA, 2002. [Google Scholar]
  38. Vivas, A.; Moreno, B.; Garcia-Rodriguez, S.; Benitez, E. Assessing the impact of composting and vermicomposting on bacterial community size and structure, and microbial functional diversity of an olive-mill waste. Biores. Technol. 2009, 100, 1319–1326. [Google Scholar] [CrossRef]
  39. Jia, G.M.; Zhang, P.D.; Wang, G.; Cao, J.; Hang, J.C.; Huang, Y.P. Relationship between microbial community and soil properties during natural succession of abandoned agricultural land. Pedosphere 2010, 20, 352–360. [Google Scholar] [CrossRef]
  40. Swędrzyńska, D.; Małecka, I.; Blecharczyk, A.; Swędrzyński, A.; Satrzyk, J. Effect of various long-term tillage systems on some chemical and biological properties of soil. Pol. J. Environ. Stud. 2013, 22, 1835–1844. [Google Scholar]
  41. Vinhal-Freitas, I.C.; Corrêa, G.F.; Wendling, B.; Bobul’ska, L.; Ferreira, A.S. Soil textural class plays a major role in evaluating the effects of land use on soil quality indicators. Ecol. Ind. 2017, 74, 182–190. [Google Scholar] [CrossRef]
  42. Wolińska, A.; Stępniewska, Z.; Szafranek, A. Effect of selected physical parameters on respiration activities in common Polish mineral soils. Pol. J. Environ. Stud. 2011, 20, 1075–1082. [Google Scholar]
  43. Ulrich, A.; Becker, R. Soil parent material is a key determinant of the bacterial community structure in arable soils. FEMS Microbiol. Ecol. 2006, 56, 430–443. [Google Scholar] [CrossRef] [Green Version]
  44. Toth, E.M.; Borsodi, A.K. The family Nocardioidaceae. In The Prokaryotes—Actinobacteria; Rosenberg, E., DeLong, E.F., Lory, S., Stackebrandt, E., Thompson, F., Eds.; Springer: Berlin/Heidelberg, Germany, 2014; Volume 33, pp. 1–44. [Google Scholar] [CrossRef]
  45. Sukda, P.; Gouda, N.; Ito, E.; Myauchi, K.; Masai, E.; Fukuda, M. Characterization of a transcriptional regulatory gene involved in dibenzofuran degradation by Nocardioides sp. strain DF412. Biosci. Biotechnol. Biochem. 2009, 73, 508–516. [Google Scholar] [CrossRef] [PubMed]
  46. Vibber, L.L.; Pressler, M.J.; Colores, G.M. Isolation and characterization of novel atrazine-degrading microorganisms from an agricultural soil. Appl. Microbiol. Biotechnol. 2007, 75, 921–928. [Google Scholar] [CrossRef] [PubMed]
  47. Yoon, J.H.; Park, Y.H. The genus Nocardioides. Prokaryotes 2006, 3, 1099–1113. [Google Scholar] [CrossRef]
  48. Lee, D.W.; Lee, S.D. Marmoricola scoriae sp. nov., isolated from volcanic ash. Int. J. Syst. Evol. Microbiol. 2010, 60, 2135–2139. [Google Scholar] [CrossRef] [PubMed]
  49. Lee, S.D. Marmoricolaaequoreus sp. nov., a novel actinobacterium isolated from marine sediment. Int. J. Syst. Evol. Microbiol. 2007, 57, 1391–1395. [Google Scholar] [CrossRef] [PubMed]
  50. Cui, Y.S.; Im, W.T.; Yin, C.R.; Lee, J.S.; Lee, K.C.; Lee, S.T. Aeromicrobium panaciterrae sp. nov., isolated from soil of a ginseng field in South Korea. Int. J. Syst. Evol. Microbiol. 2007, 57, 687–691. [Google Scholar] [CrossRef]
  51. Siddiqi, M.Z.; Lee, S.Y.; Choi, K.D.; Im, W.T. Aeromicrobium panacisolisp. nov. isolated from soil of ginseng cultivating field. Curr. Microbiol. 2008, 75, 624–629. [Google Scholar] [CrossRef]
  52. Yan, Z.F.; Lin, P.; Chu, X.; Kook, M.C.; Li, C.T.; Yi, T.H. Aeromicrobium halotolerans sp. nov., isolated from desert soil sample. Arch. Microbiol. 2016, 198, 423–427. [Google Scholar] [CrossRef] [PubMed]
  53. Kim, S.H.; Yang, H.O.; Sohn, Y.C.; Kwon, H.C. Aeromicrobium halocynthiae sp. nov., taurocholic acid-producing bacterium isolated from the marine ascidian Halocynthiaroretzi. Int. J. Syst. Evol. Microbiol. 2010, 60, 2793–2798. [Google Scholar] [CrossRef]
  54. Tang, Y.; Zhou, G.; Zhang, L.; Mao, J.; Luo, X.; Wang, M.; Fang, C. Aeromicrobium flavum sp. nov., isolated from air. Int. J. Syst. Evol. Microbiol. 2008, 58, 1860–1863. [Google Scholar] [CrossRef] [PubMed]
  55. Niu, L.; Xiong, M.; Tang, T.; Song, L.; Hu, X.; Zhao, M.; Zhang, K. Aeromicrobium camelliae sp. nov., isolated from Pu’er tea. Int. J. Syst. Evol. Microbiol. 2015, 65, 4369–4373. [Google Scholar] [CrossRef] [PubMed]
  56. Fujinami, S.; Takarada, H.; Kasai, H.; Sekine, M.; Omata, S.; Harada, T.; Fukai, R.; Hosoyama, A.; Horikawa, H.; Kato, Y.; et al. Complete genome sequence of YM16-304T. Stand. Genomic Sci. 2013, 8, 430–440. [Google Scholar] [CrossRef] [PubMed]
  57. Raaijmakers, J.M.; Paulitz, T.C.; Steinberg, C.; Alabouvette, C.; Moenne-Locoz, Y. The rhizosphere: A playground and battlefield for soilborne pathogens and beneficial microorganisms. Plant Soil 2009, 321, 341–361. [Google Scholar] [CrossRef]
  58. Rivas, R.; Trujillo, M.E.; Mateos, P.F.; Martinez-Molina, E.; Velazquez, E. Agromyces ulmi sp. nov, a xylanolytic bacterium isolated from Ulmusnigra in Spain. Int. J. Syst. Evol. Microbiol. 2004, 54, 1987–1990. [Google Scholar] [CrossRef]
  59. Evtushenko, L.I.; Takeuchi, M. The family Microbacteriaceae. Prokaryotes 2006, 3, 1020–1098. [Google Scholar] [CrossRef]
  60. Abdel-Razek, A.S.; Refaat, B.M.; Abdel-Shakour, E.H.; Zaher, R.; Mohamed, M.K. Biodegradation of phenol by Microbacterium terregenes isolated from oil filed NORM soil. J. Appl. Environ. Microbiol. 2015, 3, 63–69. [Google Scholar] [CrossRef]
  61. Albuquerque, L.; França, L.; Rainey, F.A.; Schumann, P.; Nobre, M.F.; da Costa, M.S. Gaiellaoculta gen. nov., sp. nov., a novel representative of a deep branching phylogenetic lineage within the class Actinobacteria and proposal of Gaiellaceae fam. nov. and Gaiellales ord. nov. Syst. Appl. Microbiol. 2011, 34, 595–599. [Google Scholar] [CrossRef]
  62. Peng, M.; Zi, X.; Wang, Q. Bacterial community diversity of oil-contaminated soils assessed by high throughput sequencing of 16S rRNA genes. Int. J. Environ. Res. Public Health 2015, 12, 12002–12015. [Google Scholar] [CrossRef]
  63. Kumar, V.; AlMomin, S.; Al-Aqeel, H.; Al-Salameen, F.; Nair, S.; Shajan, A. Metagenomic analysis of rhizosphere microflora of oil-contaminated soil planted with barley alfalfa. PLoS ONE 2018, 13, e0202127. [Google Scholar] [CrossRef]
  64. Li, M.; Cheng, X.; Guo, H.; Yang, Z. Biomineralization of carbonate by Terrabacter tumescens for havy metal removal and biogrouting applications. J. Environ. Eng. 2016, 142, 1–6. [Google Scholar] [CrossRef]
  65. Vaijayanthi, G.; Cholarajan, A.; Vijayakumar, R. Isolation, characterization, and antibacterial activity of terrestrial Actinobacteria in the soils of Thanjavur District, Tamil Nadu, India. Res. J. Sci. Technol. 2012, 4, 132–139. [Google Scholar]
  66. Nacke, H.; Thűrmer, A.; Wollherr, A.; Will, C.; Hodac, L.; Herold, N.; Schöning, I.; Schrumpf, M.; Daniel, R. Pyrosequencing-based assessment of bacterial community structure along different management types in German forest and grassland soils. PLoS ONE 2011, 6, e0017000. [Google Scholar] [CrossRef]
  67. Hruska, K.; Kaevska, M. Mycobateria in water, soil, plants and air: A review. Vet. Med. 2012, 57, 623–679. [Google Scholar] [CrossRef]
  68. Qin, S.; Li, J.; Chen, H.H.; Zhao, G.Z.; Zhu, W.Y.; Jiang, C.L.; Xu, L.H.; Li, W.J. Isolation, diversity, and antimicrobial activity of rare Actinobacteria from medicinal plants of tropical rain forests in Xsishuangbanna, China. App. Environ. Microbiol. 2009, 75, 6176–6186. [Google Scholar] [CrossRef] [PubMed]
  69. Passari, A.K.; Mishra, V.K.; Singh, G.; Singh, P.; Kumar, B.; Gupta, V.K.; Sarma, R.K.; Saikia, R.; O’Donovan, A.; Singh, B.P. Insight into the functionality of endophytic actinobacteria with a focus on their biosynthetic potential and secondary metabolites production. Sci. Rep. 2017, 7, 11809. [Google Scholar] [CrossRef] [PubMed]
  70. Kim, K.K.; Lee, K.C.; Lee, J.S. Patulibacter ginsengiterrae sp. nov. isolated from soil of a ginseng field, and an amended description of the genus Patulibacter. Int. J. Syst. Evol. Microbiol. 2012, 62, 563–568. [Google Scholar] [CrossRef]
  71. Lauber, C.L.; Hamady, M.; Knight, R.; Fierer, N. Pyrosequencing-based assessment of soil pH as a predictor of soil bacterial community structure at the continental scale. Appl. Environ. Microbiol. 2009, 75, 5111–5120. [Google Scholar] [CrossRef] [PubMed]
  72. Dimitriu, P.A.; Grayston, S.J. Relationship between soil properties and patterns of bacterial b-diversity across reclaimed and natural boreal forest soils. Microb. Ecol. 2010, 59, 563–573. [Google Scholar] [CrossRef] [PubMed]
  73. Fierer, N.; Leff, J.W.; Adams, B.J.; Nielsen, U.N.; Bates, S.T.; Lauber, C.L.; Owens, S.; Gilbert, J.A.; Wall, D.H.; Caporaso, J.G. Cross-biome metagenomic analyses of soil microbial communities and their functional attributes. Proc. Natl. Acad. Sci. USA 2012, 109, 21390–21395. [Google Scholar] [CrossRef] [Green Version]
  74. Högberg, M.N.; Högberg, P.; Myrold, D.D. Is microbial community composition in boreal forest soils determined by pH, C-to-N ratio, the trees, or all three? Oecologia 2007, 150, 590–599. [Google Scholar] [CrossRef]
Figure 1. Soil sampling with Egner’s bow by Dr. Artur Banach from The John Paul II Catholic University of Lublin (a), and homogenization of single random samples into one representative sample (b) in each site separately.
Agronomy 09 00598 g001
Figure 2. Relative abundance of bacteria at the phylum level across all soil samples (NC– non-cultivated soil; C–cultivated soil) classified according to its formation processes (autogenic, hydrogenic, and lithogenic).
Agronomy 09 00598 g002
Figure 3. Relative abundance of six dominant families of Actinobacteriaacross all soil samples (NC– non-cultivated soil; C–cultivated soil) classified according to soil formation processes (autogenic, hydrogenic, and lithogenic).
Agronomy 09 00598 g003
Figure 4. Relative abundance of seven dominant genera of Actinobacteria across all soil samples (NC– non-cultivated soil; C–cultivated soil) classified according to soil formation processes (autogenic, hydrogenic, and lithogenic).
Agronomy 09 00598 g004
Figure 5. Beta-biodiversity of common and specific ActinobacteriaOTUs in NC and C soils from Lublin Region.
Agronomy 09 00598 g005
Figure 6. Biplots (CCA) along the two main axes of variation for the significant environmental variables (p < 0.05) and sampled soils of DGGE banding patterns (NC—non-cultivated, C—cultivated). The number before C and NC indicates the number of the soil sample.
Agronomy 09 00598 g006
Table 1. Localization of the soil sampling sites (South-East—SE Poland) with Food and Agriculture Organization of the United Nations—FAO classification.
Soil No.Field Code (Soil Group)FAO ClassificationGeographic Coordinates
1Autogenic (1–10)Albic Luvisol22°10′17,7′’51°26′24,6″
2Albic Luvisol22°27′10,3′’51°24′3,8″
3Albic Luvisol22°36′51,8′’51°21′27,0″
4Haplic Luvisol22°06′54,2′’51°21′52,2″
5BrunicArenosol22°15′19,0′’51°23′0,9″
6BrunicArenosol22°15′55,5′’51°23′1,9″
7Haplic Luvisol24°04′0,3′’50°51′15,81
8Haplic Luvisol23°22′52,4′’50°51′14,8″
9Haplic Luvisol22°07′29,9′’51°25′5,5″
10Haplic Chernozem50°44′48,3″23°42′56,6′’
11Hydrogenic (11–14)GleyicPhaeozem22°06′18,8′’51°22′48,0″
12MollicGleysol22°01′25,5′’51°29′15,3″
13FluvicGleyicPhaeozem21°59′10,1′’51°33′47,7″
14GleyicUmbrisol22°16′38,9′’51°25′27,3″
15Lithogenic (15–16)CalcaricCambisol23°10′58,3′’51°12′22,3″
16CalcaricPhaeozem23°11′43,9′’51°12′10,8″
Table 2. Selected chemical features of the studied soils ± SD (C—cultivated, agricultural, bolded; NC-control, non-cultivated soils).
Soil No.Moisture apHEh bTC aN–NH4 cN–NO3 cN–NO2 cP– PO4 c
1C8.20 ± 0.205.23 ± 0.06477.4 ± 0.400.98 ± 0.0020.01 ± 0.0069.34 ± 0.80.11 ± 0.0032.56 ± 0.04
1NC9.76 ± 0.116.27 ± 0.005435.2 ± 0.201.76 ± 0.120.09 ± 0.0061.68 ± 0.0140.17 ± 0.0011.77 ± 0.03
2C9.30 ± 0.104.66 ± 0.02546.73 ± 0.211.23 ± 0.040.02 ± 0.0017.37 ± 0.050.08 ± 0.0011.51 ± 0.01
2NC11.16 ± 0.115.02 ± 0.02528.40 ± 0.361.40 ± 0.050.04 ± 0.0145.84 ± 0.030.10 ± 0.0011.01 ± 0.01
3C10.22 ± 0.034.78 ± 0.02535.7 ± 0.301.24 ± 0.040.01 ± 0.00153.32 ± 0.520.05 ± 0.00519.6 ± 0.98
3NC9.13 ± 0.056.22 ± 0.09452.86 ± 0.111.79 ± 0.140.06 ± 0.0063.58 ± 0.090.42 ± 0.0051.16 ± 0.05
4C12.56 ± 0.066.98 ± 0.02450.03 ± 0.321.96 ± 0.050.43 ± 0.00618.25 ± 0.060.10 ± 0.00412.9 ± 0.04
4NC13.50 ± 0.107.08 ± 0.06419.20 ± 1.112.52 ± 0.140.48 ± 0.0087.57 ± 0.320.53 ± 0.0035.9 ± 0.03
5C6.60 ± 0.105.45 ± 0.04470.20 ± 17.751.01 ± 0.040.07 ± 0.00625.53 ± 0.180.12 ± 0.0016.88 ± 0.01
5NC8.63 ± 0.155.58 ± 0.04396.13 ± 0.232.06 ± 0.190.69 ± 0.00910.18 ± 0.140.21 ± 0.0023.52 ± 0.09
6C9.23 ± 0.064.78 ± 0.006480.60 ± 0.180.83 ± 0.090.01 ± 0.00720.26 ± 0.070.09 ± 0.0044.01 ± 0.01
6NC8.63 ± 0.155.58 ± 0.04396.13 ± 0.232.06 ± 0.190.69 ± 0.00910.18 ± 0.140.21 ± 0.0023.52 ± 0.09
7C12.13 ± 0.156.93 ± 0.006403.10 ± 3.640.97 ± 0.060.05 ± 0.00114.48 ± 0.040.04 ± 0.0054.61 ± 0.01
7NC12.76 ± 0.116.99 ± 0.03400.66 ± 0.153.49 ± 0.110.41 ± 0.0085.41 ± 0.140.87 ± 0.0033.85 ± 0.03
8C19.00 ± 0.175.96 ± 0.12461.10 ± 0.170.96 ± 0.110.36 ± 0.0217.35 ± 0.030.12 ± 0.0026.81 ± 0.02
8NC20.26 ± 0.636.06 ± 0.009409.23 ± 0.252.68 ± 0.072.61 ± 0.0411.07 ± 0.050.24 ± 0.022.94 ± 0.03
9C5.66 ± 0.115.13 ± 0.006480.73 ± 0.930.88 ± 0.060.19 ± 0.0094.96 ± 0.060.14 ± 0.00113.9 ± 0.24
9NC7.10 ± 0.175.40 ± 0.006487.23 ± 0.251.42 ± 0.110.18 ± 0.0011.76 ± 0.060.80 ± 0.0027.52 ± 0.02
10C24.66 ± 0.286.61 ± 0.05561.30 ± 0.361.64 ± 0.030.02 ± 0.00127.43 ± 0.080.09 ± 0.0031.36 ± 0.05
10NC31.03 ± 0.237.22 ± 0.02529.26 ± 0.235.43 ± 0.140.02 ± 0.0028.23 ± 0.020.44 ± 0.0061.35 ± 0.02
11C12.96 ± 0.286.73 ± 0.006556.10 ± 0.301.18 ± 0.020.41 ± 0.0410.11 ± 0.070.13 ± 0.0045.77 ± 0.13
11NC14.33 ± 0.576.76 ± 0.01537.96 ± 0.253.15 ± 0.290.78 ± 0.0110.06 ± 0.090.15 ± 0.0011.09 ± 0.02
12C5.80 ± 0.174.74 ± 0.02559.36 ± 0.320.91 ± 0.050.03 ± 0.00421.90 ± 0.020.09 ± 0.0012.04 ± 0.03
12NC10.40 ± 0.176.25 ± 0.03542.90 ± 2.951.80 ± 0.134.94 ± 0.086.75 ± 0.050.10 ± 0.0011.68 ± 0.008
13C5.20 ± 0.174.18 ± 0.05551.30 ± 0.300.98 ± 0.070.14 ± 0.042.99 ± 0.030.09 ± 0.0012.64 ± 0.09
13NC8.86 ± 0.115.64 ± 0.06545.20 ± 0.401.23 ± 0.080.27 ± 0.032.20 ± 0.050.13 ± 0.0021.33 ± 0.008
14C6.50 ± 0.104.85 ± 0.03523.43 ± 0.232.69 ± 0.190.01 ± 0.00110.22 ± 0.120.08 ± 0.0023.09 ± 0.10
14NC9.30 ± 0.205.27 ± 0.01519.96 ± 0.253.63 ± 0.140.02 ± 0.0029.05 ± 0.030.09 ± 0.0011.74 ± 0.38
15C10.86 ± 0.115.58 ± 0.06503.90 ± 0.200.97 ± 0.060.05 ± 0.0177.17 ± 0.140.08 ± 0.0076.83 ± 0.19
15NC12.50 ± 0.175.76 ± 0.01493.80 ± 0.201.59 ± 0.123.39 ± 0.0610.12 ± 0.070.09 ± 0.0040.60 ± 0.007
16C12.80 ± 0.105.58 ± 0.11488.20 ± 0.201.25 ± 0.050.22 ± 0.0132.98 ± 0.270.09 ± 0.0011.04 ± 0.02
16NC19.30 ± 0.177.39 ± 0.02446.16 ± 0.475.80 ± 0.430.28 ± 0.0213.82 ± 0.50.13 ± 0.0041.01 ± 0.02
a—%; b—mV; c—mg/kg.
Table 3. Analyses of the diversity of Actinobacterial 16S rRNA amplicons in Lublin Region soils (± SD value).
Soil TypeMode of Land UseShannon-Weaver Diversity Index
(H’)
Simpson’s Dominance Index
(1/D)
Simpson’s Diversity Index
(D)
Autogenic NC2.87 ± 0.00410.28 ± 0.0050.14 ± 0.004
C2.86 ± 0.0069.90 ± 0.0040.11 ± 0.005
Hydrogenic NC2.99 ± 0.00211.22 ± 0.0040.09 ± 0.006
C2.94 ± 0.00110.19 ± 0.0020.10 ± 0.004
LithogenicNC3.13 ± 0.00314.00 ± 0.0010.08 ± 0.003
C3.08 ± 0.00411.74 ± 0.0030.07 ± 0.004
H’—Shannon-Weaver index of general diversity, 1/D—Simpson’s index of dominance; D—Simpson’s index of diversity.
Table 4. Comparative biodiversity of Actinobacteria along a gradient of cultivated soils.
Non–Cultivated SoilsH’1/DDSCultivated SoilsSoil TypeH’1/DDS
11NC3.636.070.1651611CMollicGleysol2.447.370.1366
15NC2.887.640.131815CRendzina Leptosol2.447.370.1366
14NC3.646.050.1652214CEutricHistosol2.656.800.1477
4NC3.296.700.149114CHaplic Luvisols2.836.360.1578
16NC3.636.070.1651616CRendzina Leptosol2.836.360.1578
10NC3.596.130.1631510CHaplic Phaezoem2.996.030.1669
12NC3.176.940.1441012CMollicGleysol2.996.030.1669
8NC3.596.130.163158CHaplic Luvisols3.125.760.17310
2NC3.176.940.144102CAlbic Luvisols3.345.390.18612
13NC2.708.150.123713CEutricFluvisol3.345.390.18612
1NC3.296.700.149111CAlbic Luvisols3.435.250.19013
3NC3.636.070.165163CAlbic Luvisols3.435.250.19013
9NC3.636.070.165169CHaplic Luvisols3.505.140.19414
7NC3.047.250.13897CHaplic Luvisols3.565.060.19815
5NC3.296.700.149115CBrunicArenosols3.664.920.20318
6NC2.259.770.10256CBrunicArenosols3.664.920.20318
H’—Shannon-Weaver index of general diversity, 1/D—Simpson index of dominance; D—Simpson index of diversity, and S—number of OTU’s for DGGE profiles.
Table 5. General diversity of studied soil samples based on DGGE banding patterns.
Mode of Land UseShannon-Weaver Diversity Index
(H’)
Simpson’s Dominance Index
(1/D)
Simpson’s Diversity Index
(D)
Non-cultivated (NC)9.34 ± 0.06 *2.90 ± 0.0040.34 ± 0.007
Cultivated (C)8.77 ± 0.063.35 ± 0.0060.27 ± 0.006
*- standard deviation, p ≤ 0.05, n = 54.

