Article

Perennial Ryegrass Wear Resistance and Soil Amendment by Ca- and Mg-Silicates

1
Center for Turfgrass Science, Penn State University, University Park, PA 16802, USA
2
Department of Plant Pathology & Environmental Microbiology, Penn State University, University Park, PA 16802, USA
*
Author to whom correspondence should be addressed.
Agronomy 2019, 9(10), 578; https://doi.org/10.3390/agronomy9100578
Submission received: 8 September 2019 / Revised: 21 September 2019 / Accepted: 23 September 2019 / Published: 25 September 2019
(This article belongs to the Section Soil and Plant Nutrition)

Abstract

:
Proactive optimization of soil chemistry is a task commonly overlooked by agronomic practitioners. Agricultural field assessments have reported depletion of extractable soil silicon (Si) from shallow depths of intensively managed systems. While not recognized as a plant-essential nutrient, Si accumulates in epidermal and vascular tissue of grass leaves, sheaths, and shoots. A field study of Ca/Mg-silicate (SiO3) pelletized soil conditioner was initiated on a perennial ryegrass (Lolium perenne L. cvs. 1:1:1 Manhattan, Brightstar SLT, Mach 1) athletic field in 2010. Plots were trafficked by a wear simulator weekly, June through Sept. in 2011 and 2012. Canopy quality measures, clipping yield, tissue composition, soil pH, and plant-available soil Si levels were regularly collected over the two-year study. Under intense wear treatment (traffic), perennial ryegrass plots treated annually by granular application of 1220 or 2440 kg Ca/Mg-silicates per hectare showed significantly improved mean canopy density relative to plots receiving equal Ca and Mg as lime. These described Ca/Mg-SiO3 annual application rates coincided with acetic acid extractable soil Si levels > 70 mg kg−1 in the 0- to 8-cm soil depth. Experimental and temporal variability preclude reporting of a critical threshold concentration of leaf Si for improved perennial ryegrass wear tolerance. Future efforts towards this end should sample tissue of plots receiving wear treatment, rather than adjacent, non-worn proxies.

Graphical Abstract

1. Introduction

After oxygen, silicon (Si) is the most abundant element in the Earth’s crust and a dependable constituent of the soil mineral fraction [1]. Although not recognized as a plant-essential nutrient, Si naturally accumulates in tissue of many plant species [2]. This plant uptake results in intra- and extracellular silica deposition in the epidermal and vascular tissue of monocotyledonous leaves and roots [3,4]. Silica deposition in leaf/shoot cuticle and epidermis of rice (Oryza sativa L.), sugarcane (Saccharum officinarum L.), or bamboo (Phyllostachys heterocycla Mitf.) has shown significant correlation to stomatal density, transpiration, and lodging resistance [5,6].
Recent agricultural field assessments report soil Si depletion in shallow depths of intensively managed systems [7,8]. Uptake of Si by roots of broadleaf and grass plants support recommendations for silicon fertilization [8]. Silica uptake in rice has been shown to increase with SiO3 rate [9]. Topdressing or incorporation of Ca- and/or Mg-SiO3 conditioner(s) into rootzones underlying creeping bentgrass (Agrostis stolonifera L.), tall fescue (Schedonorus arundinaceus [Schreb.] Dumort., nom. cons.), perennial ryegrass (Lolium perenne L.), bermudagrass (Cynodon dactylon L.), and zoysiagrass (Zoysia japonica Steud.) have resulted in statistically increased Si accumulation in leaf tissue [10,11,12,13]; whereas, Si application to seashore paspalum (Paspalum vaginatum L.) resulted in a significant leaf Si increase in one of two field evaluations [14]. Similarly, spray application of liquid Si fertilizers to creeping bentgrass (Agrostis stolonifera L.) has shown significant leaf accumulation in Kentucky [15], but not in North Carolina [16].
Considering the Ca-requirements of meristematic tissue in lengthening roots and aqueous activity of highly-soluble monovalent silicates [17], calcium silicate appears better suited for sizable application to managed turfgrass than liquid potassium- or sodium-silicate products. Furthermore, while all liming agents neutralize exchangeable acidity, resulting products of these chemical reactions typically comprise only CO2 or H2O [18]. Acid neutralization by Ca/MgSiO3 liming agents uniquely produce silicic acid, H4SiO4, which is readily assimilated by plant roots and re-distributed to vascular, epidermal, and cuticular tissue [3,4,19].
Wear injury to turfgrass comprises abrasion, tearing, and compression of leaf/shoot tissue; and is an innate concern of those managing turfgrass on intensively used sites [20]. Indirect effects of wear injury to turfgrass include degraded pest resistance, utility, and aesthetic appeal [20,21]. Silicic acid deposition in the apoplast has been reported to elicit structural resilience and pathogen resistance by polymerizing cell walls at a significantly lesser metabolic cost than lignification [22,23,24,25,26]. Varying Si concentration, supplanting lignin, cellulose, and/or hemicellulose content in rice stalks, demonstrated equal resistance to applied compressive force [27,28,29].
Perennial ryegrass is a cool-season turfgrass species renowned for its dark green color, upright growth habit, rapid germination and establishment rate, tolerance of low mowing height, and minimal thatch contribution [21]. In regions where cool-season turfgrasses are well-adapted and perennial athletic field vegetation is intended, perennial ryegrass pairs swimmingly with Kentucky bluegrass (Poa pratensis L.) and/or turf-type tall fescue. Likewise, perennial ryegrass is commonly established and maintained as overseed where recreational warm-season turfgrass systems undergo prolonged dormancy. Given both its widespread use and reported tendency to accumulate soil Si, perennial ryegrass comprises an ideal candidate for soil conditioner and wear treatment evaluation. The primary objective of this field research is to comprehensively-assess perennial ryegrass response to intense wear/traffic and amendment by pelletized Ca/Mg-rich soil conditioners.

2. Materials and Methods

A field study of commercial soil conditioners was initiated July 2010 on a perennial ryegrass (1:1:1 ‘Manhattan,’ ‘Brightstar SLT,’ ‘Mach 1’) field maintained within the Joseph Valentine Turfgrass Research Center (University Park, PA, USA). The Hagerstown silt loam (fine, mixed, mesic, typic hapludalfs) comprising the athletic field rootzone was sampled to a 16-cm depth on 6 July 2010. Three (3) composite samples were submitted to the Pennsylvania State Univ. Agricultural Analytical Services Laboratory (PSU-AASL) for routine fertility analysis [18]. The experiment was arranged as a split plot in randomized complete block design of six (6) replicates. One of two main plots in each replicate block was randomly assigned systematic wear treatment. Three (3) split plots (1.7 × 0.9 m) in each main plot were randomly assigned treatment applications of: granular Ca/Mg-silicate (SiO3) ‘CrossOver’ (Harsco Minerals Intl., Sarver, PA, USA) totaling 1220 or 2440 kg ha−1 annually (manufacturer recommendation), or a 1:1 blend of pelletized dolomitic and calcitic limestones, Ca/MgCO3 (OldCastle Lawn and Garden, Thomasville, PA, USA) totaling 1220 kg ha−1 annually (Table 1).
Granular applications were initiated 7 July 2010. Split applications of each treatment were reapplied over the 2010, 2011, and 2012 seasons (Figure 1). Granular applications were followed by either irrigation or a rainfall event. Likewise, mowing (twice weekly at a 2 cm height of cut) was suspended for a 5 d period. On 3 Aug. 2010, wear treatments were initiated by three sets of two adjacent passes using an internally powered front-end Sweepster (0.91 m swath). This device caused significant defoliation and was retired in preference of a pull-behind wear simulator [30]. On 9 Aug., main-plot wear treatments were applied by six sets of passes using the pull-behind wear simulator. In 2011, weekly wear treatments of five successive wear simulator passes were applied June through Aug. While two passes of the pull-behind wear simulator introduce the mean number of cleat dimples incurred between the mid-field hash marks of a regulation US football field during a 60-minute game [30], this study employed five passes over the wear main plots each week. The above-described wear treatments commenced weekly in June 2012 but were concluded 13 Aug. (769 days after initial treatment, DAIT) due to saturated conditions arising from recent and further-forecasted precipitation events.
Preliminary soil test results indicated neutral pH and optimal saturation of a 9.3 meq (100 g soil)−1 cation exchange capacity. Likewise, Mehlich-3 extractable soil P (94 mg kg−1) resided within the optimal range for a mature turfgrass athletic field. Therefore, supplemental fertilization practices were limited to monthly applications of various urea fertilizers to ensure plant-availability of 10 to 20 kg N ha–1 per growing month of the two-year study [31]. Monthly scouting of disease and/or nutrient deficiency symptoms were assessed and recorded throughout the 2011 and 2012 growing seasons.
Triplicate soil samples of 0 to 16 cm depth were collected from all non-trafficked split plots in July and Sept. 2011, and April and Aug. 2012. Soil cores were divided into 0 to 8 cm, and 8 to 16 cm depth segments, dried, and ground to pass a 1 mm sieve. Sieved depth segments were split for 0.5 M acetic acid extraction of plant-available soil Si [9] and 1:1 soil pH measurement [32]. Stock acetic acid was prepared and stored in high density polyethylene (HDPE) bottles, and soil extractions were conducted and stored in HDPE centrifuge tubes.
To avoid potentially confounding effects of wear treatment applications, clipping yields were collected from only non-trafficked split plots in June, July, and Sept. 2011; and May, July and Aug. 2012. The justification for this practice was to protect the shoot tissue from contamination by silica-rich soil particles during multiple mechanized traffic simulator transits each week. Clippings were thoroughly dried in a forced-air oven (70 °C), weighed to 0.1-mg resolution, and split for Si-extraction [33] or acid digestion and plant-essential nutrient concentration analysis by PSU-AASL. Stock solution of 4,5-dihydroxy-1,3-benzenedisulfonic acid disodium salt monohydrate, C6H4Na2O8S2 (Sigma-Aldrich, Merck KGaA, Darmstadt, Germany), was prepared in HDPE bottles, and leaf tissue Si-extractions conducted and stored in HDPE centrifuge tubes.
On 10 August 2010, and every 8 ± 3 days from late June through Aug. (2011 and 2012), simultaneous measures of 660 and 850 nm canopy reflectance from every split plot (four unique readings per) were recorded using an ambient light-excluding FieldScout TCM-500 turfgrass chlorophyll meter (Spectrum Technologies Inc., Plainfield, IL, USA). Reflectance data was used to calculate the normalized differential vegetative index (NDVI). On an identical frequency, a FieldScout TCM-500-RGB color meter (Spectrum Technologies Inc., Plainfield, IL, USA) was employed to collect quadruplicate measures of green, red, and blue canopy reflectance from every split plot. Percent color reflectance was converted to hue, saturation, and brightness levels for calculation of the dark green color index (DGCI) [34]. These NDVI and DGCI indices provide resolute and dependably reproducible measures of turfgrass canopy density and color, respectively [35].
Soil pH and plant-available soil Si levels were sorted by soil depth then modeled by conditioner treatment using PROC MIXED (SAS Institute, v. 8.2, Cary, NC, USA). The main effect of soil conditioner was F-tested using its block interaction term (df = 10). Repeated soil measures by depth were analyzed as split plots in time from initial treatment. Time-series covariate structures, selected using best fit criteria, facilitated F-tests of time and time interactions by the residual error term (df = 45).
The main effect of soil conditioner on clipping yield, leaf Si content, Si uptake, and tissue nutrient concentration was F-tested by its block interaction term (df = 10), while F-tests of time and its interaction were facilitated by previously described time-series covariate structures and a 75 df residual error term.
The main effect of wear (main plot) treatment on canopy density or canopy color was F-tested using its block interaction term (df = 5). The remaining soil conditioner effect and its interaction with wear was F-tested using the block × wear × amendment term (df = 20). Repeated canopy quality measures were treated as split-split-plots in time from initial treatment. Fit-selected covariate structures facilitated F-tests of time and time interactions by the residual error term (df = 690).
All main and split-plot effect hypothesis tests employed two-tailed separation of treatment means by Fisher’s protected least significant difference (LSD) at the 0.05 alpha level. For presentation clarity, treatment means within interacting levels of wear, soil conditioner, and/or time sources were separated using a one-tailed hypothesis test against the calcitic-/dolomitic blended-limestone treatment, and statistically significant treatment means separated using Fisher’s protected LSD at 0.05 alpha level.

3. Results

3.1. Soil Chemistry/Conditioning

Averaged over the four (4) soil sampling events (July and Sept. 2011, and Apr. and Aug. 2012), all soil conditioner treatments showed similar mean soil pH levels throughout the upper 16 cm soil profile. At no depth did conditioner treatment and time interact to influence soil pH (Table 2), thus the main effect of amendment on soil pH response (pooled over sampling dates) is shown (Figure 2A).
Amendment and sampling date did interact to influence 0.5 M acetic acid extractable soil silicon levels (Table 2), but pooled main effect results are first presented by depth. Averaged over soil sampling events, extractable soil silicon levels were greatest in the 0 to 8 cm soil depth (Figure 2B) regardless of amendment treatments applied.
Acetic acid extractable soil Si levels by soil amendment treatment, sampling depth, and collection date are further detailed in Figure 3. By the first soil sampling event in July 2011, the full 1220 kg annual application had been finalized three months prior. However, in the case of the 2440 kg ha−1 Ca/Mg-silicates treatment, the second half had been applied in five split applications over the last three months (Figure 1). As this constitutes an approximate load rate of 300 kg Si per hectare, a greater disparity than ≅14 mg extractable Si kg−1 soil in the upper 8 cm was expected between these treatments at the first (12 MAIT) soil sampling (Figure 3A).
Extractable soil Si levels in the 0 to 8 cm sampling depth remained unchanged from 12 to 14 MAIT and were significantly greater in Ca/Mg-silicate treated plots than in the limestone-treated plots. Silicate-rich treatments fostered significantly greater extractable soil Si levels than limestone treatment in the 0 to 8 cm sampling depth throughout 2012, when soil Si increased to maximum observed levels (Figure 3A). In plots receiving Si-rich conditioner treatment, extractable soil Si levels in the 0 to 8 cm depth 21 MAIT showed significant increases from 14 MAIT levels. Likewise, extractable soil Si levels recorded 25 MAIT significantly exceeded extractable soil Si levels observed 21 MAIT. Albeit unexpected and of lesser magnitude, extractable soil Si levels in the limestone-treated plots also showed a significant increase from the 21 to 25 MAIT period (Figure 3A).
On a per treatment basis, extractable soil Si levels in the 8 to 16 cm sampling depth mirrored levels observed in the 0 to 8 cm sampling depth yet averaged 15–30% less (Figure 3B). By the second growing season, 8 to 16 cm deep soil Si levels showed significant correlation to silicate application rate. Twenty-one months after receiving Si-rich conditioner treatment, extractable soil Si levels in the 8 to 16 cm depth showed significant increases from 14 MAIT levels (Figure 3B). Extractable soil Si levels in the 8 to 16 cm depth of Ca/Mg-SiO3 treated plots increased significantly between 21 and 25 MAIT as well. Soil Si extracted from the 8 to 16 cm depth of Ca/Mg-silicate treated plots, 25 MAIT of either rate, significantly exceeded soil Si levels in the 0 to 8 cm sampling depth of blended-limestone treated plots 12, 14, 21, and/or 25 MAIT (Figure 3).

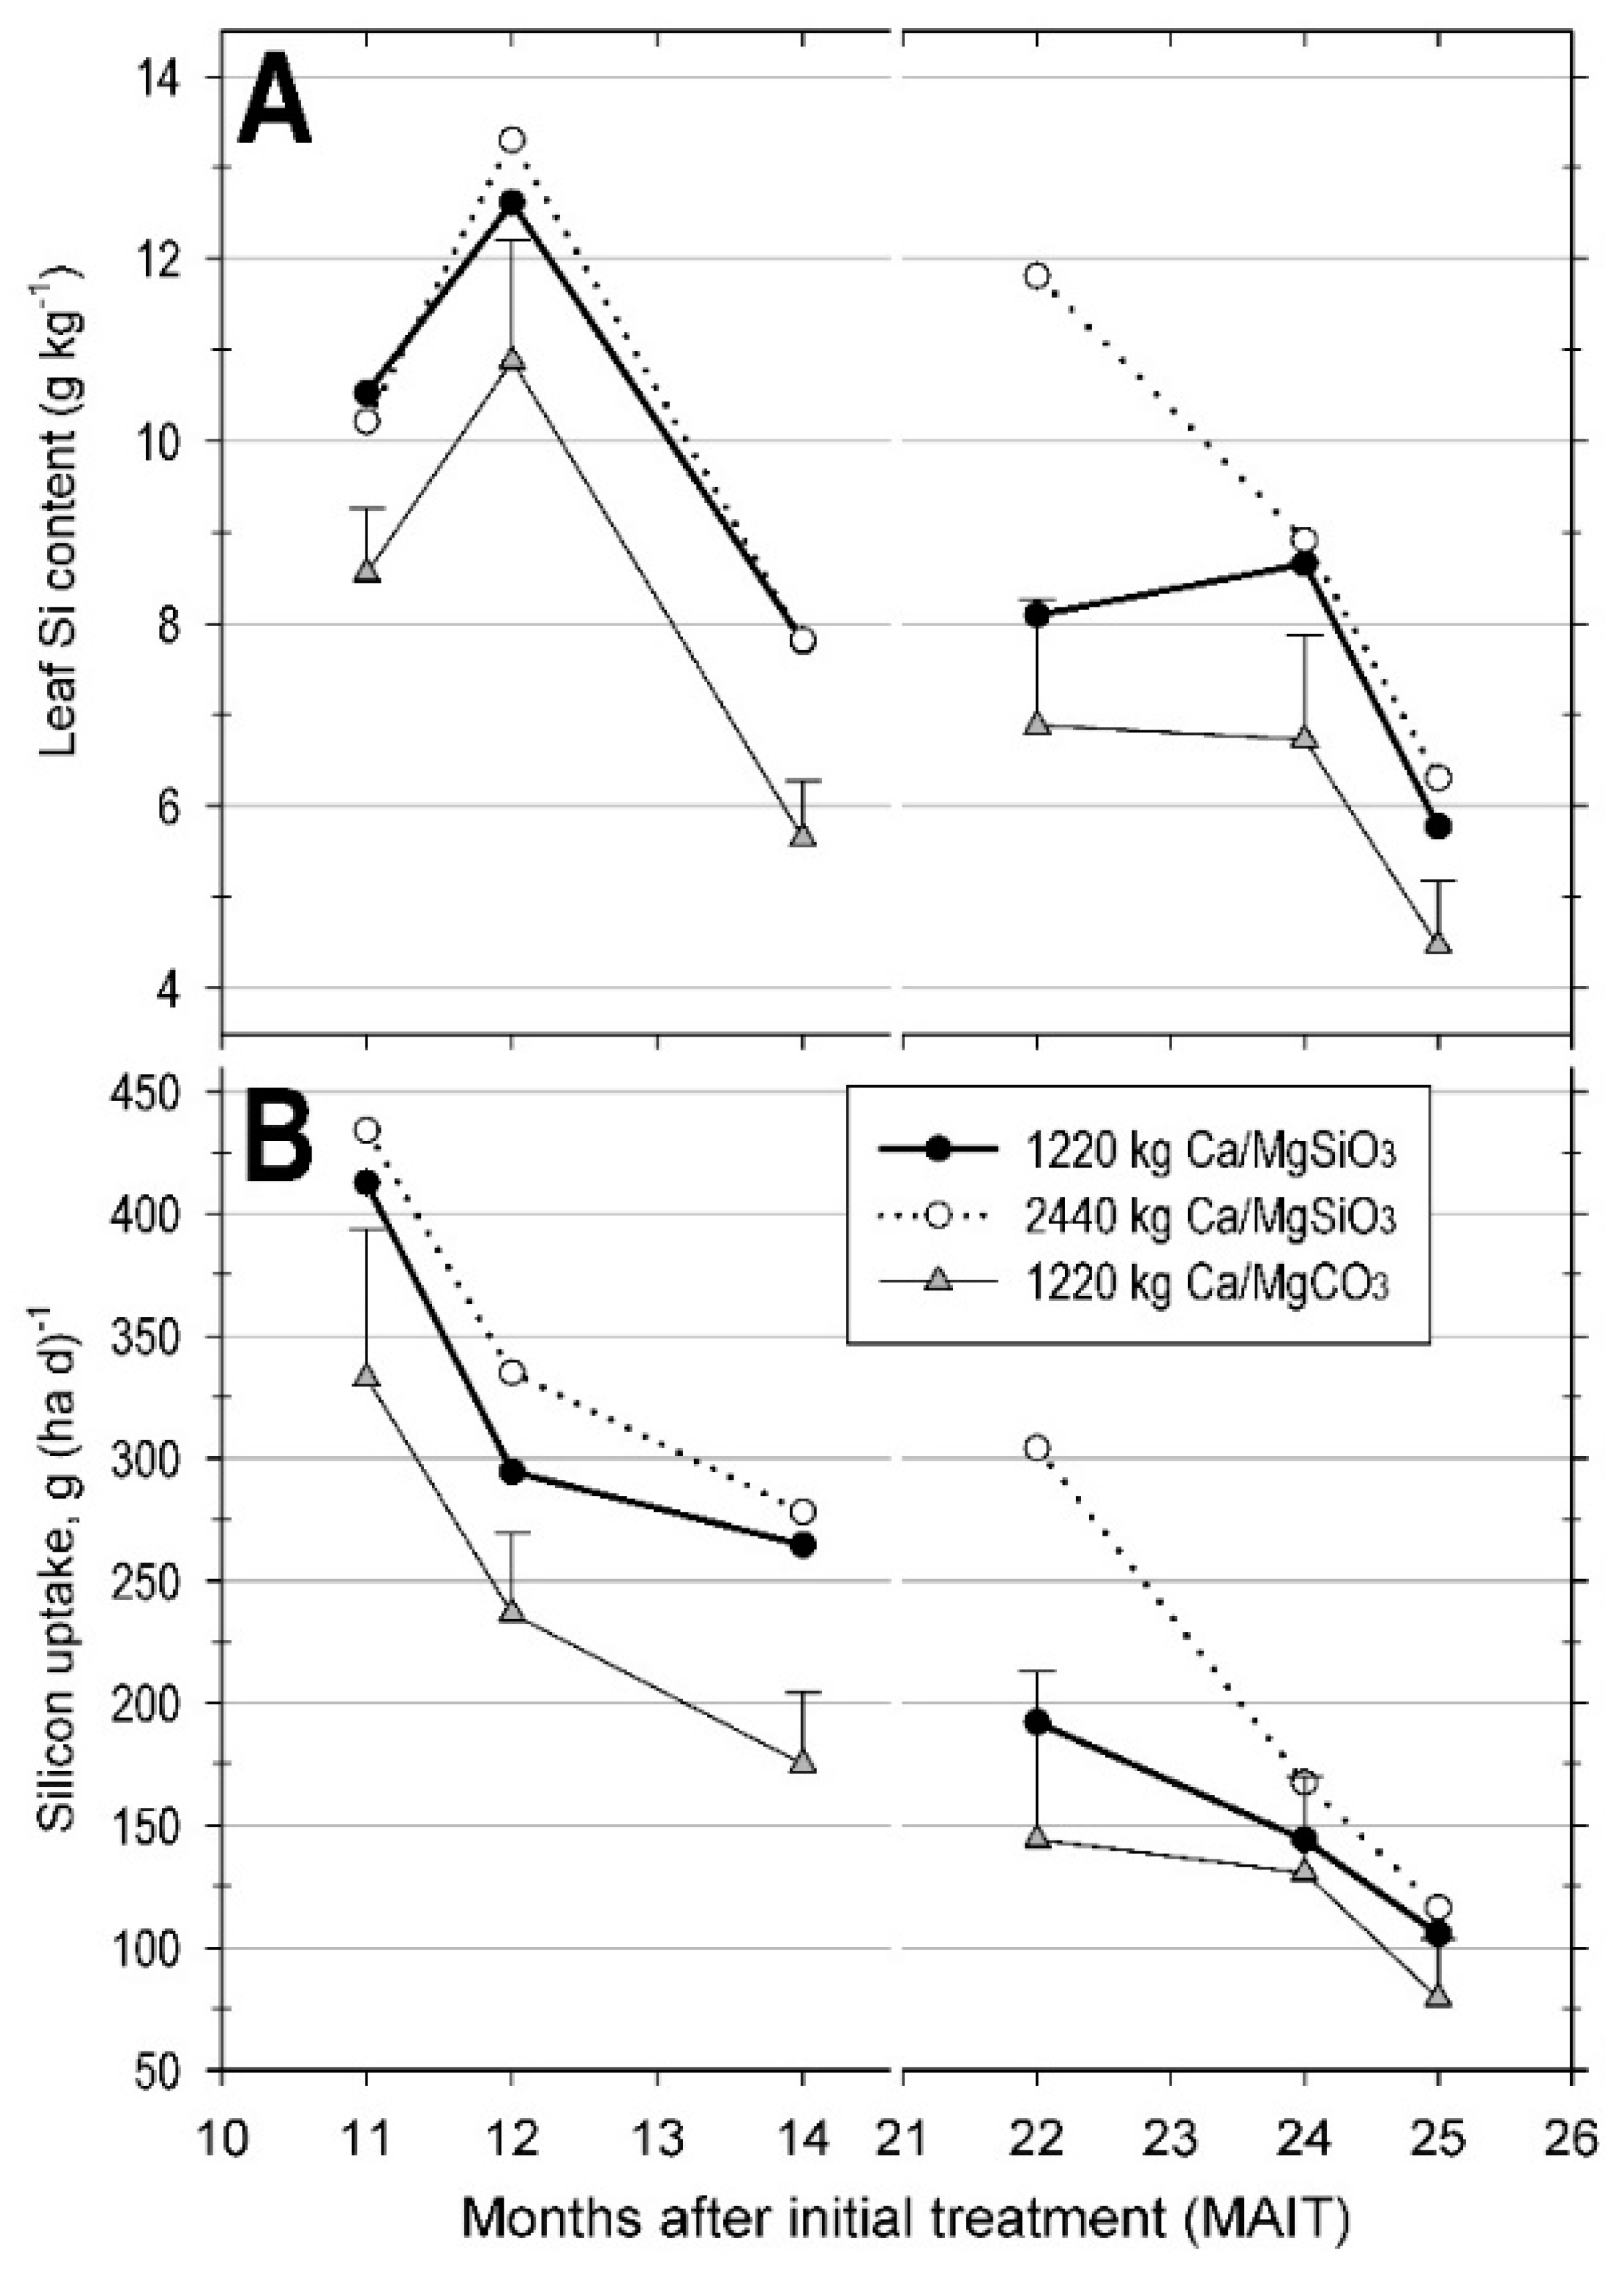
3.2. Turfgrass Vigor, Silica Assimilation, and Nutrition

Mean vigor, i.e., daily clipping yield averaged over three events in both 2011 and 2012, was neither influenced by treatment nor the interaction of treatment and time (Table 3). Ranging from 6 to 13 g Si kg−1 across sample dates, mean leaf silicon content of plots receiving either Ca/Mg-silicate treatment significantly exceeded levels measured in plots not treated by Si-rich soil conditioners (Table 3). Similarly, mean silicon uptake from plots treated by Ca/Mg-silicates was statistically-higher than that from the limed plots (Table 3).
Conditioner treatment and time significantly interacted to influence leaf Si content (Table 3). In plots treated by 1220 kg Ca/Mg-silicates (ha year)−1, leaf Si levels mirrored those observed in plots receiving the higher Ca/Mg-silicate rate, except for 22 MAIT (Figure 4A). Plots treated by 2440 kg Ca/Mg-silicates (ha year)−1 received fractional applications in May, June, and July of 2011 and 2012, and showed elevated silicon content in clippings collected from those recently-treated plots in June and July 2011 (11 and 12 MAIT) and May and July 2012 (22 and 24 MAIT).
Conditioner treatment and time also interacted to significantly affect Si uptake (Table 3), as plots treated by silica-rich conditioners showed significantly greater silicon uptake than limestone-treated plots in the first year of treatments (Figure 4B). The general reduction in Si uptake observed over the experimental period was at least a partial result of the significant time effect on clipping yield (Table 3). On average, mean clipping yield in 2012 was 62% of mean yield in 2011 (data not shown). Applications supporting the 1220 kg Ca/Mg-SiO3 (ha year)−1 rate were complete by 21 MAIT, whereas plots treated by 2440 kg Ca/Mg-silicates (ha year)−1 continued to receive split applications through 23 MAIT (Figure 4B). Twenty-two and 24 MAIT, plots treated by 1220 kg Ca/Mg-silicates (ha year)−1 showed statistically equivalent uptake to lime-treated plots. Likewise, plots treated by 2440 kg Ca/Mg-silicates (ha year)−1 showed statistically equivalent Si uptake to lime-treated plots on the 24 MAIT sample collection date. By 25 MAIT, either Ca/Mg-SiO3 treatment resulted in significantly greater Si uptake than lime-treated plots (Figure 4B).
No signs and/or symptomology of turfgrass disease on the perennial ryegrass athletic field system were observed. However, the monthly visual assessment made in late July 2011 revealed necrosis on tips and margins of old leaves in all plots. Indicative of a potassium (K) deficiency [29,36], granular KCl (0-0-60) was broadcast across the field at a 150 kg ha−1 rate and irrigated (1.5 cm) on 1 Aug. Sub-optimal availability of K was confirmed by deficient tissue K levels in clippings collected 28 July 2011 (data not shown). No signs and/or symptomology of turfgrass disease or nutrient deficiencies were observed on the perennial ryegrass athletic field system in 2012.

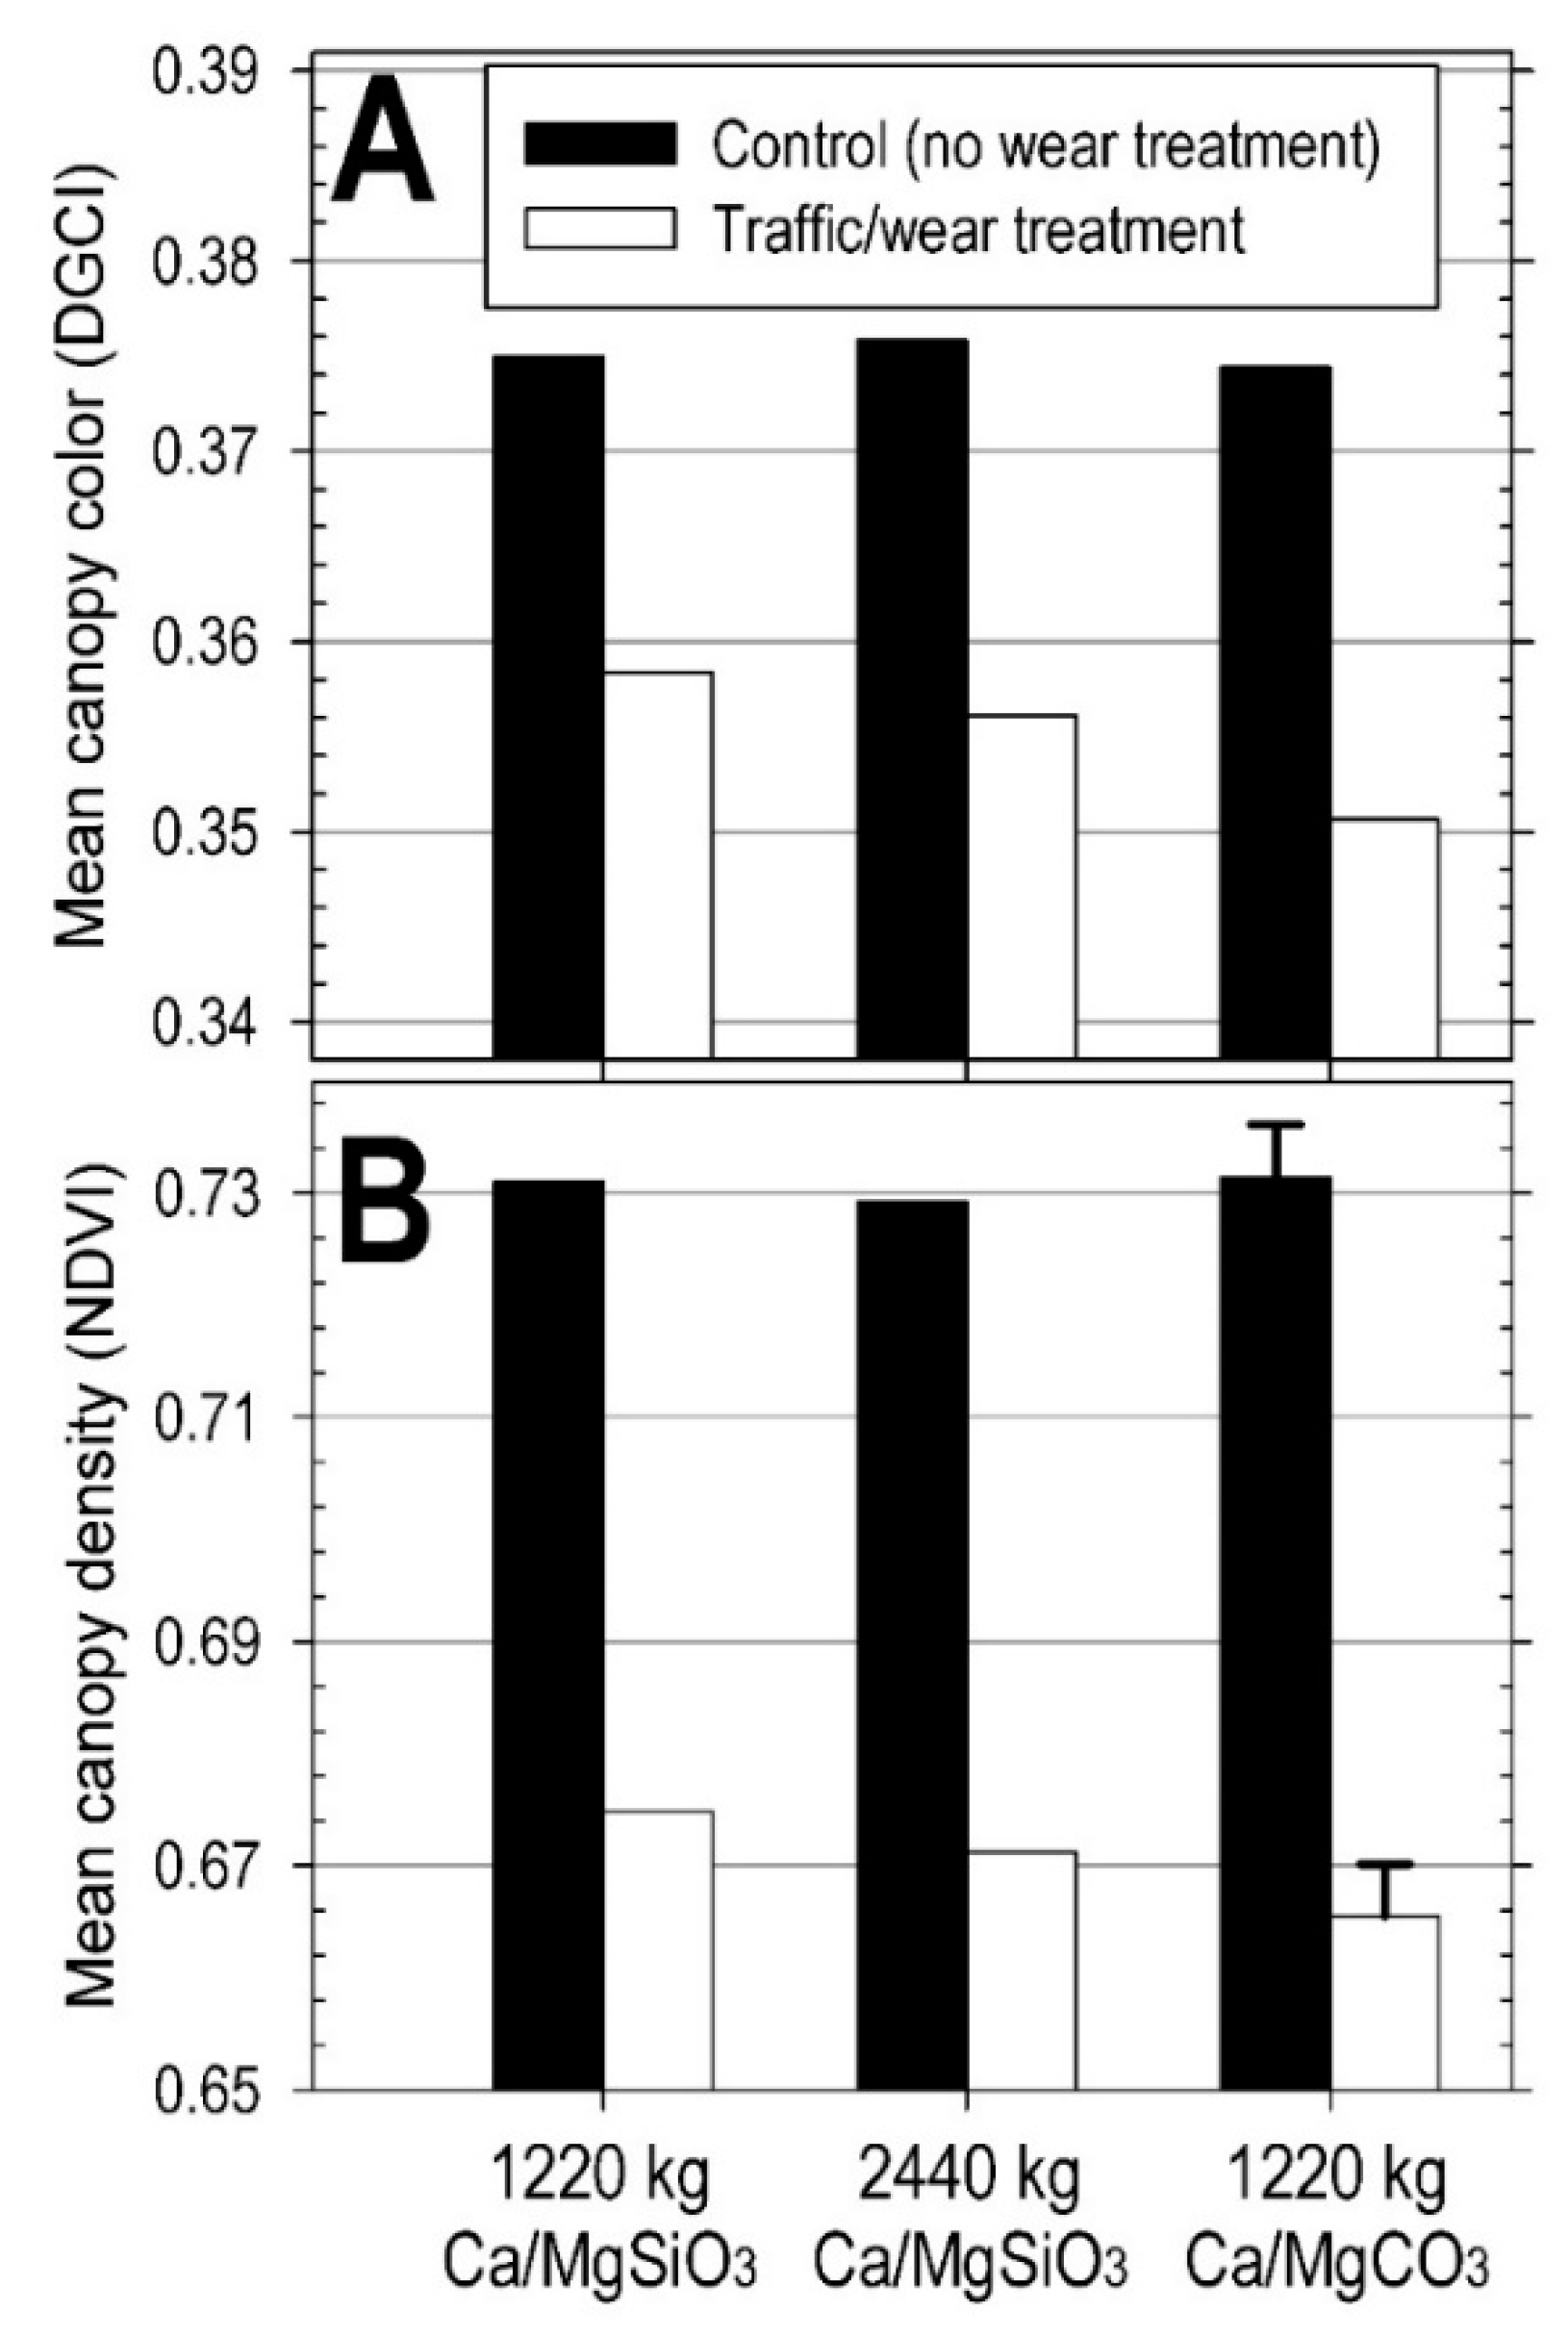
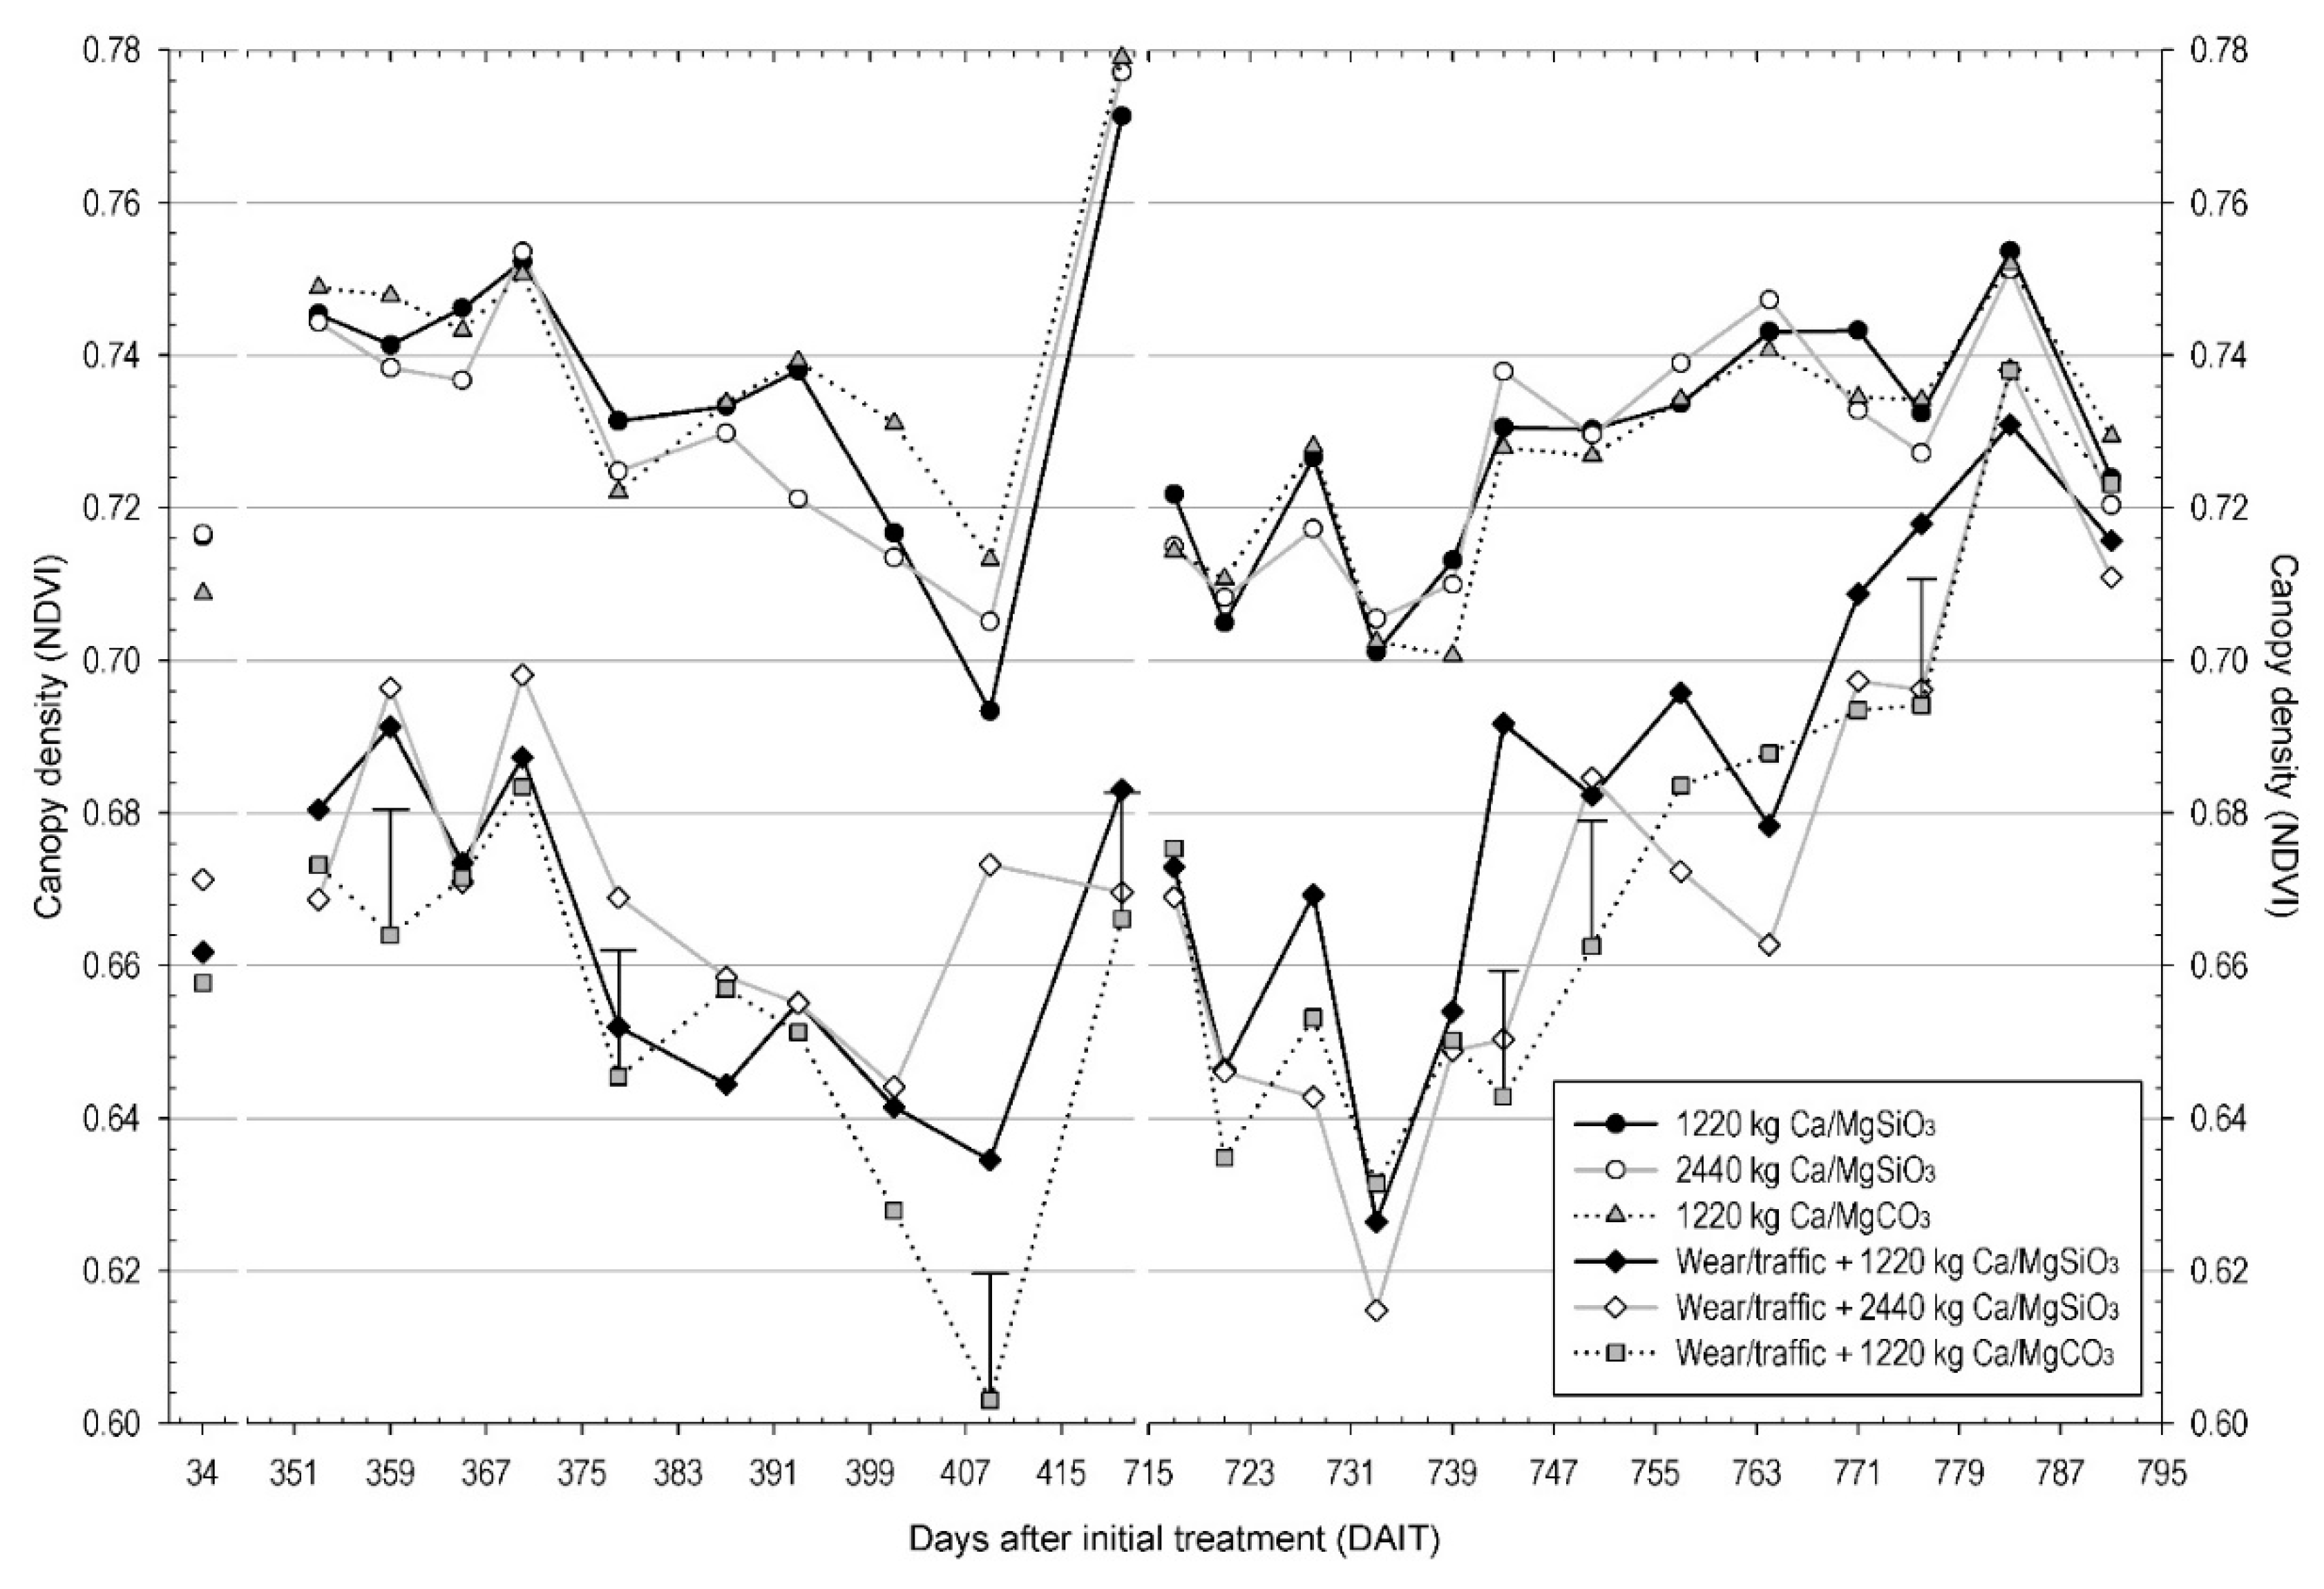
3.3. Turfgrass Traffic/Wear Tolerance

Wear treatment significantly reduced mean canopy density, and to a lesser extent, canopy color. Canopy density indices measured of worn plots were observed in a 0.581 to 0.752 range, whereas non-trafficked canopy NDVI levels ranged from 0.652 to 0.801. The effect of wear treatment on independent canopy color measures collected over the two-year study amounted to 0.020 DGCI units (Figure 5A). The effect of wear treatment on canopy density measures amounted to 0.068 NDVI units (Figure 5B).
Perennial ryegrass canopy response to systematic wear treatment interacted with soil conditioner (Table 4). Regarding non-trafficked plots (black columns, Figure 5), conditioner treatment did not significantly influence experiment-wide estimates of mean canopy color (Figure 5A) or density (Figure 5B). Yet perhaps of greater interest to practitioners managing high-use perennial ryegrass athletic fields, was the influence of soil amendment and intense wear treatment combination (white columns) on turfgrass density (Figure 5B). On plots receiving weekly wear treatment, and relative to limestone-treated plots, either rate of Ca/Mg-silicates soil amendment significantly increased the pooled mean canopy density index.
Perennial ryegrass canopy density was influenced by a three-way interaction of soil conditioner, wear treatment, and time from initial treatment (Table 4). Relative to limestone-treated plots one year after experiment initiation, wear-treated plots receiving the high annual soil conditioner rate (2440 kg ha−1 Ca/Mg-silicates) showed significantly greater canopy density than worn limestone-treated plots on two of the first six observation dates (Figure 6). There were only four sampling dates in 2011 when silicate treatment(s) significantly improved canopy density relative to lime, represented by the 1220 or 2440 kg (ha year)−1 treatments equally.
In 2012, plots receiving the 1220 kg (ha year)−1 treatment showed significantly greater canopy density than the limed counterparts on three sampling dates (Figure 6). Plots treated by 2440 kg (ha year)−1 Ca/Mg-silicates showed significantly greater canopy density than the limed counterparts on only one sampling date in 2012 (Figure 6). Excessive precipitation in late July and early August of 2012 precluded wear simulation > 770 DAIT. As a result, canopy density indices of worn plots approached that of non-trafficked plots regardless of granular soil conditioner treatment.

4. Discussion

4.1. Soil Chemistry/Conditioning

Ca/MgSiO3-based soil conditioners are liming agents with calcium carbonate equivalency ranging from 55–80%. These results showed either rate of Ca/Mg-silicate-based amendment to neutralize soil acidity and raise surface and sub-surface soil pH as effectively as the blended-limestone treatment, but not to the extent reported by others [10].
Similar to other evaluations of pelletized silicate conditioners, extractable soil Si levels increased in response to Si loading [10,11,12,13]. For example, nine weeks following incorporation into a Hagerstown soil having a baseline acetic acid extractable Si level of 70 mg kg−1, pelletized CaSiO3 application rates of 0.5, 1, 2, 5, or 10 Mg ha−1 resulted in respective 35, 43, 100, 225, or 330 mg kg−1 increases in acetic acid extractable soil Si level [10]. Likewise, in Kansas, split applications of 0, 2.44, or 4.88 Mg CaSiO3 (ha year)−1 to tall fescue field plots having a baseline extractable Si level of 169 mg kg−1 resulted in two-year mean soil Si increases of 87 or 152 mg Si kg−1 over the control plots [12]. Split applications of 0, 2.44, or 4.88 Mg CaSiO3 (ha year)−1 to creeping bentgrass plots on a Kansas golf course putting green nursery having a baseline extractable Si level of 3 mg kg−1 resulted in two-year mean soil Si increases of 28 or 58 mg Si kg−1 over the control plots [12]. Therefore, when similar granular silicate conditioners were applied at identical rates to a variety of turfgrass systems in different regions, 0.5 M acetic acid extracted a wide-array of soil Si concentrations over time.
This is consistent with the results presented here. By 21 MAIT, the 2440 kg (ha year)−1 treatment plots had received a cumulative total of 3900 kg ha−1 Ca/Mg-SiO3, whereas the remaining 1220 kg (ha year)−1 treatment plots had received an accumulated 2440 kg ha−1 of their respective soil conditioner treatments. Yet, differences in 0 to 16 cm deep soil extractable Si of plots treated by 0 vs 2440 or 3900 kg ha−1 Ca/Mg-silicates amounted to only 22 or 46 mg kg−1 respectively. Four months later (25 MAIT), mean differences in the same depth of soil extractable Si, amounted to 38 or 73 mg kg−1 respectively. These findings indicate a fractional, or incomplete, extraction of Si from soil Ca/Mg-SiO3 by the 0.5 M acetic acid method.

4.2. Turfgrass Vigor, Silica Assimilation, and Nutrition

The Ca/Mg-silicates amendment contained 1.8% Fe and 0.5% Mn (Table 1), and no maintenance applications of micronutrient fertilizer were made in support of this perennial ryegrass system established to an organic matter-rich rootzone. While all treatment means concentrations of leaf Fe (478 to 578 mg kg−1) and leaf Mn (68 to 86 mg kg−1) reside within their respective sufficiency ranges, cool-season turfgrass canopy dark green color has shown direct relation to leaf Fe and Mn concentration across either data range [37]. Specifically, in this study, perennial ryegrass treated by the high Ca/Mg-SiO3 rate resulted in leaf Fe and Mn levels significantly greater than levels treated by 1220 kg (ha year)−1 limestone (data not shown). Accordingly, future investigations of turfgrass response to Ca/Mg-silicates should standardize deliveries of these influential micronutrients.
Given the ubiquity of Si in soil and the disparity between the density of dry leaf tissue and dry soil, the justification for measuring clipping yield and silicon concentration of only non-trafficked plots was to prevent tissue contamination by soil. A seemingly worthwhile measure; presuming Si uptake by the turfgrass plant and Si distribution throughout the plant is independent of imposed wear stress. At the time the described experiment was conducted, we were unaware of any evidence to the contrary.
Subsequent findings indicate Si uptake and accumulation in tall fescue is induced by damage imposed using a metal file [38]. In a greenhouse study conducted using three tall fescue cultivars, mechanical injury induced an increase in leaf Si content of ≅5.2 to 6.6 g kg−1 (significant at a 0.05 alpha level). While such leaf concentrations hardly impart a hyper-Si-accumulator categorization to tall fescue, they do exceed leaf Si concentrations observed in the perennial ryegrass field plots.
Under non-trafficked conditions, the annual Ca/Mg-silicate applications of 1220 or 2440 kg ha−1 increased mean leaf Si 1.7 to 2.5 g kg−1 relative to plots receiving equal doses of plant-essential macronutrients. These significant increases in leaf Si content concur with recent turfgrass literature describing gains of 0.3 to 4.5 g leaf Si kg−1 by applications of 1 to 5 Mg pelletized Mg/CaSiO3 ha−1 [12,13,14,15]. However, experimental and temporal variability preclude the authors from reporting a critical threshold concentration of leaf Si for improved perennial ryegrass wear tolerance. Future efforts towards this end should sample tissue of plots receiving wear treatment, rather than adjacent, non-worn proxies.

4.3. Turfgrass Traffic/Wear Tolerance

Significant reduction in turfgrass canopy quality, ranging from 0.04 to 0.1 NDVI units, resulted from imposed wear treatments. This is a lesser degree than described in other reports of field research that employed a unique wear simulation device and protocol. Trenholm et al. [14] showed simulated wear treatment to reduce the NDVI of seashore paspalum field plots by 0.08 to 0.12 units. In similar field studies evaluating traffic injury to established cultivars of seashore paspalum or bermudagrass, wear treatment reduced NDVI by 0.09 to 0.23 units [39].
In conclusion, direct field measures of perennial ryegrass canopy density showed significant reduction resulted from systematic wear treatment. Yet in combination with the described wear treatment, split applications of granular Ca/Mg-silicates at 1220 or 2440 kg (ha year)–1 significantly improved canopy density relative to blended-limestone treatment. While this significant difference was constrained to <0.01 NDVI units, these field results identify a beneficial response of perennial ryegrass to applications of silicate-rich soil conditioners. When taken into consideration with results of similar studies [10,26], these findings indicate potential benefit(s) of ensuring soil Si availability to maintained perennial ryegrass and warrant further field investigation under intensified wear regimes.

Author Contributions

Conceptualization, validation, writing—review and editing, D.T.P., M.J.S., and W.U.; methodology, formal analysis, M.J.S. and D.T.P.; funding acquisition, supervision, project administration, M.J.S. and W.U.; data curation, and writing—original draft preparation, D.T.P.

Funding

This research was funded by Harsco Minerals Intl. (Sarver, PA), the USDA National Institute of Food and Agriculture and Hatch Appropriations under Project #PEN04592 and Accession #1006804, and The Pennsylvania Turfgrass Council.

Acknowledgments

The authors are also indebted to Kyle Hivner and associated personnel in the Center for Turfgrass Science at the Pennsylvania State University for their technical support of the described research.

Conflicts of Interest

The authors declare no conflict of interest. The funders had no role in the design of the study; in the collection, analyses, or interpretation of data; in the writing of the manuscript, or in the decision to publish the results.

References

  1. Poldervaart, A. Chemistry of the Earth’s crust. Geol. S. Am. S. 1955, 62, 119–144. [Google Scholar]
  2. Hodson, M.J.; White, P.J.; Mead, A.; Broadley, M.R. Phylogenetic variation in the silicon composition of plants. Ann. Bot. 2005, 96, 1027–1046. [Google Scholar] [CrossRef]
  3. Kumar, S.; Soukup, M.; Elbaum, R. Silicification in grasses: Variation between different cell types. Front. Plant Sci. 2017, 8, 438. [Google Scholar] [CrossRef]
  4. Soukup, M.; Martinka, M.; Cigáň, M.; Ravaszová, F.; Lux, A. New method for visualization of silica phytoliths in Sorghum bicolor roots by fluorescence microscopy revealed silicate concentration-dependent phytolith formation. Planta 2014, 240, 1365–1372. [Google Scholar] [CrossRef]
  5. Liang, Y.; Nikolic, M.; Bélanger, R.R.; Gong, H.; Song, A. Silicon in Agriculture: From Theory to Practice; Dordrecht-Springer: Dordrecht, The Netherlands, 2015; pp. 138–215. [Google Scholar]
  6. Lux, A.; Luxová, M.; Abe, J.; Morita, S.; Inanaga, S. Silicification of bamboo (Phyllostachys heterocycla Mitf.) root and leaf. Plant Soil 2003, 255, 85–91. [Google Scholar] [CrossRef]
  7. Guntzer, F.; Keller, C.; Poulton, P.R.; Mcgrath, S.P.; Meunier, J.-D. Long-term removal of wheat decreases soil amorphous silica at Broadbalk, Rothamsted. Plant Soil 2012, 352, 173–184. [Google Scholar] [CrossRef]
  8. Korndorfer, G.H.; Snyder, G.H.; Ulloa, M.; Powell, G.; Datnoff, L.E. Calibration of soil and plant silicon analysis for rice production. J. Plant Nutr. 2001, 24, 1071–1084. [Google Scholar] [CrossRef]
  9. Barbosa-Filho, M.P.; Snyder, G.H.; Elliot, C.L.; Datnoff, L.E. Evaluation of soil test procedures for determining rice-available silicon. Commun. Soil Sci. Plant Anal. 2001, 32, 1779–1792. [Google Scholar] [CrossRef]
  10. Nanayakkara, U.N.; Uddin, W.; Datnoff, L.E. Application of silicon sources increases silicon accumulation in perennial ryegrass turf on two soil types. Plant Soil 2008, 303, 83–94. [Google Scholar] [CrossRef]
  11. Datnoff, L.E.; Rutherford, B.A. Accumulation of silicon by bermudagrass to enhance disease suppression of leaf spot and melting out. USGA TERO 2003, 2, 1–8. [Google Scholar]
  12. Zhang, Q.; Fry, J.; Lowe, K.; Tisserat, N. Evaluation of calcium silicate for brown patch and dollar spot suppression on turfgrasses. Crop Sci. 2006, 46, 1635–1643. [Google Scholar] [CrossRef]
  13. Bae, E.J.; Kim, C.Y.; Yoon, J.H.; Lee, K.S.; Park, Y.B. Effect of silicate fertilizer application on zoysiagrass (Zoysia japonica Steud.) field. Weed Turfgrass Sci. 2018, 7, 247–257. [Google Scholar] [CrossRef]
  14. Trenholm, L.E.; Duncan, R.R.; Carrow, R.N.; Snyder, G.H. Influence of silica on growth, quality, and wear tolerance of seashore paspalum. J. Plant Nutr. 2001, 24, 245–259. [Google Scholar] [CrossRef]
  15. Redmond, C.T.; Potter, D.A. Silicon fertilization does not enhance creeping bentgrass resistance to cutworms and white grubs. Appl. Turfgrass Sci. 2006. [Google Scholar] [CrossRef]
  16. Uriarte, R.F.; Shew, H.D.; Bowman, D.C. Effect of soluble silica on brown patch and dollar spot of creeping bentgrass. J. Plant Nutr. 2004, 27, 325–339. [Google Scholar] [CrossRef]
  17. Moody, P.W.; Edwards, D.G.; Bell, L.C. Effect of banded fertilizers on soil solution composition and short-term root-growth.2. Mono-ammonium and di-ammonium phosphates. Soil Res. 1995, 33, 689–707. [Google Scholar] [CrossRef]
  18. Schlossberg, M.J.; Waltz, F.C.; Landschoot, P.J.; Park, B. Recent mechanical cultivation of lawns enhances lime application efficacy. Agron. J. 2008, 100, 855–861. [Google Scholar] [CrossRef]
  19. Soukup, M.; Martinka, M.; Bosnić, D.; Čaplovičová, M.; Elbaum, R.; Lux, A. Formation of silica aggregates in sorghum root endodermis is pre-determined by cell wall architecture and development. Ann. Bot. 2017, 120, 739–753. [Google Scholar] [CrossRef]
  20. Canaway, P.M. Wear tolerance of turfgrass species. J. Sports Turf Res. Inst. 1981, 57, 65–83. [Google Scholar]
  21. Beard, J.B. Turfgrass Science and Culture; Prentice Hall: Englewood Cliffs, NJ, USA, 1973; pp. 368–465. [Google Scholar]
  22. Salmén, L. Wood morphology and properties from molecular perspectives. Ann. For. Sci. 2015, 72, 679–684. [Google Scholar] [CrossRef]
  23. He, C.; Wang, L.; Liu, J.; Liu, X.; Li, X.; Ma, J.; Lin, Y.; Xu, F. Evidence for ‘silicon’ within the cell walls of suspension-cultured rice cells. New Phytol. 2013, 200, 700–709. [Google Scholar] [CrossRef] [PubMed]
  24. Fauteux, F.; Rémus-Borel, W.; Menzies, J.G.; Bélanger, R.R. Silicon and plant disease resistance against pathogenic fungi. FEMS Microbiol. Lett. 2005, 249, 1–6. [Google Scholar] [CrossRef] [PubMed] [Green Version]
  25. Rahman, A.; Wallis, C.M.; Uddin, W. Silicon-induced systemic defense responses in perennial ryegrass against infection by Magnaporthe oryzae. Phytopathology 2015, 105, 748–757. [Google Scholar] [CrossRef] [PubMed]
  26. Nanayakkara, U.N.; Uddin, W.; Datnoff, L.E. Effects of soil type, source of silicon, and rate of silicon source on development of gray leaf spot of perennial ryegrass turf. Plant Dis. 2008, 92, 870–877. [Google Scholar] [CrossRef] [PubMed]
  27. Suzuki, S.; Ma, J.F.; Yamamoto, N.; Hattori, T.; Sakamoto, M.; Umezawa, T. Silicon deficiency promotes lignin accumulation in rice. Plant Biotechnol. 2012, 29, 391–394. [Google Scholar] [CrossRef] [Green Version]
  28. Yamamoto, T.; Nakamura, A.; Iwai, H.; Ishii, T.; Ma, J.F.; Yokoyama, R.; Nishitani, K.; Satoh, S.; Furukawa, J. Effect of silicon deficiency on secondary cell wall synthesis in rice leaf. J. Plant Res. 2012, 125, 771–779. [Google Scholar] [CrossRef] [PubMed] [Green Version]
  29. Kido, N.; Yokoyama, R.; Yamamoto, T.; Furukawa, J.; Iwai, H.; Satoh, S.; Nishitani, K. The matrix polysaccharide (1;3,1;4)-b-d-glucan is involved in silicon dependent strengthening of rice cell wall. Plant Cell Physiol. 2015, 56, 268–276. [Google Scholar] [CrossRef]
  30. Cockerham, S.T.; Brinkman, D.J. A simulator for cleated-shoe sports traffic on turfgrass research plots. Calif. Turfgrass Cult. 1989, 39, 9–12. [Google Scholar]
  31. Rogan, C.M.; Schlossberg, M.J. Complimenting late-season nitrogen fertilization of cool-season turfgrass putting greens with trinexapac-ethyl. Agron. J. 2013, 105, 1507–1514. [Google Scholar] [CrossRef]
  32. Moody, D.R.; Schlossberg, M.J.; Archibald, D.D.; McNitt, A.S.; Fidanza, M.A. Soil water repellency development in amended sand rootzones. Crop Sci. 2009, 49, 1885–1892. [Google Scholar] [CrossRef]
  33. Guntzer, F.; Keller, C.; Meunier, J.D. Determining silicon concentration in plant material using Tiron extraction. New Phytol. 2010, 188, 902–906. [Google Scholar] [CrossRef] [PubMed]
  34. Karcher, D.E.; Richardson, M.D. Quantifying turfgrass color using digital image analysis. Crop Sci. 2003, 43, 943–951. [Google Scholar] [CrossRef]
  35. Zhu, Q.; Schlossberg, M.J.; Bryant, R.B.; Schmidt, J.P. Creeping bentgrass putting green response to foliar nitrogen fertilization. Agron. J. 2012, 104, 1589–1594. [Google Scholar] [CrossRef]
  36. Carrow, R.N.; Waddington, D.V.; Rieke, P.E. Turfgrass Soil Fertility and Chemical Problems: Assessment & Management; John Wiley & Sons: Hoboken, NJ, USA, 2001; pp. 16–348. [Google Scholar]
  37. Schlossberg, M.J.; Schmidt, J.P. Influence of nitrogen rate and form on quality of putting greens cohabited by creeping bentgrass and annual bluegrass. Agron. J. 2007, 99, 99–106. [Google Scholar] [CrossRef]
  38. McLarnon, E.; McQueen-Mason, S.; Lenk, I.; Hartley, S.E. Evidence for active uptake and deposition of Si-based defenses in tall fescue. Front. Plant Sci. 2017, 8, 1199. [Google Scholar] [CrossRef] [PubMed]
  39. Trenholm, L.E.; Duncan, R.R.; Carrow, R.N. Wear tolerance, shoot performance, and spectral reflectance of seashore paspalum and bermudagrass. Crop Sci. 1999, 39, 1147–1152. [Google Scholar] [CrossRef]
Figure 1. Cumulative granular soil conditioner type and annual application rate (ha−1), by months after initial treatment (MAIT).
Agronomy 09 00578 g001
Figure 2. Soil chemical parameters of treated perennial ryegrass rootzones. (A) Mean soil pH (1:1 soil: H2O) by soil conditioner treatment (ha year)−1 and soil depth. (B) Mean acetic acid (0.5 M) extractable soil silicon by soil conditioner treatment (ha year)−1 and soil depth. For soil depth(s) specified, error bars depict least significant difference (LSD, alpha = 0.05) from blended-limestone treatment.
Agronomy 09 00578 g002
Figure 3. Soil chemical parameters of treated perennial ryegrass by rootzone depth. (A) Mean 0 to 8 cm depth or (B) 8 to 16 cm depth acetic acid (0.5 M) extractable soil silicon by soil conditioner treatment (ha year)–1 and month after initial treatment (MAIT). For MAIT specified, error bars depict least significant difference (LSD, alpha = 0.05) from blended-limestone treatment.
Agronomy 09 00578 g003
Figure 4. (A) Leaf silicon concentration by soil conditioner treatment (ha year)−1 and month after initial treatment (MAIT). (B) Clipping silicon uptake by soil conditioner treatment (ha year)−1 and MAIT. For MAIT specified, error bars depict least significant difference (LSD, alpha = 0.05) from blended-limestone treatment.
Agronomy 09 00578 g004
Figure 5. Experiment-wide mean (A) canopy color and (B) canopy density as influenced by interaction of soil conditioner application rate (ha year)−1 and main-plot wear treatment. Error bars depict the least significant difference (LSD, alpha = 0.05) from blended-limestone treatment.
Agronomy 09 00578 g005
Figure 6. Perennial ryegrass canopy density as influenced by interaction of main-plot wear treatment, soil conditioner application rate (ha year)−1, and respective days after initial treatment of the latter. Error bars depict least significant difference (LSD, alpha = 0.05) from plots receiving a combination of 1220 kg Ca/MgCO3 (ha year)–1 and main-plot wear/traffic treatment.
Agronomy 09 00578 g006
Table 1. Guaranteed analysis of granular soil conditioners (per manufacturers’ labels).
Soil ConditionerCaCuFeMgMnSiCaCO3 Equivalent
g kg−1
Harsco Minerals Ca/MgSiO3240518605250790
OldCastle pelletized Ca/MgCO326560940
Table 2. ANOVA of perennial ryegrass rootzone soil pH and extractable silicon levels, by soil depth and source.
0 to 8 cm0 to 8 cm8 to 16 cm8 to 16 cm
SourcedfSoil pHExtractable SiSoil pHExtractable Si
P (F-ratio < Fcrit)
Conditioner treatment (TRT)20.757<0.0010.884<0.001
Month after treatment (MAT)3<0.001<0.001<0.001<0.001
TRT × MAT60.279<0.0010.5120.001
Table 3. ANOVA of perennial ryegrass shoot growth/vigor and silicon accumulation, and separation of experiment-wide means (pooled over repeated collections) where main effects were significant.
SourcedfClipping YieldLeaf SiSi Uptake
P (F-ratio < Fcrit)
Conditioner treatment (TRT)20.078<0.001<0.001
Month after initial treatment (MAIT)5<0.001<0.001<0.001
TRT × MAIT100.7610.0180.002
Conditioner treatment, (ha year)–1 kg ha−1g kg−1g ha−1
1220 kg Ca/Mg-SiO3 26.068.91235.6
2440 kg Ca/Mg-SiO3 27.579.73272.6
1220 kg Ca/Mg-CO3 25.237.19183.2
Least significant difference, alpha = 0.05 0.5530.16
Table 4. ANOVA of perennial ryegrass canopy dark green color index (DGCI) and density (normalized differential vegetative index, NDVI) by source.
SourcedfCanopy ColorCanopy Density
P (F-ratio < Fcrit)
Wear1<0.001<0.001
Conditioner treatment (TRT)20.0170.114
Wear × TRT20.0590.029
Days after initial treatment (DAIT)23<0.001<0.001
Wear × DAIT23<0.001<0.001
TRT × DAIT46<0.0010.016
Wear × TRT × DAIT460.068<0.001

