A Comparison of Nitrogen Transfer and Transformation in Traditional Farming and the Rice–Duck Farming System by 15N Tracer Method


 and
and
Abstract
1. Introduction
2. Materials and Methods
2.1. Study Site
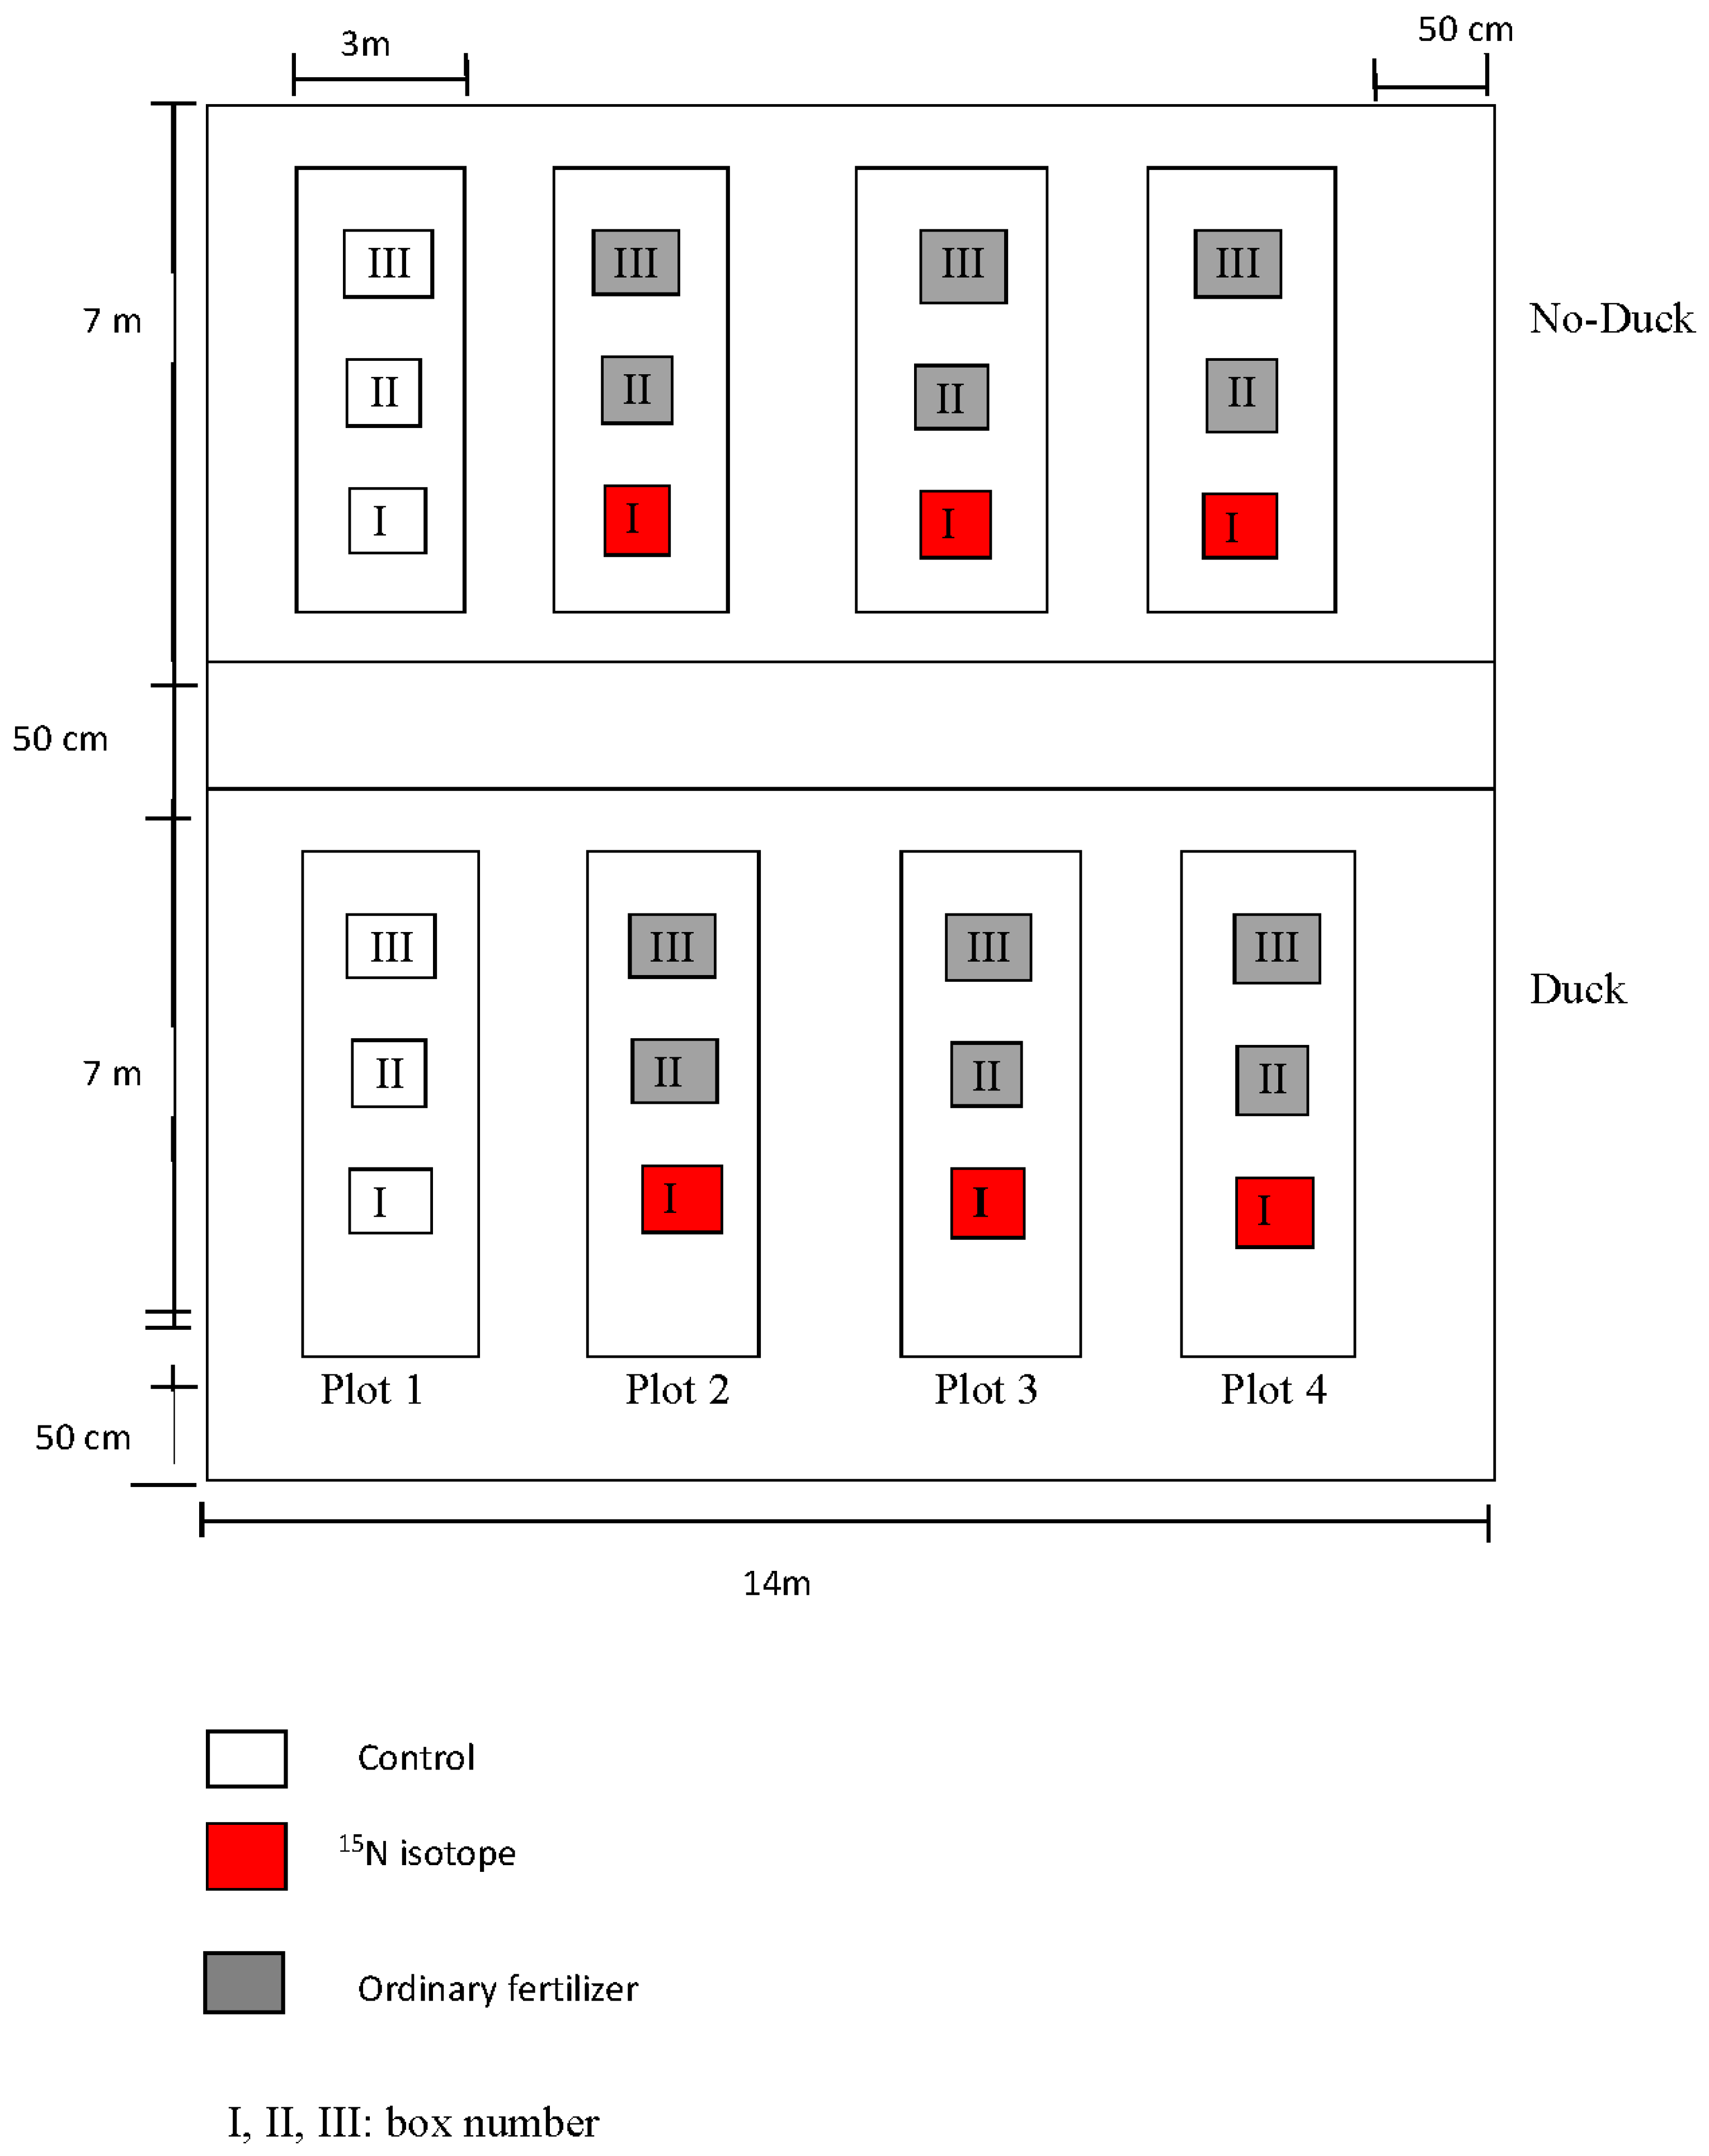
2.2. Experimental Design and Operation
2.3. Sampling and Measurement
2.4. Calculation
2.5. Statistical Analysis
3. Results and Discussion
3.1. Effect of Duck Presence on Rice Plant Growth
3.2. Effects of Organic Fertilizer in the Field
3.3. Total 15N Content
3.4. Fresh Grain 15N, Husk 15N Content, N Uptake, and N Use Efficiency
4. Conclusions
Author Contributions
Funding
Acknowledgments
Conflicts of Interest
Abbreviations
| 15N | Nitrogen-15 |
| P | Phosphorus |
| NH4-N | ammonium nitrogen |
| NO3-N | nitrate nitrogen |
Appendix A

| Duck Presence | Treatment | Plot No | Grain (Small Bag) (g) | Husk (Small Bag) (g) | Rice (Large Bag) (kg) |
|---|---|---|---|---|---|
| Duck | CK | 1 | 78.62 | 19.32 | 7.75 |
| CF | 2 | 63.60 | 15.10 | 5.00 | |
| CM | 3 | 85.45 | 21.07 | 12.80 | |
| CD | 4 | 86.74 | 24.63 | 12.95 | |
| No-duck | CK | 1 | 77.15 | 19.72 | 14.45 |
| CF | 2 | 71.68 | 17.96 | 15.50 | |
| CM | 3 | 75.91 | 20.52 | 20.25 | |
| CD | 4 | 73.41 | 21.66 | 16.55 |
| Duck Presence | Treatment | Yield Components | ||
|---|---|---|---|---|
| Grain (kg/ha) | Husk (kg/ha) | Rice (kg/ha) | ||
| Duck | CK | 2961.963 | 728.037 | 3690 |
| CF | 1923.278 | 456.484 | 2380 | |
| CM | 4888.7995 | 1205.591 | 6095 | |
| CD | 4802.08 | 1363.30 | 6166 | |
| No-duck | CK | 5479.232 | 1400.08 | 6880 |
| CF | 5901.048 | 1478.214 | 7380 | |
| CM | 7590.1824 | 2050.8534 | 9642 | |
| CD | 6084.148 | 1795.064 | 7880 | |
References
- Zhang, Q.F. Stategies for developing Green Super Rice. Proc. Natl. Acad. Sci. USA 2007, 104, 16402–16409. [Google Scholar] [CrossRef] [PubMed]
- Huang, J.; Gao, J.S.; Cao, W.D.; Zhang, Y.Z. Effect of Chinese milk vetch in winter on rice yield and its nutrient uptake. Soil Fertil. Sci. China 2013, 1, 88–92, (In Chinese with English abstract). [Google Scholar]
- Tong, C.; Hall, C.A.S.; Wang, H. Land use change in rice, wheat and maize production in China (1961–1998). Agric. Ecosyst. Environ. 2003, 95, 523–536. [Google Scholar] [CrossRef]
- Zhu, Z.L.; Chen, D.L. Nitrogen fertilizer use in China-contributions to food production, impacts on the environment and best management strategies. Nutr. Cycl. Agroecosyst. 2002, 63, 117–127. [Google Scholar] [CrossRef]
- Bi, L.D.; Zhang, B.; Liu, G.G.; Li, Z.Z.; Liu, Y.R.; Ye, C.; Yu, X.C.; Lai, T.; Zhang, J.G.; Yin, J.M.; et al. Long-term effects of organic amendments on the rice yields for double rice cropping systems in subtropical China. Agric. Ecosyst. Environ. 2009, 129, 534–541. [Google Scholar] [CrossRef]
- Smith, L.E.; Siciliaono, G. A comprehensive review of constraints to improved management of fertilizers in China and mitigation of diffuse water pollution from agriculture. Agric. Ecosyst. Environ. 2015, 209, 15–25. [Google Scholar] [CrossRef]
- Ju, X.T.; Xing, G.X.; Chen, X.P.; Zhang, S.L.; Zhang, L.J.; Liu, X.J.; Cui, Z.L.; Yin, B.; Christiea, P.; Zhu, Z.L.; et al. Reducing environmental risk by improving N management in intensive Chinese agricultural systems. Proc. Natl. Acad. Sci. USA 2009, 106, 3041–3046. [Google Scholar] [CrossRef]
- Ghosh, B.C.; Bhat, R. Environmental hazards of nitrogen loading in wetland rice fields. Environ. Pollut. 1998, 102, 123–126. [Google Scholar] [CrossRef]
- Tian, Y.H.; Bin, Y.; Yang, L.Z.; Yin, S.X.; Zhu, Z.L. Nitrogen runoff and leaching losses during rice-wheat rotations in Taihu lake region, China. Pedosphere 2007, 17, 445–456. [Google Scholar] [CrossRef]
- Zhao, X.; Xie, Y.X.; Xiong, Z.Q.; Yan, X.Y.; Xing, G.X.; Zhu, Z.L. Nitrogen fate and environmental consequence in paddy soil under rice-wheat rotation in the Taihu lake region, China. Plant Soil 2009, 319, 225–234. [Google Scholar] [CrossRef]
- Yang, J.C.; Zhang, J.H. Crop management techniques to enhance harvest index in rice. J. Exp. Bot. 2010, 61, 3177–3189. [Google Scholar] [CrossRef] [PubMed]
- Tilman, D.; Cassman, K.G.; Matson, P.A.; Naylor, R.; Polasky, S. Agricultural sustainability and intensive production practices. Nature 2002, 418, 671–677. [Google Scholar] [CrossRef] [PubMed]
- Yousaf, M.; Fahad, S.; Shah, A.N.; Shaaban, M.; Khan, M.J.; Sabiel, S.A.I.; Ali, S.A.I.; Wang, Y.; Osman, K.A. The effect of nitrogen application rates and timings of first irrigation on wheat growth and yield. Int. J. Agric. Innov. Res. 2014, 2, 645–653. [Google Scholar]
- Xiong, G.Y.; Zhu, X.B. Preliminary discussion on the technique of the integrated rice-duck farming. Fodd. Ind. 2003, 24, 28–30. [Google Scholar]
- Takao, F. The Power of Duck: Integrated Rice and Duck Farming; Tagari Publications: Tasmania, Australia, 2001. [Google Scholar]
- Zhu, B.; Yi, L.X.; Hu, Y.G.; Zeng, Z.H.; Lin, C.W.; Tang, H.M. Nitrogen release from incorporated N-15-labelled Chinese milk vetch (Austragalus sinicus L.) residue and its dynamics in a double rice cropping system. Plant Soil 2014, 374, 331–344. [Google Scholar] [CrossRef]
- Zhang, J.; Zhang, J.E.; Qin, Z.; Fu, L.; Liang, K.M. Effect of integrated rice-duck farming on rice canopy structure index. Chin. J. Eco-Agric. 2012, 20, 1–6. [Google Scholar] [CrossRef]
- Zhang, J.E.; Quan, G.M.; Huang, Z.X.; Quan, G. Evidence of duck activity induced anatomical structure change and lodging resistance of rice plant. Agroecol. Sustain. Food Syst. 2013, 37, 975–984. [Google Scholar] [CrossRef]
- Saleh, M.; Seyyed, S.M. Effect of Ducks Present in the Rice Fields on Rice Grain Yield in Rice-Duck Cultivation. Adv. Biores. 2015, 6, 122–127. [Google Scholar] [CrossRef]
- Furuno, T. Significance and Practice of Integrated Rice Cultivation and Duck Farming-Sustainable Agriculture; Kyushu International Center, Japan International Cooperation Agency: Fukuoka, Japan; Kitakyushu Forum on Asian Women: Kitakyushu, Japan, 1996. [Google Scholar]
- Hemmatollah, P.; Mohsen, P.; Mahmood, M.; Mohammad, G.B.; Kamyar, M. Efficient use of energy through organic rice-duck mutualism system. Agron. Sustain. Dev. 2015, 35, 1489–1497. [Google Scholar] [CrossRef]
- Li, G.X.; Zhang, F.S. Composition of Solid Wastes and the Production of Organic Mixed Fertilizer; Chemistry Publishing House: Beijing, China, 2000; pp. 264–265. [Google Scholar]
- Xu, G.W.; Yang, L.N.; Zhang, H.; Wang, Z.Q.; Liu, L.J.; Yang, J.C. Absorption and utilization of nitrogen, phosphorus, and potassium in rice plants under site-specific nitrogen management and wheat-residue incorporation. Acta Agron. Sin. 2008, 34, 1424–1434. [Google Scholar] [CrossRef]
- Peng, S.B.; Buresh, R.J.; Huang, J.L.; Zhong, X.H.; Zou, Y.B.; Yang, J.C.; Wang, G.; Liu, Y.; Hu, R.; Tang, Q.; et al. Improving nitrogen fertilization in rice by site-specific N management. A review. Agron. Sustain. Dev. 2010, 30, 649–656. [Google Scholar] [CrossRef]
- Cao, Y.S.; Tian, Y.H.; Yin, B.; Zhu, Z.L. Assessment of ammonia volatilization from paddy fields under crop management practices aimed to increase grain yield and N efficiency. Field Crops Res. 2013, 147, 23–31. [Google Scholar] [CrossRef]
- Guo, J.H.; Liu, X.J.; Zhang, Y.; Shen, J.L.; Han, W.X.; Zhang, W.F.; Christie, P.; Goulding, K.W.T.; Vitousek, P.M.; Zhang, F.S. Significant acidification in major Chinese croplands. Science 2010, 327, 1008–1010. [Google Scholar] [CrossRef] [PubMed]
- Huang, M.; Zhou, X.; Xie, X.; Zhao, C.; Chen, J.; Cao, F.; Zou, Y. Rice Yield and the Fate of fertilizer Nitrogen as Affected by Addition of Earthworm Casts Collected from Oilseed Rape Fields: A pot Experiment. PLoS ONE 2016, 11, e0167152. [Google Scholar] [CrossRef] [PubMed]
- Siavoshi, M.; Nasiri, A.; Laware, S. Effect of Organic Fertilizer on Growth and Yield Components in Rice (Oryza sativa L.). J. Agric. Sci. 2010, 3, 217. [Google Scholar] [CrossRef]
- Chen, Z.; Wang, H.; Liu, X.; Lu, D.; Zhou, J. The fates of 15N-labeled fertilizer in a wheat-soil system as influenced by fertilization practice in a loamy soil. Sci. Rep. 2016, 6, 34754. [Google Scholar] [CrossRef] [PubMed]
- Mubarak, A.; Rosenani, A.B.; Siti, Z.; Anuar, A.R. Balance of Applied 15N Labelled Ammonium Sulfate in Maize (Zea mays L.) Field. Jpn. J. Trop. Agric. 2001, 45, 176–180. [Google Scholar]


| Year | Site | Treatment | Fertilizers Applied per ha (kg·ha−1) | Fertilizers Applied (g·m−2) | 15N Applied (g·m−2) |
|---|---|---|---|---|---|
| 2017 | Ninghe | CK | Control with no fertilization | Control with no fertilization | Control with no fertilization |
| CF | N: 200 P: 90 K: 120 | Calcium superphosphate Ca(H2PO4)2: 124.8 Potassium sulfate (K2SO4): 186.584 Ammonium sulfate (NH4)2SO4: 754.2844 | (15NH4)2SO4 35.73 | ||
| CM | CF: N: 163, P: 67, K: 105 OF: N: 37, P: 23, K: 15 Organic fertilizer: 1194 | Ca(H2PO4)2: 92.74 K2SO4: 163.104 (NH4)2SO4: 616.5111 Organic fertilizer: 2507.4 | 29.03 | ||
| CD | CF: N: 114, P: 47, K: 74 OF: N: 37, P: 23, K: 15 Organic fertilizer: 1194 (Rapeseed) | Ca(H2PO4)2: 65.06 K2SO4: 115.064 (NH4)2SO4: 429.9333 Organic fertilizer: 2507.4 | 20.54 |
| Year (Location) | Duck Levels | pH | Total N (g·kg−1) | Total P (g·kg−1) | NH4-N (mg·kg−1) | NO3-N (mg·kg−1) | SMC (%) | SOM (g·kg−1) | Distribution of Soil Particles (%) | ||||||
|---|---|---|---|---|---|---|---|---|---|---|---|---|---|---|---|
| 0–20 cm | 20–40 cm | 0–20 cm | 20–40 cm | 0–20 cm | 20–40 cm | 0–20 cm | 20–40 cm | Clay | Silt | Sand | |||||
| 2017 (Ninghe) | Duck | 7.42 | 1.03 | 0.89 | 0.89 | 3.92 | 1.56 | 25.98 | 32.94 | 36.6 | 34.69 | 22.75 | 31.5 | 62.75 | 5.75 |
| No-duck | 7.47 | 0.92 | 0.91 | 0.90 | 2.23 | 2.01 | 35.65 | 26.15 | 36.9 | 34.96 | 19.59 | 35.25 | 55.75 | 9 | |
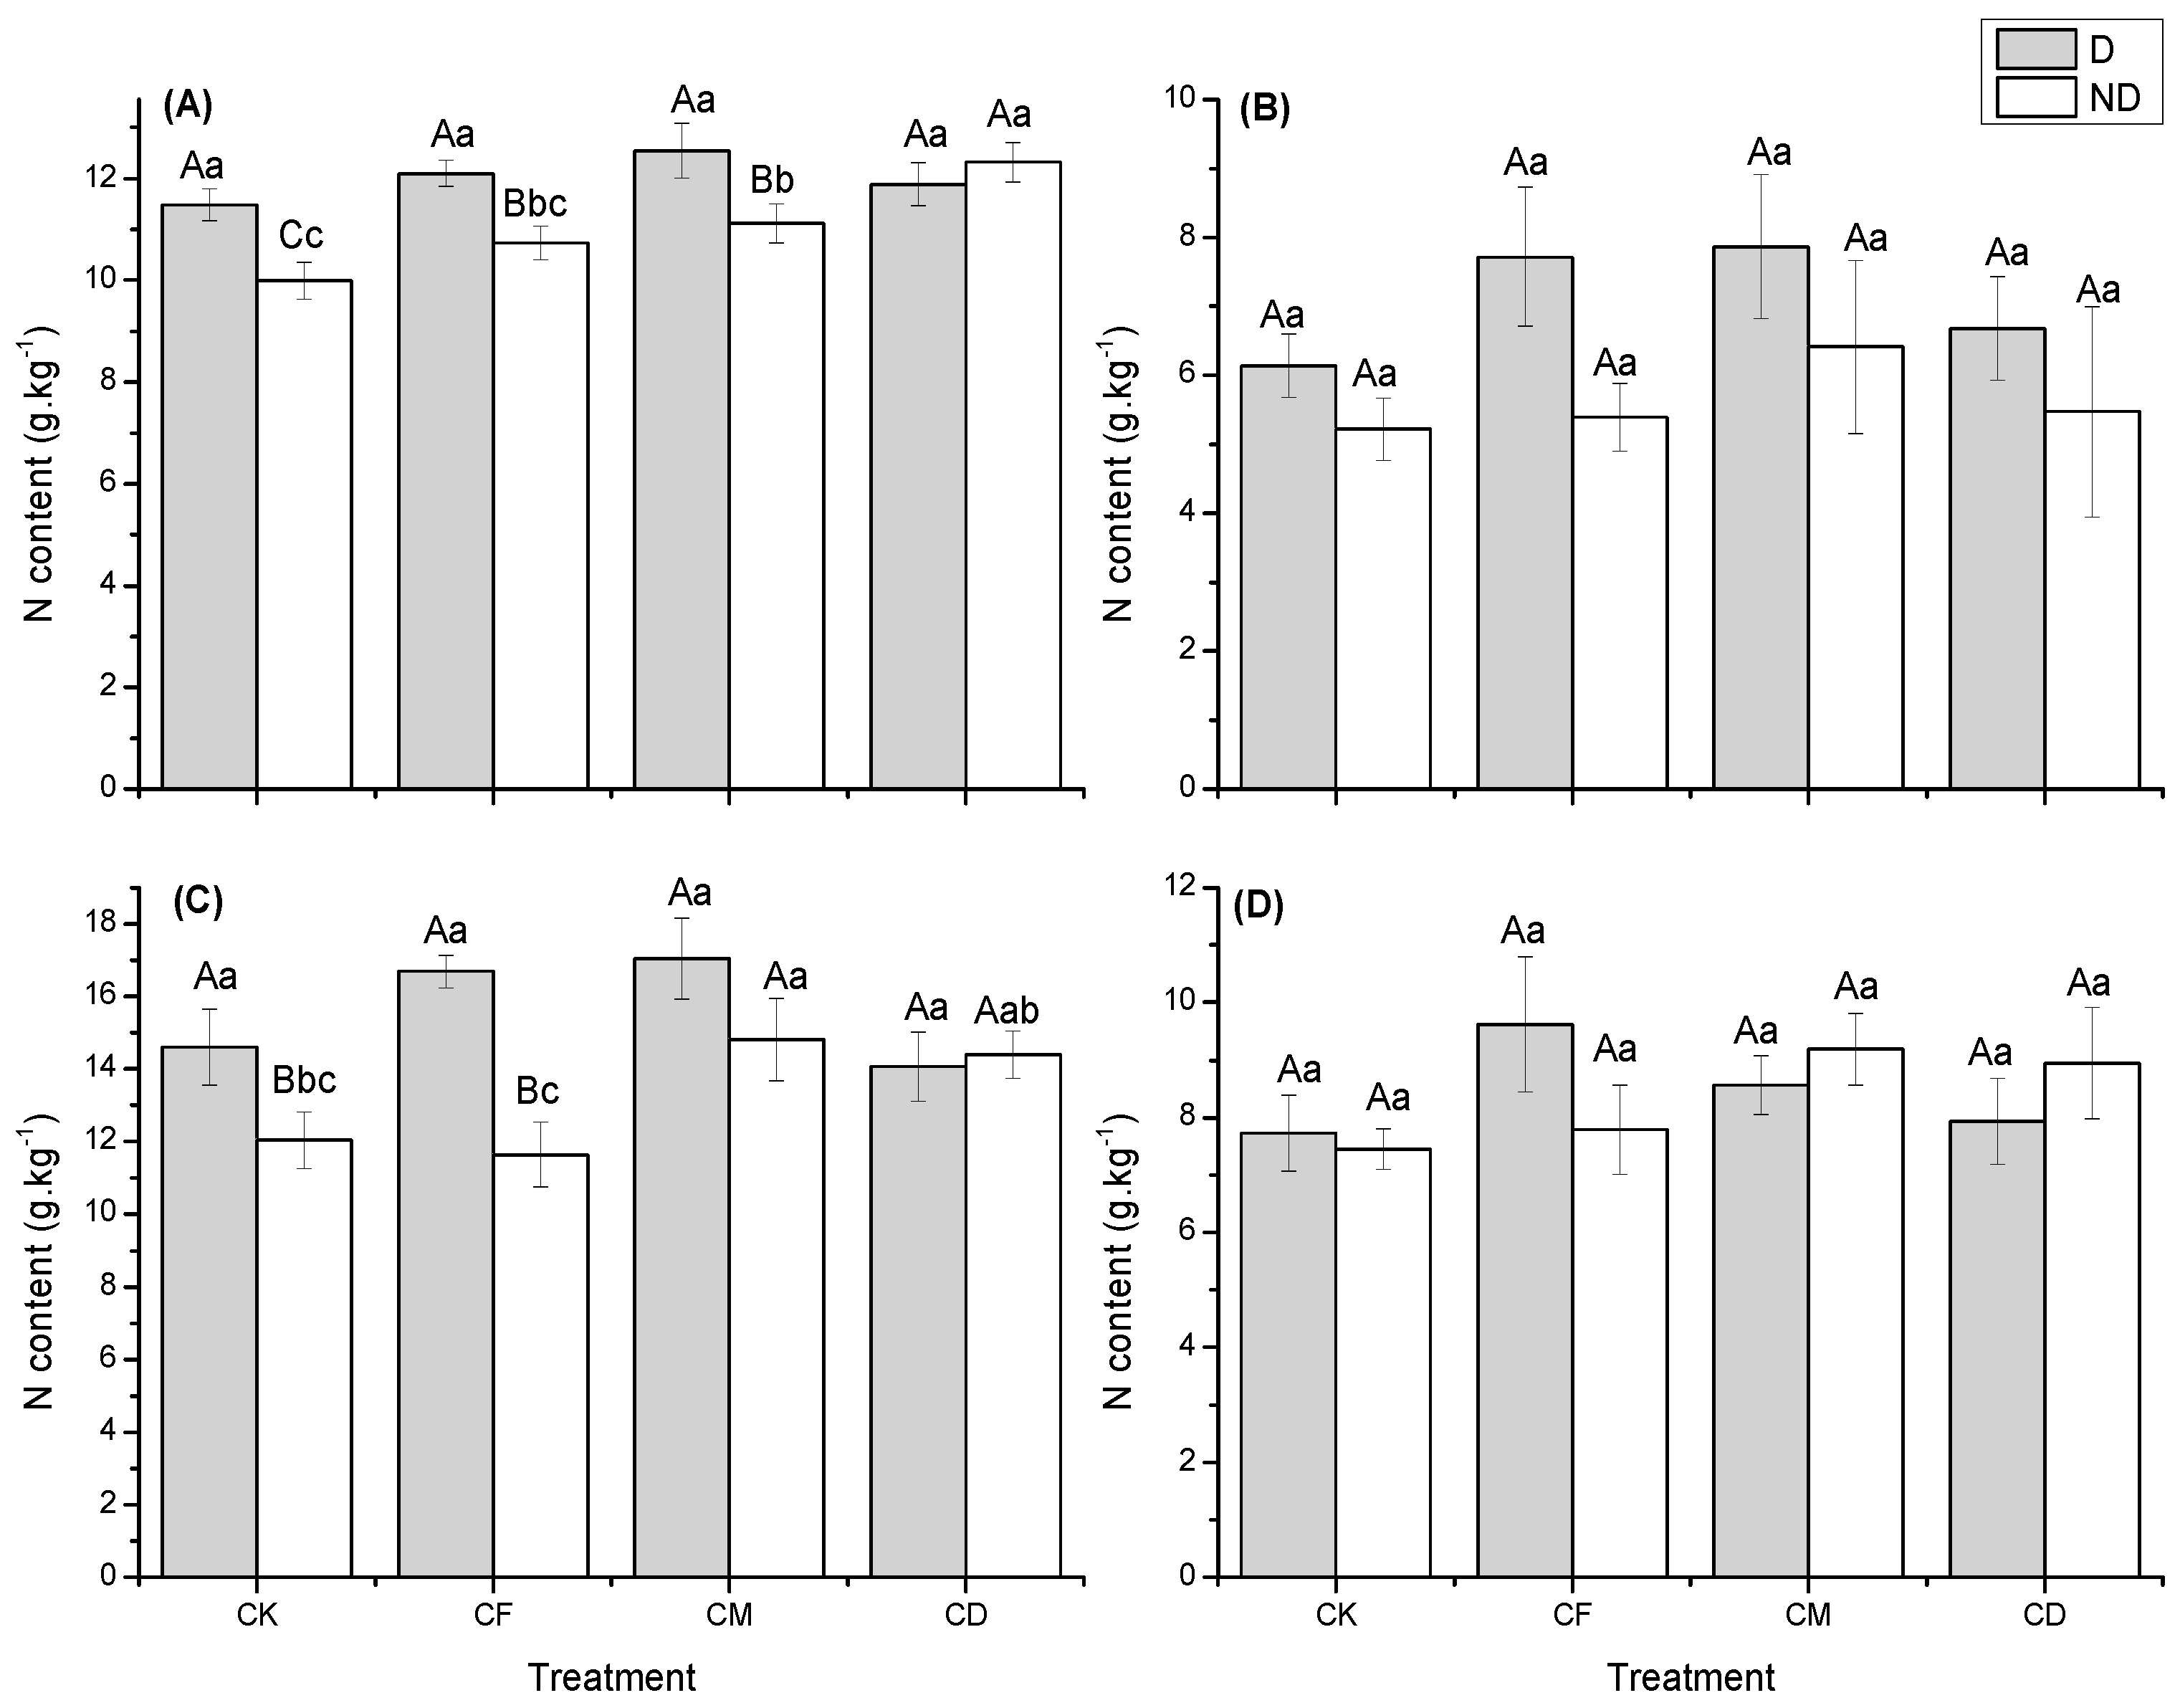
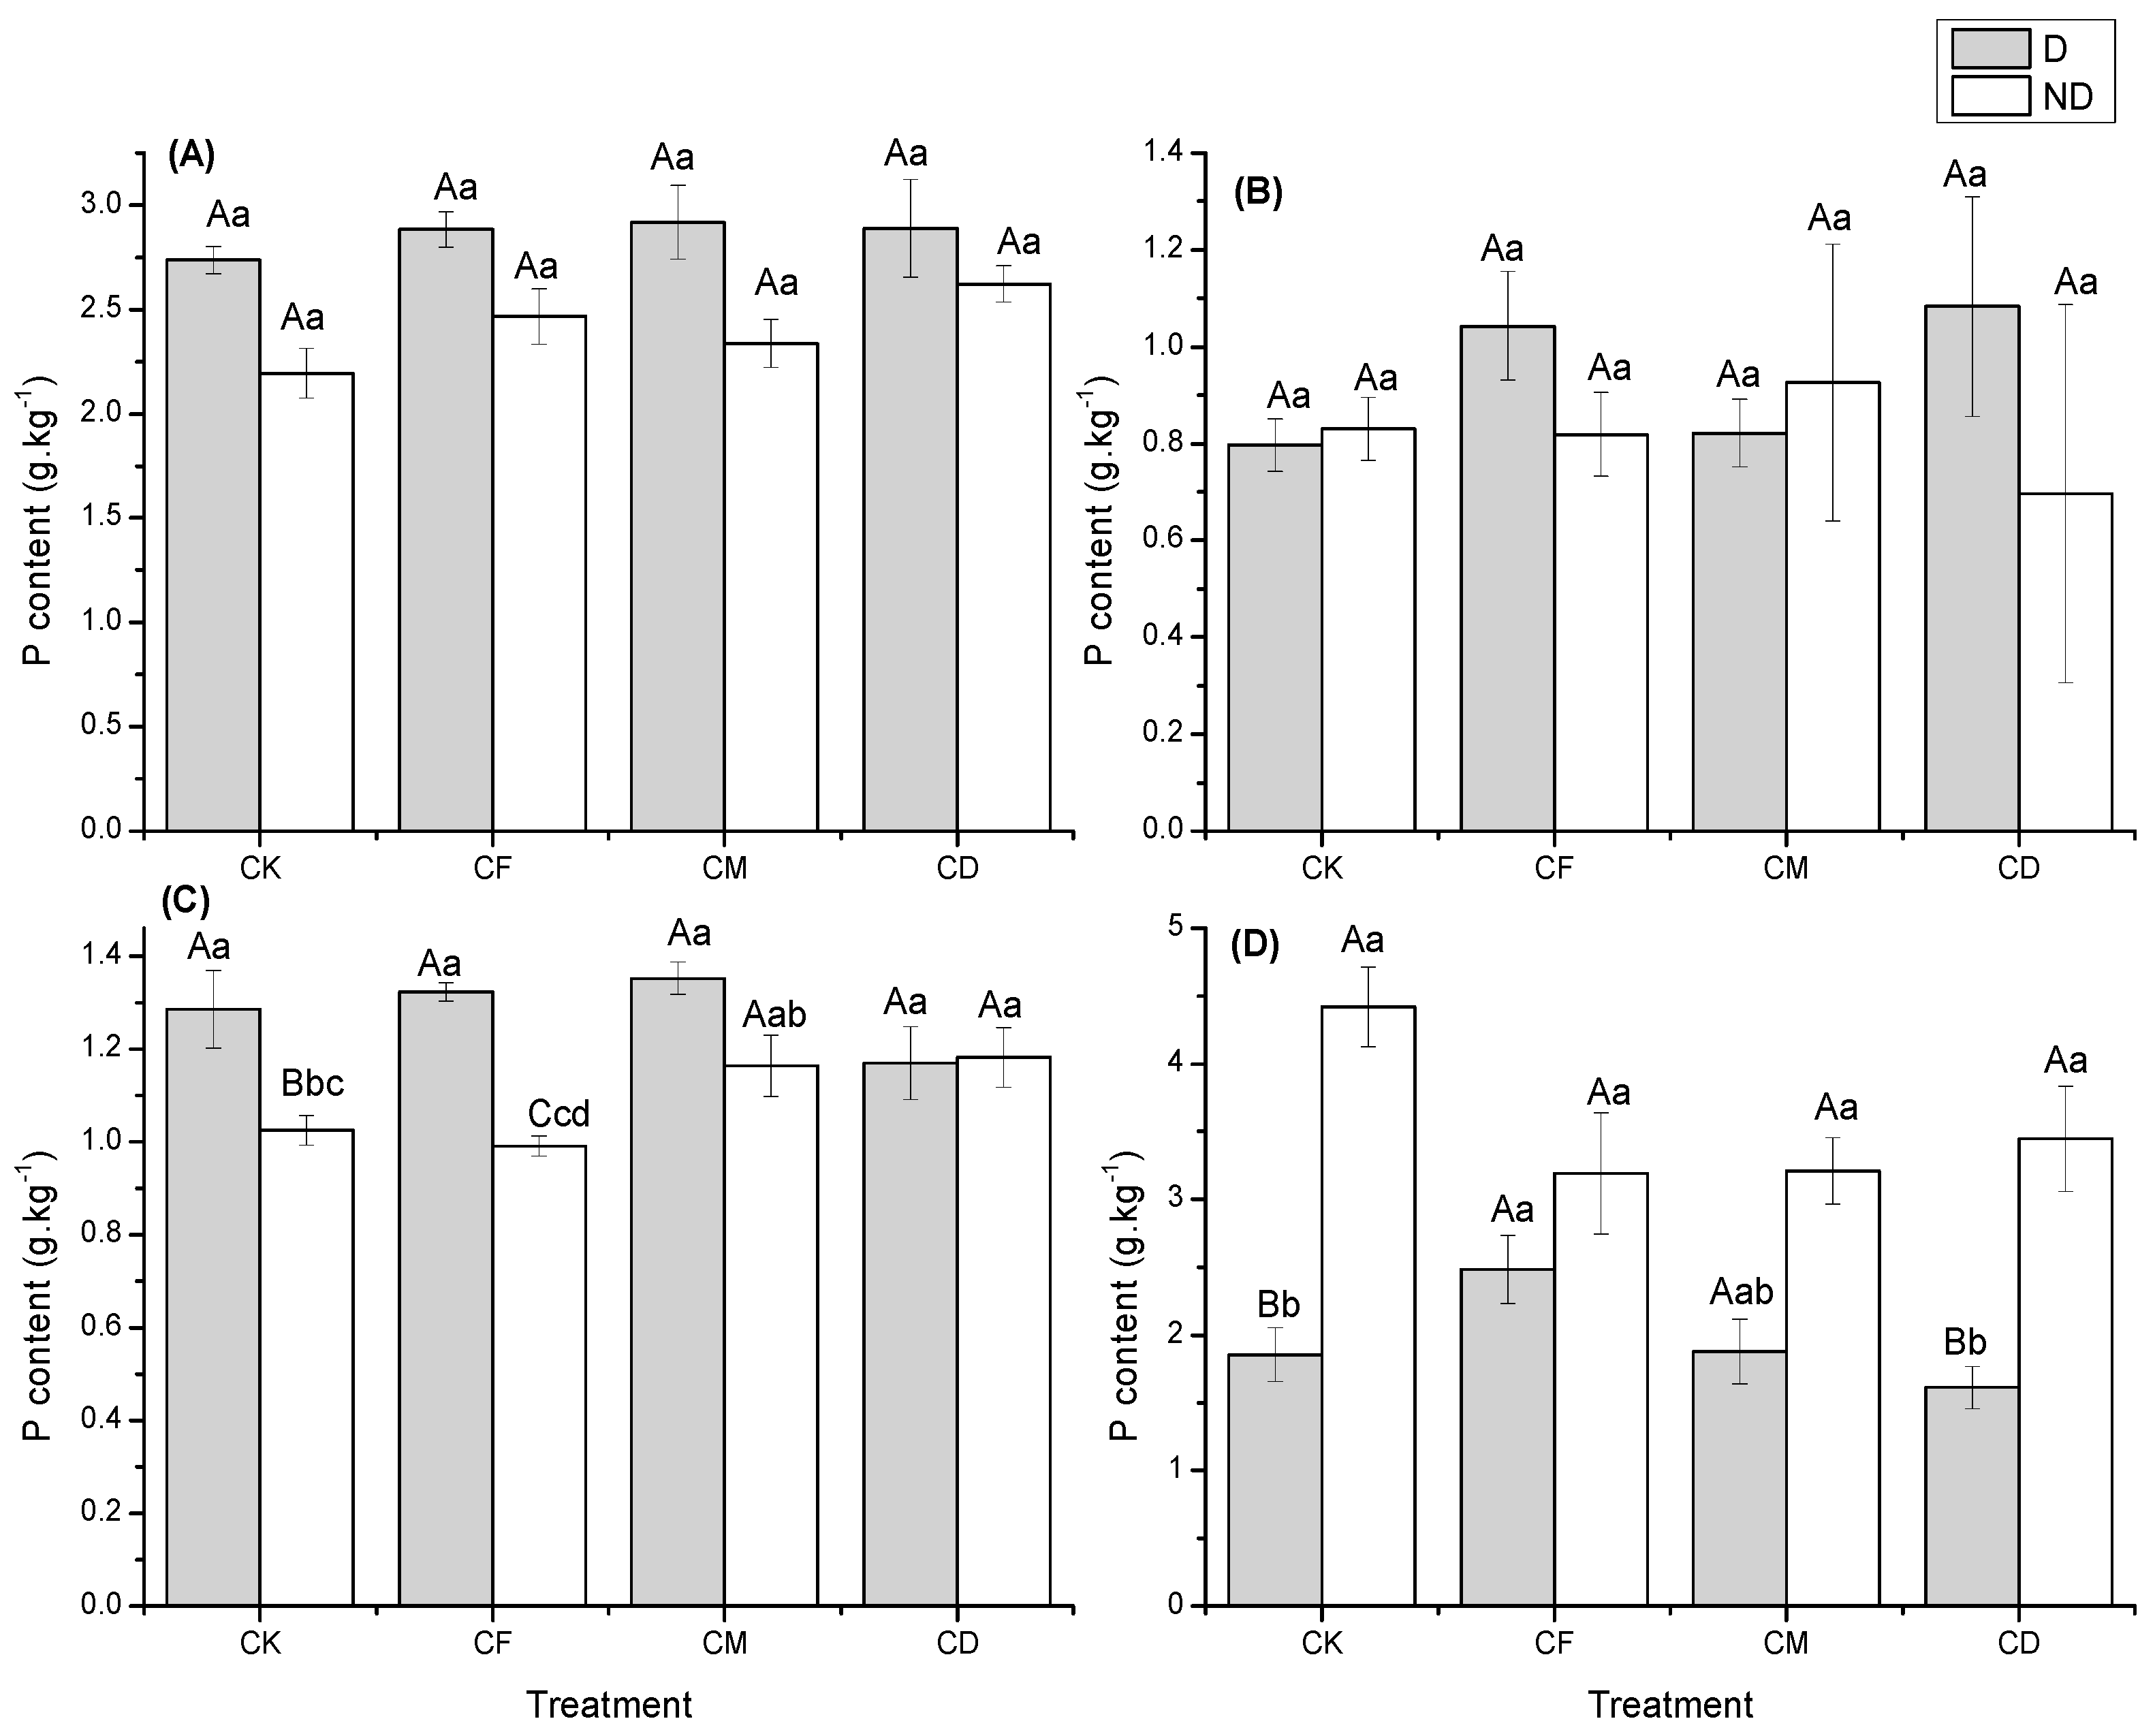
| Year (Location) | Duck Presence | Treatment | N Content (g·kg−1) | P Content (g·kg−1) | ||||||
|---|---|---|---|---|---|---|---|---|---|---|
| Grain | Straw | Leaf | Root | Grain | Straw | Leaf | Root | |||
| 2017 (Ninghe) | Duck | CK | 11.47 ± 0.31Aa | 6.13 ± 0.45Aa | 14.60 ± 1.04Aa | 7.73 ± 0.66Aa | 2.73 ± 0.06Aa | 0.79 ± 0.05Aa | 1.28 ± 0.08Aa | 1.85 ± 0.19Bb |
| CF | 12.10 ± 0.26Aa | 7.71 ± 1.00Aa | 16.68 ± 0.45Aa | 9.62 ± 1.16Aa | 2.88 ± 0.08Aa | 1.04 ± 0.11Aa | 1.32 ± 0.01Aa | 2.48 ± 0.25Aa | ||
| CM | 12.54 ± 0.53Aa | 7.86 ± 1.04Aa | 17.05 ± 1.11Aa | 8.56 ± 0.51Aa | 2.91 ± 0.17Aa | 0.82 ± 0.06Aa | 1.35 ± 0.03Aa | 1.87 ± 0.23Aab | ||
| CD | 11.88 ± 0.42Aa | 6.67 ± 0.75Aa | 14.08 ± 0.95Aa | 7.93 ± 0.74Aa | 2.88 ± 0.23Aa | 1.08 ± 0.22Aa | 1.17 ± 0.07Aa | 1.61 ± 0.15Bb | ||
| No-Duck | CK | 9.99 ± 0.37Cc | 5.21 ± 0.44Aa | 12.05 ± 0.77Bbc | 7.45 ± 0.34Aa | 2.19 ± 0.11Aa | 0.83 ± 0.06Aa | 1.02 ± 0.03Bbc | 4.41 ± 0.29Aa | |
| CF | 10.72 ± 0.33Bbc | 5.39 ± 0.48Aa | 11.64 ± 0.89Bc | 7.78 ± 0.78Aa | 2.46 ± 0.13Aa | 0.81 ± 0.08Aa | 0.99 ± 0.02Ccd | 3.19 ± 0.44Aa | ||
| CM | 11.11 ± 0.38Bb | 6.41 ± 1.25Aa | 14.81 ± 1.13Aa | 9.19 ± 0.62Aa | 2.33 ± 0.11Aa | 0.92 ± 0.28Aa | 1.16 ± 0.06Aab | 3.21 ± 0.24Aa | ||
| CD | 12.32 ± 0.38Aa | 5.47 ± 1.52Aa | 14.39 ± 0.64Aab | 8.94 ± 0.96Aa | 2.62 ± 0.08Aa | 0.69 ± 0.39Aa | 1.18 ± 0.06Aa | 3.44 ± 0.38Aa | ||
| Year (Location) | Duck Presence | Treatment | Total 15N (g·kg−1) | |||||
|---|---|---|---|---|---|---|---|---|
| 0–20 cm | 20–40 cm | Grain | Straw | Leaf | Root | |||
| 2017 (Ninghe) | Duck | CF | 1.97 ± 0.006Aa | 1.34 ± 0.03Aa | 14.30 ± 0.00Aa | 12.60 ± 0.10Aab | 18.00 ± 0.05Bb | 14.05 ± 0.20Aa |
| CM | 0.98 ± 0.0005Bbc | 0.78 ± 0.006Aa | 13.75 ± 0.17Aa | 12.70 ± 0.03Aa | 20.15 ± 0.02Aa | 12.10 ± 0.14Aa | ||
| CD | 1.06 ± 0.015Bb | 0.77 ± 0.001Aa | 13.50 ± 0.00Aa | 7.52 ± 0.04Cc | 14.40 ± 0.03Cc | 8.90 ± 0.04Aa | ||
| No-duck | CF | 0.94 ± 0.08Aa | 0.86 ± 0.002Aa | 12.85 ± 0.01Aa | 6.85 ± 0.03Aa | 13.25 ± 0.10Aa | 9.59 ± 0.02Aa | |
| CM | 1.09 ± 0.006Aa | 1.47 ± 0.054Aa | 13.90 ± 1.11Aa | 9.85 ± 0.13Aa | 17.55 ± 0.11Aa | 8.97 ± 0.004Aab | ||
| CD | 1.4 ± 0.024Aa | 1.19 ± 0.038Aa | 12.25 ± 0.005Aa | 7.03 ± 0.02Aa | 13.85 ± 0.03Aa | 6.04 ± 0.031Cc | ||
| Year | Site | Treatment | 15N Content (g·kg−1) | 15N Uptake (kg·ha−1) | NUE (Isotopic Method) | |||
|---|---|---|---|---|---|---|---|---|
| Grain | Husk | Grain | Husk | Grain | Husk | |||
| 2017 | Ninghe | Duck | 14.2 ± 0.02a | 6.3 ± 0.04a | 54.90 ± 13.41a | 6.43 ± 1.96a | 21.55a | 2.61a |
| No-Duck | 14.4 ± 0.02a | 6.2 ± 0.05a | 93.69 ± 5.97a | 11.04 ± 1.36a | 34.61a | 4.24a | ||
© 2018 by the authors. Licensee MDPI, Basel, Switzerland. This article is an open access article distributed under the terms and conditions of the Creative Commons Attribution (CC BY) license (http://creativecommons.org/licenses/by/4.0/).
Share and Cite
EBISSA, T.M.; Yang, B.; Guan, Y.; Tan, B.; Chen, P.; Wang, L.; Magwanga, R.O.; Zheng, X. A Comparison of Nitrogen Transfer and Transformation in Traditional Farming and the Rice–Duck Farming System by 15N Tracer Method. Agronomy 2018, 8, 289. https://doi.org/10.3390/agronomy8120289
EBISSA TM, Yang B, Guan Y, Tan B, Chen P, Wang L, Magwanga RO, Zheng X. A Comparison of Nitrogen Transfer and Transformation in Traditional Farming and the Rice–Duck Farming System by 15N Tracer Method. Agronomy. 2018; 8(12):289. https://doi.org/10.3390/agronomy8120289
Chicago/Turabian StyleEBISSA, Tchister Morrel, Bo Yang, Yuanqing Guan, Bingchang Tan, Peizhen Chen, Lili Wang, Richard Odongo Magwanga, and Xiangqun Zheng. 2018. "A Comparison of Nitrogen Transfer and Transformation in Traditional Farming and the Rice–Duck Farming System by 15N Tracer Method" Agronomy 8, no. 12: 289. https://doi.org/10.3390/agronomy8120289
APA StyleEBISSA, T. M., Yang, B., Guan, Y., Tan, B., Chen, P., Wang, L., Magwanga, R. O., & Zheng, X. (2018). A Comparison of Nitrogen Transfer and Transformation in Traditional Farming and the Rice–Duck Farming System by 15N Tracer Method. Agronomy, 8(12), 289. https://doi.org/10.3390/agronomy8120289