
Impact of Different Agricultural Waste Biochars on Maize Biomass and Soil Water Content in a Brazilian Cerrado Arenosol

 , , , and
Abstract
:1. Introduction
2. Results
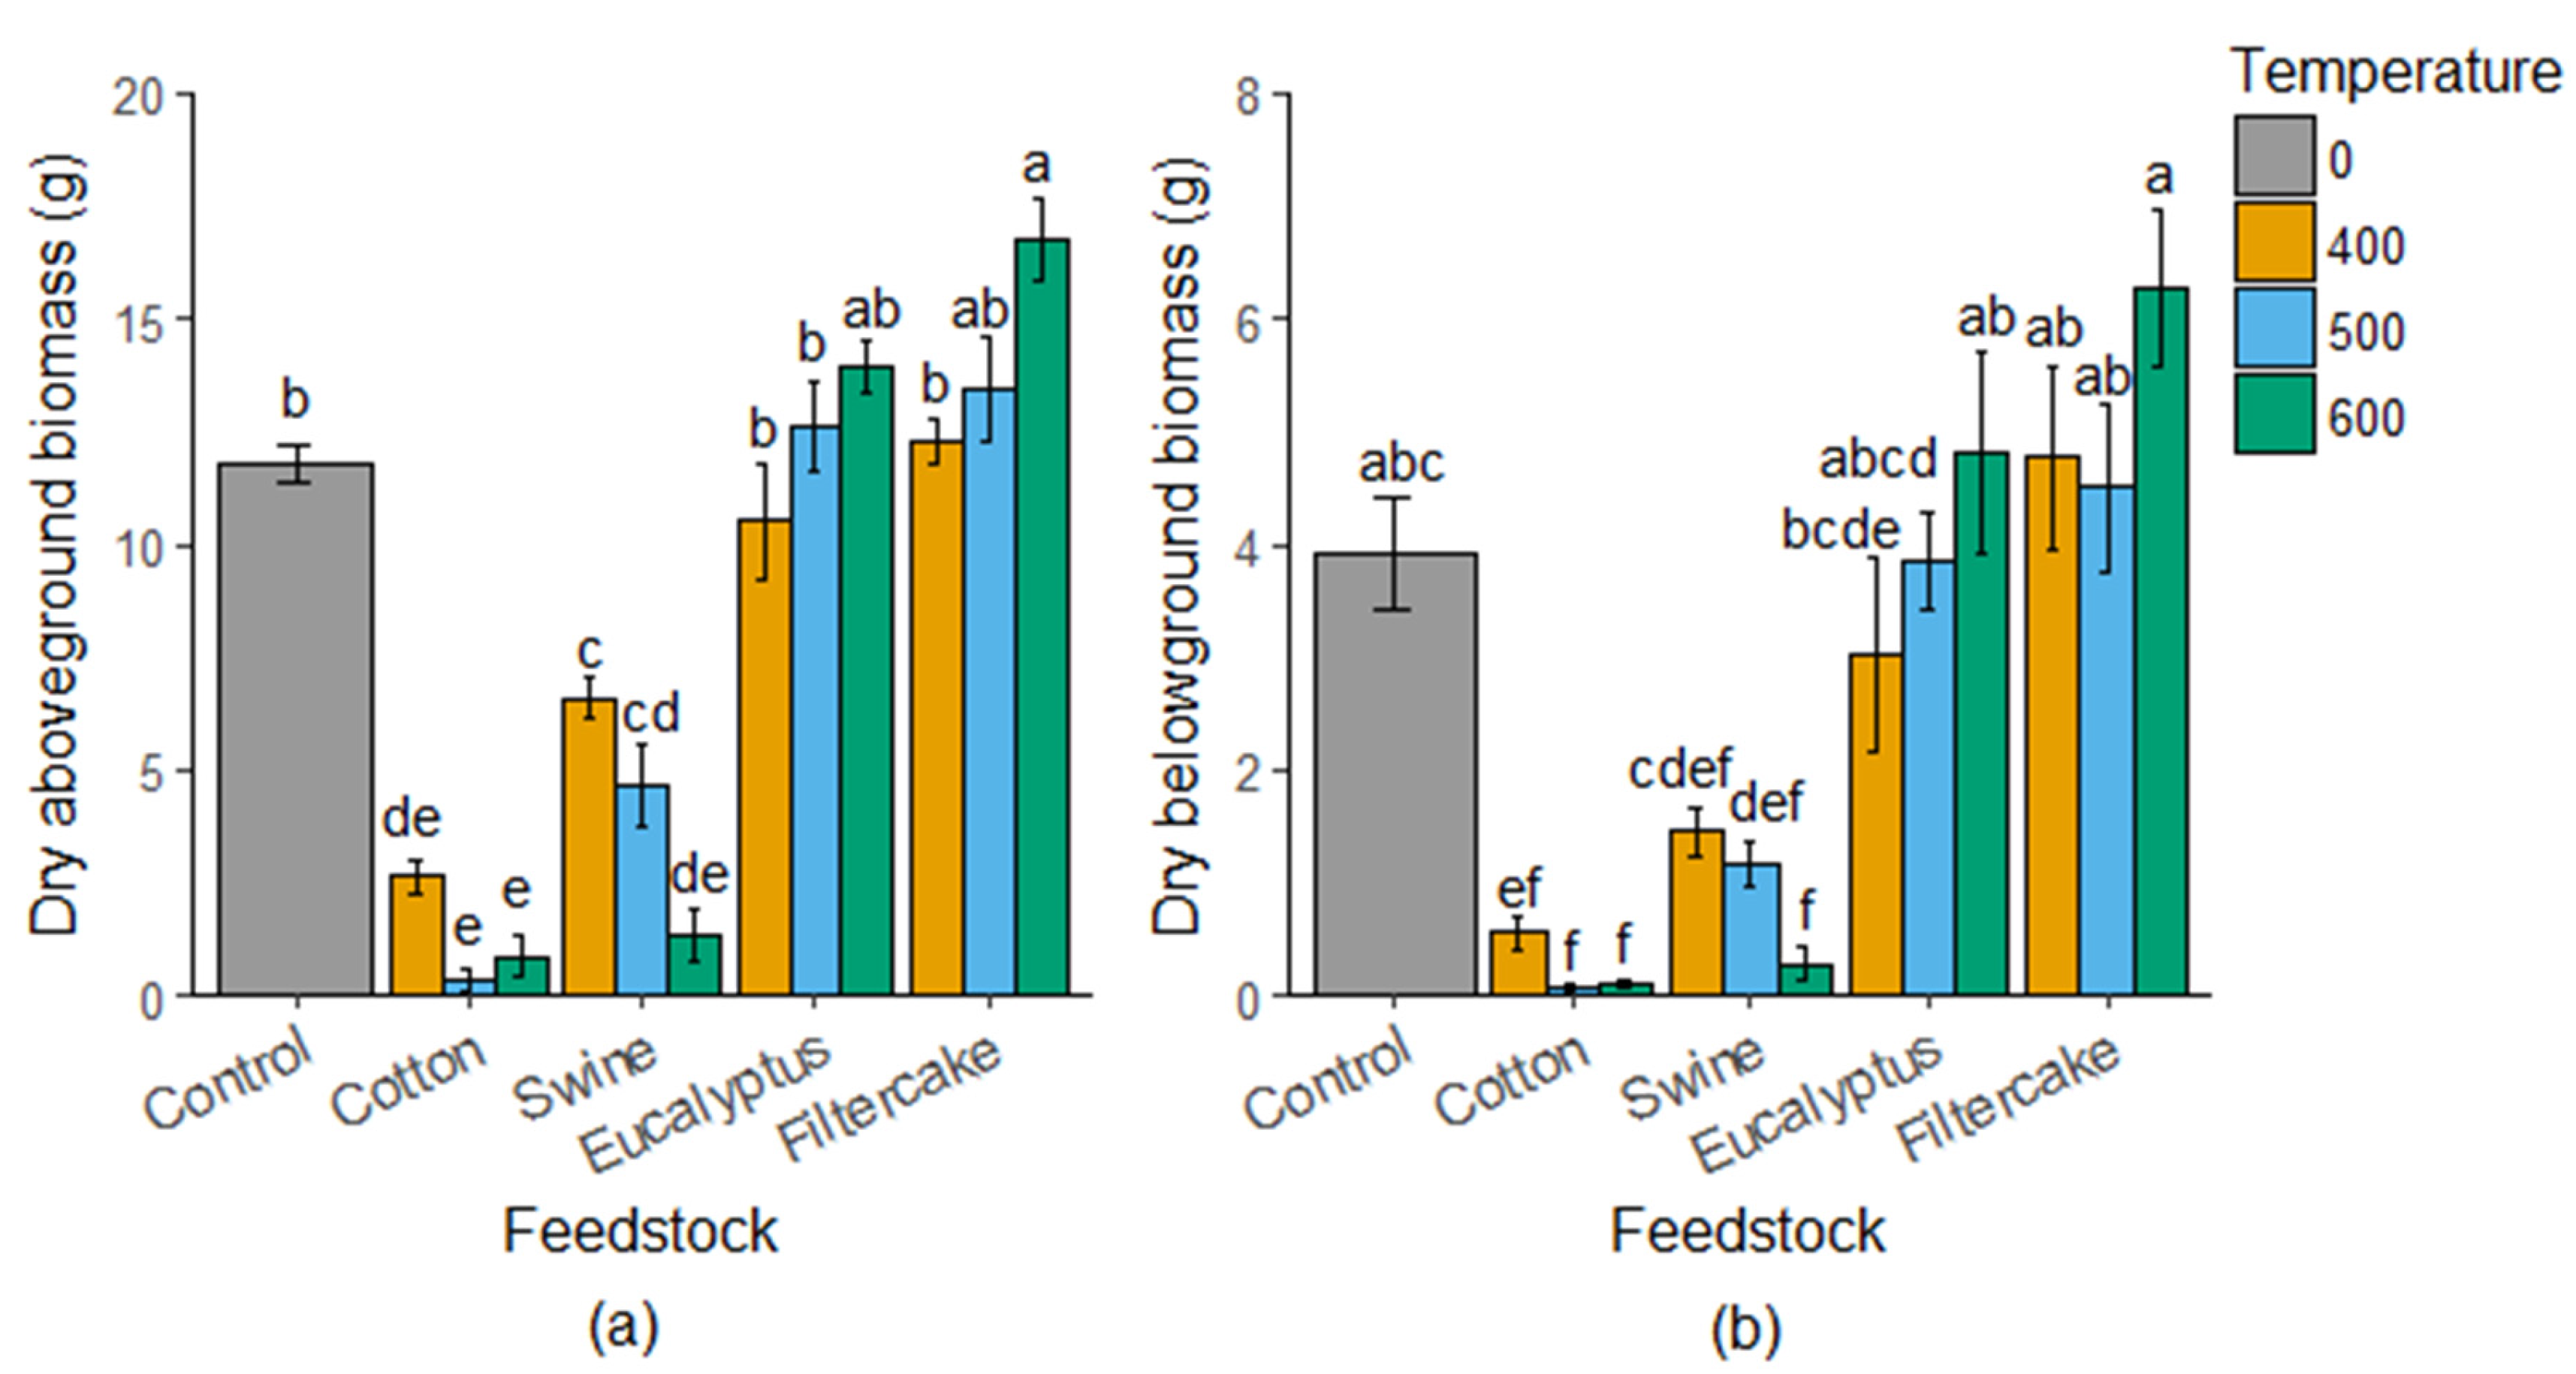
2.1. Maize Biomass
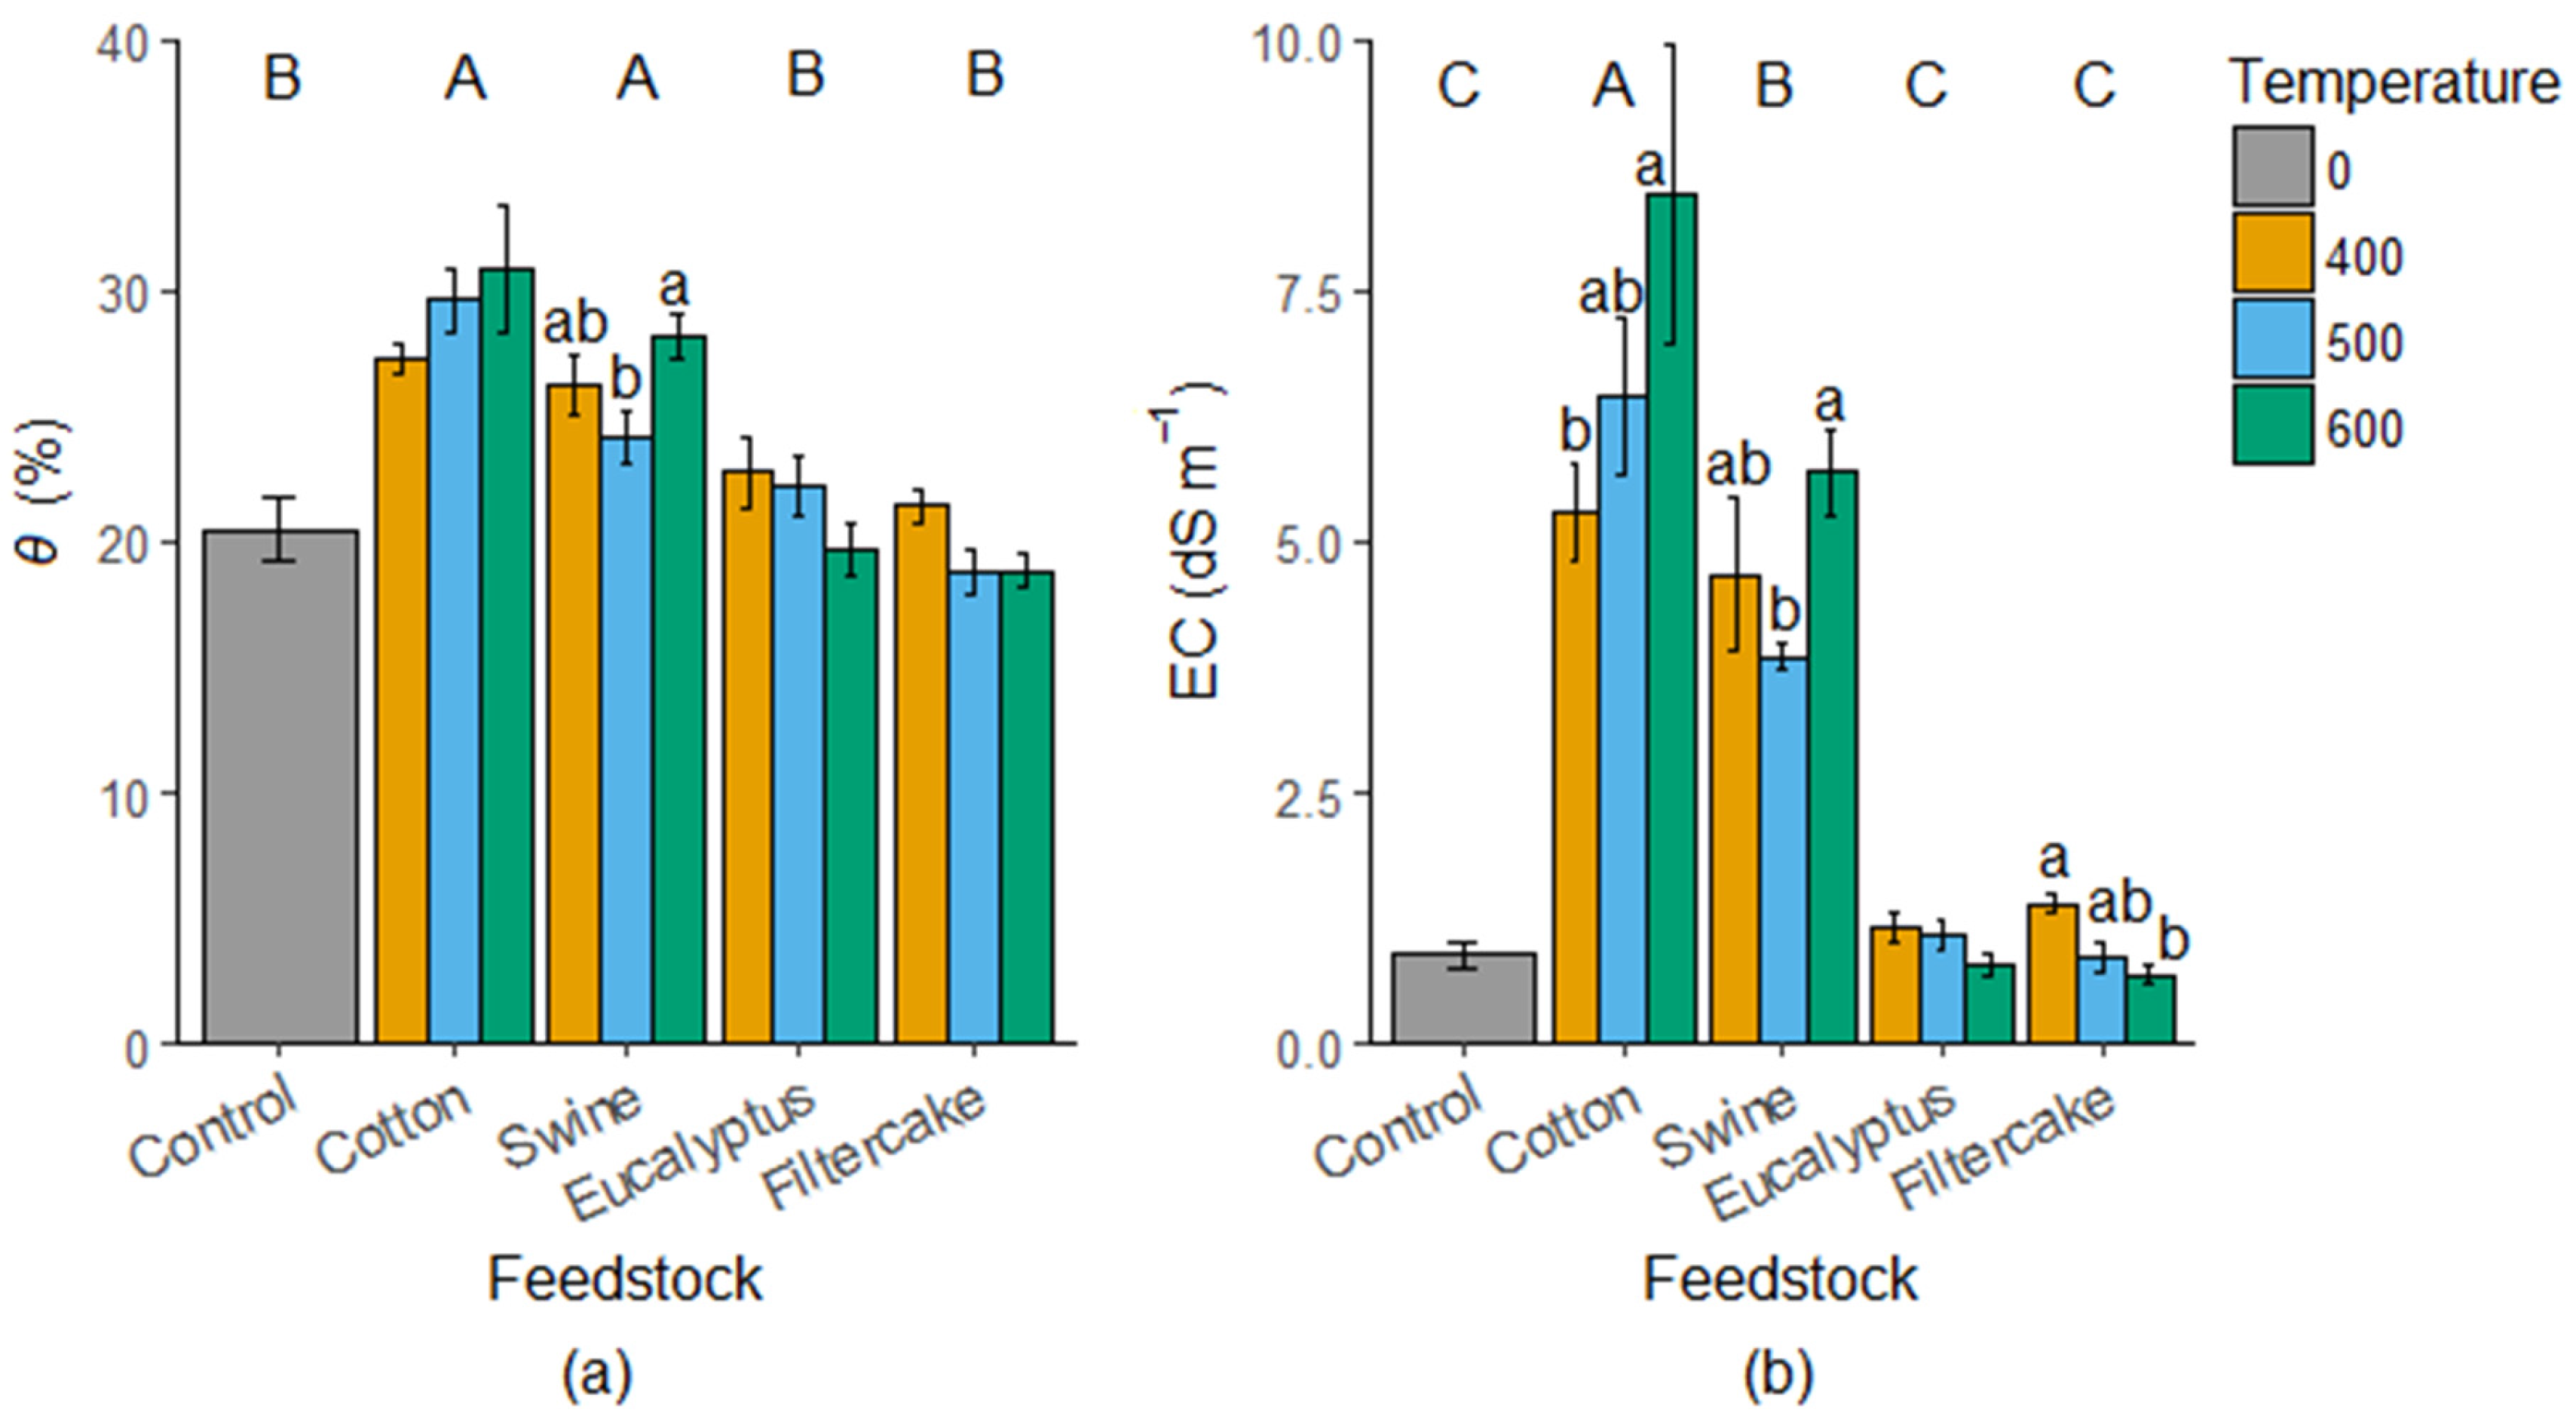
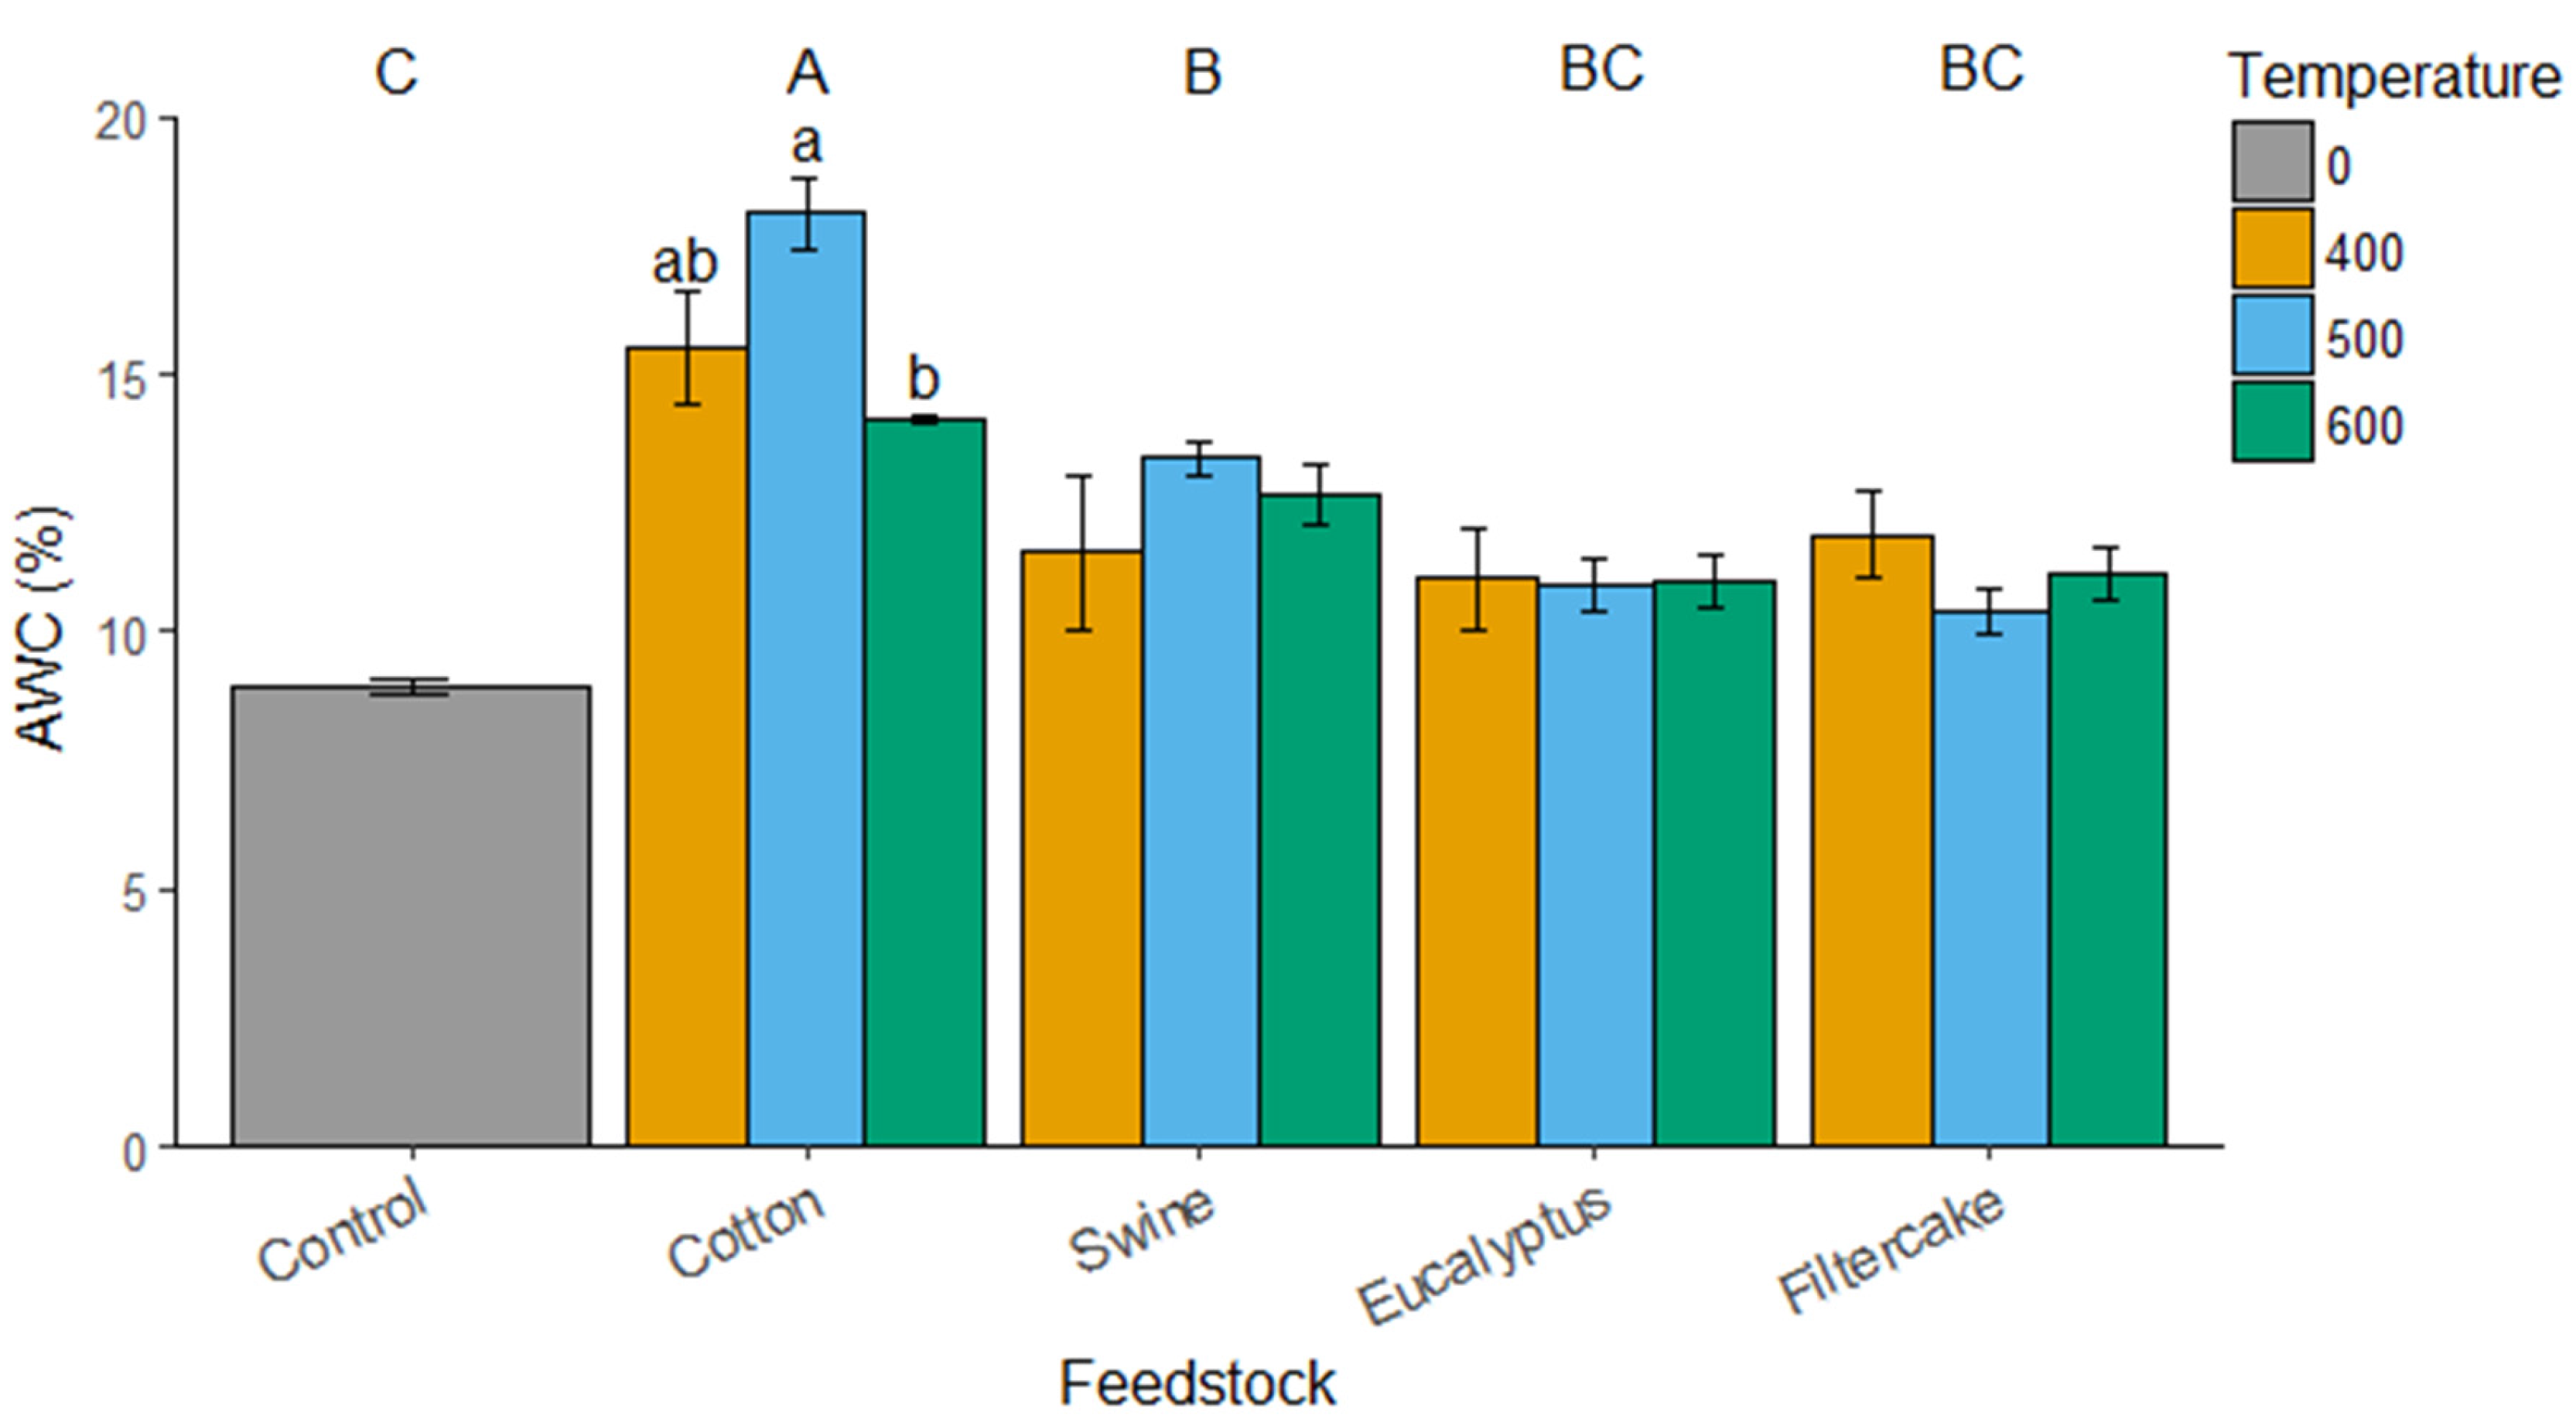
2.2. Water Content and EC Measurements
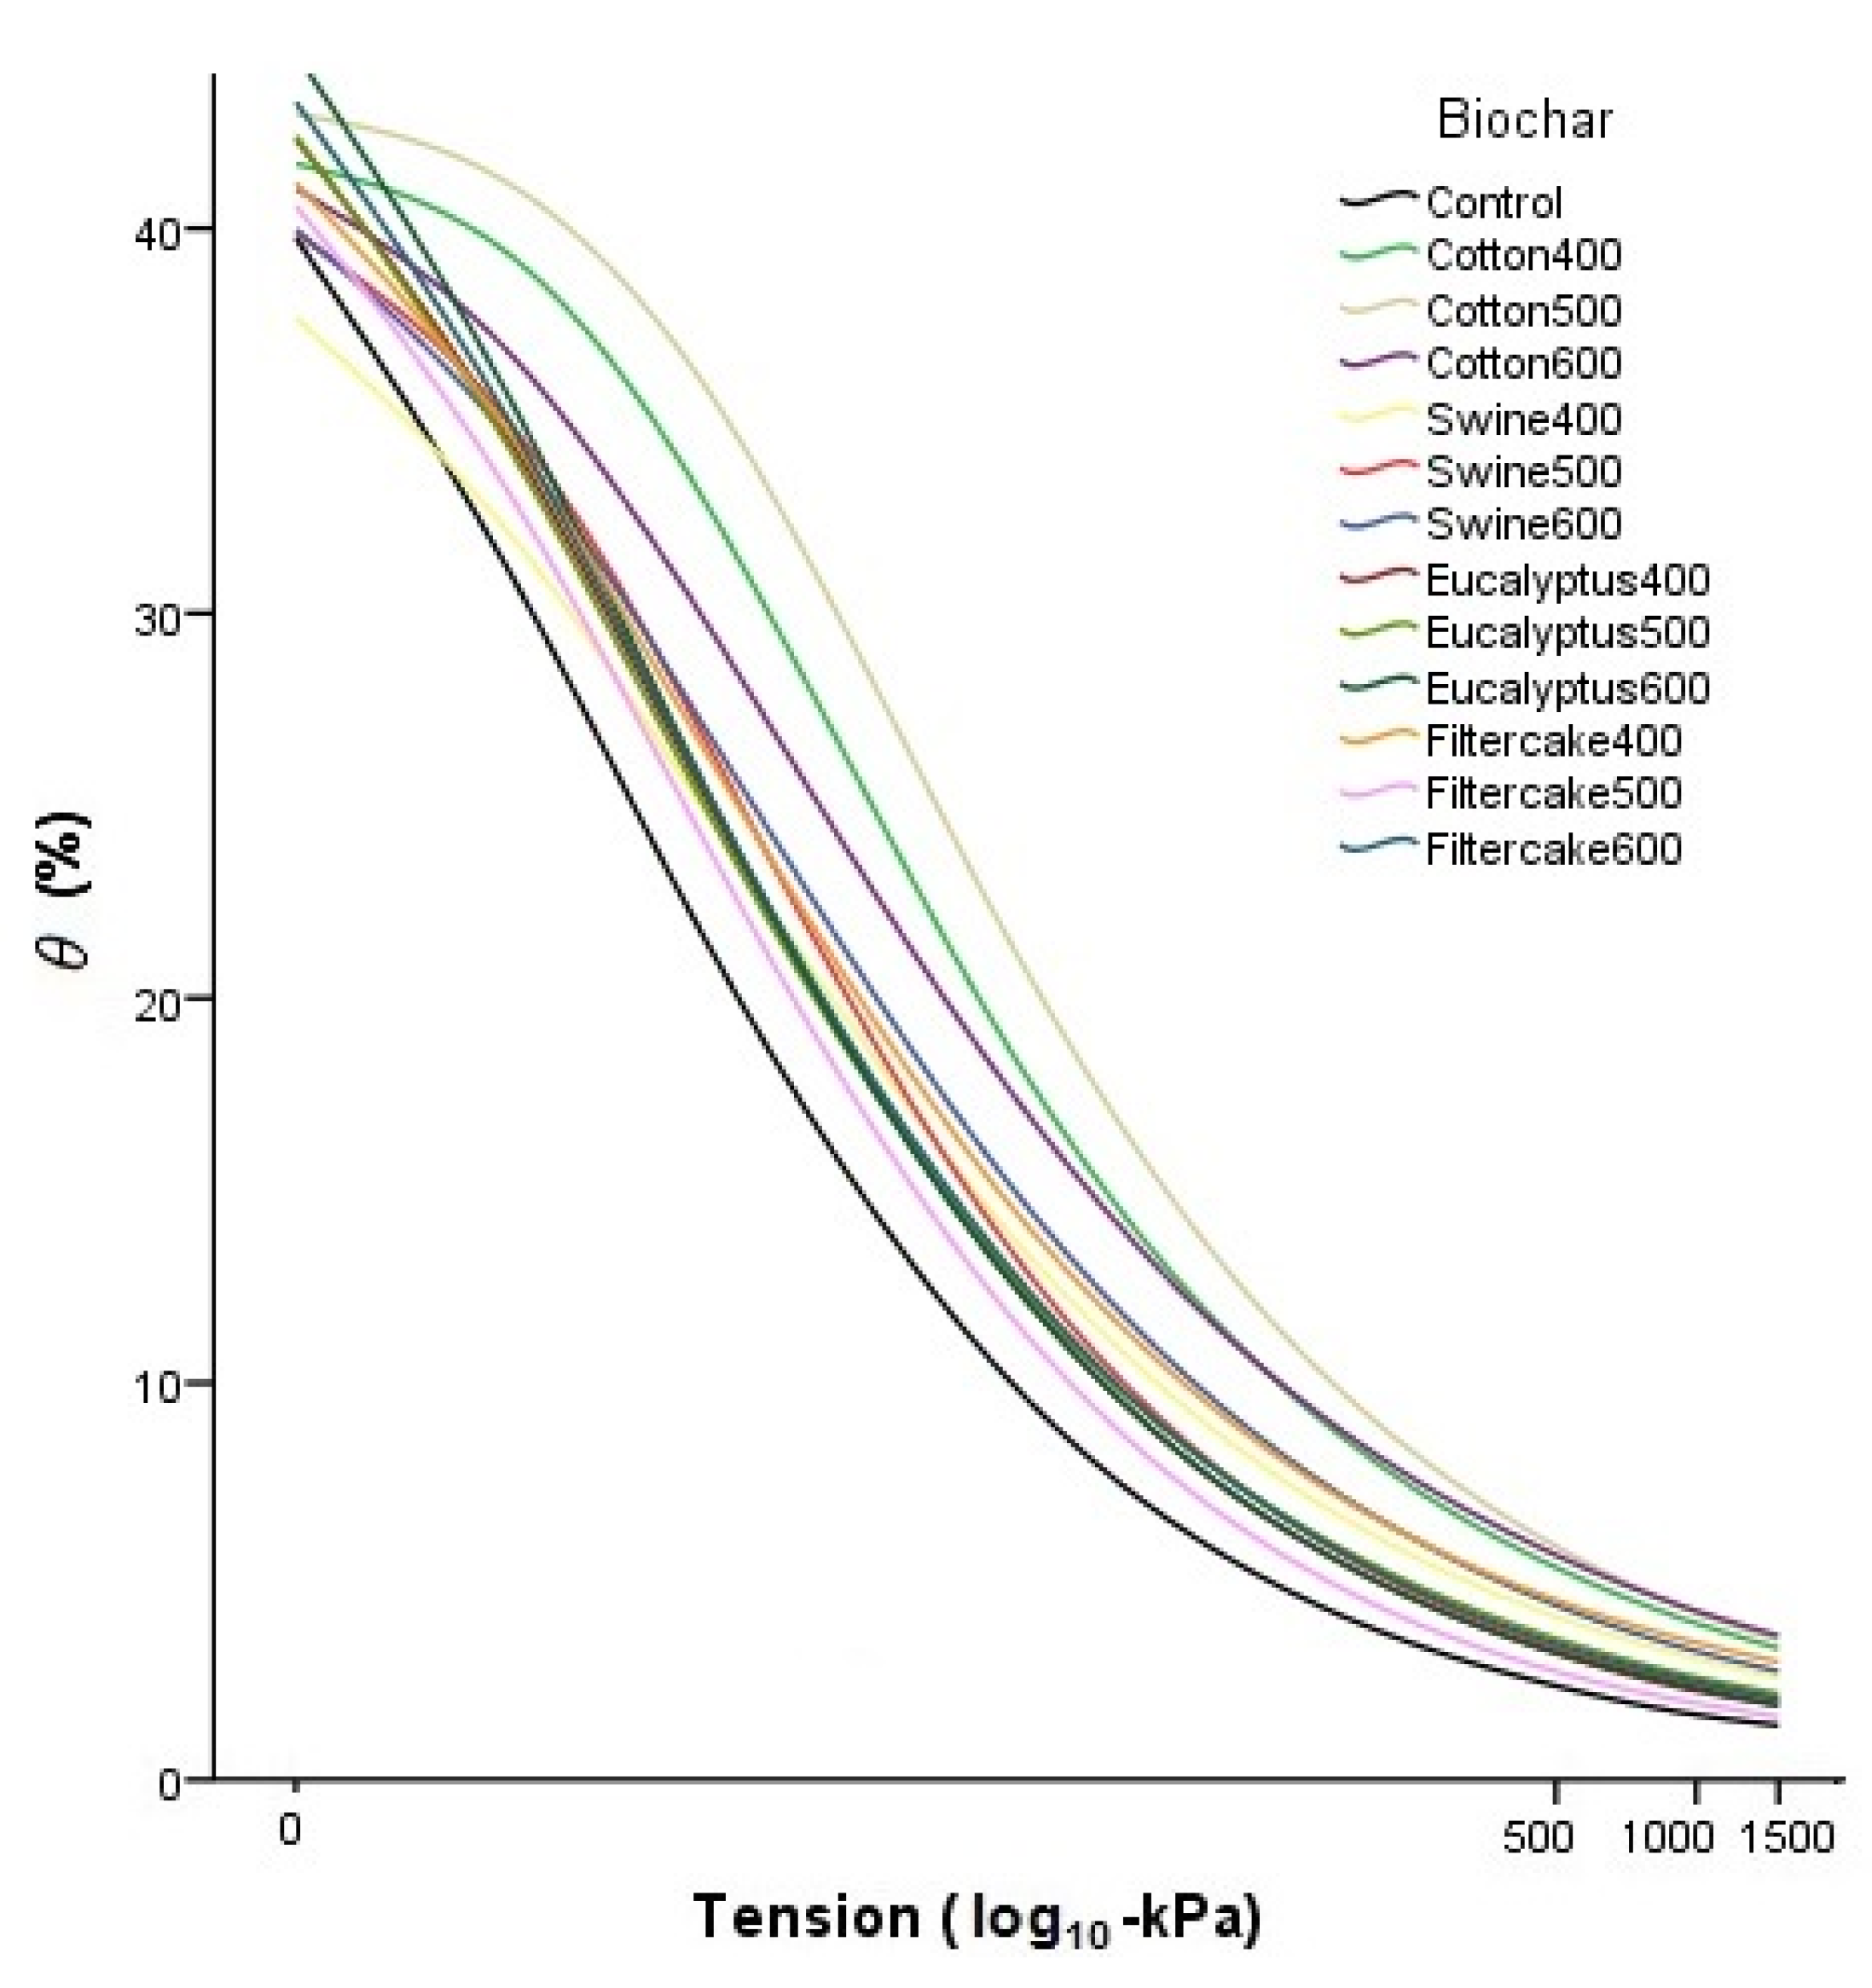
2.3. Water Retention Curves
2.4. Particle Size Analysis
2.4.1. Biochar Characteristics
2.4.2. Biochar-Soil Mixtures
3. Discussion
3.1. Effect of Biochar Feedstock on Plant Biomass
3.2. Biochar Contribution to Soil Water Retention
3.3. Biochar Particle Size and Distribution
4. Materials and Methods
4.1. Soil Collection and Biochar Production
4.2. Experimental Design
4.3. Water Retention Curves
4.4. Biochar Particle Size and Porosity Analysis
4.5. Statistical Analyses
5. Conclusions
Supplementary Materials
Acknowledgments
Author Contributions
Conflicts of Interest
References
- Bustamante, M.M.C.; Nardoto, G.B.; Pinto, A.S.; Resende, J.C.F.; Takahashi, F.S.C.; Vieira, L.C.G. Potential impacts of climate change on biogeochemical functioning of Cerrado ecosystems. Br. J. Biol. 2012, 72, 655–671. [Google Scholar] [CrossRef]
- Arantes, A.E.; Ferreira, L.G.; Coe, M.T. The seasonal carbon and water balances of the Cerrado environment of Brazil: Past, present, and future influences of land cover and land use. ISPRS J. Photogramm. Remote Sens. 2016, 117, 66–78. [Google Scholar] [CrossRef]
- Mittermeier, R.; Gil, P.; Hoffman, M.; Pilgrim, J.; Brooks, T.; Mittermeier, C.; Lamoreux, J.; Fonseca, G. Hotspots Revisited: Earth’S Biolsogically Richest and most Endangered Terrestrial Ecoregions, 2nd ed.; University of Chicago Press: Boston, MA, USA, 2005. [Google Scholar]
- Mendonça, R.; Felfili, J.; Walter, B.; Silva Júnior, M.; Rezende, A.; Filgubiras, T.; Nogueira, P.; Fagg, C. Flora vascular do bioma Cerrado: Checklist com 12.356 especies. In Cerrado: Ecologia e Flora; Sano, S., Almeida, S., Ribeiro, J., Eds.; Embrapa Informaçâo Tecnológica: Brasilia, Brazil, 2008; pp. 421–442. [Google Scholar]
- IBGE (Instituto Brasileiro de Geografia e Estatística). Levantamento Sistemático da Produção Agrícola; IBGE: Rio de Janeiro, Brazil, 2016; Volume 29.
- Cruz, J.; Pereira Filho, I.; Alvarenga, R.; Neto, M.; Viana, J.; de Oliveira, M.; Matrangolo, W.; de Albuquerque Filho, M. Cultivo do Milho. In Sistema de Produção; Embrapa Milho e Sorgo: Sete Lagoas, Brazil, 2010. [Google Scholar]
- SEPLAN (Secretaria de Estado de Planejamento). Zoneamento Sócioeconômico Ecológico do Estado de Mato Grosso; SEPLAN: Cuiabá, Brazil, 2008.
- Da Costa, A.; Albuquerque, J.A.; da Costa, A.; Pértile, P.; da Silva, F.R. Water retention and availability in soils of the state of Santa Catarina-Brazil: Effect of textural classes, soil classes and lithology (1). Rev. Bras. Cienc. do Solo 2013, 37, 1535–1548. [Google Scholar] [CrossRef]
- Abel, S.; Peters, A.; Trinks, S.; Schonsky, H.; Facklam, M.; Wessolek, G. Impact of biochar and hydrochar addition on water retention and water repellency of sandy soil. Geoderma 2013, 202–203, 183–191. [Google Scholar] [CrossRef]
- Lehmann, J. Bio-energy in the black. Front. Ecol. Environ. 2007, 5, 381–387. [Google Scholar] [CrossRef]
- Sohi, S.; Lopez-Capel, E.; Krull, E.; Bol, R. Biochar’s Roles in Soil and Climate Change: A Review of Research Needs; CSIRO Land and Water Science Report 05/09; SIRO Land and Water Science: Canberra, Australia, 2009. [Google Scholar]
- Spokas, K.A.; Cantrell, K.B.; Novak, J.M.; Archer, D.W.; Ippolito, J.A.; Collins, H.P.; Boateng, A.A.; Lima, I.M.; Lamb, M.C.; McAloon, A.J.; et al. Biochar: A synthesis of its agronomic impact beyond carbon sequestration. J. Environ. Qual. 2012, 41, 973–989. [Google Scholar] [CrossRef] [PubMed]
- Jeffery, S.; Abalos, D.; Prodana, M.; Bastos, A.C.; van Groenigen, J.W.; Hungate, B.A.; Verheijen, F. Biochar boosts tropical but not temperate crop yields. Environ. Res. Lett. 2017, 12, 53001. [Google Scholar] [CrossRef]
- Major, J.; Rondon, M.; Molina, D.; Riha, S.J.; Lehmann, J. Nutrient leaching in a Colombian savanna Oxisol amended with biochar. J. Environ. Qual. 2012, 41, 1076–1086. [Google Scholar] [CrossRef] [PubMed]
- Downie, A.; Crosky, A.; Munroe, P. Physical properties of biochar. In Biochar for Environmental Management: Science and Technology; Lehmann, J., Joseph, S., Eds.; Earthscan: London, UK, 2009; pp. 13–32. [Google Scholar]
- Brown, R.A.; Kercher, A.K.; Nguyen, T.H.; Nagle, D.C.; Ball, W.P. Production and characterization of synthetic wood chars for use as surrogates for natural sorbents. Org. Geochem. 2006, 37, 321–333. [Google Scholar] [CrossRef]
- Barnes, R.T.; Gallagher, M.E.; Masiello, C.A.; Liu, Z.; Dugan, B. Biochar-induced changes in soil hydraulic conductivity and dissolved nutrient fluxes constrained by laboratory experiments. PLoS ONE 2014, 9, e108340. [Google Scholar] [CrossRef] [PubMed]
- Uzoma, K.C.; Inoue, M.; Andry, H.; Zahoor, A.; Nishihara, E. Influence of biochar application on sandy soil hydraulic properties and nutrient retention. J. Food Agric. Environ. 2011, 9, 1137–1143. [Google Scholar]
- Hardie, M.; Clothier, B.; Bound, S.; Oliver, G.; Close, D. Does biochar influence soil physical properties and soil water availability? Plant Soil 2014, 376, 347–361. [Google Scholar] [CrossRef]
- Herath, H.M.S.K.; Camps-Arbestain, M.; Hedley, M. Effect of biochar on soil physical properties in two contrasting soils: An Alfisol and an Andisol. Geoderma 2013, 209–210, 188–197. [Google Scholar] [CrossRef]
- Gray, M.; Johnson, M.G.; Dragila, M.I.; Kleber, M. Water uptake in biochars: The roles of porosity and hydrophobicity. Biomass Bioenergy 2014, 61, 196–205. [Google Scholar] [CrossRef]
- Glab, T.; Palmowska, J.; Zaleski, T.; Gondek, K. Effect of biochar application on soil hydrological properties and physical quality of sandy soil. Geoderma 2016, 281, 11–20. [Google Scholar] [CrossRef]
- Masiello, C.A.; Dugan, B.; Brewer, C.E.; Spokas, K.A.; Novak, J.M.; Liu, Z.; Sorrenti, G. Biochar effects on soil hydrology. In Biochar for Environmental Management: Science, Technology, and Implementation; Lehmann, J., Joseph, S., Eds.; Routledge: New York, NY, USA, 2015; pp. 543–562. [Google Scholar]
- Horiba Scientific. A Guidebook to Particle Size Analysis; Horiba Instruments, Inc.: Irvine, CA, USA, 2012. [Google Scholar]
- Verheijen, F.; Jeffery, S.; Bastos, A.C.; Van Der Velde, M.; Diafas, I. Biochar Application to Soils: A Critical Review of Effects on Soil Properties, Processes and Functions; EUR 24099 EN; Office for Official Publications of the European Communities: Luxembourg, 2009. [Google Scholar]
- Corwin, D.L.; Lesch, S.M. Apparent soil electrical conductivity measurements in agriculture. Comput. Electron. Agric. 2005, 46, 11–43. [Google Scholar] [CrossRef]
- Kammann, C.; Graber, E.R. Biochar effects on plant ecophysiology. In Biochar for Environmental Management: Science, Technology, and Implementation; Lehmann, J., Joseph, S., Eds.; Routledge: New York, NY, USA, 2015; pp. 391–420. [Google Scholar]
- Rajkovich, S.; Enders, A.; Hanley, K.; Hyland, C.; Zimmerman, A.R.; Lehmann, J. Corn growth and nitrogen nutrition after additions of biochars with varying properties to a temperate soil. Biol. Fertil. Soils 2012, 48, 271–284. [Google Scholar] [CrossRef]
- Major, J.; Rondon, M.; Molina, D.; Riha, S.J.; Lehmann, J. Maize yield and nutrition during 4 years after biochar application to a Colombian savanna oxisol. Plant Soil 2010, 333, 117–128. [Google Scholar] [CrossRef]
- Major, J.; Steiner, C.; Downie, A.; Lehmann, J. Biochar effects on nutrient leaching. In Biochar for Environmental Management: Science and Technology; Lehmann, J., Joseph, S., Eds.; Earthscan: London, UK, 2009; pp. 271–288. [Google Scholar]
- Sorrenti, G.; Masiello, C.A.; Dugan, B.; Toselli, M. Biochar physico-chemical properties as affected by environmental exposure. Sci. Total Environ. 2016, 563–564, 237–246. [Google Scholar] [CrossRef] [PubMed]
- Brown, R.; Campo, B.; Boateng, A.; Garcia-Perez, M.; Mašek, O. Fundamentals of biochar production. In Biochar for Environmental Management: Science, Technology, and Implementation; Lehmann, J., Joseph, S., Eds.; Earthscan: London, UK, 2015; pp. 39–60. [Google Scholar]
- Jeffery, S.; Meinders, M.B.J.; Stoof, C.R.; Bezemer, T.M.; van de Voorde, T.F.J.; Mommer, L.; van Groenigen, J.W. Biochar application does not improve the soil hydrological function of a sandy soil. Geoderma 2015, 251–252, 47–54. [Google Scholar] [CrossRef]
- Chia, C.H.; Downie, A.; Munroe, P. Characteristics of biochar: Physical and structural properties. In Biochar for Environmental Management: Science, Technology, and Implementation; Lehmann, J., Joseph, S., Eds.; Routledge: New York, NY, USA, 2015; pp. 89–110. [Google Scholar]
- Eykelbosh, A.J.; Johnson, M.S.; Santos de Queiroz, E.; Dalmagro, H.J.; Guimarães Couto, E. Biochar from sugarcane filtercake reduces soil CO2 emissions relative to raw residue and improves water retention and nutrient availability in a highly-weathered tropical soil. PLoS ONE 2014, 9, e98523. [Google Scholar] [CrossRef] [PubMed]
- Sun, H.; Hockaday, W.C.; Masiello, C.A.; Zygourakis, K. Multiple controls on the chemical and physical structure of biochars. Ind. Eng. Chem. Res. 2012, 51, 3587–3597. [Google Scholar] [CrossRef]
- Lee, Y.; Park, J.; Ryu, C.; Gang, K.S.; Yang, W.; Park, Y.K.; Jung, J.; Hyun, S. Comparison of biochar properties from biomass residues produced by slow pyrolysis at 500 °C. Bioresour. Technol. 2013, 148, 196–201. [Google Scholar] [CrossRef] [PubMed]
- Kinney, T.J.; Masiello, C.A.; Dugan, B.; Hockaday, W.C.; Dean, M.R.; Zygourakis, K.; Barnes, R.T. Hydrologic properties of biochars produced at different temperatures. Biomass Bioenergy 2012, 41, 34–43. [Google Scholar] [CrossRef]
- Brodowski, S.; Amelung, W.; Haumaier, L. Black carbon contribution to stable humus in German arable soils. Geoderma 2007, 139, 220–228. [Google Scholar] [CrossRef]
- Zhang, J.; Chen, Q.; You, C. Biochar effect on water evaporation and hydraulic conductivity in sandy soil. Pedosphere 2016, 26, 265–272. [Google Scholar] [CrossRef]
- Crawford, B.R.; Faulkner, D.R.; Rutter, E.H. Strength, porosity, and permeability development during hydrostatic and shear loading of synthetic quartz-clay fault gouge. J. Geophys. Res. Solid Earth 2008, 113, 1–14. [Google Scholar] [CrossRef]
- Hartz, T.K. Soil Testing for Nutrient Availability: Procedures and Interpretation for California Vegetable Crop Production. Dept. of Plant Sciences: Davis, CA, USA, 2007. [Google Scholar]
- Dontsova, K.; Norton, L.D. Effects of exchangeable Ca: Mg ratio on soil clay flocculation, infiltration and erosion. In Sustaining the Global Farm. Selected Papers from the10th International Soil Conservation Organization Meeting (May 1999); Stott, D.E., Mohtar, R.H., Steinhardt, G.C., Eds.; USDA-ARS National Soil Erosion Research Laboratory: West Lafayette, IN, USA, 2001; pp. 580–585. [Google Scholar]
- Lim, T.J.; Spokas, K.A.; Feyereisen, G.; Novak, J.M. Predicting the impact of biochar additions on soil hydraulic properties. Chemosphere 2016, 142, 136–144. [Google Scholar] [CrossRef] [PubMed]
- Peters, A.; Durner, W. Simplified evaporation method for determining soil hydraulic properties. J. Hydrol. 2008, 356, 147–162. [Google Scholar] [CrossRef]
- Schindler, U.; Durner, W.; von Unold, G.; Mueller, L.; Wieland, R. The evaporation method: Extending the measurement range of soil hydraulic properties using the air-entry pressure of the ceramic cup. J. Plant Nutr. Soil Sci. 2010, 173, 563–572. [Google Scholar] [CrossRef]
- Da Silva, A.C.; Grupo Bom Futuro, Campo Verde, Mato Grosso, Brazil. Personal communication, 2014.
- EMBRAPA. Manual de Análises Químicas de Solos, Plantas e Fertilizantes, 2nd ed.; da Silva, F.C., Ed.; Empresa Brasileira de Pesquisa Agropecuária: Brasilia, Brazil, 2009.
- Reinert, D.J.; Reichert, J.M. Coluna de areia para medir a retenção de água no solo: Protótipos e teste. Ciência Rur. 2006, 36, 1931–1935. [Google Scholar] [CrossRef]
- Klein, V.A.; Reichert, J.M.; Reinert, D.J. Água disponível em um Latossolo Vermelho argiloso e murcha fisiológica de culturas. Rev. Bras. Eng. Agríc. Ambient. 2006, 10, 646–650. [Google Scholar] [CrossRef]
- Dourado-Neto, D.; Nielsen, D.R.; Hopmans, J.W.; Reichardt, K.; Bacchi, O.O.S. Software to model soil water retention curves (SWRC, version 2.00). Sci. Agric. 2000, 57, 191–192. [Google Scholar] [CrossRef]
- Van Genuchten, M.T. A closed-form equation for predicting the hydraulic conductivity of unsaturated soils. Soil Sci. Soc. Am. J. 1980, 44, 892–898. [Google Scholar] [CrossRef]
- Mualem, Y. A new model for predicting the hydraulic conductivity of unsaturated porous media. Water Resour. Res. 1976, 12, 513–522. [Google Scholar] [CrossRef]
- Liu, X.; Chi, C. Estimating osmotic potential from electrical conductivity for solutions/extracts in salt-affected soils using an universal equation. J. Food Agric. Environ. 2014, 12, 1033–1035. [Google Scholar]
- EMBRAPA. Manual de Métodos de Análises de Solos, 2nd ed.; Empresa Brasileira de Pesquisa Agropecuária: Rio de Janeiro, Brazil, 1997.
- Brunauer, S.; Emmett, P.H.; Teller, E. Adsorption of dases in multimolecular layers. J. Am. Chem. Soc. 1938, 60, 309–319. [Google Scholar] [CrossRef]
- Barrett, E.; Joyner, L.; Halenda, P. The determination of pore volume and area distributions in porous substances. I. Computations from nitrogen isotherms. J. Am. Chem. Soc. 1951, 73, 373–380. [Google Scholar] [CrossRef]


| Treatment | OP (−kPa) |
|---|---|
| Control | 44.2 ± 6.4 d |
| Cotton400 | 264.7 ± 25.0 b |
| Cotton500 | 322.6 ± 39.8 ab |
| Cotton600 | 423.4 ± 74.2 a |
| Swine400 | 233.3 ± 38.0 b |
| Swine500 | 192.7 ± 6.2 bc |
| Swine600 | 285.3 ± 21.4 b |
| Eucalyptus400 | 57.9 ± 7.7 cd |
| Eucalyptus500 | 54.2 ± 8.2 d |
| Eucalyptus600 | 39.9 ± 5.9 d |
| Filtercake400 | 69.7 ± 4.7 cd |
| Filtercake500 | 43.5 ± 7.3 d |
| Filtercake600 | 34.5 ± 4.9 d |
| θ (%) | EC (dS m−1) | AWC (%) | OP (−kPa) | |
|---|---|---|---|---|
| Aboveground dry biomass | −0.88 *** | −0.88 *** | −0.71 *** | −0.88 *** |
| Belowground dry biomass | −0.83 *** | −0.80 *** | −0.62 *** | −0.80 *** |
| Treatment | Bulk Density (g cm−3) |
|---|---|
| Control | 1.38 ± 0.03 a |
| Cotton400 | 1.23 ± 0.05 abc |
| Cotton500 | 1.23 ± 0.03 abc |
| Cotton600 | 1.20 ± 0.04 bc |
| Swine400 | 1.30 ± 0.04 abc |
| Swine500 | 1.35 ± 0.03 ab |
| Swine600 | 1.30 ± 0.00 abc |
| Eucalyptus400 | 1.28 ± 0.05 abc |
| Eucalyptus500 | 1.23 ± 0.03 abc |
| Eucalyptus600 | 1.18 ± 0.03 c |
| Filtercake400 | 1.30 ± 0.04 abc |
| Filtercake500 | 1.33 ± 0.03 abc |
| Filtercake600 | 1.28 ± 0.03 abc |
| Biochar | Total Surface Area (m2 g−1) | Mesopore Area (m2 g−1) | Micropore Area (m2 g−1) | Total Pore Volume (cm3 g−1) | Mesopore Volume (cm3 g−1) | Micropore Volume (cm3 g−1) | Particle Size (µm) | D10 (µm) | D90 (µm) | |||
|---|---|---|---|---|---|---|---|---|---|---|---|---|
| Cotton400 *,† | 0.2 | n/a | n/a | 0.0017 | n/a | n/a | A | 888.2 ± 131.1 a | A | 33.0 ± 7.3 ab | A | 2790.5 ± 20.3 a |
| Cotton500 | 1.8 | 0.47 | 2.4 | 0.0056 | 0.0050 | 0.0012 | 757.2 ± 27.3 a | 24.6 ± 1.3 b | 2747.6 ± 24.7 a | |||
| Cotton600 | 1.9 | 0.53 | 2.9 | 0.0061 | 0.0055 | 0.0014 | 806.4 ± 53.8 a | 53.7 ± 7.2 a | 2715.9 ± 19.3 a | |||
| Swine manure400 | 7.2 | 4.1 | 0.7 | 0.0323 | 0.0289 | 0.0002 | A | 966.3 ± 94.6 a | A | 210.0 ± 8.9 a | A | 2733.8 ± 0.03 a |
| Swine manure500 | 24.9 | 9.6 | 9.7 | 0.0725 | 0.0596 | 0.0046 | 779.2 ± 51.9 a | 61.0 ± 2.2 a | 2706.6 ± 10.7 a | |||
| Swine manure600 | 36.9 | 10.1 | 15.4 | 0.0715 | 0.0524 | 0.0073 | 822.7 ± 25.2 a | 143.2 ± 40.6 a | 1606.7 ± 3.3 b | |||
| Eucalyptus400 † | 0.3 | n/a | 2.3 | 0.0003 | n/a | 0.0011 | A | 860.6 ± 43.9 a | A | 47.4 ± 7.9 a | A | 2808.7 ± 10.0 a |
| Eucalyptus500 | 42.3 | 4.9 | 31.2 | 0.0520 | 0.0312 | 0.0151 | 415.6 ± 43.5 b | 37.3 ± 3.4 a | 476.9 ± 38.6 b | |||
| Eucalyptus600 *,† | 132.0 †† | n/a | n/a | 0.0700 | n/a | n/a | 965.5 ± 71.8 a | 45.5 ± 6.9 a | 2824.3 ± 6.1 a | |||
| Filtercake400 | 13.5 | 10.3 | 0.4 | 0.0851 | 0.0787 | 0.0000 | B | 457.9 ± 7.3 a | A | 42.4 ± 1.6 a | B | 1241.6 ± 61.7 a |
| Filtercake500 | 25.0 | 14.6 | 5.1 | 0.1210 | 0.1095 | 0.0021 | 215.4 ± 37.9 b | 31.1 ± 0.7 b | 601.7 ± 156.8 a | |||
| Filtercake600 | 41.3 | 17.6 | 12.7 | 0.1314 | 0.1112 | 0.0059 | 363.2 ± 65.2 ab | 38.4 ± 2.9 ab | 947.9 ± 212.4 a |
| Treatments | Sand Aggregate Size (µm) | Silt + Clay Aggregate Size (µm) | Sand D10 (µm) | Sand D90 (µm) | Silt + Clay D10 (µm) | Silt + Clay D90 (µm) | ||||||
|---|---|---|---|---|---|---|---|---|---|---|---|---|
| Control | C | 216.3 ± 10.8 | A | 6.3 ± 0.51 | A | 103.6 ± 1.7 | C | 367.0 ± 28.5 | B | 0.15 ± 0.0 | A | 21.9 ± 1.7 |
| Cotton400 | B | 392.4 ± 5.1 b | A | 5.8 ± 0.38 b | A | 106.8 ± 0.8 a | B | 822.6 ± 30.6 b | A | 0.19 ± 0.0 b | A | 20.2 ± 1.3 b |
| Cotton500 | 395.3 ± 31.3 b | 6.5 ± 0.15 b | 97.6 ± 3.0 b | 839.5 ± 161.7 b | 0.20 ± 0.0 a | 21.9 ± 0.6 b | ||||||
| Cotton600 | 537.7 ± 20.5 a | 7.9 ± 0.22 a | 108.5 ± 0.7 a | 1694.8 ± 76.4 a | 0.19 ± 0.0 b | 26.1 ± 0.7 a | ||||||
| Swine manure400 | B | 467.8 ± 25.6 ab | A | 7.1 ± 0.43 a | A | 106.6 ± 0.7 b | B | 1188.3 ± 158.6 ab | AB | 0.21 ± 0.0 a | A | 24.9 ± 0.4 a |
| Swine manure500 | 345.1 ± 5.6 b | 4.8 ± 0.15 b | 104.2 ± 2.0 b | 636.0 ± 11.7 b | 0.14 ± 0.0 b | 17.4 ± 1.5 b | ||||||
| Swine manure600 | 460.7 ± 5.7 a | 2.5 ± 0.15 c | 114.3 ± 2.2 a | 1240.1 ± 24.6 a | 0.13 ± 0.0 b | 8.8 ± 1.5 c | ||||||
| Eucalyptus400 | AB | 604.8 ± 64.5 a | A | 3.5 ± 0.1 b | A | 115.1 ± 0.9 a | AB | 1629.9 ± 201.1 a | B | 0.16 ± 0.0 a | A | 11.2 ± 1.4 b |
| Eucalyptus500 | 402.8 ± 27.1 b | 6.7 ± 0.3 a | 105.4 ± 2.6 b | 859.3 ± 100.1 b | 0.15 ± 0.0 b | 24.7 ± 0.2 a | ||||||
| Eucalyptus600 | 450.8 ± 31.5 ab | 6.3 ± 0.6 a | 106.3 ± 2.0 b | 1179.2 ± 166.6 ab | 0.19 ± 0.0 ab | 20.0 ± 0.7 a | ||||||
| Filtercake400 | A | 481.5 ± 64.8 b | A | 9.2 ± 0.3 a | A | 129.6 ± 25.0 ab | A | 1174.3 ± 61.9 b | A | 0.20 ± 0.0 a | A | 30.9 ± 0.6 a |
| Filtercake500 | 775.0 ± 4.4 ab | 6.4 ± 0.2 b | 117.4 ± 0.5 a | 2589.0 ± 103.6 a | 0.20 ± 0.0 a | 22.8 ± 0.6 b | ||||||
| Filtercake600 | 932.5 ± 58.4 a | 5.9 ± 0.3 c | 100.0 ± 2.8 b | 2829.3 ± 8.9 a | 0.19 ± 0.0 a | 21.6 ± 1.2 b |
© 2017 by the authors. Licensee MDPI, Basel, Switzerland. This article is an open access article distributed under the terms and conditions of the Creative Commons Attribution (CC BY) license (http://creativecommons.org/licenses/by/4.0/).
Share and Cite
Speratti, A.B.; Johnson, M.S.; Martins Sousa, H.; Nunes Torres, G.; Guimarães Couto, E. Impact of Different Agricultural Waste Biochars on Maize Biomass and Soil Water Content in a Brazilian Cerrado Arenosol. Agronomy 2017, 7, 49. https://doi.org/10.3390/agronomy7030049
Speratti AB, Johnson MS, Martins Sousa H, Nunes Torres G, Guimarães Couto E. Impact of Different Agricultural Waste Biochars on Maize Biomass and Soil Water Content in a Brazilian Cerrado Arenosol. Agronomy. 2017; 7(3):49. https://doi.org/10.3390/agronomy7030049
Chicago/Turabian StyleSperatti, Alicia B., Mark S. Johnson, Heiriane Martins Sousa, Gilmar Nunes Torres, and Eduardo Guimarães Couto. 2017. "Impact of Different Agricultural Waste Biochars on Maize Biomass and Soil Water Content in a Brazilian Cerrado Arenosol" Agronomy 7, no. 3: 49. https://doi.org/10.3390/agronomy7030049
APA StyleSperatti, A. B., Johnson, M. S., Martins Sousa, H., Nunes Torres, G., & Guimarães Couto, E. (2017). Impact of Different Agricultural Waste Biochars on Maize Biomass and Soil Water Content in a Brazilian Cerrado Arenosol. Agronomy, 7(3), 49. https://doi.org/10.3390/agronomy7030049