1. Introduction
In New Zealand, just over 1% of farmland is managed organically. The objective of sustainability is an overarching tenet of the organic approach. By avoiding the use of soluble fertilizers and pesticides, organic growers aim to minimize adverse effects of agriculture on the environment. With an adequate supply of nutrients, organic farming in New Zealand can be sustainable long-term, but there are particular concerns about supplies of N [
1]. Replacing N removed by crops and N lost by other processes must be achieved either by growing legumes to fix N from the atmosphere, and/or by addition of N–containing organic materials.
Composted organic waste and farmyard manure can be important N sources for organic enterprises but, unlike many other parts of the world, New Zealand does not have large numbers of housed animals to provide bulk manure for organic farming. However, about 726,000 t of municipal garden and kitchen wastes are buried in New Zealand landfills annually. Waste management regulators in many New Zealand cities are turning to compost production to reduce the volume of organic waste that ends up in landfills. Organically certified compost (N content typically 2% to 2.5%) is available from some municipal composting plants.
International research has shown that municipal compost can be beneficial as both a soil conditioner and a slow release nutrient source [
2,
3,
4]. In conventional systems, rates of compost required to supply agronomic N needs are typically too high to be economically feasible. However, compost use in organic crop production may be economic, partly because of the price premium that organic produce attracts. Responses beyond the first crop after application may also need to be considered, for example, a study by Sullivan
et al. [
3] demonstrated the long-term benefits of a high rate (155 t·ha
−1) compost application, which released N over a 7-year period.
In order to be effectively used as a source of N on organic farms, the rate of N release (mineralization) must be known. The C:N ratio is widely regarded as a useful indicator of the N mineralization potential of composts; when the compost C:N ratio is ≤25:1 there may be a release of mineral N because microbial immobilization of N is less than (gross) mineralization [
5,
6]. However, Gagnon and Simard [
7] found that there was little or no mineralization of N after incubating on-farm and industrial composts (C:N ratio mostly well below 20) with soil for 13 weeks. Mamo
et al. [
8] found that net N immobilization occurred in compost-amended soils even though the C:N ratio was less than 20. Mineral N content is also cited as an indicator of the short-term availability of N from compost [
9]. For example, Helgason
et al. [
10] and Gagnon
et al. [
11] recommended that N availability from composts be based primarily on their mineral N content prior to application.
Sparingly soluble forms of P (
i.e., reactive phosphate rock) are permitted as P fertilizer in organic farming in New Zealand but these may not be effective in many circumstances (especially in high pH soils in low rainfall environments). Municipal compost may be a useful P source for organic crops, though there is limited published information on the P availability of compost. Evanylo
et al. [
12] found that available P increased by 225% after a 144 t·ha
−1 (dry weight) application of compost. However, Eghball
et al. [
13] and Sharpley and Moyer [
14] cautioned that compost applied at agronomic N rates may pose a risk of elevated P in runoff.
Understanding the release rates of N (and other nutrients) from compost will allow its use to be optimized to meet the requirements of crops. In this paper we use results from two field trials (referred to as “Forage” and “Arable” trials) and two laboratory studies (referred to as “Forage” and “Arable” incubations) to evaluate the potential of municipal compost as a source of nutrients (particularly N) for organic crop production in New Zealand’s high yield potential environment.
2. Experimental Section
Two field trials were conducted to evaluate the use of municipal compost in production of forage and arable crops. The composts used in these trials came from the Timaru and Christchurch municipal composting plants, respectively. Both composts were produced according to commercial standards (NZS 4454:2005, Composts, Soil Conditioners and Mulches) prescribed by Standards NZ using municipal green-waste and food waste (bio-solids not allowed). The composition of the composts are shown in
Table 1.
2.1. Field Trials
2.1.1. Forage Trial
The Forage trial was established 7 November 2007 (early summer) on a dryland sheep/beef grazing property at Albury, New Zealand (WGS84 44°16’18’’ S, 170°54’11’’ E), where annual long-term average rainfall is 650 mm. The soil was a Templeton silt loam (Dystric Ustochrept) of ~0.5–1 m depth overlying greywacke alluvium gravels. Physico-chemical properties of the soil are given in
Table 2. The trial included four treatments (compost applied at 0, 25, 50 and 100 t·ha
−1 fresh weight, equivalent to 13, 26 and 51 t·ha
−1 dry weight), each replicated seven times in an extended Latin Square design. This design was used to account for any spatial variability in topsoil depth, stone content and grazing orientation. Plot size was 40 m × 20 m. The compost was surface broadcast in a one-off application to a fallow paddock. The first crop of ‘Sovereign’ kale (
Brassica oleracea acephala L.) was direct drilled on the day after compost application (seed rate was 4 kg·ha
−1).
No fertilizer was applied at sowing. All plots received 46 kg·ha−1 of N (as urea) and 1 kg·ha−1 of B in mid-December 2007, and a further 12 kg·ha−1 of urea-N in January 2008 (total N applied = 58 kg·ha−1). The kale was break-fed to a herd of 65 beef cattle between 1 June and 16 September 2008.
Dry matter yield of the kale crop was measured just prior to initiation of grazing. To achieve this, all above ground plant biomass was removed from three representative 1 m
2 sample areas within each plot. After determining their fresh (“wet”) weight, five representative plants were removed from each sample, dissected into stem and leaf and oven-dried at 60 °C to measure dry matter content. Nitrogen content of the stems and leaves was determined (using a LECO TruSpec C/N analyzer, LECO Corporation, St. Joseph, MO, USA) to enable crop N uptake to be calculated (N uptake calculated as plant N concentration × dry matter yield). Crop N derived from compost was estimated relative to the control plots by subtracting N uptake without added compost from the amount of N recovered by the crops following compost application. This calculation involves the assumption that N accumulation in plant roots was not affected by compost application. As the proportion of total plant N found in the roots of forage (and arable crops) is only ~10% [
17], this assumption will result in only a minor underestimation of compost N recovery.
The trial continued through until 2010. In November 2008 the trial was sown with a second crop of kale (“Sovereign”), in July 2009 winter barley (Hordeum vulgare L., “Tavern”) was sown and in February 2010 the trial was sown with an oat crop (Avena sativa L.). Fertilizer N applications to these crops were 52 kg·ha−1 to the kale crop, 155 kg·ha−1 to the barley crop and 73 kg·ha−1 to the oat crop. Biomass yield and N uptake were determined as described for the first kale crop.
The effect of compost on P availability was examined by measuring Olsen P [
18] in samples collected to a depth of 15 cm.
2.1.2. Arable Trial
The Arable trial was established in 2009 on an irrigated paddock on the Lincoln University Cropping Farm near Christchurch, Canterbury, New Zealand (WGS84 43°38’11” S, 172°276’16” E) where long-term average rainfall is 680 mm per year. The soil (
Table 2) at this site is a deep, stone-free Paparua silt loam (Typic Haplustept) with a history of continuous intensive cropping. This soil had similar clay content to the Forage soil but its sand content was greater (
Table 2). The trial included 12 treatments, each replicated three times (plot size was 20 m × 11 m). The treatments discussed in this paper are the three rates of applied compost,
i.e., 0, 25 and 50 t·ha
−1 fresh weight (equivalent to 12 and 25 t·ha
−1 dry weight). The surface-applied compost was incorporated into the top 10 cm and maize (
Zea mays L., ‘Pioneer hybrid variety, 39G12’) was drilled on 23 October 2009. The maize crop was irrigated with ~140 mm water.
Triple superphosphate fertilizer (200 kg·ha−1) was applied with the seed at sowing. A standard rate of fertilizer N (68 kg N·ha−1) was applied to all three treatments. The maize crop was cut for silage in April 2010. The dry matter yield was measured by sampling two areas of 10.5 m2 from each plot. Plant tissue samples were analyzed for N (LECO Truspec C/N analyzer) and crop N uptake was calculated as plant N concentration × dry matter yield.
This trial continued through until 2012. In May 2010, a wheat crop (Triticum aestivum L., “Excede”) was grown in the plots and this was followed by an oat (‘Milton’)/ryegrass (Lolium perenne L., “Feast 2”) mix, which was sown in March 2011 (oats were harvested 5 months prior to the ryegrass). Fertilizer N applications to these crops were 193 kg·ha−1 to the wheat crop and 60 kg·ha−1 to the oat/ryegrass mix. Nitrogen recovered by the crops from the one-off application of compost was measured as described above.
2.2. Incubations
Two laboratory incubations were carried out in conjunction with the field trials to measure compost N (and C) mineralization rates under controlled conditions: (1) using the soil from the Forage trial and the compost that was applied in that trial (Timaru compost), and (2) using soil from the Arable trial and compost applied in that trial (Christchurch compost).
Soil from the respective trial sites (
Table 2) was passed through a 4 mm sieve and sub-samples (80 g dry weight) were weighed into plastic vials and adjusted to 90% of field capacity (field capacity defined as moisture content at −5 kPa). This soil moisture level was maintained over the duration of the incubation. The vials of soil were placed in airtight plastic containers (five vials per container) and pre-incubated for 3–5 days (3 days for the Forage trial soil and 5 days for Arable trial soil) at room temperature to allow the soils to equilibrate before compost addition. For the Forage trial incubation, compost was applied at four rates equivalent to 0, 25, 50 and 100 t·ha
−1 (fresh weight), whereas for the Arable trial incubation there were only two application rates (equivalent to 0, 25 t·ha
−1, fresh weight). The required amount of compost was mixed into the soil which was then packed to a bulk density of 1.1 g·cm
−3 (the soil layer was 2 cm deep which facilitated diffusion of oxygen through the sample). The vials of soil were placed in air-tight plastic containers (5 L volume; the containers were fitted with rubber septa to facilitate headspace gas sampling) and incubated at either 18 or 20 °C (18 °C for the Forage trial incubation and 20 °C for the Arable trial incubation) for 90 days. The small temperature difference between the two incubations would have had only a small effect on compost mineralization (assuming a Q
10 of 2, the mineralization rate would be about 15% greater at 20 °C than at 18°C). Five replicates of each of the treatments were included in the Forage trial incubation and there were four treatment replicates in the Arable trial incubation.
Carbon mineralization was measured by determining CO2 evolution. At intervals throughout the incubation period, headspace gas samples were collected using a syringe and analyzed for CO2 using an infra-red gas analyzer (LICOR LI-7000 CO2/H2O analyzer, LI-COR Biosciences, Lincoln, NE, USA). After gas sampling, the containers were opened and flushed with fresh air to return CO2 concentrations to ambient levels before replacing them in the incubator.
At the beginning of the incubation and at five times during the incubation (day 1, 5, 11, 26, 54 and 90 at the Forage trial and at day 0, 6, 13, 27, 55 and 90 for the Arable trial) one of the vials was removed from each of the containers to measure mineral N. The soil was passed through a 4 mm sieve, and subsamples were extracted with 2
M KCl to remove mineral N. Ammonium- and nitrate-N in the KCl extracts were determined by standard colorimetric methods [
16] using an automated colorimeter (Model QuickChem 8000 FIA+, Lachat Instruments, Loveland, CO, USA).
2.3. Statistical Analyses
Results from each trial were analyzed using Analysis of Variance (ANOVA). A pooled estimate of the variation associated with the estimated means are provided by the least significant difference (LSD) at the 5% level of significance. The relationships between N recovered by Forage and Arable crops from compost and the input of mineral N in compost, and between Olsen P and compost application rate, were modelled by simple linear regression. The difference between N mineralization over time between “with” and “without” compost treatments was also modelled by linear regression.
3. Results and Discussion
3.1. Composition of Composts
Although the two composts used in the studies were produced at different composting facilities, they were relatively similar in composition (
Table 1). Both composts had a dry matter content of ~50%. On a dry weight basis, organic matter comprised almost 50% of the compost applied in the Forage trial but only 37% of the compost applied in the Arable trial. Total N concentration ranged from 21 to 25 g·kg
−1, of which ~10% was mineral N. The C:N ratio of both composts was relatively low (~11:1).
In addition to N, other nutrients, including K, P and S, were present in agronomically-significant concentrations (
Table 1). For example, an application of 50 t·ha
−1 (fresh weight) of compost would supply ~350 kg·ha
−1 of K, which is greater that the K requirement of crops.
Heavy metal concentrations in the composts were generally within the limits set by BioGro (largest certifier of organic produce and products in New Zealand), although Cu and Pb were marginally high in compost used in the Arable and Forage trials, respectively. As concluded by Fagnano
et al. [
22], the accumulations of heavy metals may be a concern in the long term where municipal compost is repeatedly applied at high rates. However, uptake of some metals may be reduced when compost is applied. Recently Al Mamun
et al. [
23], found that cadmium concentration in vegetable crops was substantially decreased when municipal compost was applied although the mechanism was not identified.
3.2. Compost Decomposition and N Mineralization under Controlled Conditions
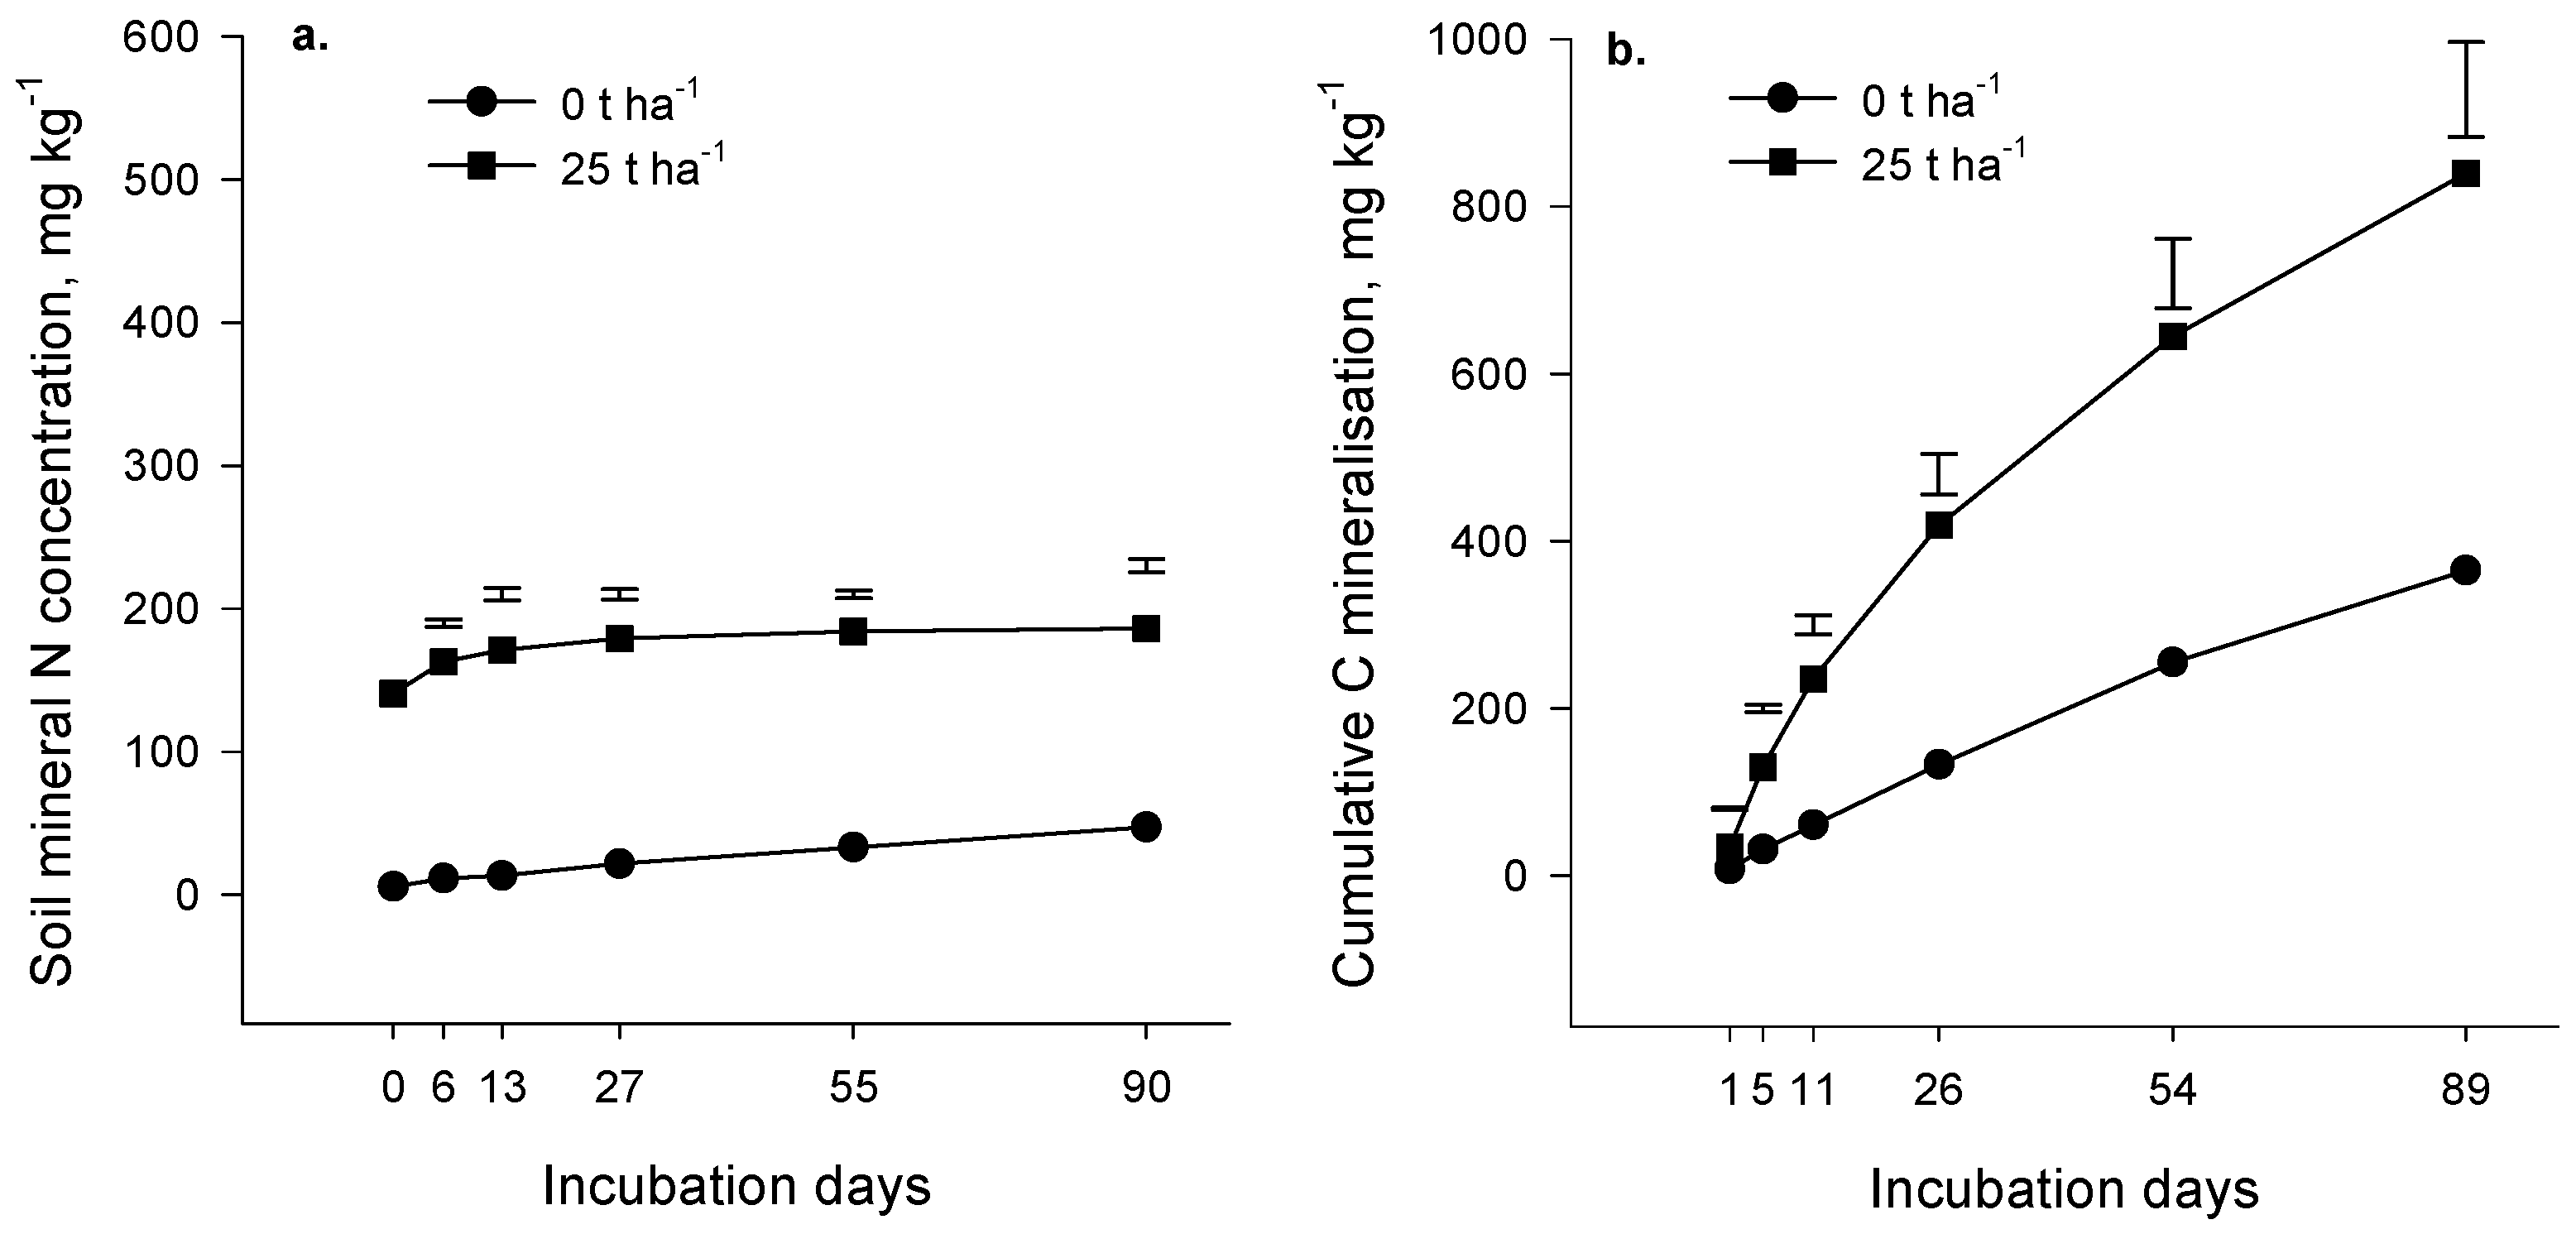
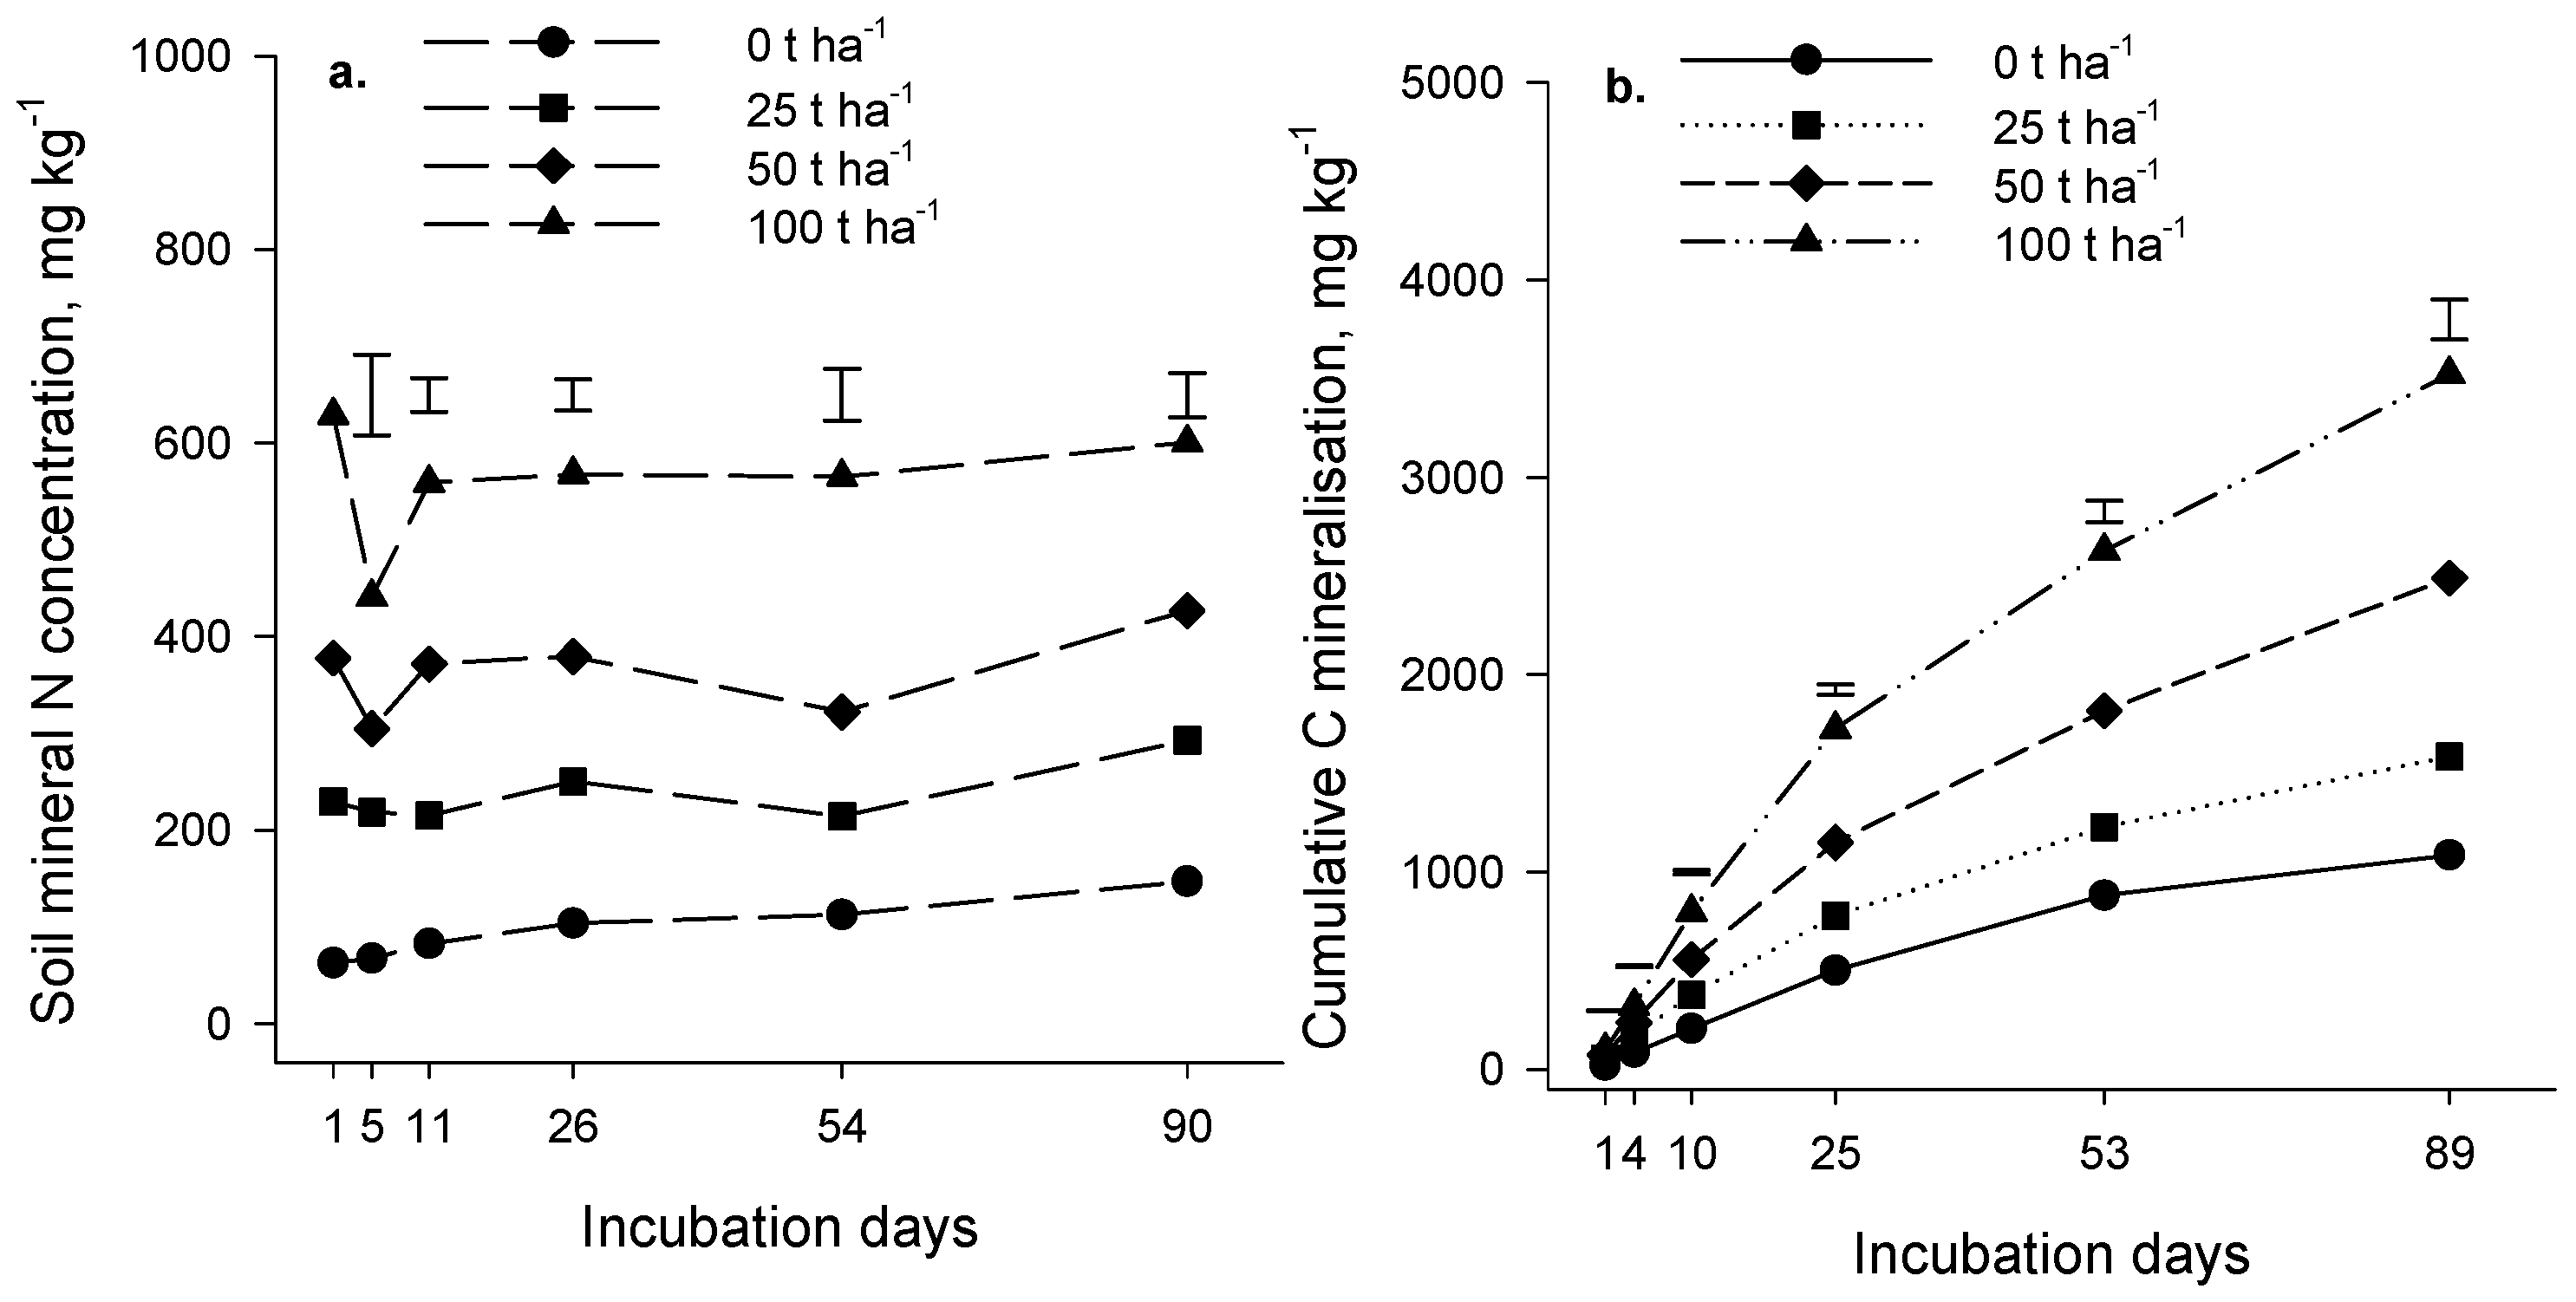
Evolution of carbon dioxide (CO
2) during the incubation experiment increased as the rate of compost addition increased (
p < 0.001,
Figure 1b and
Figure 2b). At all application rates, CO
2 production was rapid initially and gradually slowed as the incubation progressed. The amount of compost decomposed was estimated as the difference between CO
2-C evolution in the presence and absence of compost, expressed as a percentage of the applied compost-C (priming was assumed negligible). The estimated amount of compost decomposed in 90 days was relatively low; in the Forage soil at an incubation temperature of 18 °C, it ranged from 2.9% at the 25 t·ha
−1 application rate to 3.4% at the 100 t·ha
−1 rate. Similar results were obtained for the Arable soil (4% of compost applied at 25 t·ha
−1 decomposed in 90 days at 20 °C). As expected, organic matter in compost was more labile than native soil organic matter (
p < 0.001); on average, 725 mg CO
2-C·kg
−1 of soil C evolved in 90 days from the Forage and Arable soils in the absence of compost compared with 1212 mg CO
2-C·kg
−1 of soil C in compost-treated soil (25 t·ha
−1 rate). We concluded from the incubation results that the composts contained a component of easily decomposable organic matter but a large part of the compost was relatively resistant to decomposition and may persist in soil for several years.
Mineral N, measured immediately after addition of compost, increased as the rate of compost application increased (
p < 0.001) (
Figure 1a and
Figure 2a), reflecting the presence of the mineral N in the compost (the Forage and Arable composts contained 2869 and 1979 mg·kg
−1 of mineral N, respectively;
Table 1).
There was significant N mineralization in the control soils (no compost applied) during the 90 days incubation (
p = 0.065 and
p < 0.001 for the Forage and Arable incubations respectively,
Figure 1a and
Figure 2a). The difference in mineral N between the “with” and “without” compost treatments remained constant during the Forage incubation (
p = 0.813) indicating that there was no net mineralization of compost-N during the incubation. In the Arable soil, the difference in mineral N between the “with” and “without” compost treatments decreased over time (
p < 0.001) suggesting that a small amount of immobilization may have occurred after compost addition. In the control treatment (compost not added) mineralized N represented 0.26% and 0.19% of total soil N for the Forage and Arable soils respectively.
Our results suggest that N and C mineralization may be decoupled where compost is applied such that C mineralization occurs without net mineralization of N. It is possible that the compost organic constituents that decomposed during the incubation were low in N. However, a more likely explanation is that immobilization of N by the microbial biomass was sufficient to offset gross mineralization of compost N, with the result that net mineralization was negligible.
Nitrogen immobilization is frequently associated with C-rich substrates and the C:N ratio may be indicative of the potential for net N mineralization [
5,
24]. Based on guidelines developed by Wallace (2006) (cited by Prasad [
5]), 17.5%–25% of N in composts with low C:N ratios, as used in this study, would be expected to mineralize in a three month period. Our results confirm that the C:N ratio did not provide a reliable basis on which to forecast the supply of mineralized N to crops grown on soil treated with municipal compost.
3.3. Crop Yield Response and Recovery of Compost N
The two field trials were conducted on soils with good physical and chemical characteristics (
Table 2). As the Arable site was relatively low in Olsen P, fertilizer P was applied at 40 kg·ha
−1 when the maize was drilled. Fertilizer N was applied at standard rates at both field trials (
Section 2.2).
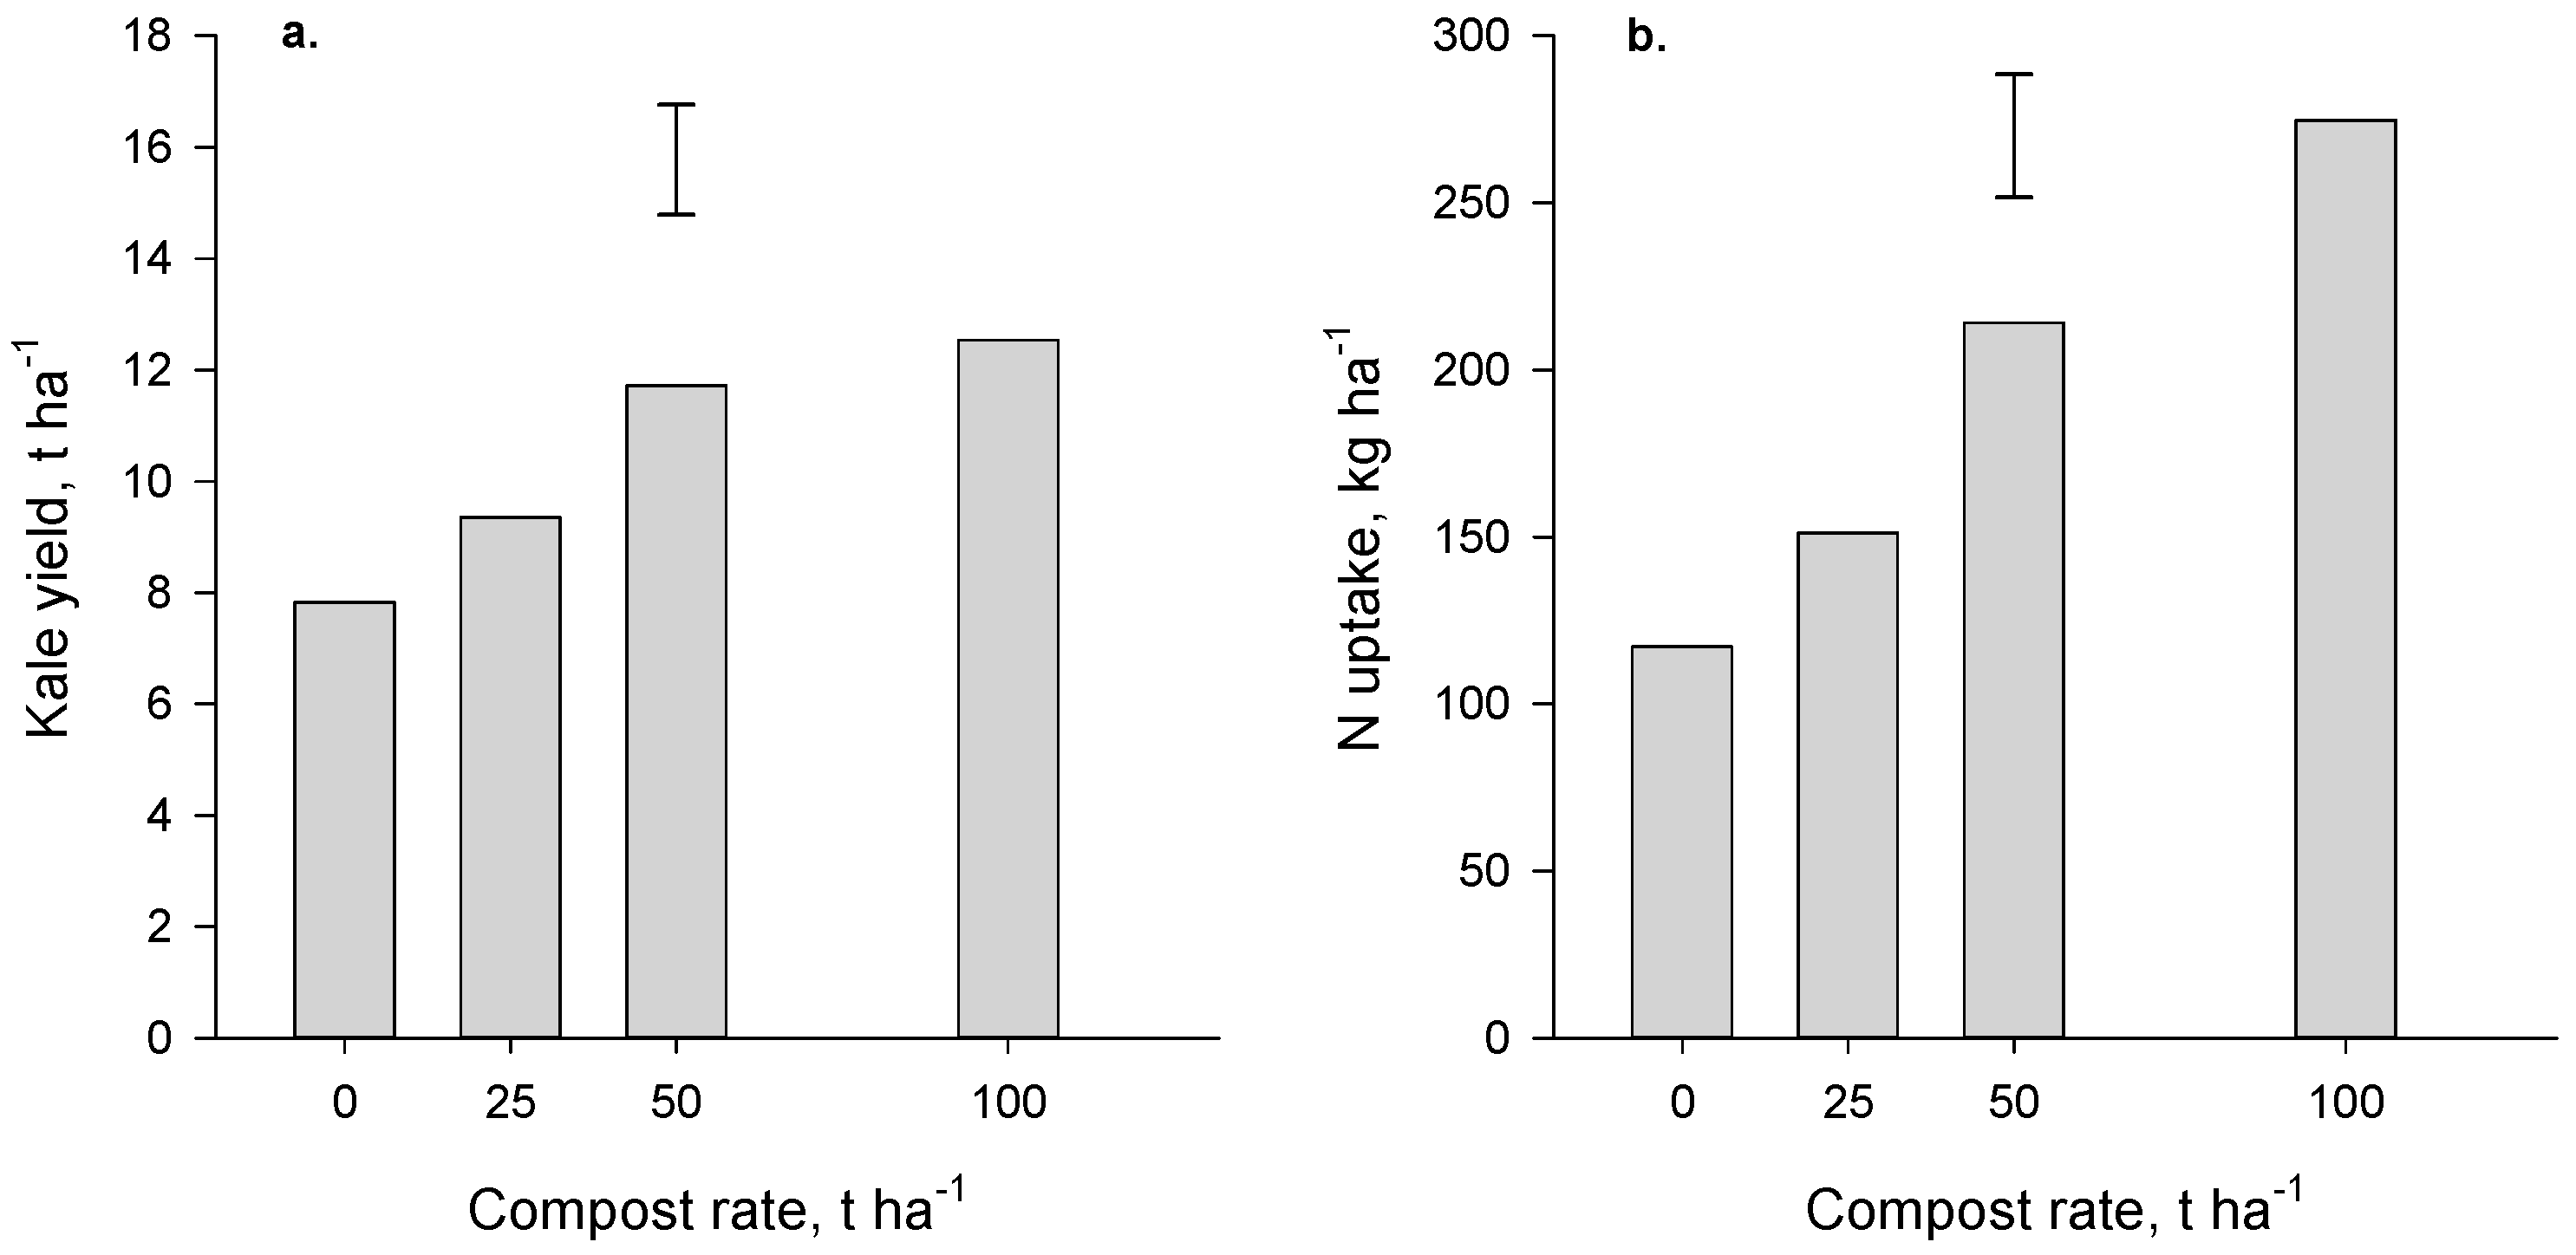
Yields of kale (the first crop grown in the Forage trial after compost application) increased (
p < 0.001) with compost application but there was no significant difference between the two highest rates (50 and 100 t·ha
−1,
Figure 3a). At these high rates, the yield benefit was 3.9 to 4.7 t·ha
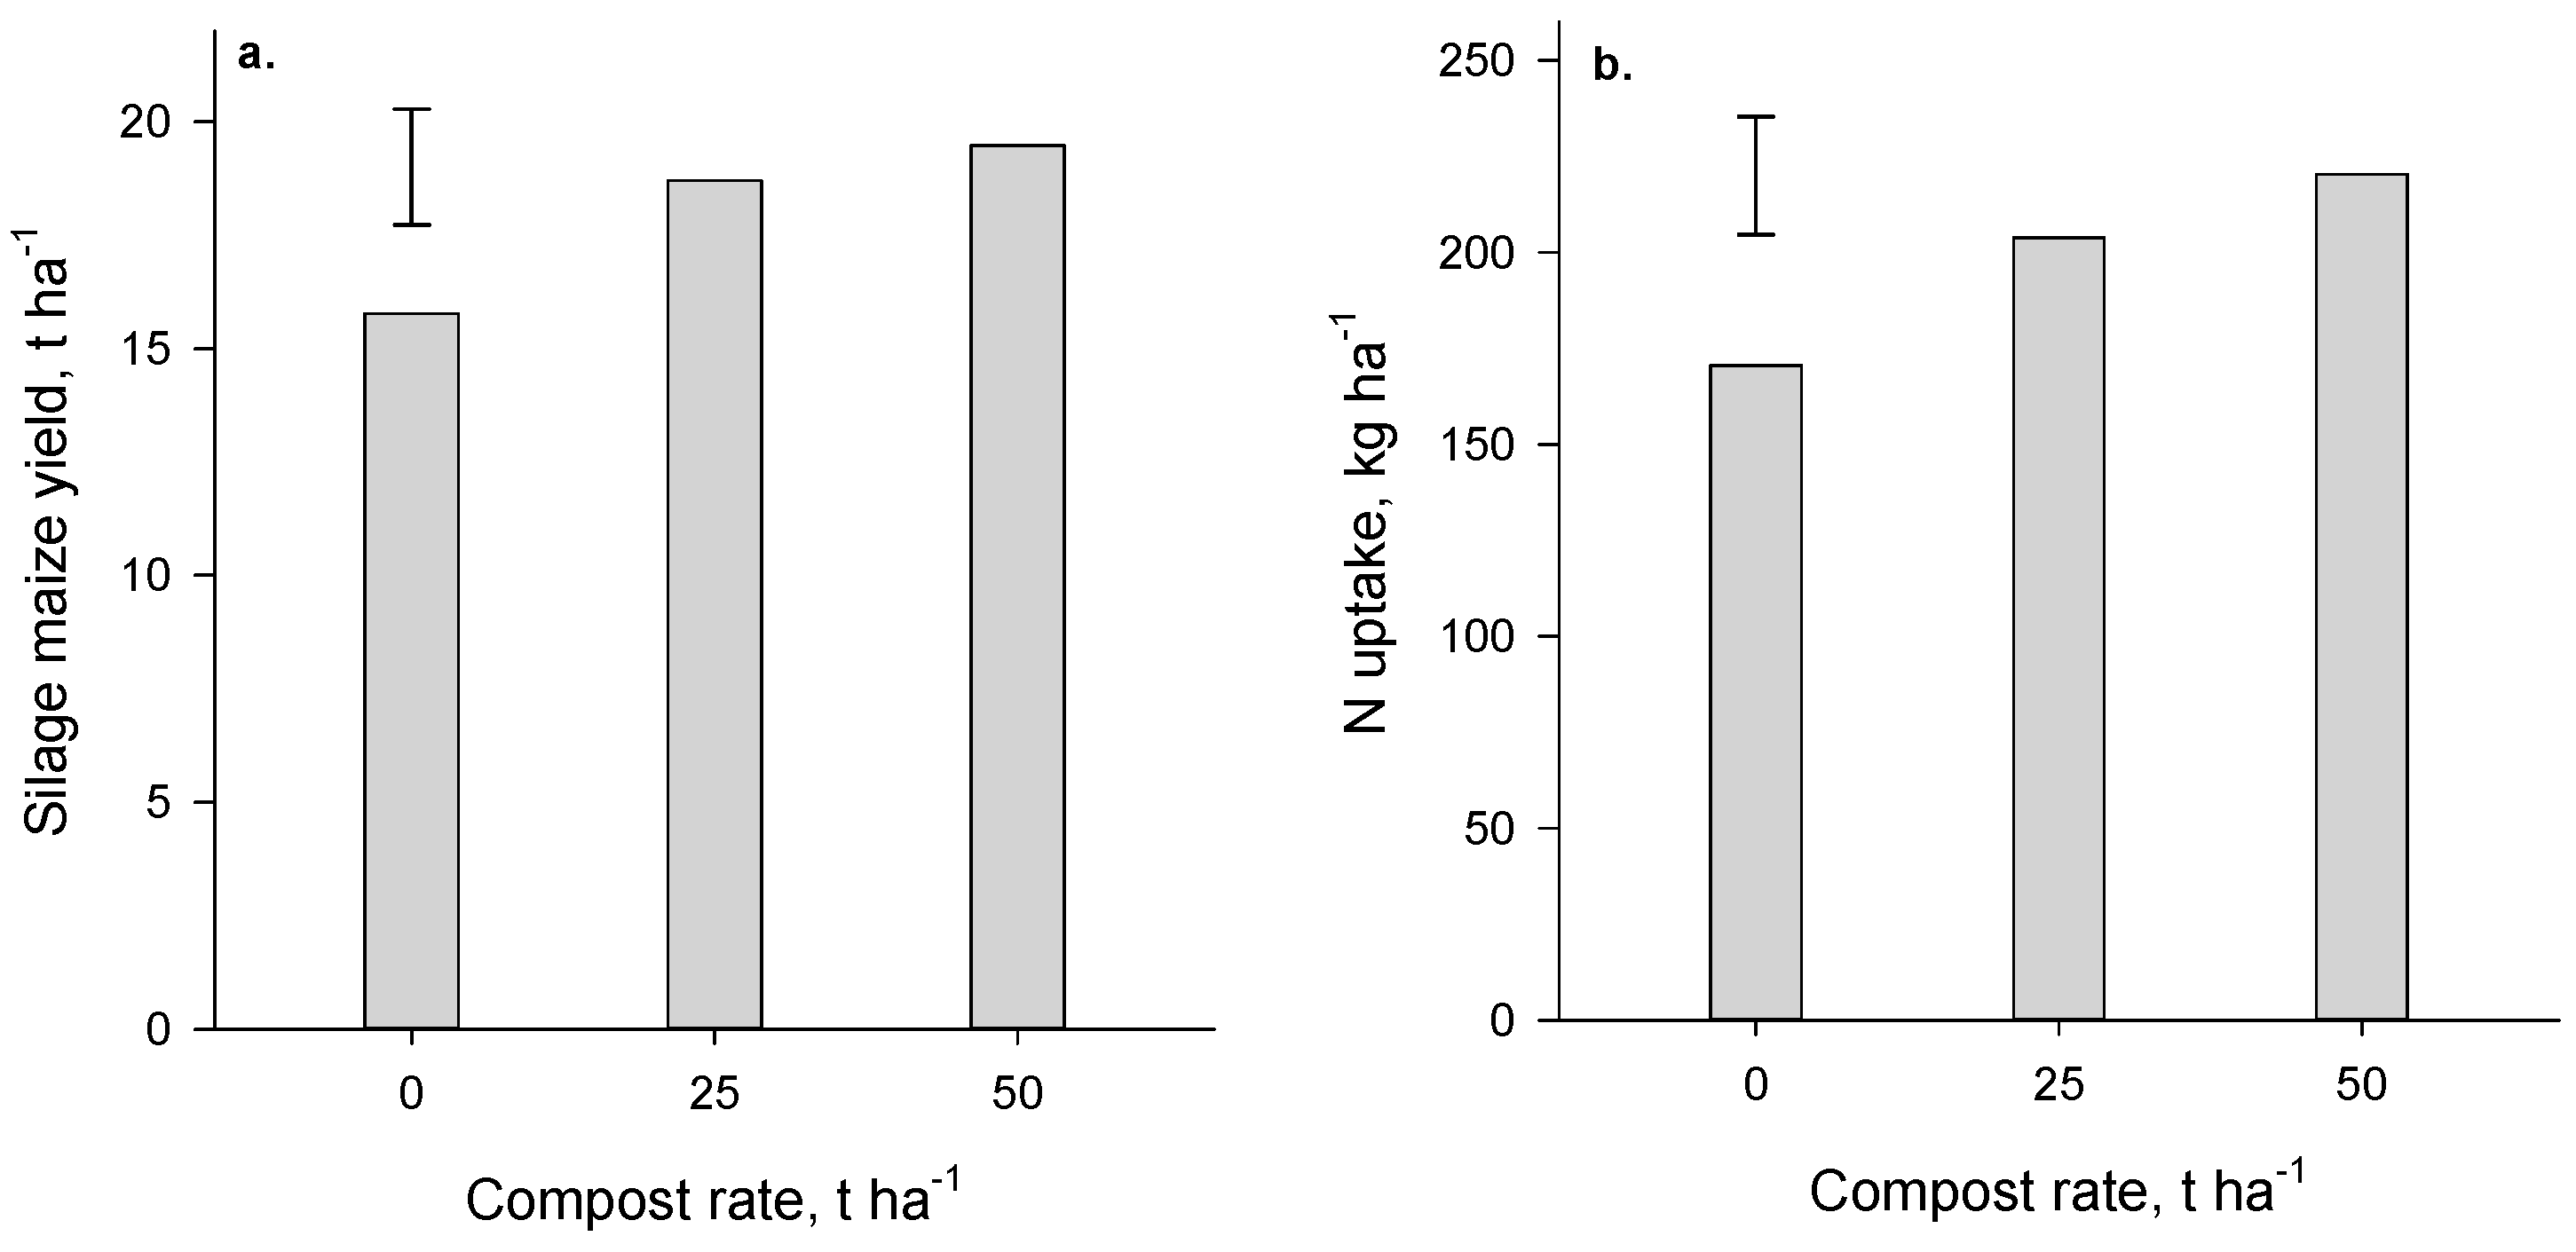
−1, an increase of about 50% relative to the no-compost control. Yields of maize (first crop grown in the Arable trial after compost application) were also increased (
p = 0.027,
Figure 4a) where compost was applied. The yield increase achieved at the high rate of compost was 3.7 t·ha
−1, an increase of ~25% compared with where no compost had been applied.
Crop N uptake also increased significantly where compost was applied (
p < 0.001 and
p = 0.02 for the Forage and Arable trials respectively,
Figure 3b and
Figure 4b). The compost-induced increases in N uptake generally paralleled the yield increases. It is very probable that the beneficial effect of compost in boosting yield (and N uptake) of kale and maize can be attributed to the N supplied by compost.
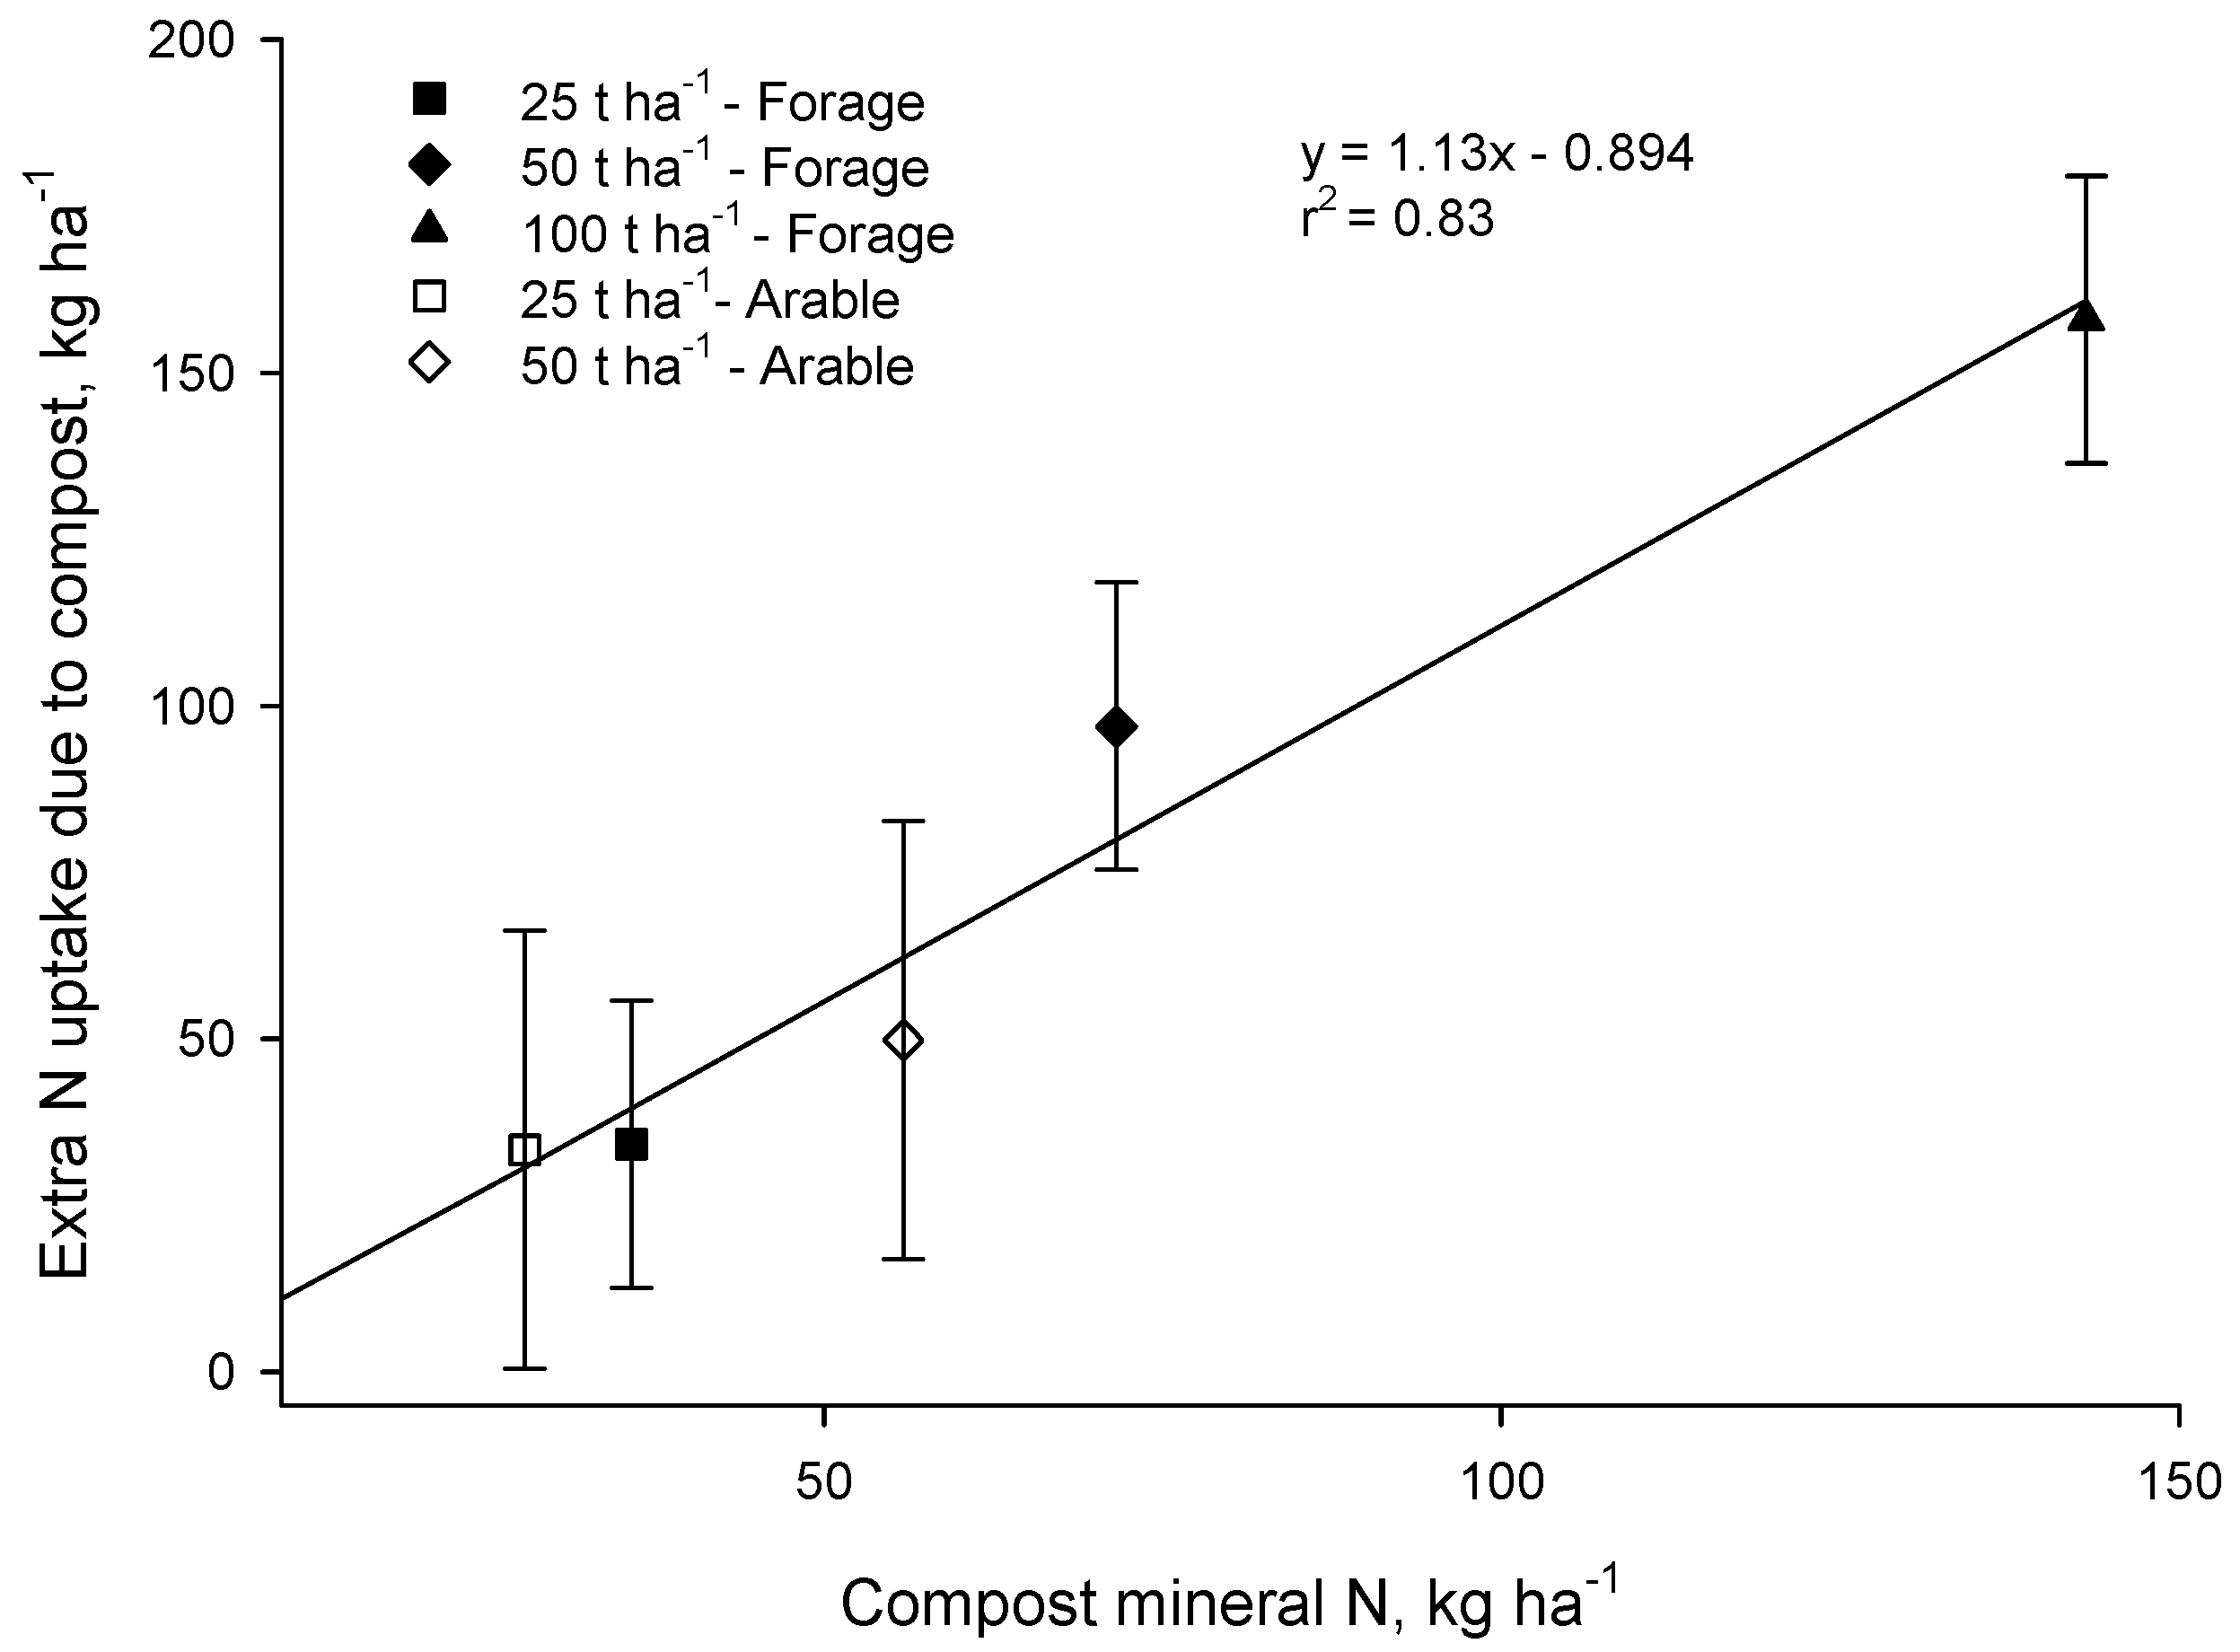
In both the Forage and Arable trials there was a strong correspondence between the additional N taken up where compost was applied and the input of mineral N in compost (
p < 0.001,
Figure 5).
These results are consistent with the 90 days laboratory bioassays which suggested that little of the organic N in compost would become available in the season of application. We conclude that mineral N content of municipal compost, determined at the time of application, can be used to estimate N availability to the crop grown immediately after application. These results align well with those of Gagnon and Simard [
7] and Helgason [
10] who also concluded that mineral N content of compost is a good predictor of plant available N.
3.4. Residual Effects of Compost on N Availability
Long-term (up to 7 years) benefits for N availability from compost have been observed in a number of studies [
3,
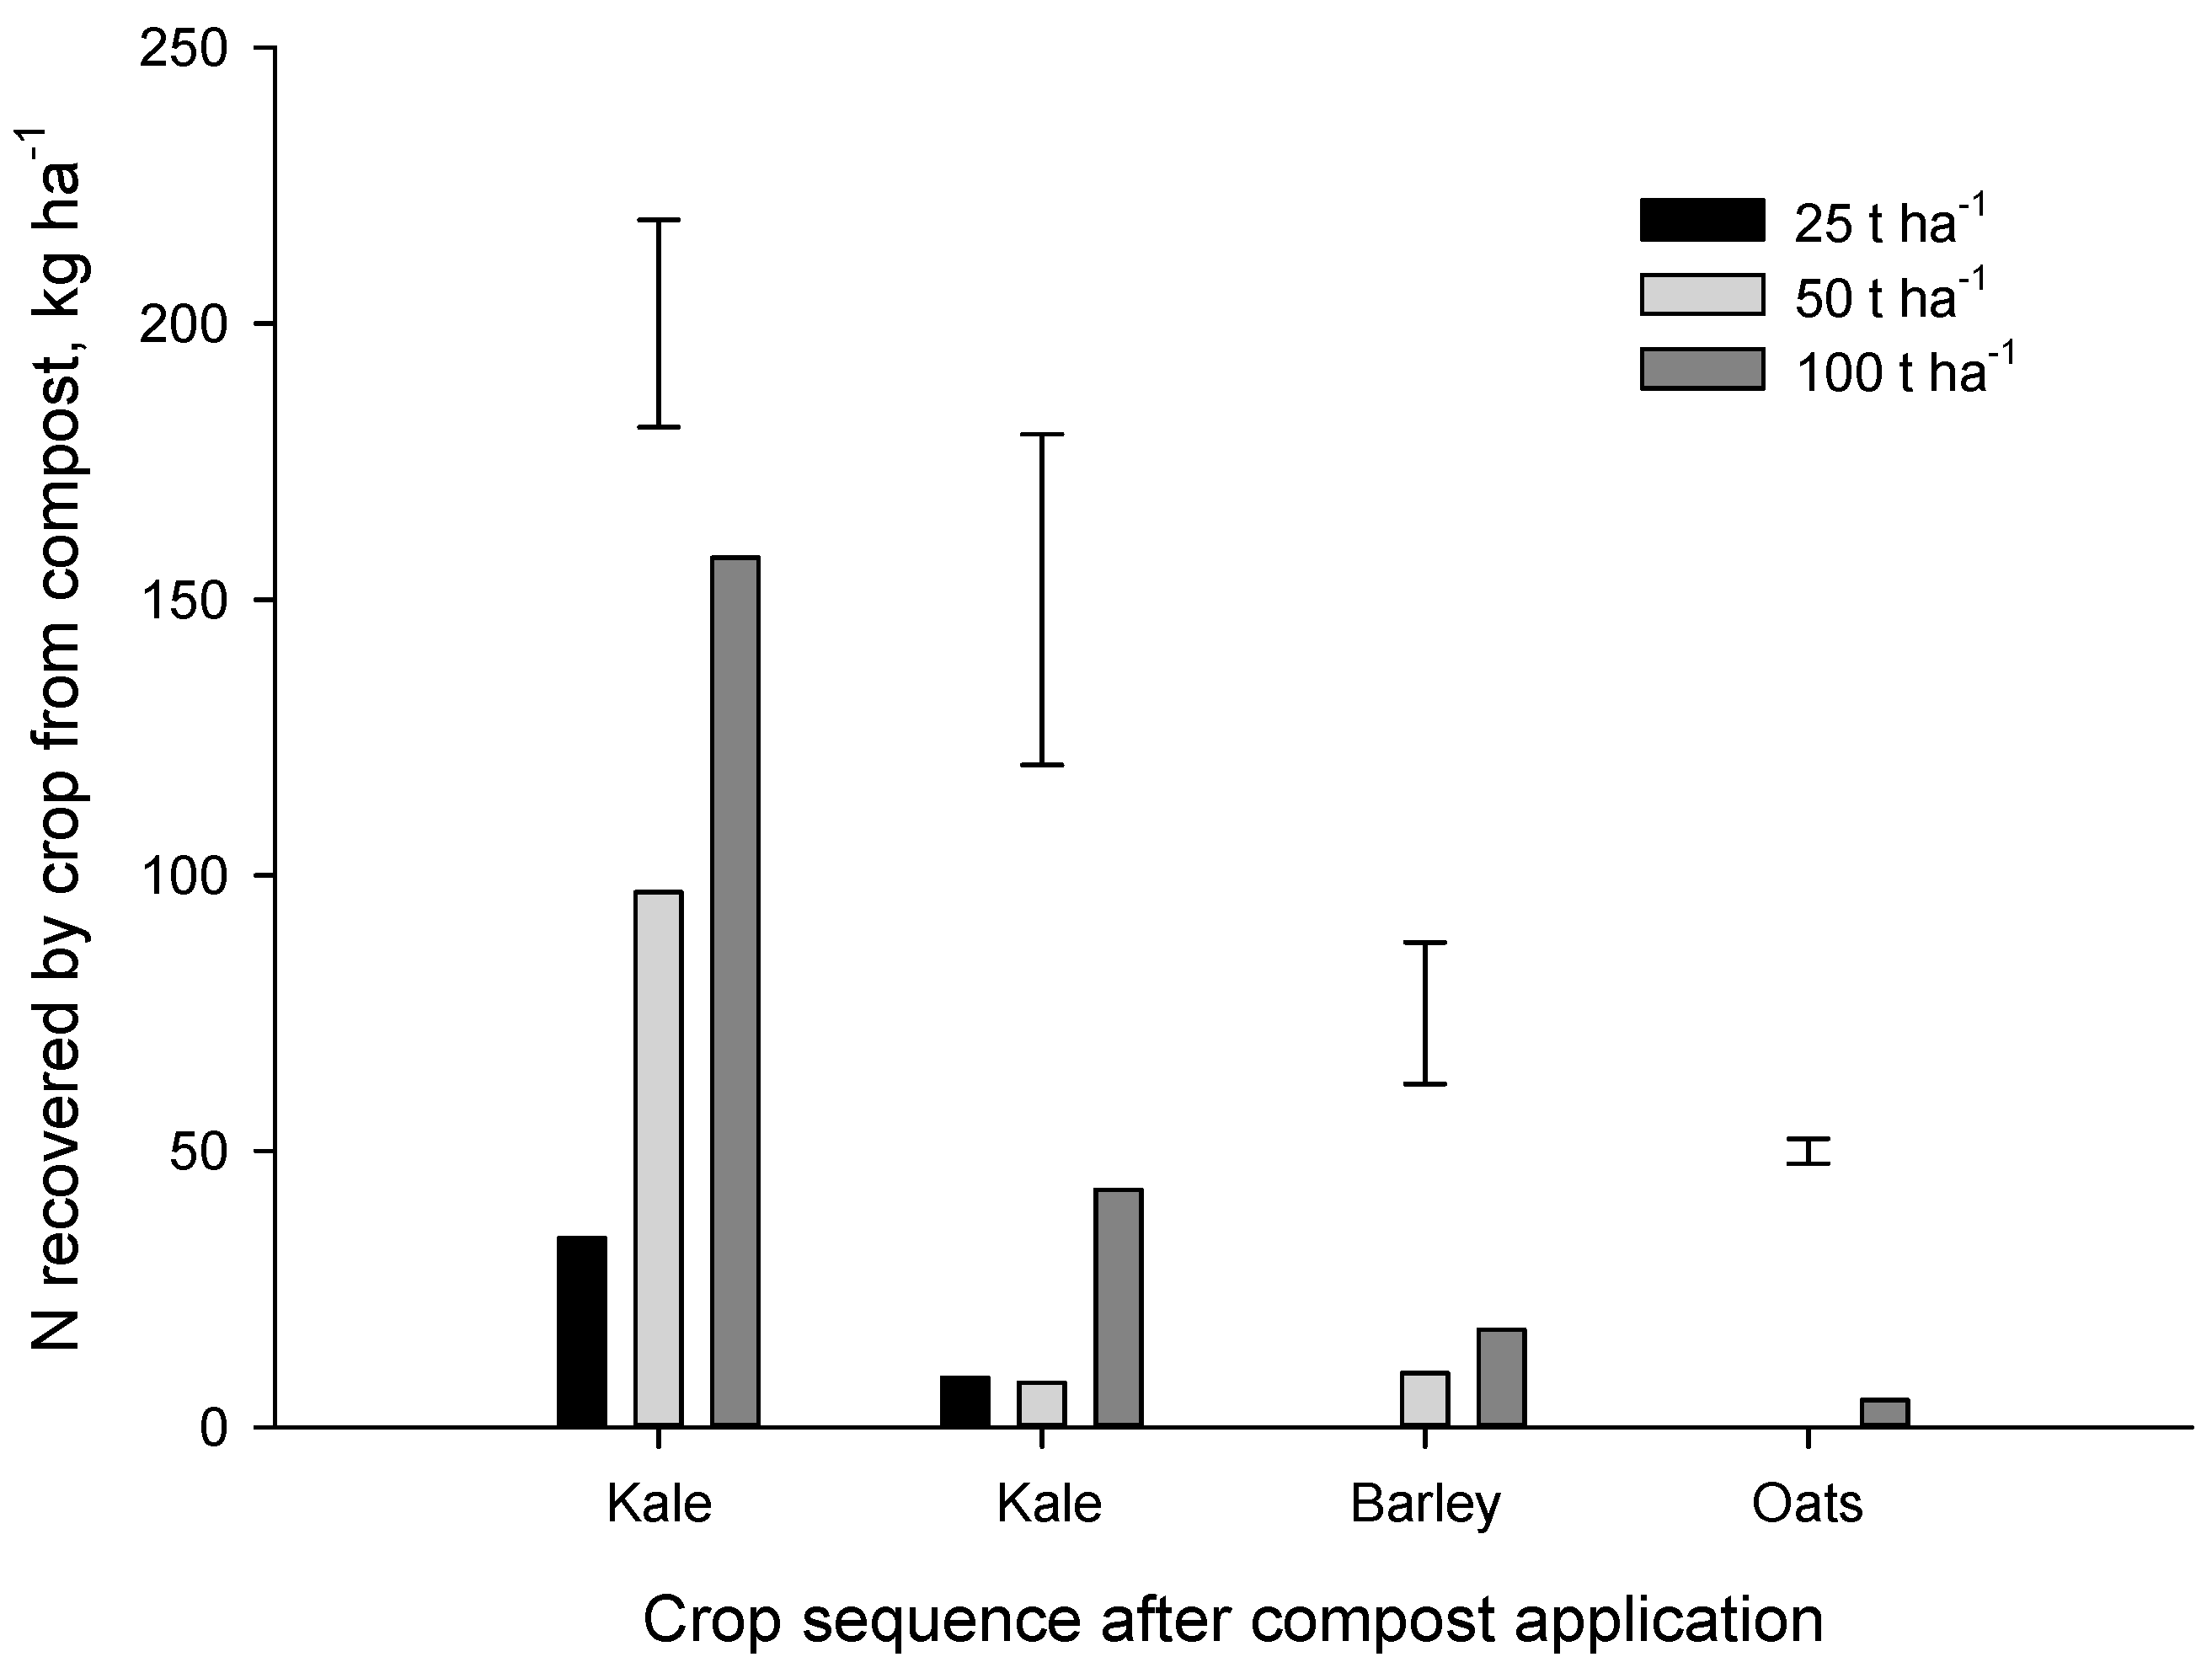
25]. In the Forage trial, N recovery from the one-off application of compost decreased rapidly after the first crop (
Figure 6). At the highest application rate (100 t·ha
−1), N recovery from compost by the first (kale), second (kale), third (barley) and fourth (oat) crops amounted to 157, 43, 18 and 5 kg N·ha
−1 respectively.
Eghball and Power (1999) suggested that 20%, 20%, 10% and 5% of the N applied in composted feedlot manure would become plant available in the 1st, 2nd, 3rd and 4th year after application. Our results for municipal compost were much lower with a N release rate of 12% in year 1 (most of which was mineral N already in the compost at the time of application), and average release rates of 2.3%, 1.0%, 0.5% in the 2nd, 3rd and 4th year after application, respectively. In the Forage trial, only about 17% of compost N was recovered (total for four crops) at the 50 and 100 t·ha−1 application rates. A similar proportion of compost N (~22%) was recovered by the four crops grown after compost application in the Arable trial. As discussed above, the bulk of the N recovered from the municipal composts, particularly in the first year, was mineral N that was present at the time of application. Results from this study suggest that municipal compost can provide some N to organic crops but much of the N appears to be in stable organic N forms that release N very slowly.
3.5. Phosphorus Availability in Compost
The two municipal composts used in our study had similar P contents (total P = 4.2–4.6 kg·t
−1 DM). An application of compost at 50 t·ha
−1 (fresh weight) would provide a P input of ~100 kg·ha
−1. The influence of this P input on plant-available P will depend on the forms of P in the compost. Research has shown that a large proportion (60%–90%) of the P in composts and manures is in inorganic form [
14]. Much of the inorganic P (~80%) may be water-soluble and therefore potentially plant-available.
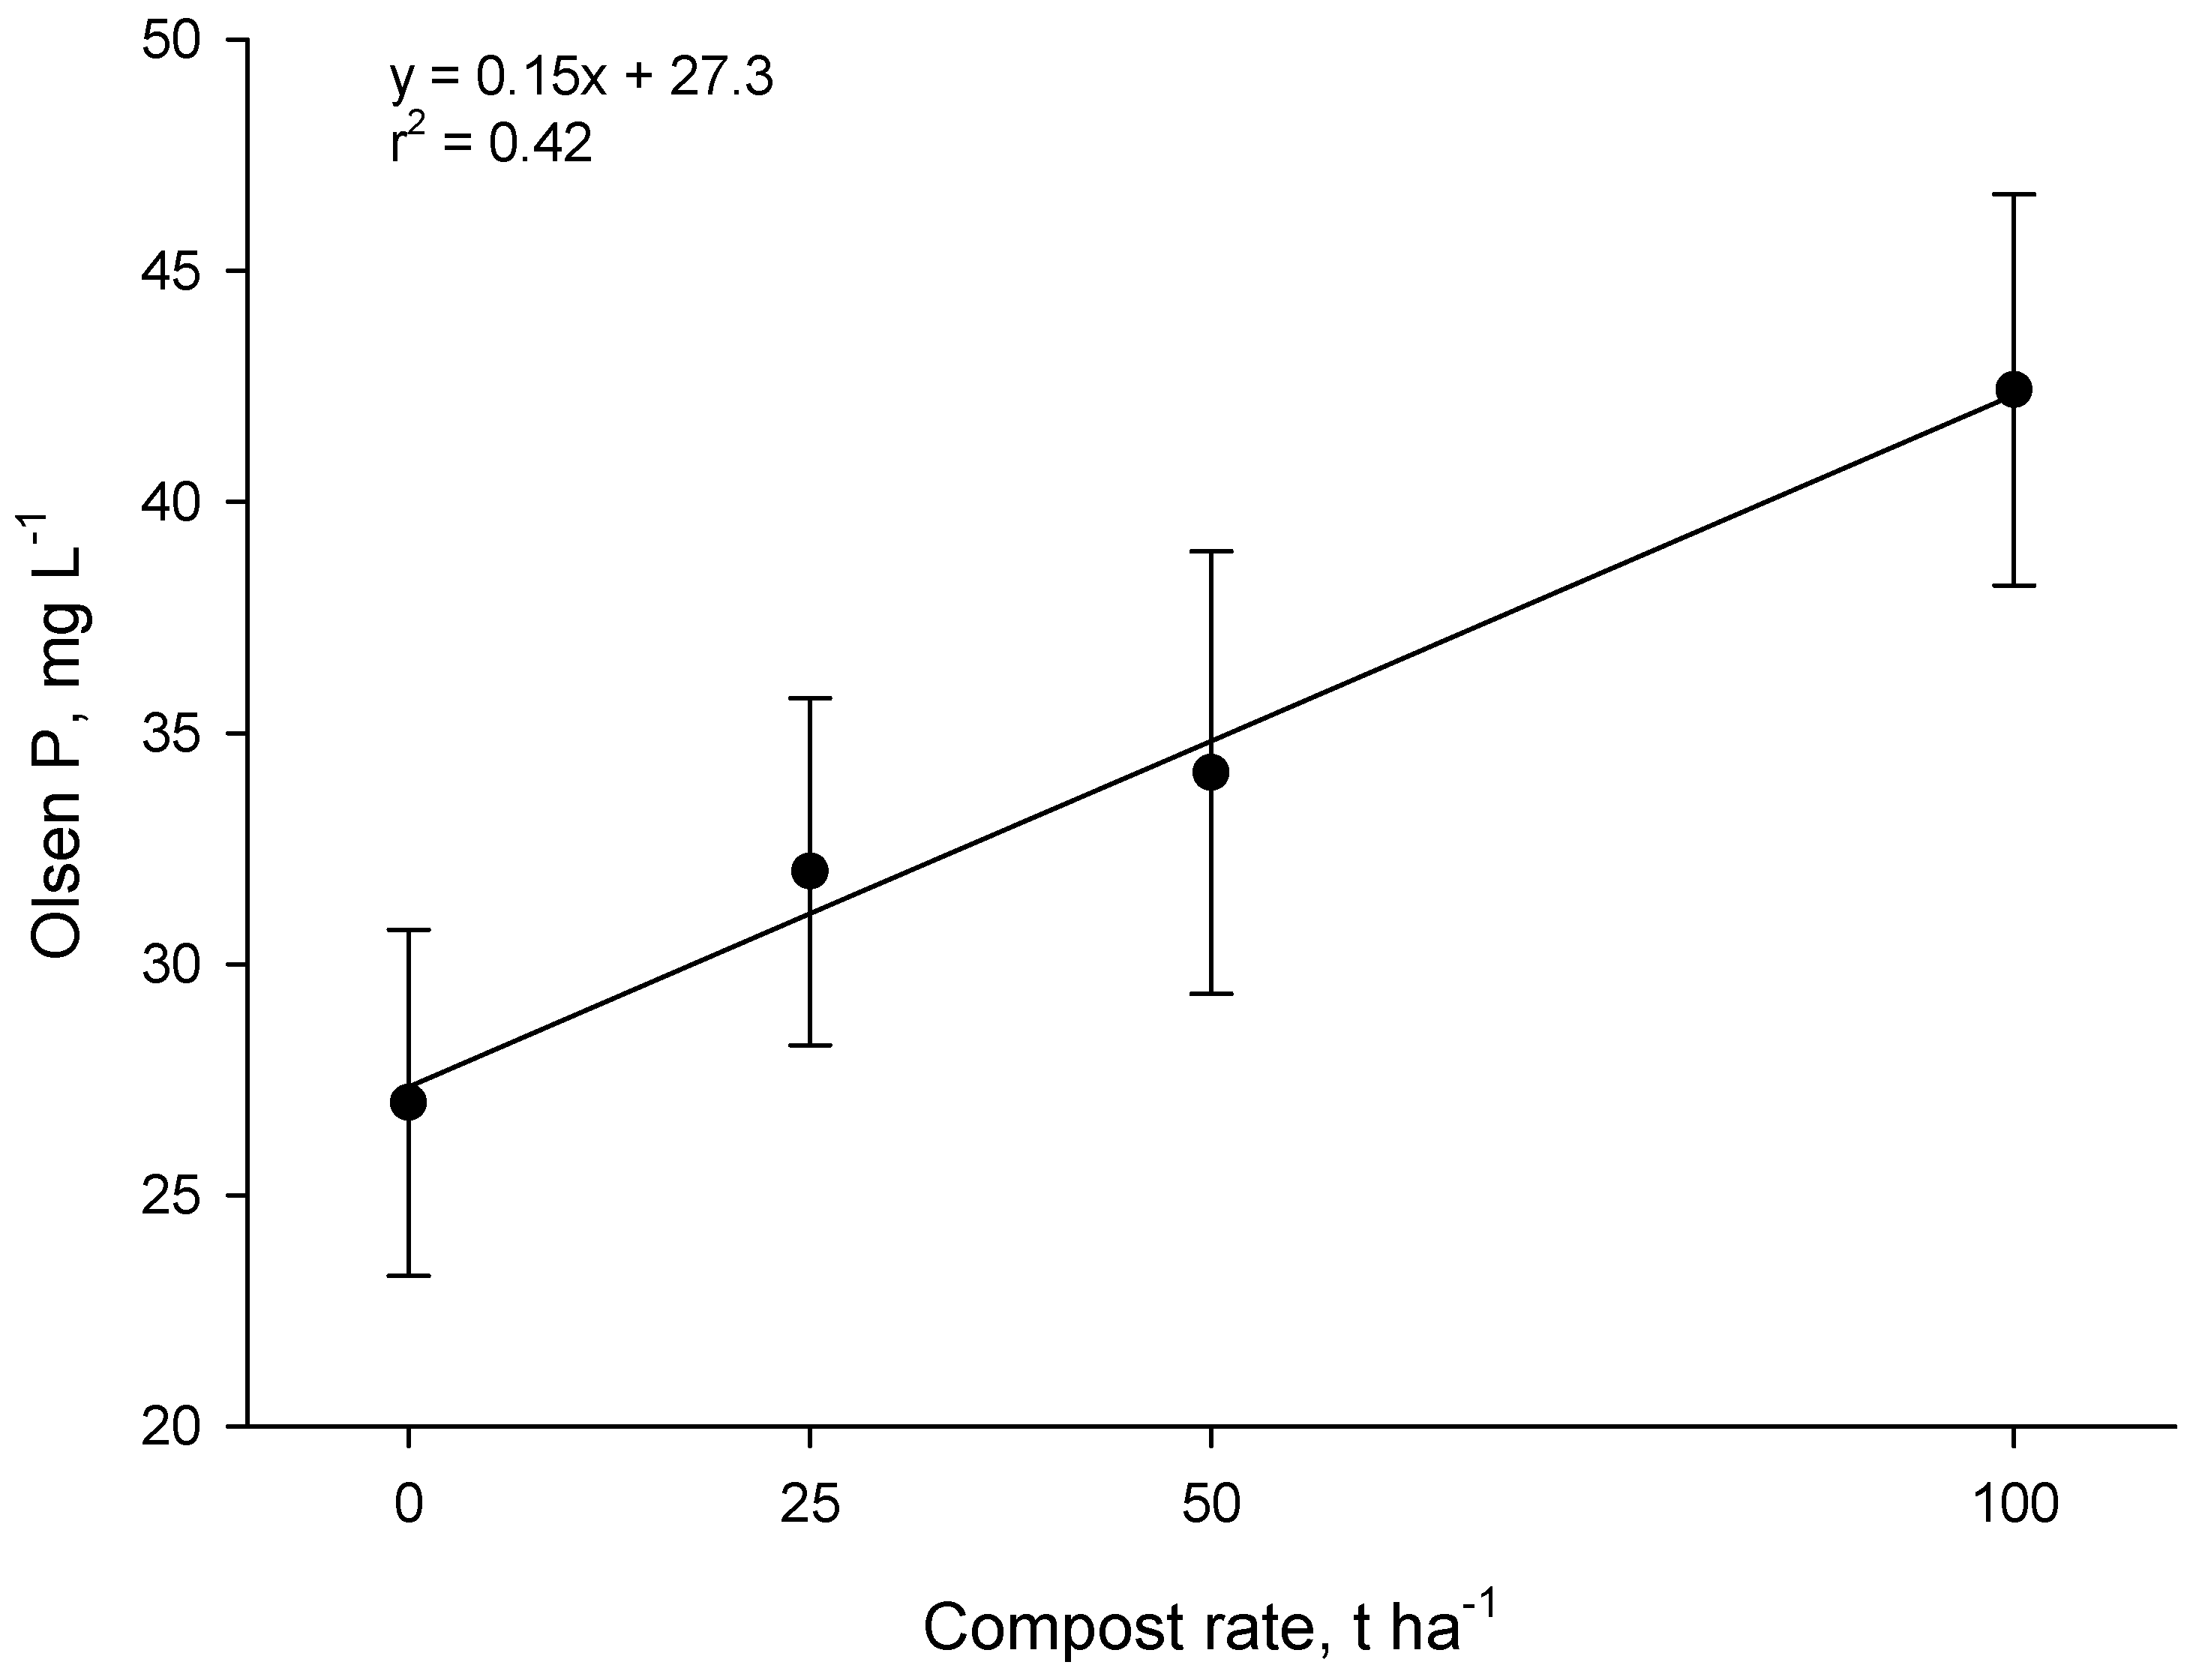
Measurements one year after compost application in the Forage trial showed that Olsen P increased linearly as the application rate increased (
p < 0.001,
Figure 7). The increase in Olsen P for each 1 t·ha
−1 of compost was 0.15 mg·L
−1 of soil. Thus at the 50 t·ha
−1 rate, Olsen P increased by ~7 mg·L
−1. Research in New Zealand shows that ~10 kg·ha
−1 of P fertilizer is required to raise the Olsen P level in sedimentary soils by 1 mg·L
−1 (0–15 cm depth) [
26]. Therefore, the 50 t·ha
−1 application of compost (~100 kg P·ha
−1) had an effect on Olsen P equivalent to about 70 kg·ha
−1 of fertilizer-P. This suggests that much of the P in compost was in forms that were plant-available (presumably water-soluble inorganic P).
Application of excessive water-soluble P at high compost rates may increase the risk of P loss to surface waters by overland flow or subsurface drainage. The need to maintain soil available P within the acceptable range (to minimize P losses to water) may dictate the upper application limit for municipal compost application in organic systems. Decisions on compost loading rate and application frequency should be informed by knowledge of the criteria and measures that have been identified to minimize P losses in conventional systems. A guiding principal is to avoid raising Olsen P to concentrations that exceed the agronomic optimum [
27].
3.6. Implications for Nutrient Management in Organic Cropping
Results from this study suggest that use of municipal compost can partially mitigate one of the major constraints to organic crop production, shortage of plant-available nutrients. When used at a high rate (100 t·ha−1 fresh weight) composts of the type used in this study may supply ~150 kg N·ha−1 to the first crop after application. This N comes from the pool of mineral N that is in the compost at the time of application and, once depleted, the release of N to plants is slow because the organic N in compost is in a form that is resistant to mineralization. We estimated that under field conditions only ~10% of compost N mineralized during the 3–4 years of our trials. Some losses of N via leaching may have occurred; however, leaching of compost N is likely to be small because (1) rainfall in most winters during the field trials was relatively small (between 200 and 400 mm from mid-May to mid-September) and (2) the actively growing winter crops would have been able to “mop up” any of the compost N that mineralized under the cool winter conditions. This was confirmed by field measurements during the first winter of the Arable trial (leaching measured using suction cups) which showed that there was no additional N leached where compost had been applied (p = 0.42).
In contrast to N, a large part of the P in municipal compost was in available form. As a result, a single large application of compost may provide enough P for several crops. In soils with elevated levels of available P, large compost applications may result in excessive concentrations of potentially mobile P. The need to maintain soil available P within the acceptable range (to minimize P losses to water) may dictate the maximum compost loading rate and application frequency to some soils.


