Article

Application of Two Bioenergy Byproducts with Contrasting Carbon Availability to a Prairie Soil: Three-Year Crop Response and Changes in Soil Biological and Chemical Properties

by
Khaled D. Alotaibi
1,2,* and
Jeff J. Schoenau
1
1
Department of Soil Science, University of Saskatchewan, 51 Campus Drive, Saskatoon, SK S7N 5A8, Canada
2
Department of Soil Science, King Saud University, P.O. Box 2460, Riyadh 11451, Saudi Arabia
*
Author to whom correspondence should be addressed.
Agronomy 2016, 6(1), 13; https://doi.org/10.3390/agronomy6010013
Submission received: 26 April 2015 / Revised: 30 January 2016 / Accepted: 1 February 2016 / Published: 15 February 2016

Abstract

:
The bioenergy industry produces a wide range of byproducts varying in their chemical composition depending on type of technology employed. In particular, pyrolysis and transesterification conversion processes generate C-rich byproducts of biochar (BC) and glycerol (GL), respectively, which can be added to soil. These two byproducts vary in their carbon availability, and comparing their effects when added to agricultural soil deserves attention. This study investigated the immediate and residual effects of a single application of BC and GL to a cultivated Brown Chernozem soil from the semi-arid region of southwestern Saskatchewan, Canada. In the first season following addition of amendments, BC and GL alone had no significant impact on all measured parameters. However, when combined with 50 kg urea N·ha−1 (BC + UR), the yields obtained were similar to those with 100 kg urea N·ha−1 alone. The GL with urea N (GL + UR) treatment had reduced crop yield and N uptake compared to urea alone in the year of application attributed to N immobilization, but had a positive residual effect in the second year due to remineralization. Both GL and GL + UR treatments enhanced dehydrogenase activity compared to other treatments whereas BC + UR tended to decrease microbial biomass C. The crop and soil response to application of biochar was less than observed in previous studies conducted elsewhere. Direct and residual effects of glycerol addition on the crop were more evident. An application rate greater than 2.8 t·ha−1 and 3.5 t·ha−1 for BC and GL, respectively, may be required to induce larger responses.

1. Introduction

Various technologies have been employed in using organic materials as a source of bioenergy. In addition to bioenergy being produced, each conversion process produces a certain type of byproduct. The type of conversion process and feedstock converted largely determine the value and characteristics of these byproducts [1]. Pyrolysis and transesterification are common technological processes used to produce biogas and biodiesel, respectively plus generation of C-rich byproducts. These associated byproducts include biochar (BC), produced during thermal breakdown (pyrolysis) of C-based feedstocks in absence of oxygen [2] and glycerol (GL), generated during the manufacture of biodiesel via transesterification of vegetable oils. Research into finding beneficial means of their utilization is ongoing, including their application to soil [3,4].
Unlike GL, BC has recently attracted a global interest due to its potential agronomic and environmental benefits. Research on BC has been rapidly expanding and literature on this subject is accumulating. It has widely been evaluated as a possible means to improve soil fertility, increase crop productivity and reduce greenhouse gas emissions in a variety of soils [3,5,6]. The increases in crop productivity following biochar application may occur directly through supply of essential nutrient, or indirectly through improving soil properties and functions [2,7]. Effects of biochar application on soil microbial biomass and enzyme activity have also been investigated, but only to a limited extent [8,9]. Most of the work examining the agricultural and environmental impacts of biochar application, especially the ones showing positive benefits of biochar application, has been conducted in tropical regions [10,11]. However, crop and soil responses may be different when biochar is applied to soils in arid and semi-arid regions. Currently, biochar application to agricultural soils is rare in Canada, and conducting more field studies with calcareous prairie soils typical of the northern Great Plains is required.
Glycerol, also known as glycerin, comprises a significant portion of biodiesel production in which every ton of biodiesel generates 100 kg of glycerol. The global production of biodiesel is projected to reach over 140 billion L by 2016 with an average annual growth of 42%, which will lead to approximately 14 billion L of crude glycerol being generated [12]. This will lead to a surplus of glycerol and will also have an impact on the glycerol market. There is a wide range of applications for pure glycerol in pharmaceutical, food and cosmetic industries, but the refining of crude glycerol to a high purity is costly and may not be profitable for small and medium size biodiesel production plants; especially when the market for glycerol is already saturated [13,14]. Glycerol has also been used as a feed ingredient in animal diets to reduce diet costs [13,14]. Research is ongoing to explore alternative methods of crude glycerol utilization to improve the economic feasibility of the biodiesel industry. Some recent potential applications of crude glycerol have included combustion and thermochemical conversion [15] and biological conversion or biological production of methane from crude glycerol using anaerobic sludge [16,17]. Despite the existing uses of crude glycerol, more applications of this byproduct need to be developed to help sustain biodiesel production. One example of a potential use of glycerol is its direct application to soil as amendment. This potential has received little attention, probably because glycerol lacks essential plant nutrient content, such as nitrogen (N) and phosphorus (P). However, one potential benefit of its agricultural use is that it could be used as a C source amendment to improve soil quality through enhancing soil organic matter content and biological activity, especially in degraded soils that contain low organic matter due to the lack of organic inputs. Under growth chamber conditions, addition of glycerol to soil led to microbial immobilization of soil N, especially when applied at a high rate (10,000 kg·ha−1), resulting in reduction of crop yield and N uptake; however, it did significantly increase soil C content [18]. Glycerol addition also showed a positive impact on enzyme activity and soil microbial biomass content in a controlled environment study [19].
Glycerol is a decomposable substrate under soil conditions, especially when supplemented with N as previously reported [20]. This indicates that C in glycerol is less resistant to microbial breakdown and expected to go through a rapid turnover in the soil compared to BC, affecting N availability for crop uptake. In contrast to glycerol, the C in BC was found to be relatively recalcitrant to decomposition in soil, as shown by low rates of mineralized C [1]. The contrasting availability of C in both byproducts are anticipated to be reflected in their effects on crop and soil variables. Therefore, the objective of the current study was to compare the effect of two C-rich bioenergy byproducts, biochar (derived from oat hull) and glycerol (derived from canola biodiesel production), applied once to a semi-arid prairie soil on crop yield, nutrient uptake, dehydrogenase activity, soil microbial biomass C and N and selected soil chemical properties over a three-year period. The extent to which the byproduct can affect the measured crop and soil variables is expected to be determined by the C availability in each byproduct.

2. Materials and Methods

2.1. Experimental Site

The experiment was carried out on agricultural land in a canola-wheat rotation located near the town of Central Butte (50°47′31′′ N lat, 106°30′28′′ W long) in south-central Saskatchewan. The soil at this site was classified as Orthic Brown Chernozem (Soil Association: Ardill Loam), with a loamy texture and nearly level topography. The field at this site was cropped to hard red spring wheat in the year prior to the current study. Immediately after experimental plots were laid out in spring of 2009, selected soil properties to characterize site were determined on soil samples collected across the study area from the control plots at three soil depth (0–15, 15–30 and 30–60 cm) increments (Table 1). Soil was analyzed using the methods cited by Qian et al. (2011) [21]. The soil is deficient in available N and P, sufficient in K, and with low organic matter content and high pH. The soil is non-saline. Climate data during the growing season for the 3-year study period were obtained from a weather station located near the experimental site (Environment Canada 2012). Monthly cumulative rainfall and mean air temperature over the three growing seasons and the 30-year average are given in Table 2.
Table 1. Selected soil properties at the beginning of the field study in spring 2009 at three soil depth increments (0–15, 15–30 and 30–60 cm).
PropertySoil Depth (cm)
0–1515–3030–60
NO3-N (mg·kg−1)3.9 ± 0.93.2 ± 0.83.1 ± 0.4
NH4+-N (mg·kg−1)2.6 ± 0.12.6 ± 0.23.0 ± 0.1
Avail. P (mg·kg−1)10.6 ± 1.48.4 ± 1.34.9 ± 0.8
Avail. K (mg·kg−1)348 ± 36279 ± 32239 ± 22
OC (%)1.1 ± 0.11.0 ± 0.11.0 ± 0.2
pH7.9 ± 0.17.9 ± 0.08.0 ± 0.1
EC (dS·m−1)0.1 ± 0.00.1 ± 0.00.2 ± 0.0
† values presented are means (n = 4) followed by standard error.
Table 2. Monthly total precipitation and mean air temperatures at the experimental site for the entire growing season for the three growing seasons (2009–2011).
PrecipitationMean Temperature
Month20092010201130-Years Avg.20092010201130-Years Avg.
Mm°C
April10.234.14.522.92.66.23.24.6
May19.6124.431.251.89.39.010.311.6
June47.775.396.167.914.916.415.016.2
July80.955.752.563.616.317.818.818.5
August48.543.614.744.115.816.818.117.9
September14.655.45.231.916.610.914.411.7

2.2. Amendments Procurement, Preparation and Application

Biochar material was obtained from Titan Clean Energy located in Saskatchewan. The biochar was produced from pyrolysis of oat hulls, a byproduct obtained from the oat milling process. The temperature at which the feedstock was pyrolyzed was 450 °C. Selected characteristics of the biochar are provided in Table 3. Prior to field application, the bulk biochar was homogenized by breaking and crushing larger chunks manually to pass through a 2 mm sieve. It was weighed, bagged and broadcast applied by hand. For the treatment in which biochar was combined with mineral fertilizer, first urea was broadcast by hand, and then the biochar was applied. The glycerol material, a thick syrupy liquid from canola-based biodiesel production, was obtained from Milligan Biotech Ltd. (Foam Lake, SK, Canada). It was stored at 4 °C prior to use. The glycerol used was a crude methanol-stripped product. It is a C-rich material containing 57% total C, as determined using a Leco CNS 2000 Elemental Analyzer (Leco Instruments Limited, Mississauga, ON, Canada) with N and P below detection limits. Prior to application, the required amounts of glycerol were weighed out and placed in plastic containers. Then, 7 L of distilled water were added and the mixture shaken for 12 h. This step was taken to ensure homogenization and ensure even distribution when applied to each plot. The glycerol-water mixture was poured into a sprinkler can for application to each plot. For the treatment where glycerol was combined with urea, urea was broadcast by hand first, and then glycerol was applied immediately. Granular urea was broadcast by hand. Immediately after the application and prior to seeding, amendment treatments were incorporated with a tandem disk to a depth of 5 cm. The same day, canola (Brassica napus var. Invigor 5030) was seeded on 21 May, 2009, at a rate of 5.6 kg·ha−1 using a John Deere 610 air seeder at 30 cm row spacing and 2 cm depth. On 16 May, 2010, Hard Red Spring Wheat (var. Waskeda) was seeded without fertilizer at a rate of 75 kg·ha−1. On 1 May 2011, a blanket application of fertilizer was made across the site at a rate of 45 kg N·ha−1 and 12 kg P2O5·ha−1 as pre-plant banded fertilizer. Then, plots were seeded with canola (var. Invigor 5030) on 10 May 2011, at rate of 5 kg·ha−1. At the time of seeding, an additional 20 kg N·ha−1 and 10 kg P2O5·ha−1 were applied with the seed in the seed-row.
Table 3. Basic characteristics of oat hull biochar used in the field study.
PropertyValue
C (%)71.4
N (%)2.0
P (%)2.5
K (%)1.5
S (%)0.1
Na (%)0.8
Ca (%)4.6
Mg (%)0.2
Cu (mg·kg−1)11.5
Fe (%)0.4
Mn (mg·kg−1)109
Zn (mg·kg−1)80
Surface area (m2·g−1)13.4

2.3. Experimental Design

The field experiment was initiated in spring 2009. Experimental plots were laid out with a dimension of 2 m × 2 m for each plot. The amendments of biochar and glycerol were applied based on applying equal amount of C. Thus, the experimental treatments included one rate of biochar (BC) or glycerol (GL) applied at 2000 kg C·ha−1, either alone or combined with urea N. The rate of applied C is equivalent to 2.8 t·ha−1 and 3.5 t·ha−1 for BC and GL, respectively. The glycerol was combined with 100 kg N·ha−1 (GL + UR) whereas biochar was combined with 50 kg N·ha−1 (BC + UR), as the N content of biochar applied at 2000 kg C·ha−1 rate added 50 kg N ha−1 itself, giving a total of 100 kg N·ha−1. The treatments also included one rate of urea fertilizer applied at 100 kg N·ha−1, which is the typical rate of N applied and an unamended/unfertilized plot (control). The assigned treatments were applied in a completely randomized design and replicated four times. The amendments were added only once in spring 2009, but the carryover effects of treatments were monitored for the subsequent three growing seasons (2009–2011).

2.4. Plant and Soil Sample Collection and Analysis

Crops were harvested in late August of each year at physiological maturity. Plant samples from one square meter (1-m2 samples) were cut manually 5 cm above the soil surface. The samples were dried by forced air at 45 °C, and mechanically threshed to determine seed and straw yield. Straw samples were ground to <2 mm in a Wiley™ mill and wheat grain samples were finely ground with a Cyclone™ mill. Total N and P were measured by digesting the canola seed and ground wheat grain and straw samples in sulfuric acid-peroxide (H2SO4-H2O2) using a temperature-controlled digestion block [22], followed by automated colorimetry for determination of P and the NH4+-N using Technicon Autoanalyzer II [23]. Total N and P uptakes were then calculated from plant N and P contents and total dry matter yield. The total N and P uptakes were not determined in crop samples collected in the final year of 2011.
Soil sample collection occurred three times during the course of the study: immediately after crop harvest in fall 2009 (September), before planting in spring 2010 (April) and again in fall 2010 (September) after crop harvest. No soil samples were collected during the 2011 cropping year. During sampling, a hydraulic punch truck was used to collect bulk samples that consisted of three soil cores taken per plot, at two soil depth increments (0–15 and 15–30). The three soil cores collected randomly from each plot for each soil depth were mixed thoroughly to generate a representative sample. A subsample was taken from each composite soil sample and immediately stored at 4 °C until their use for microbial biomass analysis. The rest of the soil samples were air-dried and ground to pass a 2-mm sieve prior to laboratory analysis. The air-dried soil samples collected in fall 2009 were analyzed for inorganic N (NH4+-N and NO3-N) in all depths and for available P and potassium (K), organic C, electrical conductivity (EC) and pH in the 0–15 cm depth. The soil samples collected in spring 2010 were only analyzed for their content of inorganic N whereas the selected chemical parameters for analysis in soil collected in fall 2010 included inorganic N determined in the two depths and total N, total P, available P and K and organic C determined in the 0–15 cm depth. Dehydrogenase activity and microbial biomass were determined in soil samples collected from the 0–15 cm depth for all three sampling periods (fall 2009, spring 2010 and fall 2010).
Exchangeable NH4+-N and NO3-N were extracted by shaking 5 g of soil with 50 mL of 2 M KCl for 1 h on rotary shaker, followed by filtration. The NH4+-N and NO3-N content in the KCl extracts were measured colorimetrically using a Technicon Autoanalyzer II [24]. Available P and potassium were determined by a modified Kelowna method [25]. Electrical conductivity and pH were measured in 1:1 soil:water suspension. The soil organic C content was determined using a LECO CR-12 combustion carbon analyzer (LECO Corporation, St, Joseph, MI, USA) set at 840 °C [26]. Soil total N and P contents were determined by sulfuric acid peroxide digest.
Dehydrogenase activity analysis involved the reduction of 2,3,5-triphenylterazolium chloride (TTC) to triphenyle formazan (TPF) as described by Casida et al. [27], with slight modification [28]. Briefly, 3 mL water and 3 mL TTC were added to 3 g of air-dried soil (<2 mm) and incubated for 24 h in darkness at 37 °C. After incubation, the suspension received 10 mL of methanol, and the content was mixed and then filtered through a glass fiber filter. Extra methanol was gradually added until the reddish color vanished from the filter, followed by dilution of the filtrate with methanol to a 100-mL volume. The intensity of reddish color produced through the reduction of TTC to TPF was measured using a spectrophotometer at 485 nm.
Soil content of microbial biomass C (MBC) and microbial biomass N (MBN) was determined by the fumigation extraction procedure as outlined by Voroney et al. [29] In particular, two 25-g portions of sieved field-moist soils (<2 mm) were weighed out. The first soil portion (25 g) was fumigated with ethanol-free CHCl3 for 24 h at laboratory temperature in a vacuum desiccator and then extracted with 50 mL of 0.5 M K2SO4. The other soil portion was extracted immediately with the same extractant. Total organic C and N in both fumigated and non-fumigated (control) soil extracts were analyzed using a CN analyzer (TOC-VCPH-TN Shimadzu). The values of nonfumigated samples were subtracted from those obtained from fumigated samples, and MBC and MBN were calculated using a KEC factor of 0.45 for MBC [30,31] and KEC factor of 0.54 for the MBN [32].

2.5. Statistical Analysis

Data for each variable are reported as the mean ± standard error of four replicates per treatment. Prior to data analysis, raw data were subjected to normality and homogeneity of variance tests using Shapiro-Wilk and Bartlett tests, respectively. Then, a one-way analysis of variance (ANOVA) was employed to analyze treatment effects on plant and soil variables. Treatments effects were declared statistically significant at a probability level of p ≤ 0.1 at which means were also separated by Fisher’s protected LSD. A probability level of 0.1 rather than 0.05 was selected as the significance level for this study owing to the inherently high degree of variability in soil and biological properties encountered in organic fertilized fields [33]. Due to differences in the crop type, the analysis was performed on each year or sampling period data separately.

3. Results

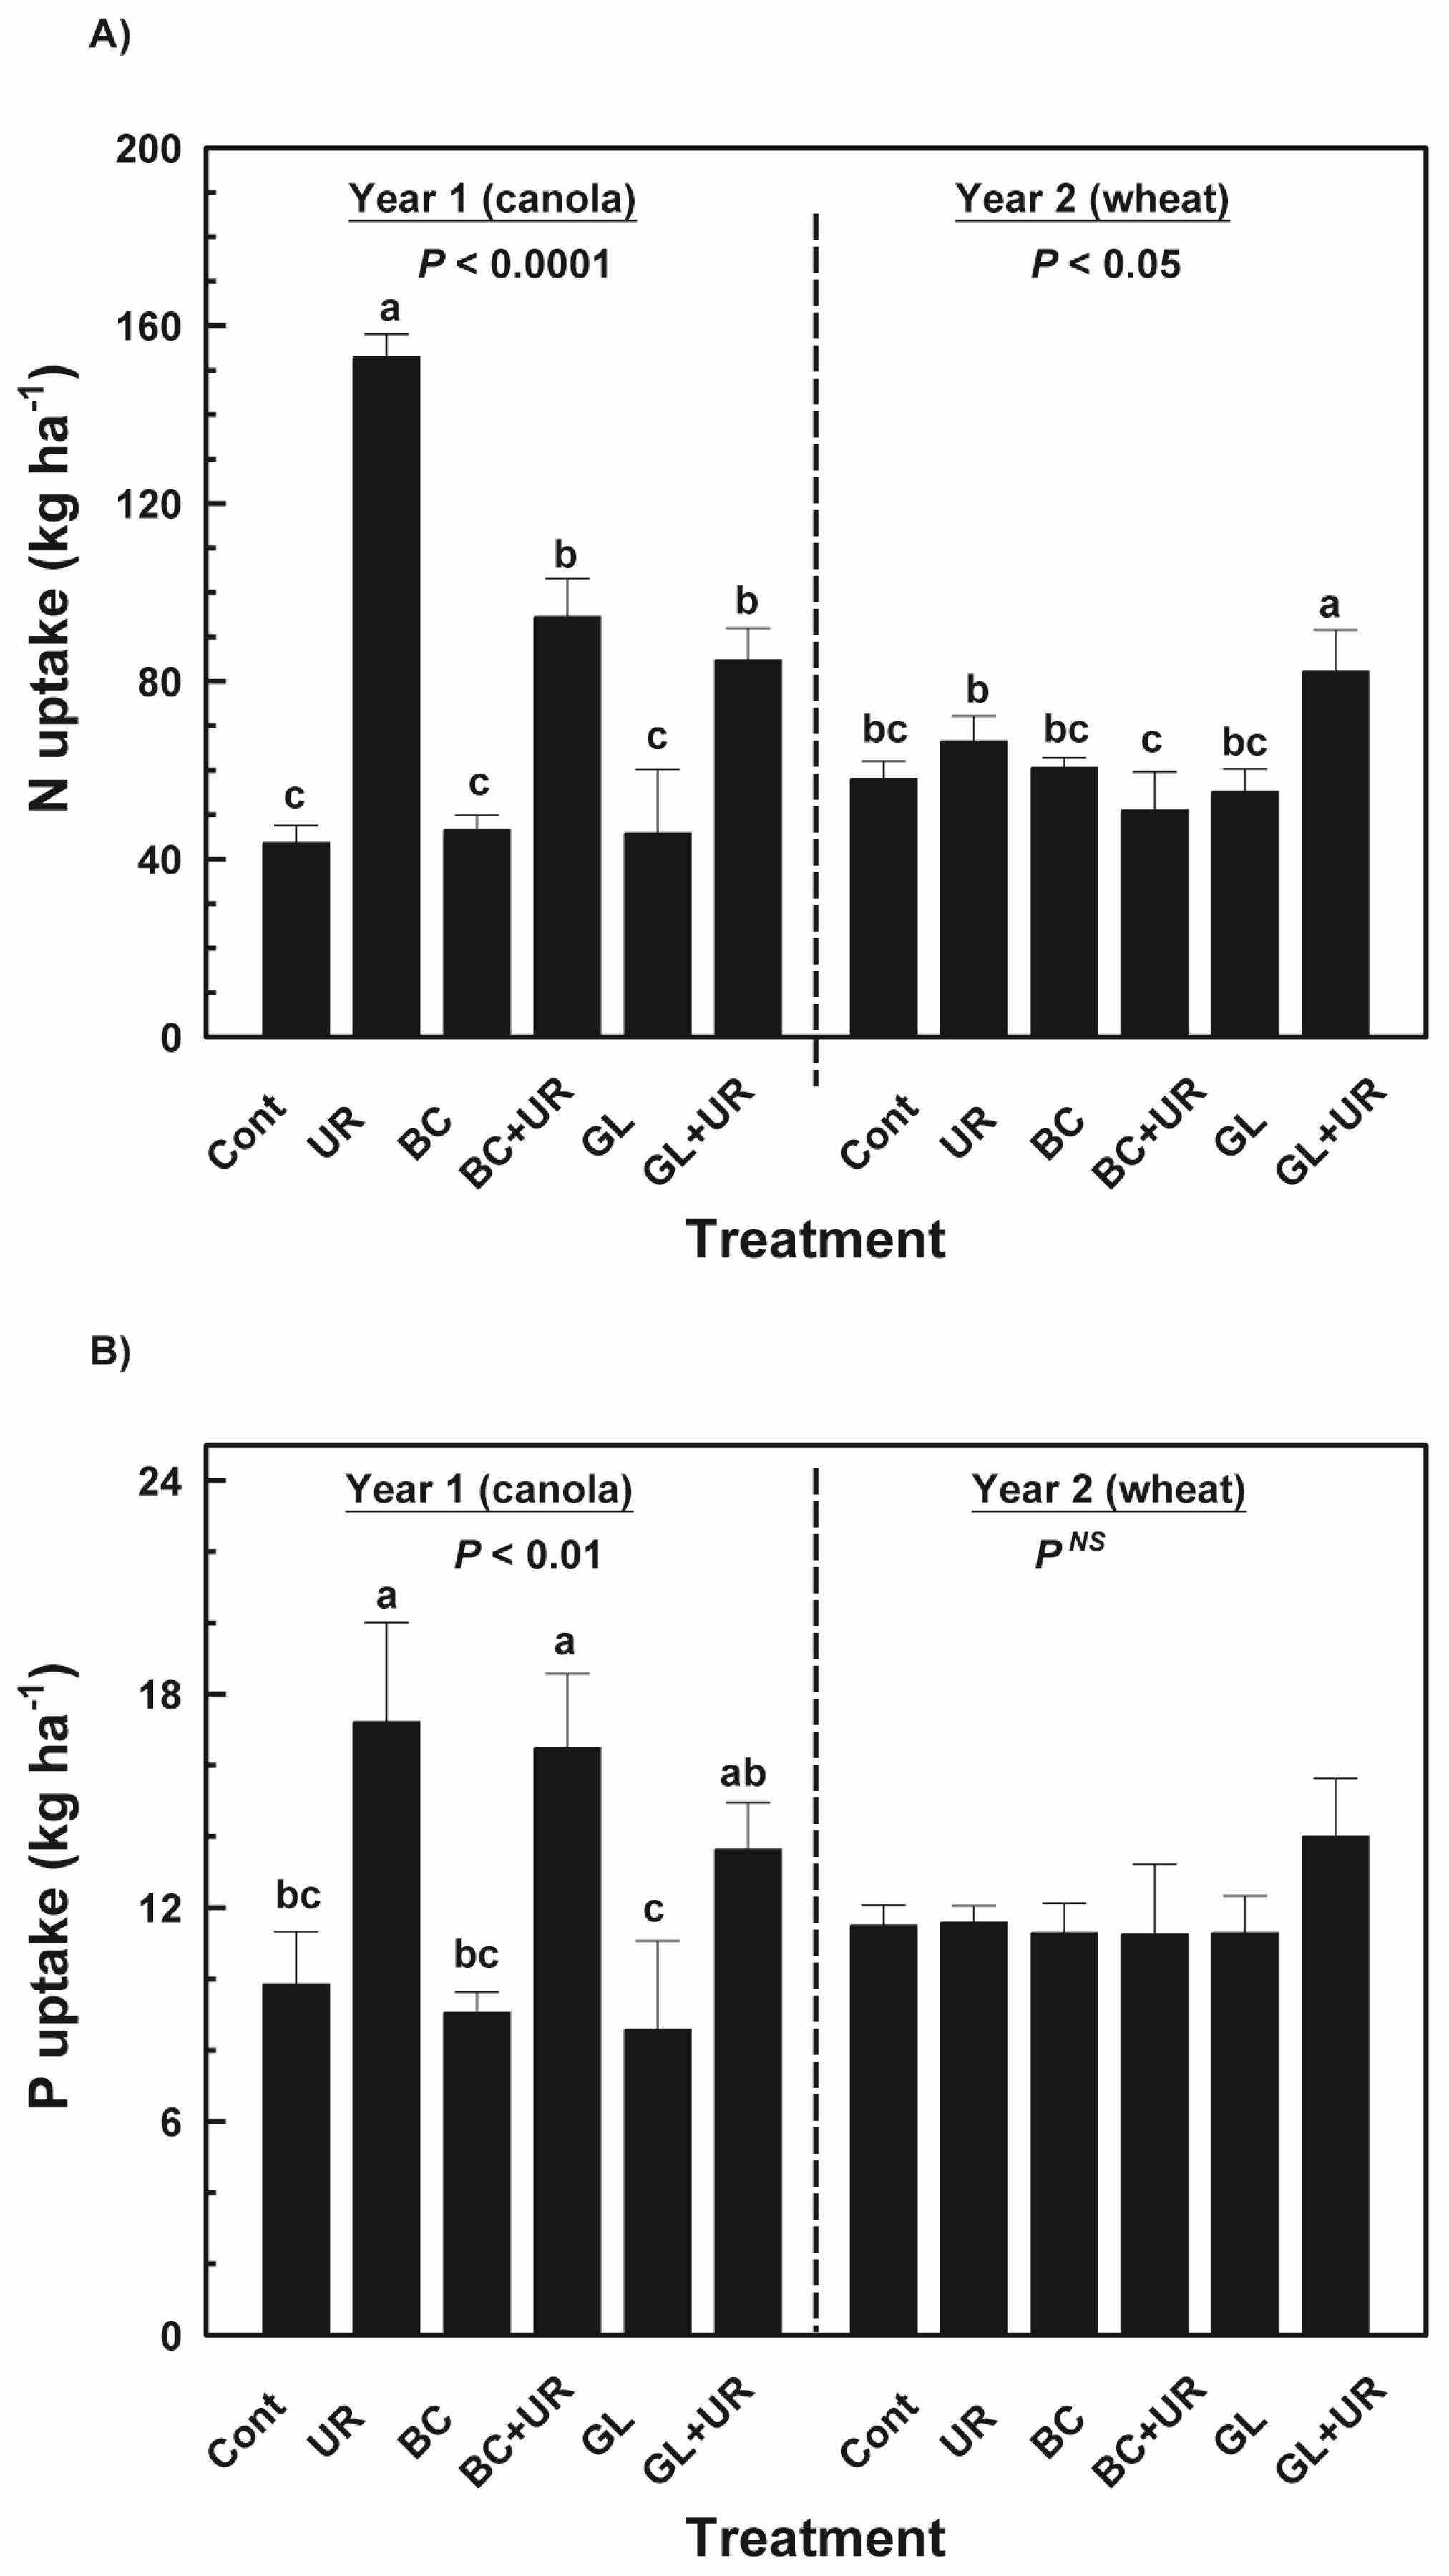
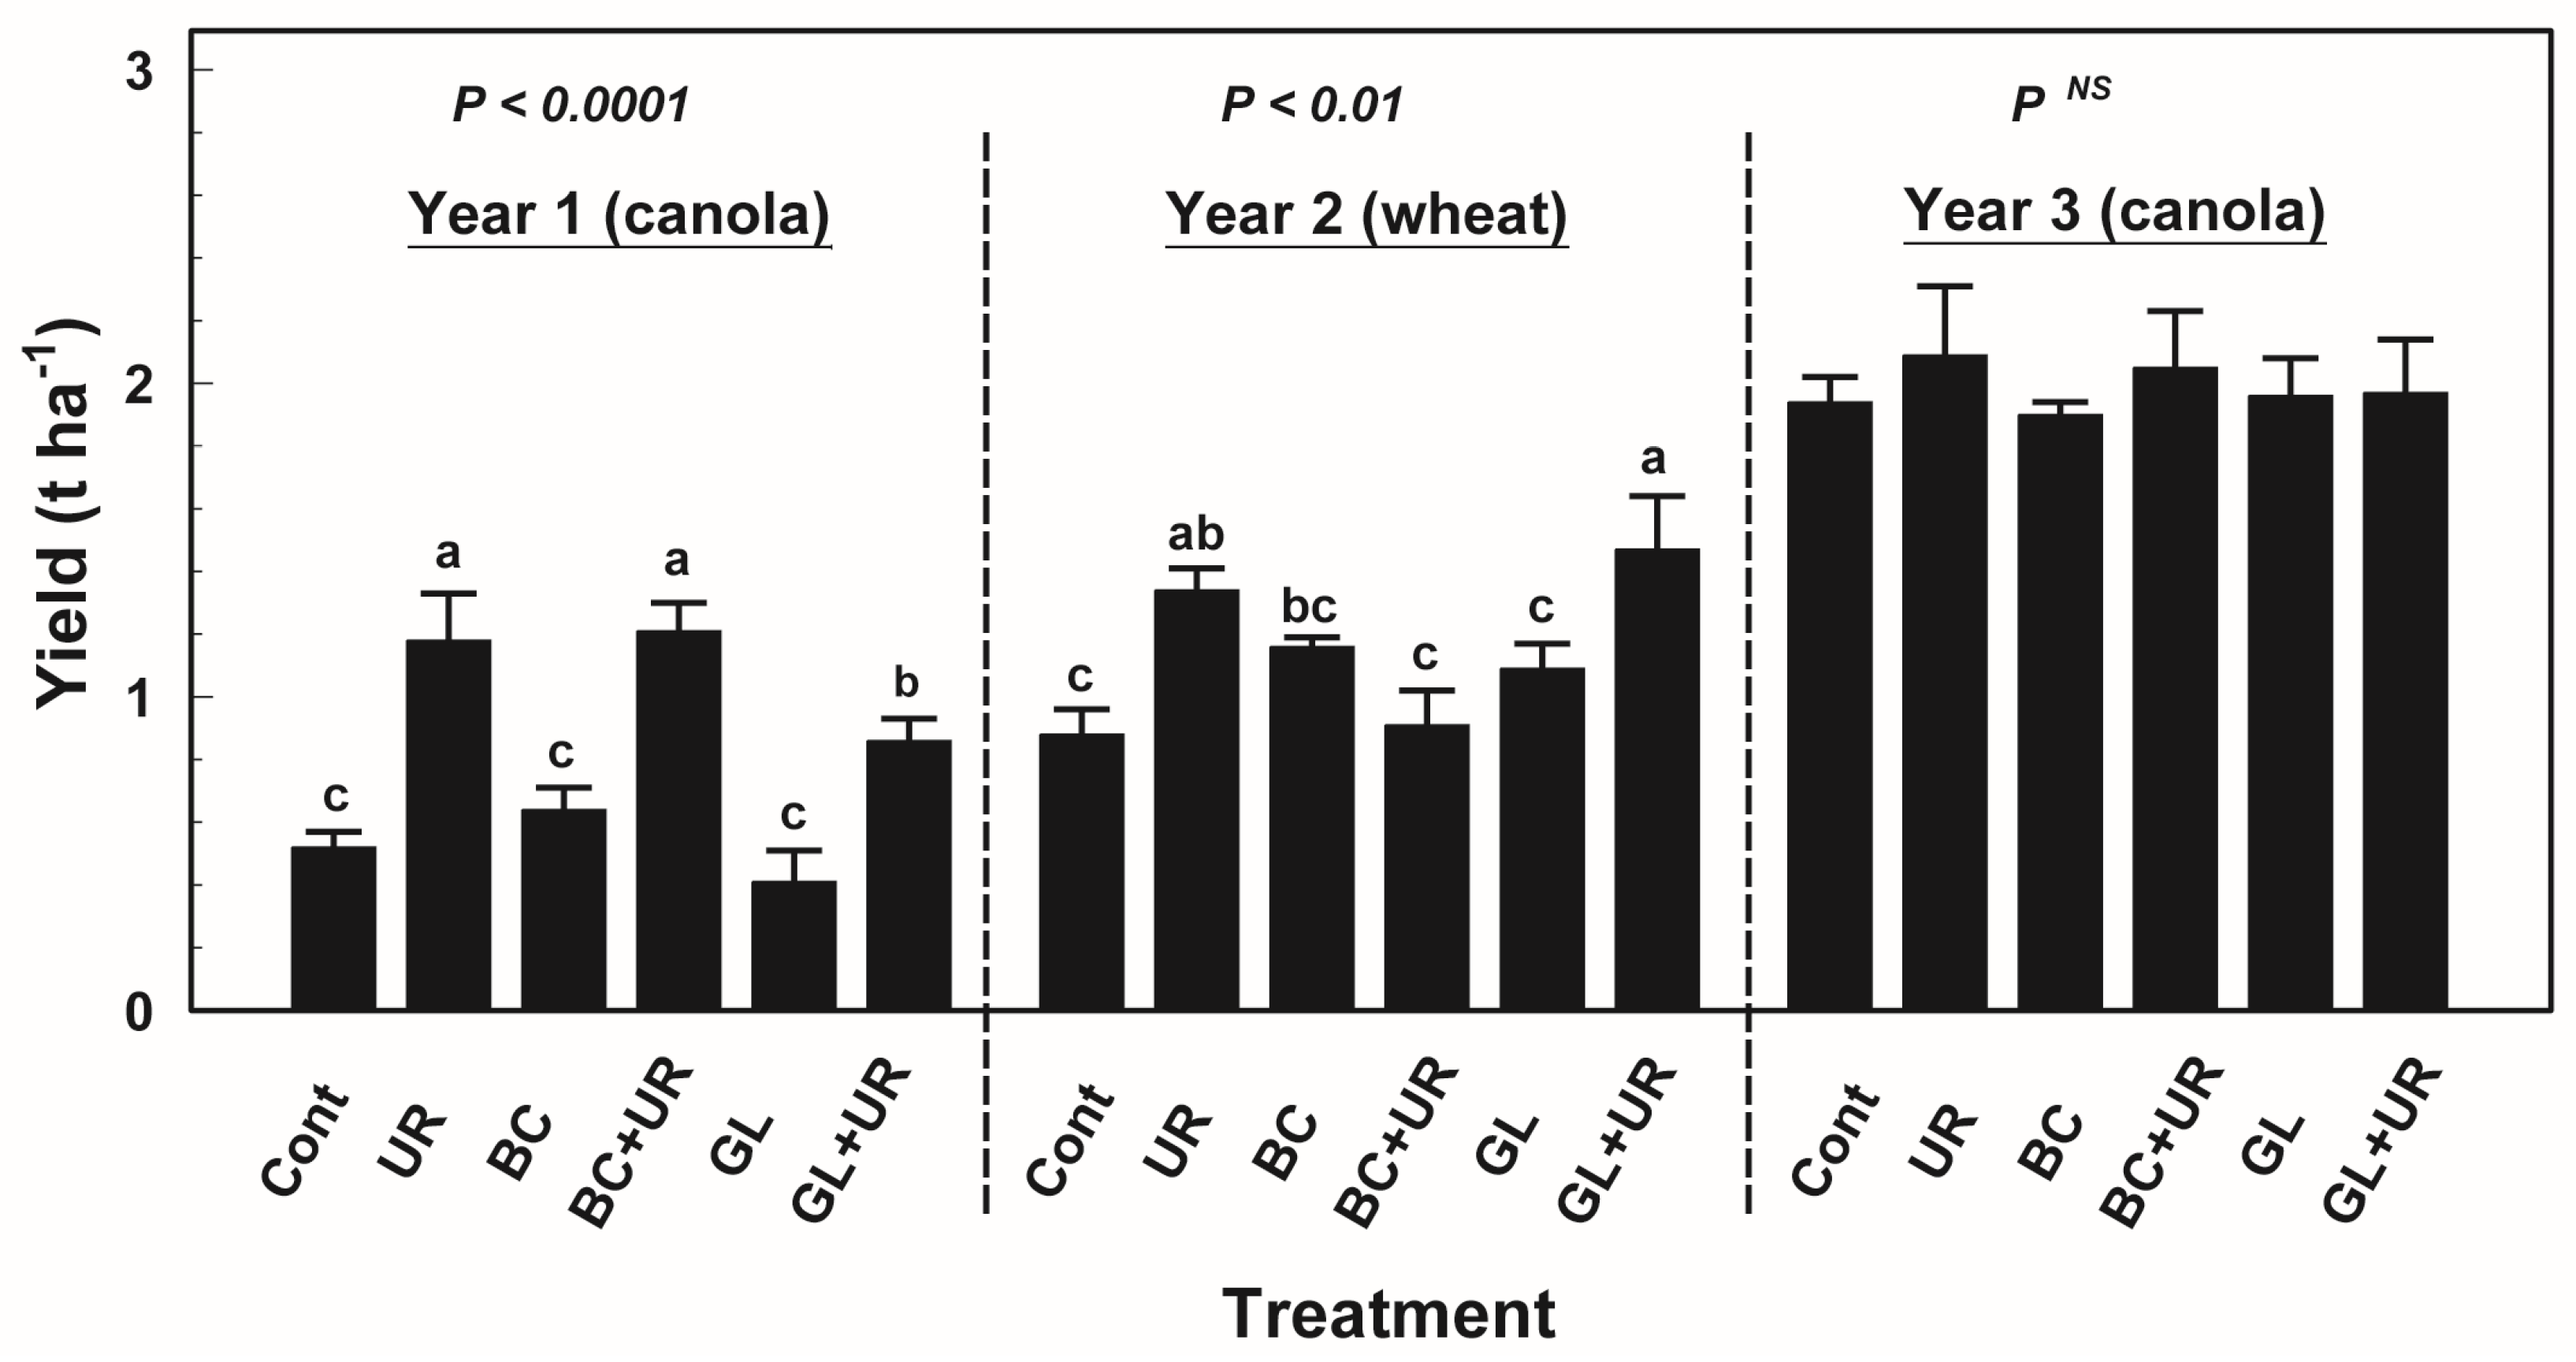
3.1. Crop Yield and Nutrient Uptake

In the first and second year following the amendments application, crop yield and N and P uptake were significantly affected by treatment application (Figure 1 and Figure 2). However, no significant impact on the measured crop variables was observed in the third growing season. In the first year, the greatest yield was observed for UR and BC + UR treatments and was almost double than that produced by the control. The yield in the BC treatment was not significantly different from that provided by the control treatment. The yield obtained from the BC + UR treatment was not significantly different from that observed in the treatment of urea applied at 100 kg N·ha1. Application of GL with N significantly increased the yield compared to the control or GL alone treatment, but yield was lower when compared to the 100 kg N·ha1 urea. In the second year, the residual effect of treatment application was most evident with GL + UR treatment, tending to provide the greatest crop yield when compared to the other treatments (Figure 1).
Figure 1. Yield responses to treatment application during a 3-year field study in Central Butte, SK. Treatments were applied once in spring 2009 and were control (Cont), urea (UR), biochar (BC), biochar plus N (BC + UR), glycerol (GL) and glycerol plus N (GL + UR). For a year, bars sharing the same letter among treatments are not significantly different according to LSD test (p ≤ 0.1). Errors bars represent standard error of mean (n = 4). NS denotes not significant at p ≤ 0.1.
Agronomy 06 00013 g001
The N uptake followed similar pattern described for crop yield response. The N uptake was significantly higher in urea treatment than BC + UR treatment (Figure 2). The addition of BC or GL without N did not show a significant effect on N uptake and both were not significantly different from the control. The GL + UR treatment resulted in plant N uptake that was significantly lower than that observed with urea applied alone. Similarly, the P uptake was the greatest in urea and BC + UR treatments, followed by GL + UR treatment (Figure 2). The C-based amendments (BC, GL) applied in absence of N did not have a significant impact on P uptake, compared to the control treatment. In the second year, the residual effect of amendments applied in the first year on N uptake was observed. The N uptake was the greatest in GL + UR treatment and was significantly different from that observed in the other treatments (Figure 2). However, there was no residual effect on the P uptake measured in the second year of the experiment.
Figure 2. Total plant N uptake (A) and total plant P uptake (B) responses to treatment application during a 3-year field study in Central Butte, SK. Treatments were applied once in spring 2009 and were control (Cont), urea (UR), biochar (BC), biochar plus N (BC + UR), glycerol (GL) and glycerol plus N (GL + UR). For a year, bars sharing the same letter among treatments are not significantly different according to LSD test (p ≤ 0.1). Errors bars represent standard error of mean (n = 4). NS denotes not significant at p ≤ 0.1.
Agronomy 06 00013 g002

3.2. Dehydrogenase Activity and Microbial Biomass

Dehydrogenase enzyme activity in soil samples collected in the fall 2009 after first year harvest was significantly influenced by glycerol treatments (Table 4). However, there was no residual effect on dehydrogenase activity in soil samples collected in spring 2010 or fall 2010 (Table 4). In fall 2009, the dehyrogenase activity was the greatest in soil treated with GL + UR, followed by GL, and both treatments were significantly higher than all other treatments including the control. Biochar application with or without N did not have any significant impact on dehydrogenase activity when compared to the control.
Table 4. Dehydrogenase activity, microbial biomass C and microbial biomass N responses to experimental treatments during three sampling periods (mean ± standard error).
TreatmentDehydrogenase ActivityMicrobial Biomass CMicrobial Biomass N
Fall 2009Spring 2010Fall 2010Fall 2009Spring 2010Fall 2010Fall 2009Spring 2010Fall 2010
μg TPF·g −1μg·g −1
Control187 ± 8 b212 ± 10299 ± 37244 ± 34 a250 ± 63205 ± 2071 ± 13 a51 ± 1930.5 ± 3.8
Urea203 ± 19 b235 ± 21289 ± 22191 ± 21 a259 ± 54211 ± 738 ± 6 bc57 ± 2330.7 ± 0.9
BC171 ± 15 b211 ± 10279 ± 22220 ± 57 a187 ± 79207 ± 435 ± 9 bc53 ± 1629.7 ± 1.0
BC + UR199 ± 16 b199 ± 8348 ± 52109 ± 13 b220 ± 9235 ± 3324 ± 8 c40 ± 334.2 ± 5.4
GL247 ± 20 a206 ± 9324 ± 32217 ± 14 a202 ± 30223 ± 1852 ± 7 ab41 ± 1432.9 ± 3.2
GL + UR252 ± 18 a238 ± 4257 ± 13191 ± 18 a287 ± 71199 ± 848 ± 4 b69 ± 2528.5 ± 2.6
Treatment0.020NSNS0.040NSNS0.020NSNS
Means within a column sharing the same letter are not significantly different at p = 0.10.
Soil microbial biomass C content was significantly decreased by BC + UR only in fall 2009, but not in the other two sampling periods (Table 4). Similarly, soil microbial biomass N content was also decreased significantly by BC + UR addition only in fall 2009 (Table 4). Both BC + UR and BC treatments were significantly different from the control, which provided the greatest content of soil microbial biomass N compared to all other treatments, with the exception of GL treatment that also did not differ from the control.

3.3. Selected Soil Chemical Properties

The residual inorganic N content varied with depth, with NH4+-N being the dominant form of inorganic N, especially in fall 2009, the first period of sampling following the amendment application (Table 5). The other measured soil chemical parameters, such as extractable P and K, pH, total N and P, in fall 2009 or fall 2010 were not significantly influenced by amendment application, with the exception of EC which showed a slight but significant decrease in fall 2009 in all amended soils, compared to the control (Table 6). Slight, but not significant, increase in soil organic C content was observed in BC treatments (Table 6); the rate of BC application probably was not high enough to allow for detecting significant differences in soil organic carbon content.
Table 5. Soil content of inorganic N (NH4+-N, NO3-N) at two soil depth increments determined in soils collected after crop harvest in 2009, before planting in 2010 and after crop harvest in 2010 (mean ± standard error).
015 cm
TreatmentFall 2009Spring 2010Fall 2010
NH4+-NNO3-NNH4+-NNO3-NNH4+-NNO3-N
μg·g−1
Control6.4 ± 1.53.4 ± 0.63.0 ± 0.35.0 ± 0.86.1 ± 1.14.8 ± 0.5
Urea6.3 ± 0.82.9 ± 0.83.6 ± 0.65.9 ± 0.57.3 ± 1.53.7 ± 0.3
BC7.6 ± 1.42.9 ± 0.73.3 ± 0.34.0 ± 1.26.0 ± 0.94.1 ± 0.2
BC + UR6.6 ± 1.22.0 ± 0.33.3 ± 0.45.0 ± 1.25.5 ± 1.14.2 ± 0.9
GL6.3 ± 1.23.3 ± 0.73.3 ± 0.45.9 ± 0.66.0 ± 1.13.9 ± 0.2
GL + UR6.4 ± 1.03.3 ± 0.93.3 ± 0.17.3 ± 0.56.3 ± 1.53.6 ± 0.5
ANOVA
TreatmentNSNSNSNSNSNS
1530 cm
Control7.0 ± 1.12.6 ± 0.63.3 ± 0.44.4 ± 1.17.1 ± 1.22.2 ± 0.2
Urea7.2 ± 1.21.7 ± 0.33.4 ± 0.64.4 ± 1.58.4 ± 1.62.0 ± 0.2
BC9.7 ± 1.12.5 ± 0.83.4 ± 0.32.5 ± 0.76.2 ± 0.82.4 ± 0.3
BC + UR5.3 ± 1.52.3 ± 0.53.9 ± 0.44.4 ± 1.56.0 ± 0.93.0 ± 0.8
GL8.4 ± 0.22.9 ± 0.66.5 ± 3.65.4 ± 0.27.1 ± 1.12.7 ± 0.4
GL + UR7.8 ± 1.02.1 ± 0.73.3 ± 0.34.4 ± 0.76.6 ± 1.42.1 ± 0.1
ANOVA
TreatmentNSNSNSNSNSNS
Table 6. Selected soil chemical properties at 0–15 cm depth determined after crop harvest in 2009 and 2010 (mean ± standard error).
TreatmentFall 2009Fall 2010
Extractable PExtractable KOrganic CpHECTotal NTotal PExtractable PExtractable KOrganic C
μg·g−1% dS·m−1μg·g−1 %
Control7.2 ± 2.7291 ± 241.05 ± 0.107.6 ± 0.20.29 ± 0.13 a1070 ± 19441 ± 813.7 ± 1.7323 ± 261.16 ± 0.05
Urea7.5 ± 1.5306 ± 101.02 ± 0.037.3 ± 0.20.15 ± 0.02 b1066 ± 38440 ± 9814.4 ± 2.5329 ± 191.23 ± 0.03
GL5.7 ± 1.0343 ± 241.06 ± 0.067.5 ± 0.10.13 ± 0.01 b1087 ± 27448 ± 812.1 ± 1.5364 ± 281.19 ± 0.04
GL + UR6.5 ± 1.5330 ± 201.06 ± 0.097.3 ± 0.30.17 ± 0.03 b996 ± 10418 ± 712.7 ± 1.5336 ± 201.15 ± 0.05
BC9.0 ± 2.0325 ± 341.09 ± 0.077.4 ± 0.10.13 ± 0.01 b1092 ± 26443 ± 614.5 ± 1.7354 ± 271.25 ± 0.04
BC + UR5.1 ± 0.8357 ± 111.08 ± 0.017.5 ± 0.20.14 ± 0.02 b1105 ± 52450 ± 1311.6 ± 0.7399 ± 231.27 ± 0.08
ANOVA
TreatmentNSNSNSNS0.10NSNSNSNSNS
Means within a column sharing the same letter are not significantly different at p = 0.10.

4. Discussion

Application of biochar alone at a rate of 2.8 T·ha−1 did not benefit crop yield and nutrient uptake in the immediate or subsequent two growing seasons following application. This is an indication that the biochar used in the current study did not itself supply nutrient for plant uptake. Similarly, Van Zwieten et al. [34] generally found little crop response to biochar addition in absence of N to acidic and alkaline soils, under controlled environment conditions. Gaskin et al. [35] also reported limited effects of peanut hull and pine chip biochar on yield and nutrient concentrations in plants, relating this to lack of N availability from biochar. Based on the application rate used here, the biochar is calculated to add about 50 kg total N·ha−1 in addition to about 70 kg total P·ha−1. However, it appears little, if any, of this nutrient in the char became available for plant use, as shown in the similar N and P uptake between biochar alone amended soil and in the control soil.
Joint application of biochar and urea showed equivalent or greater yield than other treatments, despite having only half as much urea N added. The treatment of 50 kg N·ha−1 combined with BC benefited the crop yield similar to that in 100 kg N·ha−1 applied alone treatment. This could be due to the ability of BC to reduce urea N losses through reduction of leaching or gaseous losses [36].
Glycerol application reduced crop yield and nutrient availability in the first growing season (spring 2009), as shown specifically by reduced N uptake in GL + UR treatment, compared to urea applied alone treatment. This is very likely a consequence of microbial immobilization of soil N. The immobilized N in GL + UR treatment in spring 2009 appeared to become remineralized and plant available during the subsequent growing season (spring 2010), resulting in higher yield and N uptake. Similarly, Qian et al. [18] reported that N supply from urea fertilizer was adversely affected by glycerol application, especially at the high rates, leading to a significant reduction in plant growth and N uptake. Under growth chamber conditions, glycerol amendment was also shown to immobilize soil available N, as shown by small supply rates of NO3-N and NH4+-N measured in the soil [20]. This indicates that glycerol can contribute to N retention in microbial biomass when co-applied with conventional fertilizer. In a recent study, glycerol was also found to significantly reduce N loss through minimizing nitrate leaching, owing to microbial immobilization of N [4]. Other bioenergy byproducts with highly available C have also found to cause a short-term immobilization of N [1].
Dehydrogenase is an intracellular enzyme participating in the biological oxidation of organic compounds in soil [37] and is frequently reported to be related to the organic matter availability in the soil [28,38]. In the few studies identifying the impact of biochar on soil enzymes, there are discrepancies and inconsistencies among the documented findings. Under controlled environment conditions, Ameloot et al. [39] revealed that dehydrogenase enzyme activity increased in soil amended with biochars from pyrolyzed swine manure digestate and willow wood at 350 °C, but the enzyme activity was suppressed in the same soil amended with the biochars produced from the same feedstocks, but pyrolyzed at 700 °C. The authors related this to the higher level of volatile compounds present in biochars produced at low temperature that can stimulate enzyme activity, as also reported elsewhere [40,41]. In the current study, biochar neither increased nor suppressed dehydrogenase enzyme activity, which is in line with a recent study that utilized biochar from wheat straw [42]. Biochar C from the source used in the current study is apparently resistant to microbial breakdown and not accessible by soil microbes, and thereby did not stimulate enzyme activity. However, glycerol applied alone or with N promoted dehydrogenase activity in the year of application that was significantly higher than any other treatment. This may be explained by lower recalcitrance of C in glycerol and greater availability for soil microbes, resulting in stimulated enzyme activity. The same was observed when glycerol was added at different rates to the same soil used in this study, but under growth chamber conditions [19].
The soil microbial biomass can enhance nutrient cycling and availability to plants following application of organic materials to soil, due to its key role in organic matter decomposition [43]. It is the most labile pool of organic matter, and is frequently used as a sensitive indicator of changes in soil organic matter content [44]. Few research studies have evaluated the effect of biochar addition on soil microbial biomass content and reported inconsistent findings. For instance, Kolb et al. [45] found increased microbial biomass content and activity in a range of temperate soil types amended with one type of biochar whereas Dempster et al. [46] reported decreased MBC but not MBN in a course textured soil treated with Eucalyptus biochar. In the current study and only in the fall 2009 sampling, the biochar applied alone did not alter MBC, but decreased MBN content compared to the control, as also did biochar plus N. However, when biochar was combined with N, the content of MBC was the lowest in comparison to other treatments. The reason for significantly lower MBC in the fall after harvest in this treatment is not clear, but is coincident with greatest crop yield and nutrient uptake in the first growing season (2009) prior to first soil sampling for microbial analysis. This may be related to the depletion of soil nutrients and surface soil moisture from high crop growth that subsequently limited microbial growth and N accumulation potential. Addition of fresh and labile organic matter can activate microbial biomass and contribute to soil C mineralization [47]. However, this does not seem to be the case with this type of biochar, which appears to be recalcitrant to microbial decomposition. Changes in nutrient and C availability may increase or decrease microbial biomass growth and activity, depending on the soil background nutrient and C and the microbial groups responsible for decomposition [3].
The low amount of biochar applied in this study and the conditions of low precipitation (semi-arid environment) may limit the ability to show a clear effect on selected soil chemical properties, especially if applied only once. Application rate of biochar is critical for the effects on plant and soil [11], and as reported in most studies, the greatest positive effects of biochar were observed at the rates of 100 t·ha−1 [5]. However, given the difficulty in applying and retaining large quantities of surface applied biochar in the field in windy prairie conditions, the selected rate in the current study was more applicable to what could be practically applied in the field on a large scale.

5. Conclusions

Addition of biochar to prairie soil at a rate of 2000 kg C·ha−1, approximately equivalent to 2.8 t·ha−1, had limited effects on measured plant, soil and microbial parameters in this study. Glycerol was more effective in its role in reducing urea N availability, likely through microbial immobilization as shown by its impact on reducing yield and N uptake in the first growing season following application. The N immobilized the first year was released via remineralization processes during the subsequent growing season as evidenced by increased crop yield and N uptake in this treatment in the second year. Overall, the effects of the biochar amendment on plant and soil variables observed in the current study were generally smaller than reported in other studies. This can be related to differences in biochar type, soil type and also the rate of application that was lower in this study compared to many other studies. This study indicates that glycerol may have value in stimulating microbial activity and reducing N losses from soil in the year of application due to its ability to induce immobilization. Such applications deserve further investigation in future lab and field studies.

Acknowledgments

Support of Feed Opportunities from Biofuels program, Saskatchewan Agriculture Development Fund and the Natural Sciences and Engineering Research Council of Canada (NSERC) is greatly appreciated. Financial support provided by King Saud University is also greatly acknowledged. Field and lab assistance provided by Tom King and Cory Fatteicher during the course of this study is greatly appreciated.

Author Contributions

Khaled Alotaibi was responsible for experimental setup, implementation of the experiment, data collection and analysis and writing the manuscript. Jeff Schoenau contributed significantly to the manuscript by selecting the site of the study, supervising the work progress, interpretation of the results and editing the manuscript.

Conflicts of Interest

The authors declare no conflict of interest.

References

  1. Cayuela, M.L.; Oenema, O.; Kuikma, P.J.; Bakker, R.R.; van Groenigen, J.W. Bioenergy by-products as soil amendments? Implications for carbon sequestration and greenhouse gas emissions. GCB Bioenergy 2010, 2, 201–213. [Google Scholar] [CrossRef]
  2. Lehmann, J.; Joseph, S. Biochar for environmental management: An introduction. In Biochar for Environmental Management: Science and Technology; Lehmann, J., Joseph, S., Eds.; Earthscan: London, UK, 2015; pp. 1–14. [Google Scholar]
  3. Biederman, L.A.; Harpole, W.S. Biochar and its effects on plant productivity and nutrient cycling: A meta-analysis. GCB Bioenergy 2013, 5, 202–214. [Google Scholar] [CrossRef]
  4. Redmile-Gordon, M.A.; Armenise, E.; Hirsch, P.R.; Brookes, P.C. Biodiesel co-product (BCP) decreases soil nitrogen (N) losses to groundwater. Water Air Soil Pollut. 2014, 225, 1831. [Google Scholar] [CrossRef] [PubMed]
  5. Jeffery, S.; Verheijen, F.; van der velde, M.; Bastos, A. A quantitative review of the effects of biochar application to soils on crop productivity using meta-analysis. Agric. Ecosyst. Environ. 2011, 144, 175–187. [Google Scholar] [CrossRef]
  6. Cayuela, M.L.; van Zwieten, L.; Singh, B.P.; Jeffery, S.; Roig, A.; Sánchez-Monedero, M.A. Biochar’s role in mitigating soil nitrous oxide emissions: A review and meta-analysis. Agric. Ecosyst. Environ. 2014, 191, 5–16. [Google Scholar] [CrossRef]
  7. Woolf, D.; Amonette, J.E.; Street-Perrott, F.A.; Lehmann, J.; Joseph, S. Sustainable biochar to mitigate global climate change. Nat. Commun. 2010, 1, 56. [Google Scholar] [CrossRef] [PubMed]
  8. Sun, Z.; Bruun, E.W.; Arthur, E.; de Jonge, L.W.; Moldrup, P.; Hauggaard-Nielsen, H.; Elsgaard, L. Effect of biochar on aerobic processes, enzyme activity, and crop yields in two sandy loam soils. Biol. Fertil. Soils 2014, 50, 1087–1097. [Google Scholar] [CrossRef]
  9. Ameloot, N; Sleutel, S.; Case, S.D.C.; Alberti, G.; McNamara, N.P.; Zavalloni, C.; Vervisch, B.; Vedove, G.; Neve, S.D. C mineralization and microbial activity in four biochar field experiments several years after incorporation. Soil Biol. Biochem. 2014, 78, 195–203. [Google Scholar]
  10. Atkinson, C.J.; Fitzgerald, J.D.; Hipps, N.A. Potential mechanisms for achieving agricultural benefits from biochar application to temperate soils: A review. Plant Soil 2010, 337, 1–18. [Google Scholar] [CrossRef]
  11. Spokas, K.A.; Cantrell, K.B.; Novak, J.M.; Archer, D.W.; Ippolito, J.A.; Collins, H.P.; Boateng, A.A.; Lima, I.M.; Lamb, M.C.; McAloon, A.J.; et al. Biochar: A synthesis of its agronomic impact beyond carbon sequestration. J. Environ. Qual. 2012, 41, 973–989. [Google Scholar] [CrossRef] [PubMed]
  12. Fan, X.; Burton, R.; Zhou, Y. Glycerol (byproduct of biodiesel production) as a source for fuels and chemicals—Mini review. Open Fuels Energy Sci. J. 2010, 3, 17–22. [Google Scholar] [CrossRef]
  13. Groesbeck, C.N.; McKinney, L.J.; DeRouchey, J.M.; Tokach, M.D.; Goodband, R.D.; Dritz, S.S.; Nelssen, J.L.; Duttlinger, A.W.; Fahrenholz, A.C.; Behnke, K.C. Effect of crude glycerol on pellet mill production and nursery pig growth performance. J. Anim. Sci. 2008, 86, 2228–2236. [Google Scholar] [CrossRef] [PubMed]
  14. Lammers, P.J.; Kerr, B.J.; Weber, T.E.; Dozier, W.A.; Kidd, M.T.; Bregendahl, K.; Honeyman, M.S. Digestible and metabolizable energy of crude glycerol for growing pigs. J. Anim. Sci. 2007, 86, 602–608. [Google Scholar] [CrossRef] [PubMed]
  15. Kolesárová, N.; Hutňan, M.; Špalková, V.; Lazor, M. Biodiesel by-products as potential substrates for biogas production. In Proceedings of the 37th International Conference of Slovak Society of Chemical Engineering, Tatranské Matliare, Slovakia, 24–28 May 2010; Markoš, J., Ed.; pp. 1126–1139.
  16. Fountoulakis, M.S.; Manios, T. Enhanced methane and hydrogen production from municipal solid waste and agro-industrial by-products co-digested with crude glycerol. Bioresour. Technol. 2009, 100, 3043–3047. [Google Scholar] [CrossRef] [PubMed]
  17. Ma, J.; van Wambeke, M.; Carballa, M.; Verstraete, W. Improvement of the anaerobic treatment of potato processing wastewater in a UASB reactor by co-digestion with glycerol. Biotechnol. Lett. 2008, 30, 861–867. [Google Scholar] [CrossRef] [PubMed]
  18. Qian, P.; Schoenau, J.; Urton, R. Effect of soil amendment with thin stillage and glycerol on plant growth and soil properties. J. Plant Nutr. 2011, 34, 2206–2221. [Google Scholar] [CrossRef]
  19. Alotaibi, K.D.; Schoenau, J.J. Enzymatic activity and microbial biomass in soil amended with biofuel production byproducts. Appl. Soil Ecol. 2011, 48, 227–235. [Google Scholar] [CrossRef]
  20. Alotaibi, K.D.; Schoenau, J.J. Greenhouse gas emissions and nutrient supply rates in soil amended with biouel production by-products. Biol. Fertil. Soils 2013, 49, 129–141. [Google Scholar] [CrossRef]
  21. Qian, P.; Schoenau, J.J.; King, T.; Fatteicher, C. Effect of soil amendment with alfalfa powders and distillers grains on nutrition and growth of canoal. J. Plant Nutr. 2011, 34, 1403–1417. [Google Scholar] [CrossRef]
  22. Thomas, R.L.; Sheard, R.W.; Moyer, J.R. Comparision of conventional and automated procedures for nitrogen, phosphorus and potassium analysis of plant material using a single digestion. Agron. J. 1967, 59, 240–243. [Google Scholar] [CrossRef]
  23. Technicon Industrial Systems. Ammonium in Water and Seawater; Industrial Method 154–71 W/B Technicon Industrial Systems: Tarrytown, NY, USA, 1978. [Google Scholar]
  24. Keeney, D.R.; Nelson, D. Nitrogen-Inorganic Forms, in Methods of Soil Analysis: Part 2 Chemical and Microbiological Properties, 2nd ed.; Page, A.L., Miller, R.H., Keeney, D.R., Eds.; Agronomy: Madison, WI, USA, 1982; pp. 643–698. [Google Scholar]
  25. Qian, P.; Schoenau, J.J.; Karamanos, R.E. Simultaneous extraction of available phosphorus and potassium with a new test: A modification of Kelowna extraction. Commun. Soil Sci. Plant Anal. 1994, 25, 627–636. [Google Scholar] [CrossRef]
  26. Wang, D.; Anderson, D.W. Direct measurement of organic carbon content in soils by the Leco CR-12 carbon analyzer. Commun. Soil Sci. Plant Anal. 1998, 29, 15–21. [Google Scholar] [CrossRef]
  27. Casida, L.E.; Klein, D.A.; Santoro, T. Soil dehydrogenase activity. Soil Sci. 1964, 98, 371–376. [Google Scholar] [CrossRef]
  28. Serra-Wittling, C.; Houot, S.; Barriuso, E. Soil enzymatic response to addition of municipal solid-waste compost. Biol. Fertil. Soils 1995, 20, 226–236. [Google Scholar] [CrossRef]
  29. Voroney, R.; Brookes, P.; Beyaert, R. Soil microbial biomass C, N, P, and S. In Soil Sampling and Methods of Analysis, 2nd ed.; Carter, M.R., Gregorich, E.G., Eds.; CRC Press: Boca Raton, FL, USA, 2008; pp. 637–651. [Google Scholar]
  30. Wu, J.; Joergensen, R.; Pommerening, B.; Chaussod, R.; Brookes, P. Measurement of soil microbial biomass C by fumigation-extraction-an automated procedure. Soil Biol. Biochem. 1990, 22, 1167–1169. [Google Scholar] [CrossRef]
  31. Joergensen, R.G. The fumigation-extraction method to estimate soil microbial biomass: Calibration of the KEC value. Soil Biol. Biochem. 1996, 28, 25–31. [Google Scholar] [CrossRef]
  32. Joergensen, R.G.; Mueller, T. The fumigation-extraction method to estimate soil microbial biomass: Calibration of the KEN value. Soil Biol. Biochem. 1996, 28, 33–37. [Google Scholar] [CrossRef]
  33. Stumborg, C.; Schoenau, J.J. Evaluating phosphorus loading from repeated manure applications to two Saskatchwan soils. Can. J. Soil Sci. 2008, 88, 377–387. [Google Scholar] [CrossRef]
  34. Van Zwieten, L.; Kimber, S.; Morris, S.; Chan, K.; Downie, A.; Rust, J.; Joseph, S.; Cowie, A. Effects of biochar from slow pyrolysis of papermill waste on agronomic performance and soil fertility. Plant Soil. 2010, 327, 235–246. [Google Scholar] [CrossRef]
  35. Gaskin, J.W.; Speir, R.A.; Harris, K.; Das, K.; Lee, R.D.; Morris, L.A.; Fisher, D.S. Effect of peanut hull and pine chip biochar on soil nutrients, corn nutrient status, and yield. Agron. J. 2010, 102, 623–633. [Google Scholar] [CrossRef]
  36. Taghizadeh-Toosi, A.; Clough, T.J.; Sherlock, R.R.; Condron, L.M. Biochar adsorbed ammonia is bioavailable. Plant Soil. 2012, 350, 57–69. [Google Scholar] [CrossRef]
  37. Tabatabai, M. Soil enzymes. Part 2, microbiological and biochemical properties. In Methods of Soil Analysis; Weaver, R.W., Angle, J.S., Bottomley, P.S., Eds.; SSSA Inc.: Madison, WI, USA, 1994; pp. 775–833. [Google Scholar]
  38. Moeskops, B.; Buchan, D.; Sleutel, S.; Herawaty, L.; Husen, E.; Saraswati, R.; Setyorini, D.; de Neve, S. Soil microbial communities and activities under intensive organic and conventional vegetable farming in West Java, Indonesia. Appl. Soil Ecol. 2010, 45, 112–120. [Google Scholar] [CrossRef]
  39. Ameloot, N.; de Neve, S.; Jegajeevagan, K.; Yildiz, G.; Buchan, D.; Funkuin, Y.N.; Prins, W.; Bouckaert, L.; Sleutel, S. Short-term CO2 and N2O emissions and microbial properties of biochar amended sandy loam soils. Soil Biol. Biochem. 2012, 57, 401–410. [Google Scholar] [CrossRef]
  40. Smith, J.L.; Collins, H.P.; Bailey, V.L. The effect of young biochar on soil respiration. Soil Biol. Biochem. 2010, 42, 2345–2347. [Google Scholar] [CrossRef]
  41. Bailey, V.L.; Fansler, S.J.; Smith, J.L.; Bolton, H. Reconciling apparent variability in effects of biochar amendment on soil enzyme activities by assay optimization. Soil Biol. Biochem. 2011, 43, 296–301. [Google Scholar] [CrossRef]
  42. Wu, F.; Jia, Z.; Wang, S.; Chang, S.X.; Startsev, A. Contrasting effects of wheat straw and its biochar on greenhouse gas emissions and enzyme activities in a Chernozemic soil. Biol. Fertil. Soils 2013, 49, 555–565. [Google Scholar] [CrossRef]
  43. Moore, J.; Klose, S.; Tabatabai, M. Soil microbial biomass carbon and nitrogen as affected by cropping systems. Biol. Fertil. Soils 2000, 31, 200–210. [Google Scholar] [CrossRef]
  44. Powlson, D.; Prookes, P.; Christensen, B.T. Measurement of soil microbial biomass provides an early indication of changes in total soil organic matter due to straw incorporation. Soil Biol. Biochem. 1987, 19, 159–164. [Google Scholar] [CrossRef]
  45. Kolb, S.E.; Fermanich, K.J.; Dornbush, M.E. Effect of charcoal quantity on microbial biomass and activity in temperate soils. Soil Sci. Soc. Am. J. 2009, 73, 1173–1181. [Google Scholar] [CrossRef]
  46. Dempster, D.; Gleeson, D.; Solaiman, Z.; Jones, D.; Murphy, D. Decreased soil microbial biomass and nitrogen mineralisation with Eucalyptus biochar addition to a coarse textured soil. Plant Soil 2012, 354, 311–324. [Google Scholar] [CrossRef]
  47. Brookes, P.C.; Cayuela, M.L.; Contin, M.; de Nobili, M.; Kemmitt, S.J.; Mondini, C. The mineralization of fresh and humified soil organic matter by the soil microbial biomass. Waste Manag. 2008, 28, 716–722. [Google Scholar] [CrossRef] [PubMed]

