1. Introduction
Snap bean is a cultivar of common bean (
Phaseolus vulgaris L.) from which immature pods are harvested and used as a vegetable for human consumption. Snap bean is characterized by its succulent and flavorful pods [
1]. Snap bean production in Ethiopia has increased over time both for export and local market [
2]. Ethiopia has become an important supplier of snap bean to European markets especially during the winter months when domestic snap bean production in Europe is down. At the same time the local demand and consumption of snap bean in Ethiopia have increased. To date, snap bean production in Ethiopia is mainly done by private companies, mostly business affiliates of European companies. This results in high input production systems including the heavy use of synthetic N fertilizer and irrigation that precludes most of the local small-holders farmers from export production. The burden of high input costs such as N fertilizer needs to be reduced for small-scale farmers in order to increase and sustain the production, and maximize the benefits of growing this cash crop.
Biological N
2 fixation, a key source of N for resource poor farmers, constitutes a potential solution and may play a role in sustainable common bean production in sub-Saharan Africa [
3,
4]. Previous report indicated that adequate N can be contributed by symbiosis between
Rhizobium and legume crops [
5]. This can potentially be a cheaper and more effective agronomic practice to improve productivity of legume crops than applied N [
5,
6]. The benefits of using rhizobia for N
2 fixation have been realized for grain production in chickpea [
7], soybean [
8], common bean [
9,
10], and many other grain legumes. The potential yield improvement of common bean through N
2 fixation has been reported by several authors [
11,
12,
13]. However, the use of rhizobial inoculants as an alternate N source for legume vegetables including snap bean is less clear and currently is not practiced in Ethiopia. This study tested the hypothesis that N
2 fixation can support acceptable production of snap bean yield under rain fed conditions.
Earlier reports showed that effective N
2 fixation by rhizobia and further conversion into yield in common bean is affected by the cultivar [
9,
14,
15,
16,
17] and agro-ecological (environmental) factors [
18,
19,
20].
To date, there is no nationally registered snap bean cultivar in Ethiopia. Only few, yet to be released, snap bean cultivars are recommended by Melkassa Agricultural Research Center for local farmers in Ethiopia. Farmers in general are left to limited option to grow introduced, privately owned cultivars with high seed cost. The introduced cultivars in general require high rates of nitrogen as they have been developed under intensive production systems. We hypothesized that locally developed cultivars may have better N2 fixation potential than introduced commercial cultivars.
Agro-ecological conditions as a cumulative effect of climate, landform and edaphic factors such as soil mineral composition, pH and soil temperature contribute significant effect on yield [
21], and affect the effectiveness of rhizobia for N
2 fixation [
5]. In the current experiment, three locations with different agro-ecological characteristics were selected with the hypothesis that snap bean performance for N
2 fixation and yield vary with the growing season’s agro-ecology.
Assessing the potential of rhizobium inoculation as the main source of nitrogen for snap bean production will create opportunity for Ethiopian farmers to produce snap bean under low input production systems. Additionally, identification of cultivars with greatest yield and N2 fixation potential, and identification of locations that allow greatest N2 fixation to occur will help to maximize the benefits from N2 fixation. The objectives of this study were to test the use of rhizobia inoculation as an alternative N source for snap bean production under rain fed conditions in Ethiopia, and to identify suitable cultivars and appropriate agro-ecology for optimum pod yield and N2 fixation.
2. Materials and Methods
2.1. Experimental Sites
The study was conducted at three sites across different agro-ecologies in the Rift Valley of Ethiopia. The three sites were Debre Zeit (8°44′52″ N, 38°05′53″ E), Hawassa (7°4′ N, 38°31′ E) and Ziway (8°00′ N, 38°45′ E). Debre Zeit is found in a tepid to cool sub-moist agro-ecology characterized by moderate temperature and a definitive rain fall pattern between July to September (
Table 1). It is situated at higher altitude in the transitional region of the Rift Valley and associated mountain ranges. The area is dominated by clay soils with high copper and cation exchange capacity, and a neutral pH (
Table 2). Hawassa is in a hot to warm sub-moist humid agro-ecology with warmer temperature (
Table 1). It has a longer growing season and a less definitive pattern of rain fall during the growing season (
Table 1). It is a mid-highland area in the Rift Valley zone. The soil is loam characterized by slightly acidic pH and higher concentrations of micronutrients such as manganese, iron and zinc (
Table 2). Ziway is found in a tepid to cool semi-arid agro-ecology with erratic rainfall and an unpredictable climate (
Table 1). The area is in the Rift Valley zone with mid-altitude. It has warmer temperature. The soil is sandy loam with very high pH and relatively higher exchangeable sodium (
Table 2). Ziway is located at a distance of 100 km equidistant between Debre Zeit and Hawassa.
These three locations represented distinct agro-ecologies (climate zones). But all the three climate zones are characterized by close range of temperature profile.
2.2. Experimental Design and Management
The experiment was conducted from June to September in 2011 and 2012 under rain fed conditions at the three locations. The plots were seeded on 27 June, 6 and 19 July in 2011 and on 2, 4 and 1 July in 2012 at Ziway, Debre Zeit and Hawassa, respectively.
At each location and year, eight snap bean cultivars were tested against three N treatments factorially combined in a randomized block design with three replications. Among the eight cultivars, six (Andante, Boston, Contender Blue, Lomami, Paulista and Volta) were commercial cultivars currently under production in Ethiopia. The remaining two (Melkassa 1 and Melkassa 3) were local cultivars developed and recommended by the Melkassa Agricultural Research Center (MARC) for production in Ethiopia and are currently being grown by local farmers. The three N treatments were 0 and 100 kg·N·ha−1, and Rhizobium etli (HB 429) inoculation. The rhizobium isolate (HB 429) was developed by the National Soil Testing Center, Addis Ababa, Ethiopia. It is being used by local farmers for common bean grain production. This isolate was isolated from Hadiya District, the Southern Nations and Nationalities People Region, Ethiopia. The 100 kg·N·ha−1 is the average of commonly used N fertilizer rate by commercial snap bean producers in Ethiopia.
Table 1.
Average rainfall, maximum and minimum temperature during 2011 and 2012 growing seasons at Debre Zeit, Hawassa and Ziway, Ethiopia. Ten year normal climate, altitude and climate zone of each location are presented a.
Table 1.
Average rainfall, maximum and minimum temperature during 2011 and 2012 growing seasons at Debre Zeit, Hawassa and Ziway, Ethiopia. Ten year normal climate, altitude and climate zone of each location are presented a.
| Year | | Debre Zeit | Hawassa | Ziway |
|---|
| Rainfall | b Max. T | c Min. T | Rainfall | b Max. T | c Min. T | Rainfall | b Max. T | c Min. T |
|---|
| mm | °C | °C | mm | °C | °C | mm | °C | °C |
|---|
| | July | 134.6 | 26.9 | 13.5 | 129.6 | 25.7 | 12.8 | 133.7 | 25.8 | 14.8 |
| 2011 | August | 241.7 | 25.0 | 14.9 | 157.3 | 25.3 | 13.0 | 114.8 | 24.6 | 15.1 |
| | September | 82.6 | 25.0 | 14.9 | 113.3 | 25.7 | 13.3 | 56.2 | 25.5 | 13.3 |
| | Annual | 724.1 | 26.4 | 11.3 | 776.1 | 28.0 | 12.1 | 598.3 | 29.1 | 13.0 |
| | July | 197.4 | 25.0 | 13.5 | 232.5 | 24.9 | 14.7 | 326.3 | 23.2 | 15.0 |
| 2012 | August | 256.5 | 24.5 | 12.6 | 72.7 | 24.4 | 14.5 | 171.4 | 24.3 | 14.7 |
| | September | 103.0 | 25.6 | 12.5 | 139.8 | 27 | 15.3 | 136.6 | 27.8 | 9.7 |
| | Annual | 726.3 | 26.7 | 10.4 | 884.8 | 28.1 | 12.7 | 856.8 | 28.6 | 12.4 |
| 10 years | Annual Aver. | 747.0 | 26.4 | 10.7 | 786.5 | 27.9 | 12.3 | 763.9 | 27.5 | 13.9 |
| Altitude | m above sea level | 1950 | 1700 | 1645 |
| Climate Zone d | | Tepid to cool sub-moist | Hot to warm sub-moist humid | Tepid to cool semi-arid |
Table 2.
Soil physicochemical characteristics at Debre Zeit, Hawassa and Ziway, Ethiopia during the 2011 and 2012 growing seasons.
Table 2.
Soil physicochemical characteristics at Debre Zeit, Hawassa and Ziway, Ethiopia during the 2011 and 2012 growing seasons.
| Profile Code | Debre Zeit | Hawassa | Ziway |
|---|
| 2011 | 2012 | 2011 | 2012 | 2011 | 2012 |
|---|
| Texture class a | clay | clay | loam | loam | sandy loam | sandy loam |
| pH-H2O (1:2.5) b | 6.98 | 6.98 | 6.1 | 6.1 | 8.38 | 8.2 |
| pH-KCl (1:2.5) b | 5.96 | 6.02 | 5.31 | 5.22 | 7.61 | 7.58 |
| EC (ms·cm−1) (1:2.5) | 0.16 | 0.26 | 0.17 | 0.17 | 0.15 | 0.26 |
| CEC (cmolc·kg−1 soil) | 48.47 | 41.42 | 26.39 | 24.01 | 28.48 | 26.18 |
| Organic Carbon (%) c | 1.5 | 1.47 | 1.59 | 1.55 | 0.96 | 1.15 |
| Nitrogen (%) d | 0.11 | 0.08 | 0.11 | 0.1 | 0.1 | 0.07 |
| Available P (mg·P·kg−1 soil) e | 19.05 | 18.28 | 21.52 | 40.01 | 19.12 | 36.42 |
| Available K (mg·K·kg−1 soil) f | 131.34 | 117.19 | 515.24 | 808.22 | 646.57 | 717.30 |
| Exchangeable sodium % (ESP) f | 0.83 | 1.58 | 1.8 | 1.66 | 3.42 | 3.58 |
| Micronutrients g | | | | | | |
| Cu (mg·kg−1 soil) | 2.04 | 1.47 | 0.3 | 0.39 | 0.33 | 0.32 |
| Fe (mg·kg−1 soil) | 12.46 | 10.64 | 28.96 | 25.93 | 3.13 | 4.58 |
| Mn (mg·kg−1 soil) | 9.27 | 7.82 | 20.76 | 27.03 | 2.7 | 4.63 |
| Zn (mg·kg−1 soil) | 0.86 | 0.86 | 3.61 | 3.78 | 1.08 | 1.5 |
Plot size was 2 m × 2.5 m. Each plot had five rows with 0.1 m between plants within each row and 0.5 m between rows with a row length of 2 m. The distance between adjacent blocks was 1.5 m. The two outer rows were considered border rows. All samples for data collection were taken from the three internal rows. Plant population was maintained by planting two seeds per hill and thinning to one plant upon appearance of trifoliate leaves. The spacing and other management practices were adopted from commercial snap bean producers nearby the three locations. Manual weeding was used to control weed. Fungicide (Mancozeb) was applied at two-week interval from mid-vegetative growth stage to pod setting stage to protect from fungal diseases.
Temperature and rainfall data were obtained from the nearest agricultural research center at each location (
Table 1). Nitrogen fixation was assessed using the
15N isotope dilution method and wheat was planted as a non-nodulating control plant for
15N analysis [
13]. In 2011, microplots measuring 0.75 m
2 were established within the treatment plots and a urea solution was applied at a rate of 10 kg·N·ha
−1 labeled with 5 atom %
15N excess subsequent to seedling emergence using a handheld watering can with a fine spray. The
15N dilution was only successful at Debre Zeit; heavy rain at both Hawassa and Ziway shortly after
15N application compromised the integrity of the
15N in the microplots. The recommended rate of phosphorus fertilizer (21 kg·ha
−1 phosphorus) was applied in the form of triple super phosphate at each location during seeding time.
In 2012, the
15N natural abundance method was used to estimate biological N fixation and wheat was used as the non-fixing reference crop for the experiments at all locations. Wheat was planted in a row perpendicular to the inoculated snap bean plots 0.75 m from the snap bean row. Therefore, each plot had its own reference plants to minimize the impact of any natural
15N variation in soils. It is assumed that non-nodulating isolines are ideal reference crops [
13,
23]. However, other non-fixing cereal crops including wheat and barley can be used as a reference crop for estimation of %Ndfa in common bean and other legume crops [
13,
24].
2.3. Data Collection
Total pod yield was determined by the weight of the pods from three central rows of each plot and converted into tonnes per hectare (t·ha−1) at optimum maturity. Pods from four randomly selected plants per plot were counted and the average was taken as pod number per plant. The dry weight of pods was determined after drying for 48 h at 70 °C.
Three randomly selected plant samples were carefully uprooted at the flowering stage and nodules were counted for total nodule number per plant root system. The diameters of all the nodules were measured using a caliper, and expressed as mean nodule diameter. Nodules were then dried in an oven for 24 h at 70 °C and weighed for determination of nodule dry weight per plant root system.
The percentage of N derived from the atmosphere (%Ndfa) was calculated by two methods, by 15N isotopic dilution method in 2011 and by 15N natural abundance method in 2012.
For the 15N isotopic dilution method, three plants were harvested from the central row of the micro-plot at the green pod mature stage (almost all of the pods on the plant reached maturity) in 2011 at Debre Zeit. Wheat plants were also harvested at the same time. Plant samples were dried in an oven at 50 °C to constant weight. The samples were ground and 20 g subsamples were taken for further analysis. The sub-samples were reground using a ball mill and very small portions (approximately 3 mg each sample) of the fine ground samples were pelleted into 6 × 8 mm tin caps. Samples were then analyzed using a Costech ECS4010 elemental analyzer (Costech Analytical Technologies Inc., Valencia, CA, USA) coupled to a Delta V mass spectrometer with a ConFlo IV interface (Thermo Scientific, Bremen, Germany).
%Ndfa was calculated according to [
25]:
where “atom % excess” is the measure of the sample’s
15N content above the assumed atmospheric atom%
15N value of 0.3663 [
26].
When N fixation was estimated using the
15N natural abundant method in 2012, three snap bean plants were selected randomly from inoculated snap bean plots, accompanied by several wheat plants from the nearest wheat row. The above ground plant parts were harvested and analysed. The same procedures were followed with the
15N isotopic dilution method mentioned above for sample preparation and analysis, and %Ndfa was calculated as follows:
where “δ
15N” is:
and a B-value of −2 was assumed [
24]. The largest pool of N in the environment is atmospheric N
2 and it has a constant abundance of 0.3663 atom%
15N [
26].
Total fixed N was calculated using the formula (4) on a per hectare (ha) basis. In this experiment, only the above ground biomass was used to calculate total N.
where “
%Ndfa” is obtained from the formula (2).
2.4. Statistical Analysis
Data were analyzed using the PROC MIXED procedure of the SAS software version 9.3 [
27] to determine Analysis of Variance (ANOVA). Nitrogen treatment, cultivar and location were considered as fixed effects, and replication (block), year and interactions with year were considered random. Nodule number and nodule dry weight were log transformed based on the results of Levene’s test for homogeneity of variance and after inspecting the residuals. After analysis, these transformed values were back transformed for plotting graphs. The DDFM = Kr option was considered for approximating the degree of freedom for means. Treatments were compared by LSD method. Significance was declared at
p < 0.05. The means of N treatments used for plotting the graphs were summarized from all cultivars at all locations. Similarly, the means of cultivars were summarized from all the N treatments at all the locations. The summarized mean of all cultivars and all N treatments were also used to plot the graphs for location. The means used to plot %Nfda of the cultivars in 2011 were cultivars only at Debre Zeit under inoculated treatments. The means of %Nfda and total fixed N of the cultivars in 2012 were from all locations under inoculated treatments. The %Nfda and total fixed N for location were the summary of all cultivars of inoculated treatments. Pearson correlation analysis was used to study correlations between yield and %Ndfa of the cultivars using the SAS software version 9.3 [
27].
3. Results
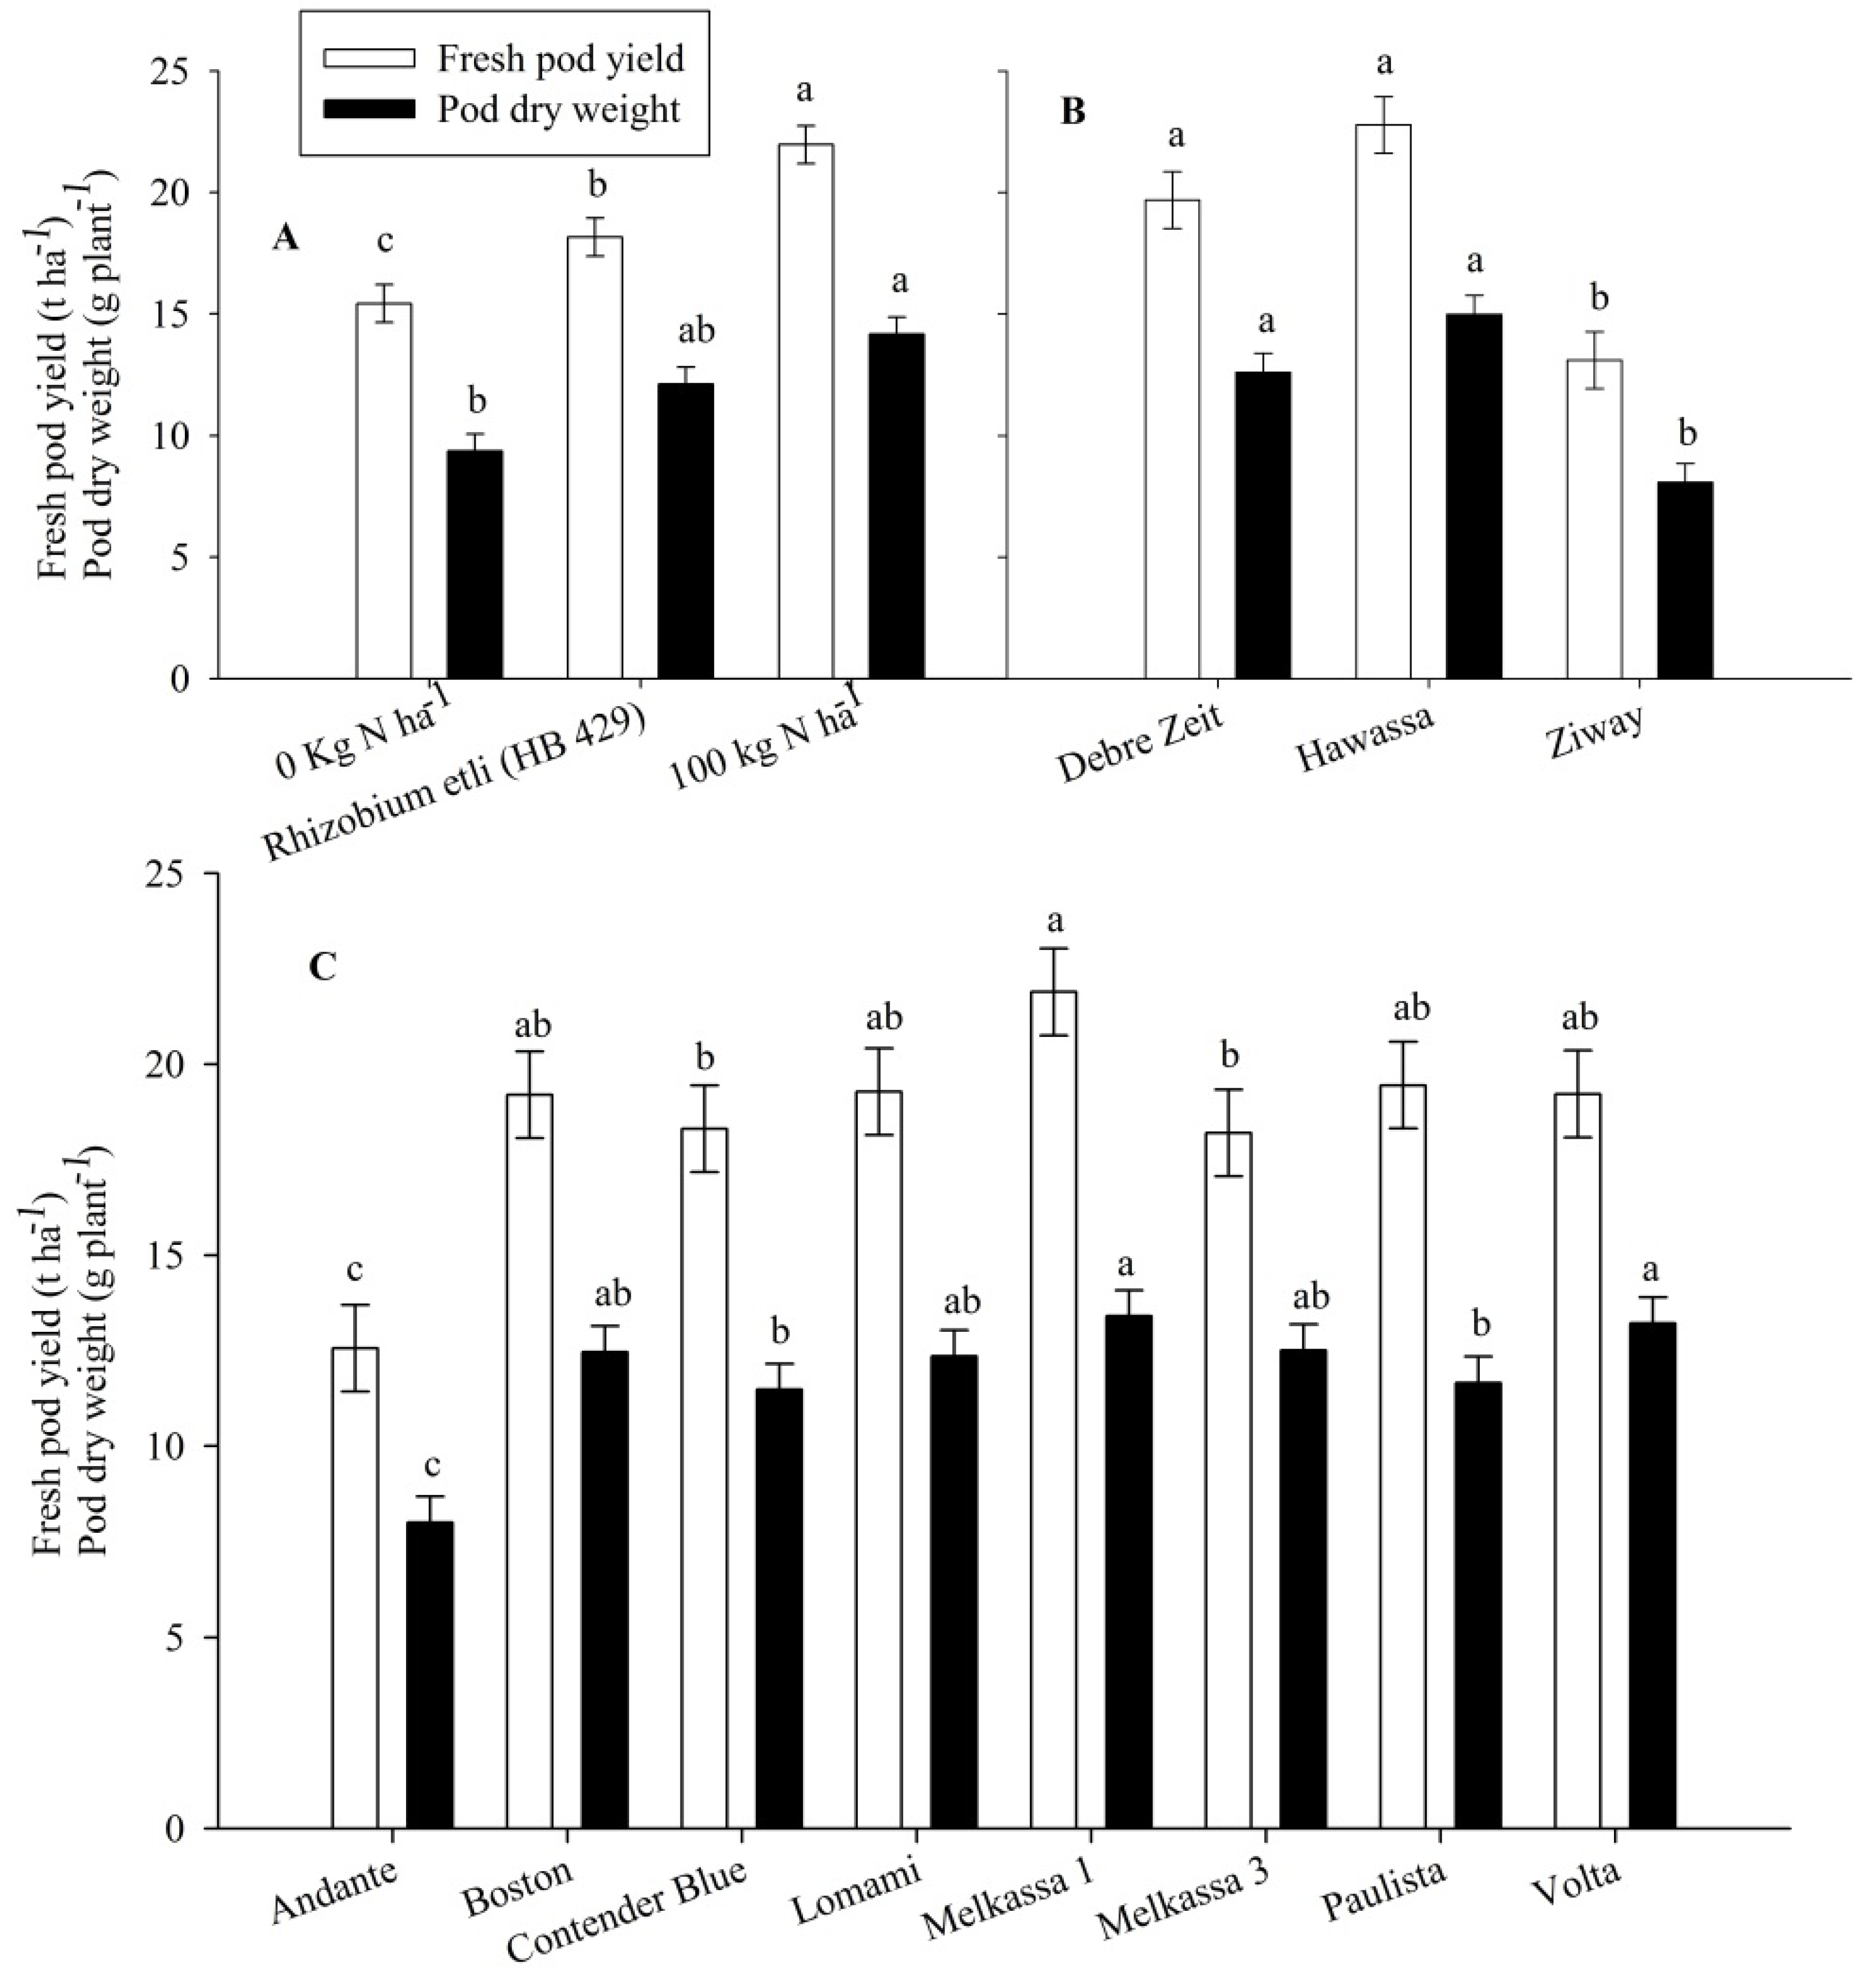
Nitrogen treatment, cultivar and location significantly (
p < 0.05) affected the total fresh pod yield and pod dry weight of snap bean. Application of 100 kg·N·ha
−1 increased fresh pod yield by 42 and 17% as compared to the control (0 N·ha
−1) and rhizobial inoculation, respectively. Inoculation of
R. etli (HB 429) resulted in 18% yield increase compared to the control treatment (
Figure 1A). Application of 100 kg·N·ha
−1 resulted in the highest pod dry weight (
Figure 1A). Pod dry weight in rhizobia inoculation treatments was not significantly different from either 0 or 100 kg·N·ha
−1 (
Figure 1A). Melkassa 1 was the greatest in pod fresh yield and pod dry weight (
Figure 1C). However, Andante was the lowest in both pod fresh yield and pod dry weight (
Figure 1C). Total fresh yield and pod dry weight from Hawassa and Debre Zeit were significantly greater than the total pod fresh yield and pod dry weight from Ziway (
Figure 1B).
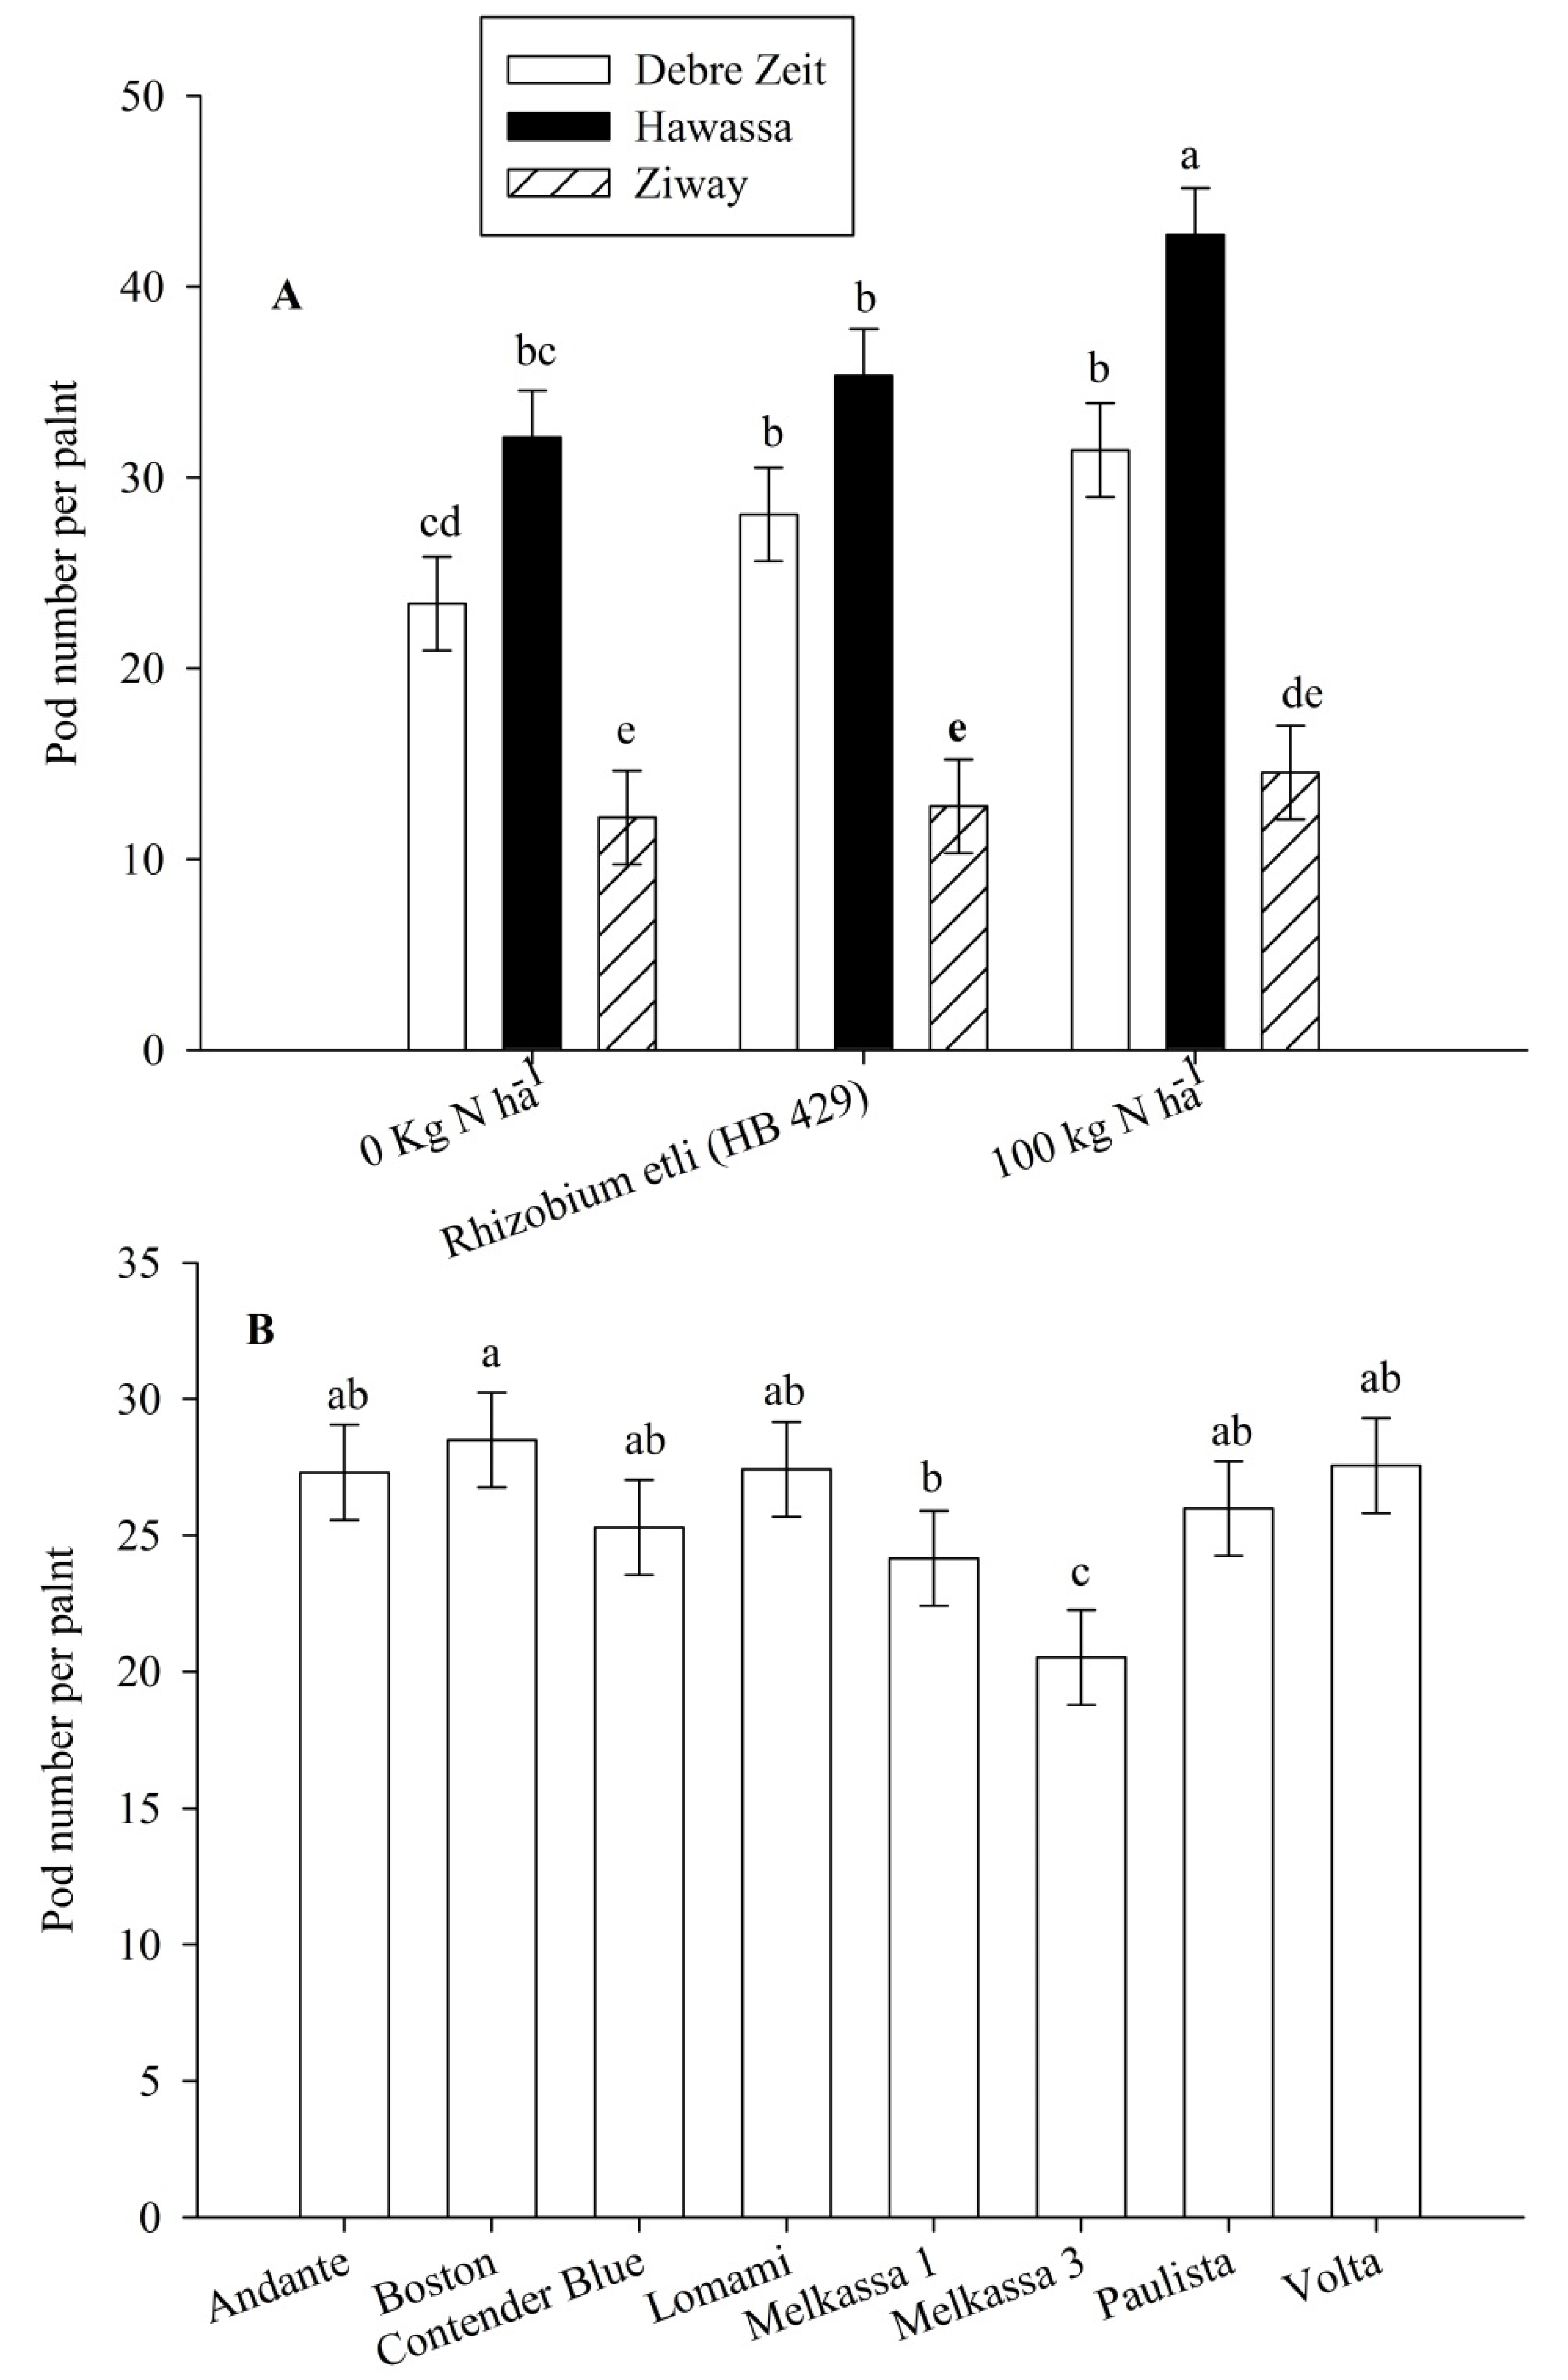
Nitrogen treatment, cultivar, location and N treatment by location interaction significantly (
p < 0.05) affected pod number per plant. Boston had the greatest number of pods per plant; however, it was comparable with the other cultivars, except Melkassa 1 and Melkassa 3 (
Figure 2B). For the N treatment by location interaction effect, the greatest number of pods per plant was observed when 100 kg·N·ha
−1 was applied at Hawassa (
Figure 2A). The least number of pods per plant was produced at Ziway with 0 kg·N·ha
−1. Pod numbers in the rhizobium inoculation and 100 kg·N·ha
−1 treatments were similar at Debre Zeit and Ziway; however, rhizobia inoculation was significantly different from the 0 kg·N·ha
−1 at Debre Zeit (
Figure 2A). The 0 kg·N·ha
−1 treatment at Hawassa was better than 100 kg·N·ha
−1 application at Ziway and it was similar to 100 kg·N·ha
−1 and rhizobia inoculation at Debre Zeit (
Figure 2A). None of the N treatments significantly affected pod numbers at Ziway (
Figure 2A).
Figure 1.
Fresh pod yield (t·ha−1) and pod dry weight per plant of snap bean influenced by nitrogen treatment (A), location (B) and cultivar (C) in 2011 and 2012. The same lower letter on the bars of the same legend within panels (A), (B) or (C) indicates that data are not statistically significant according to LSD at p < 0.05.
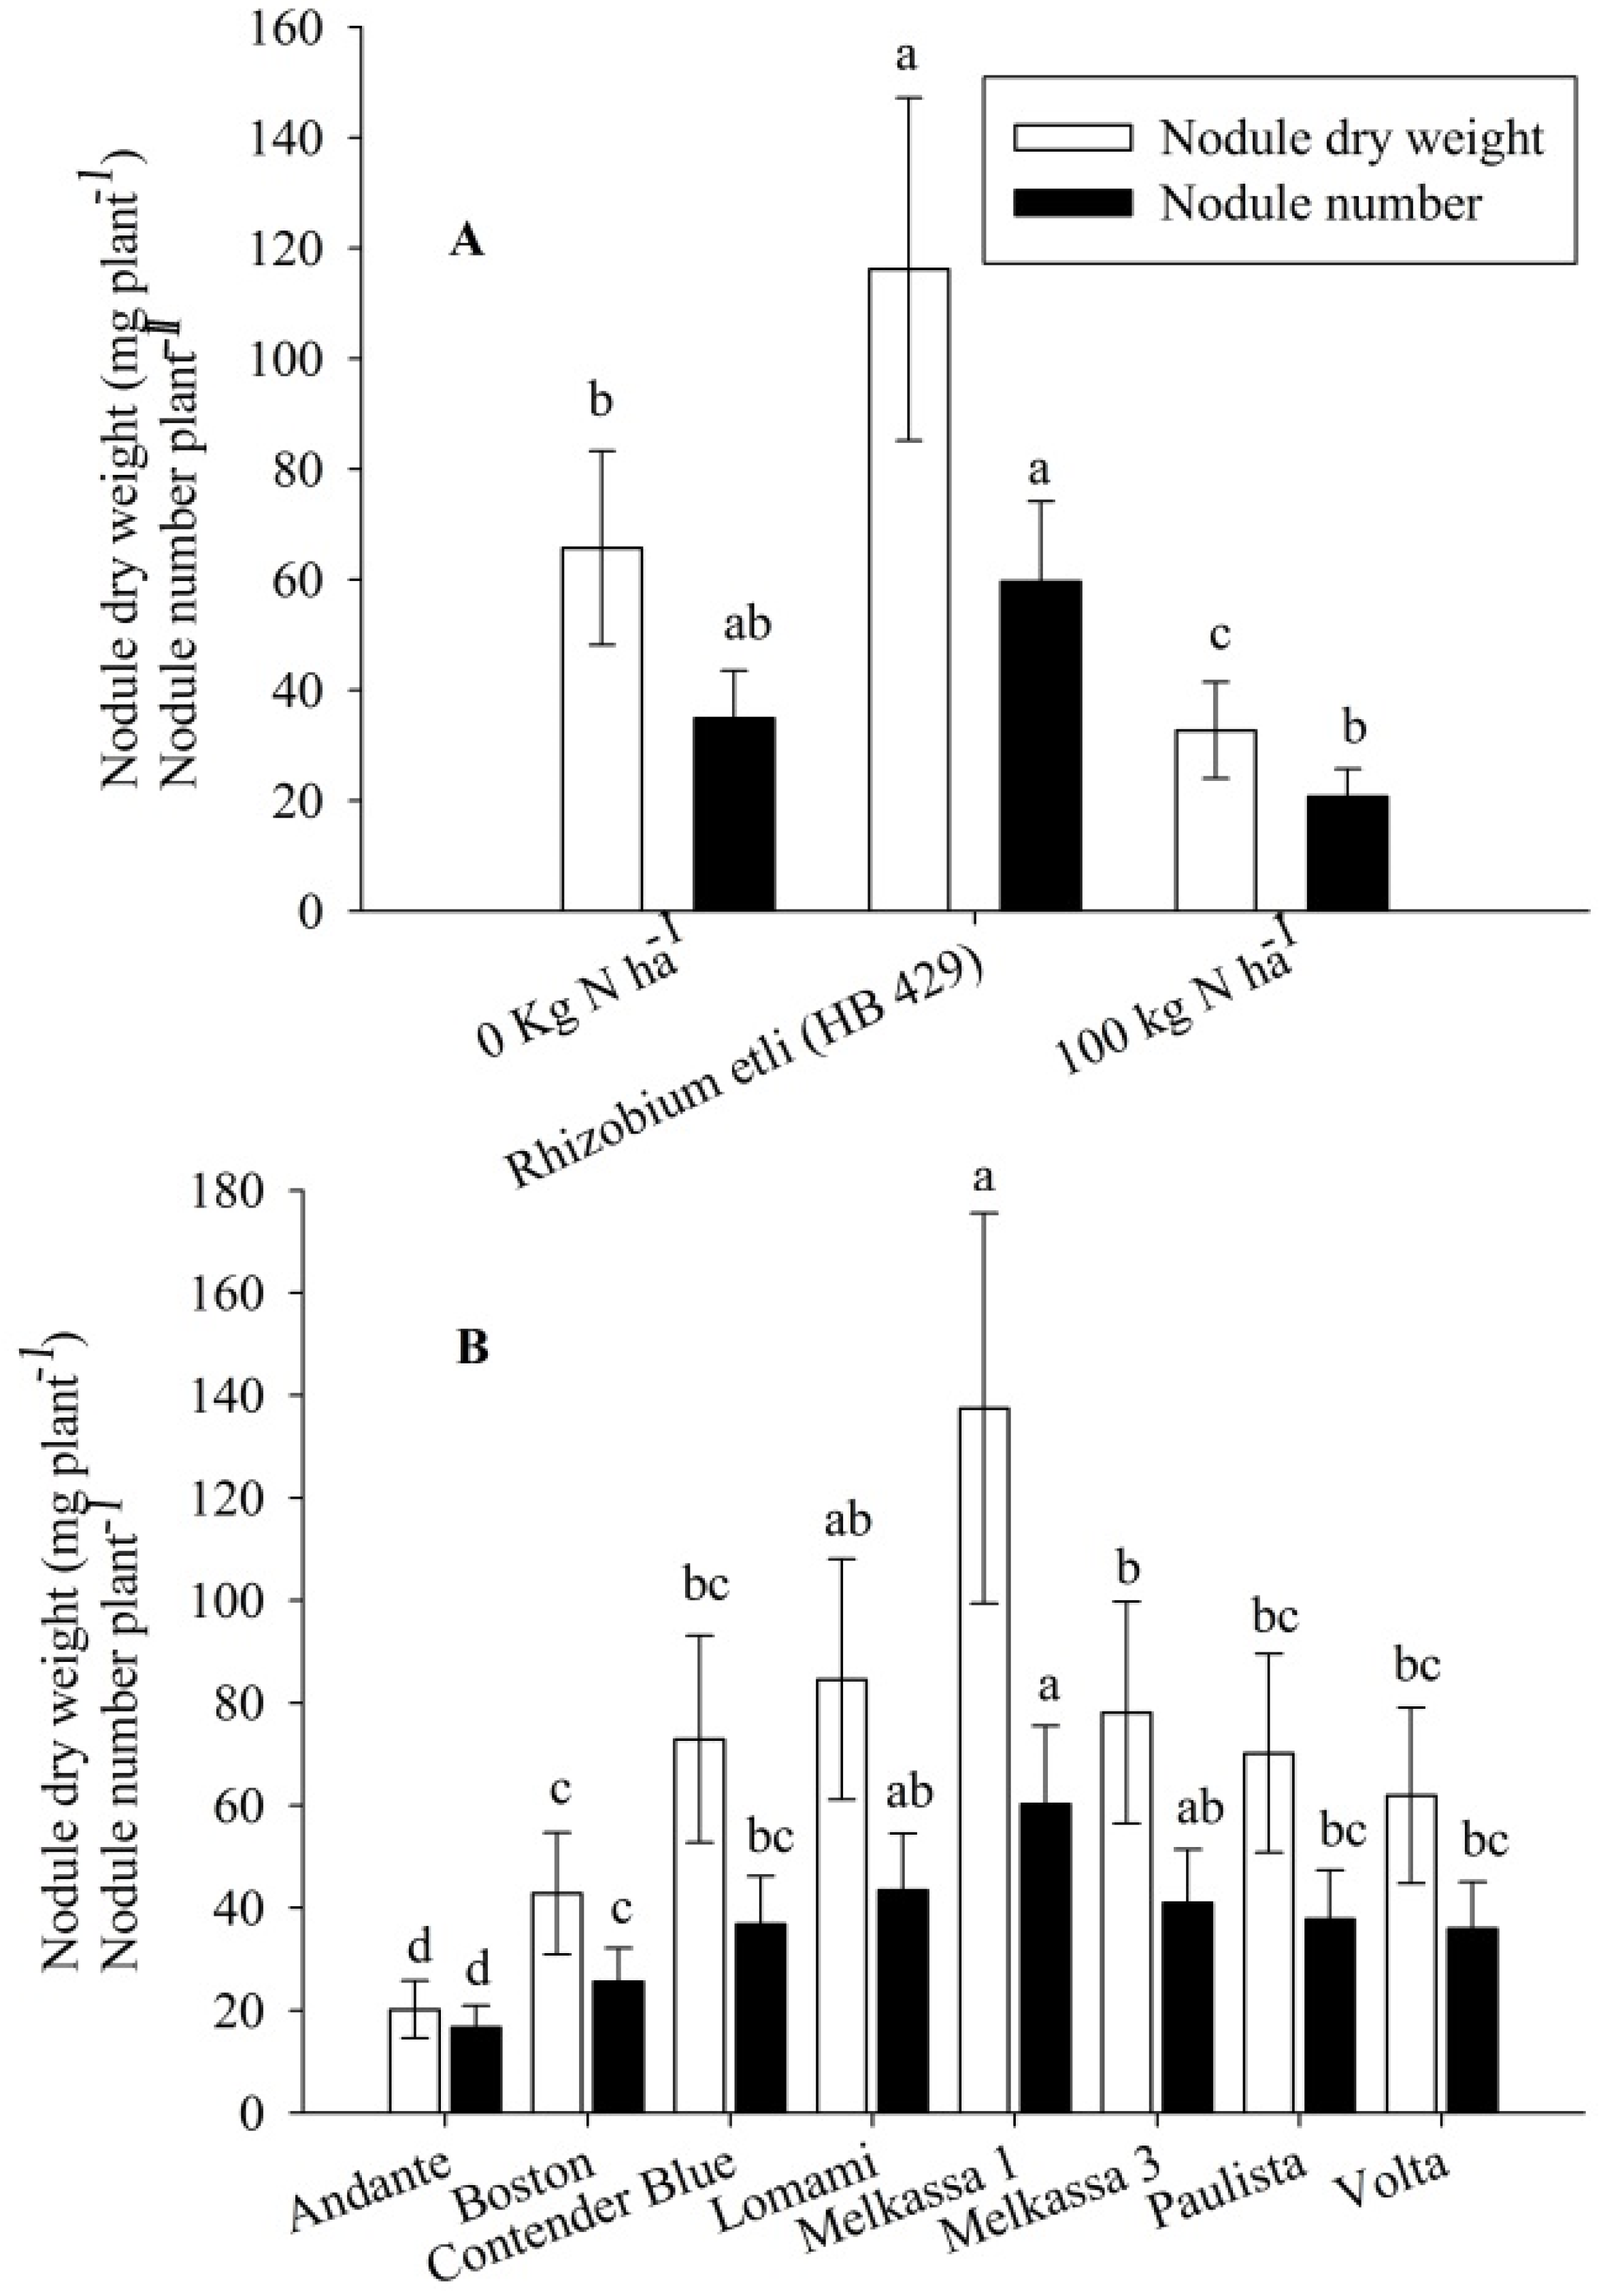
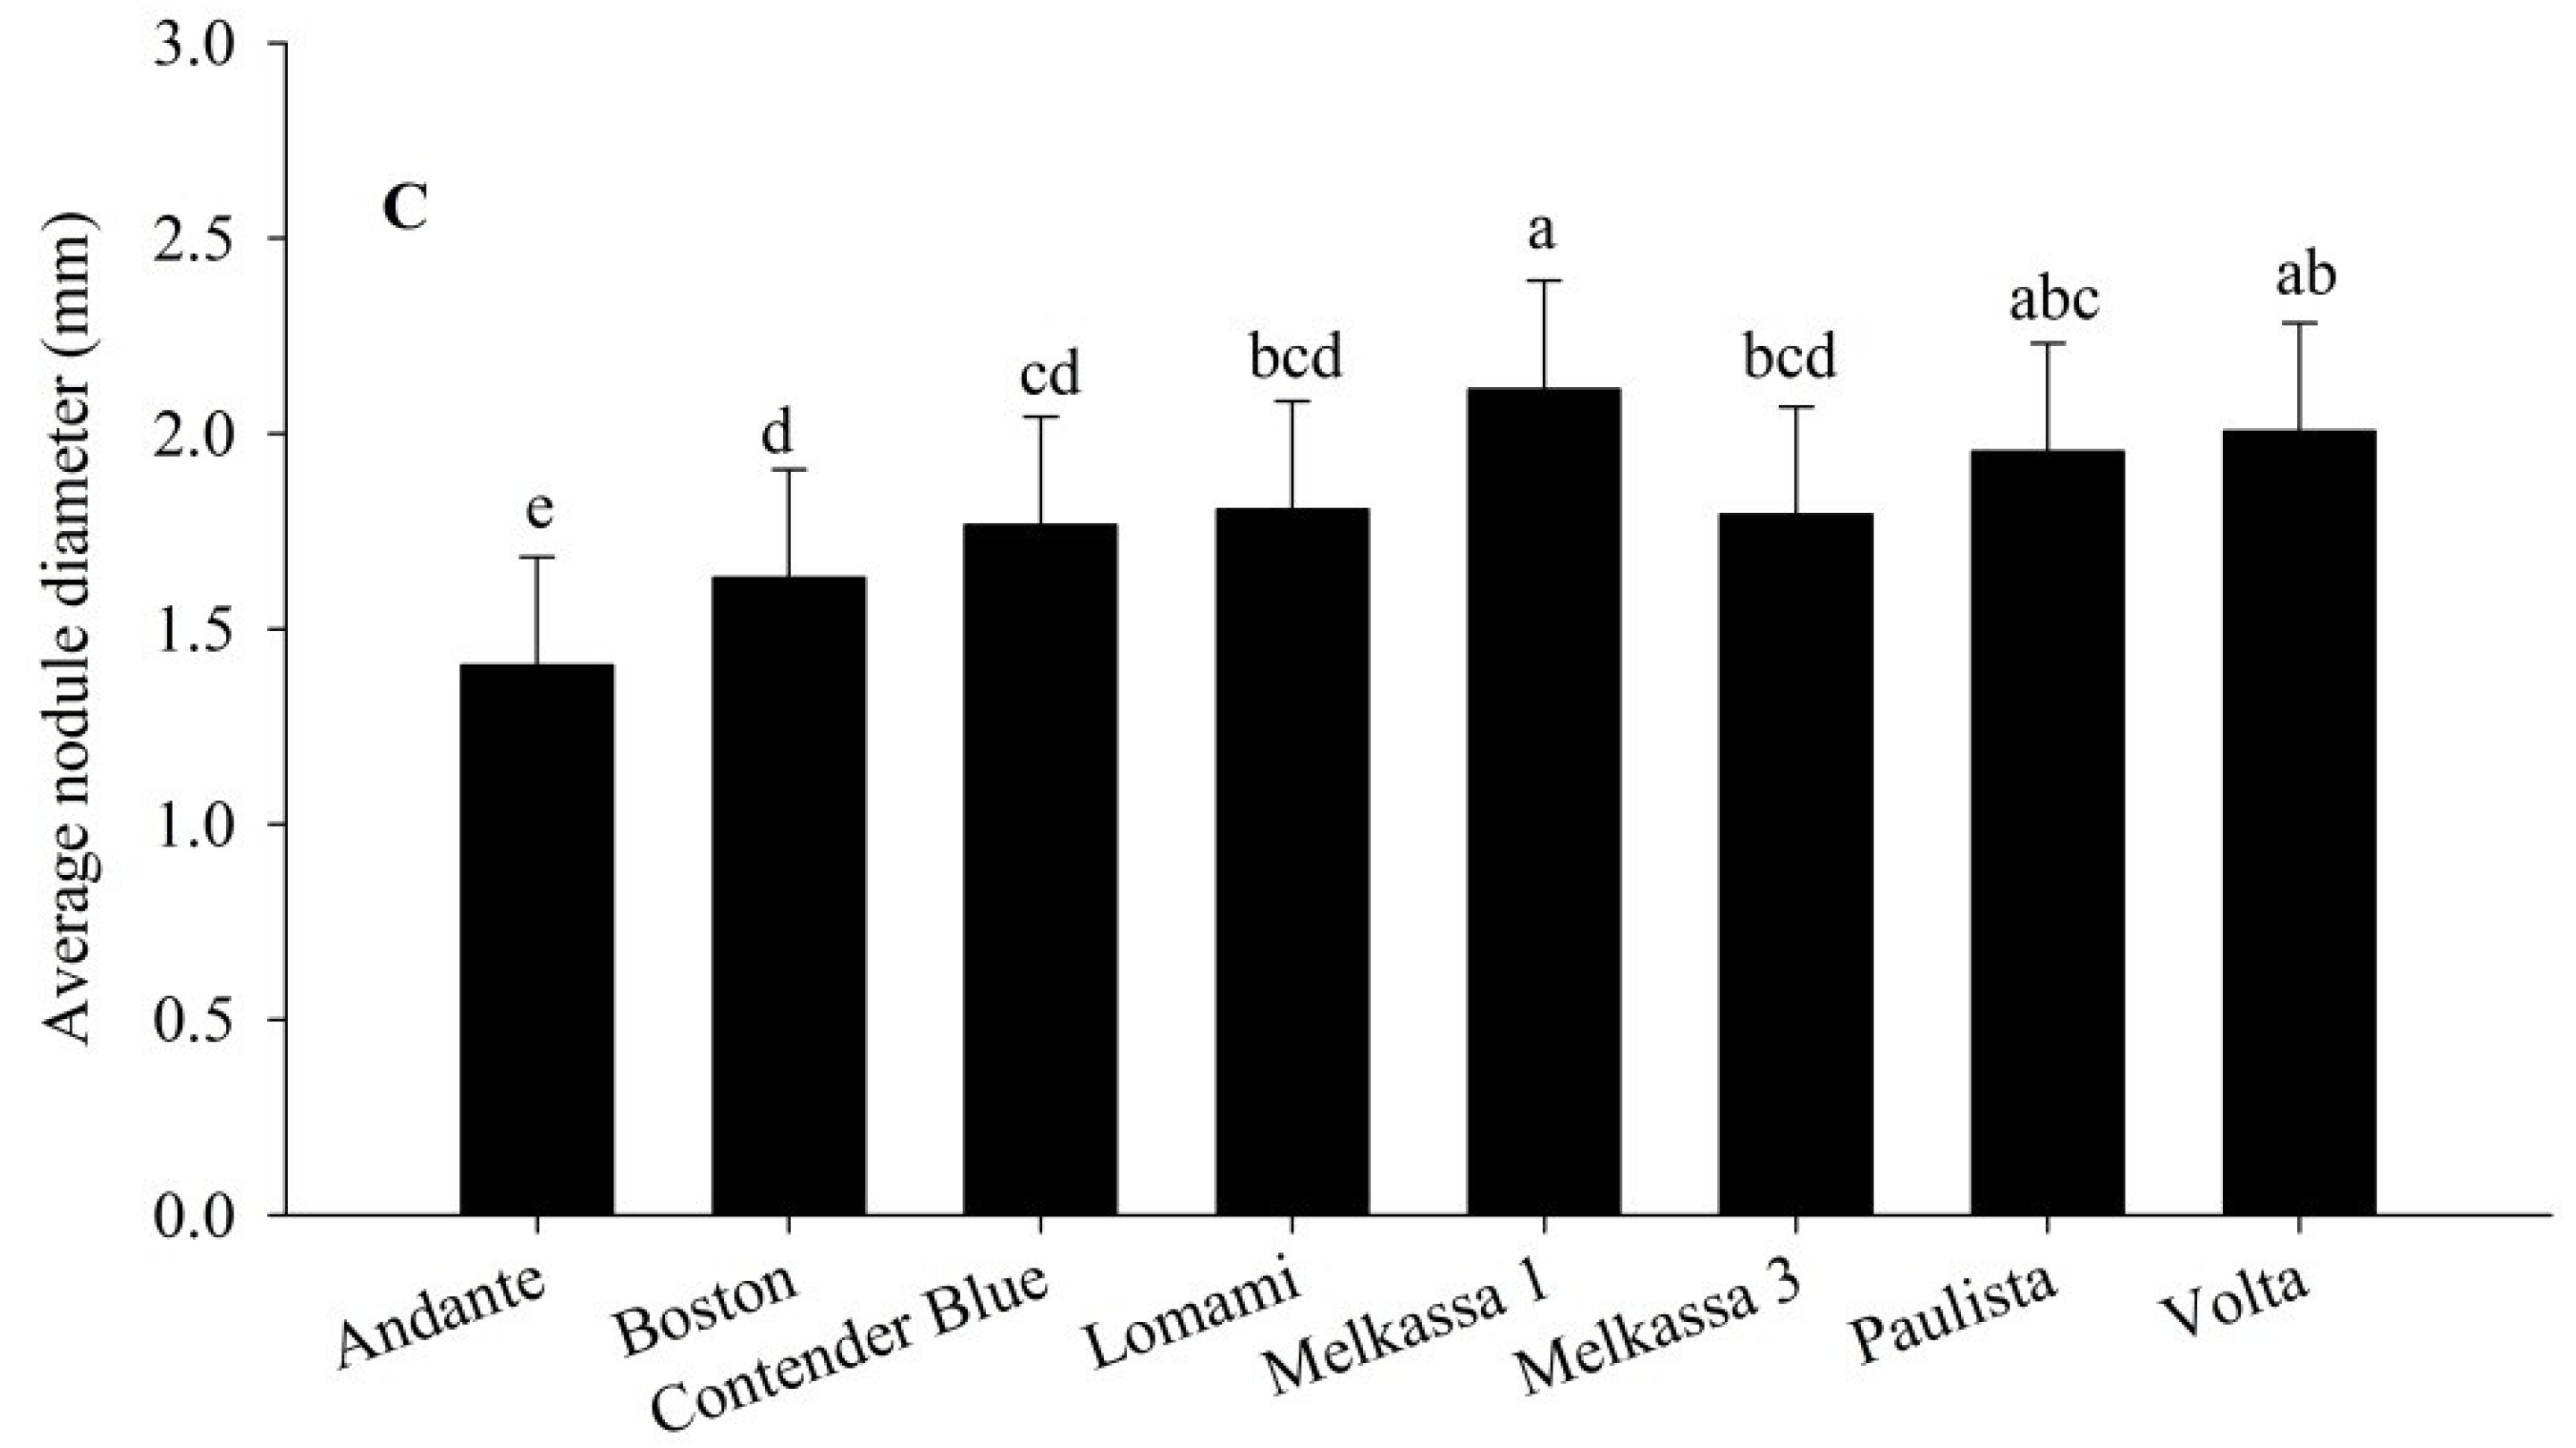
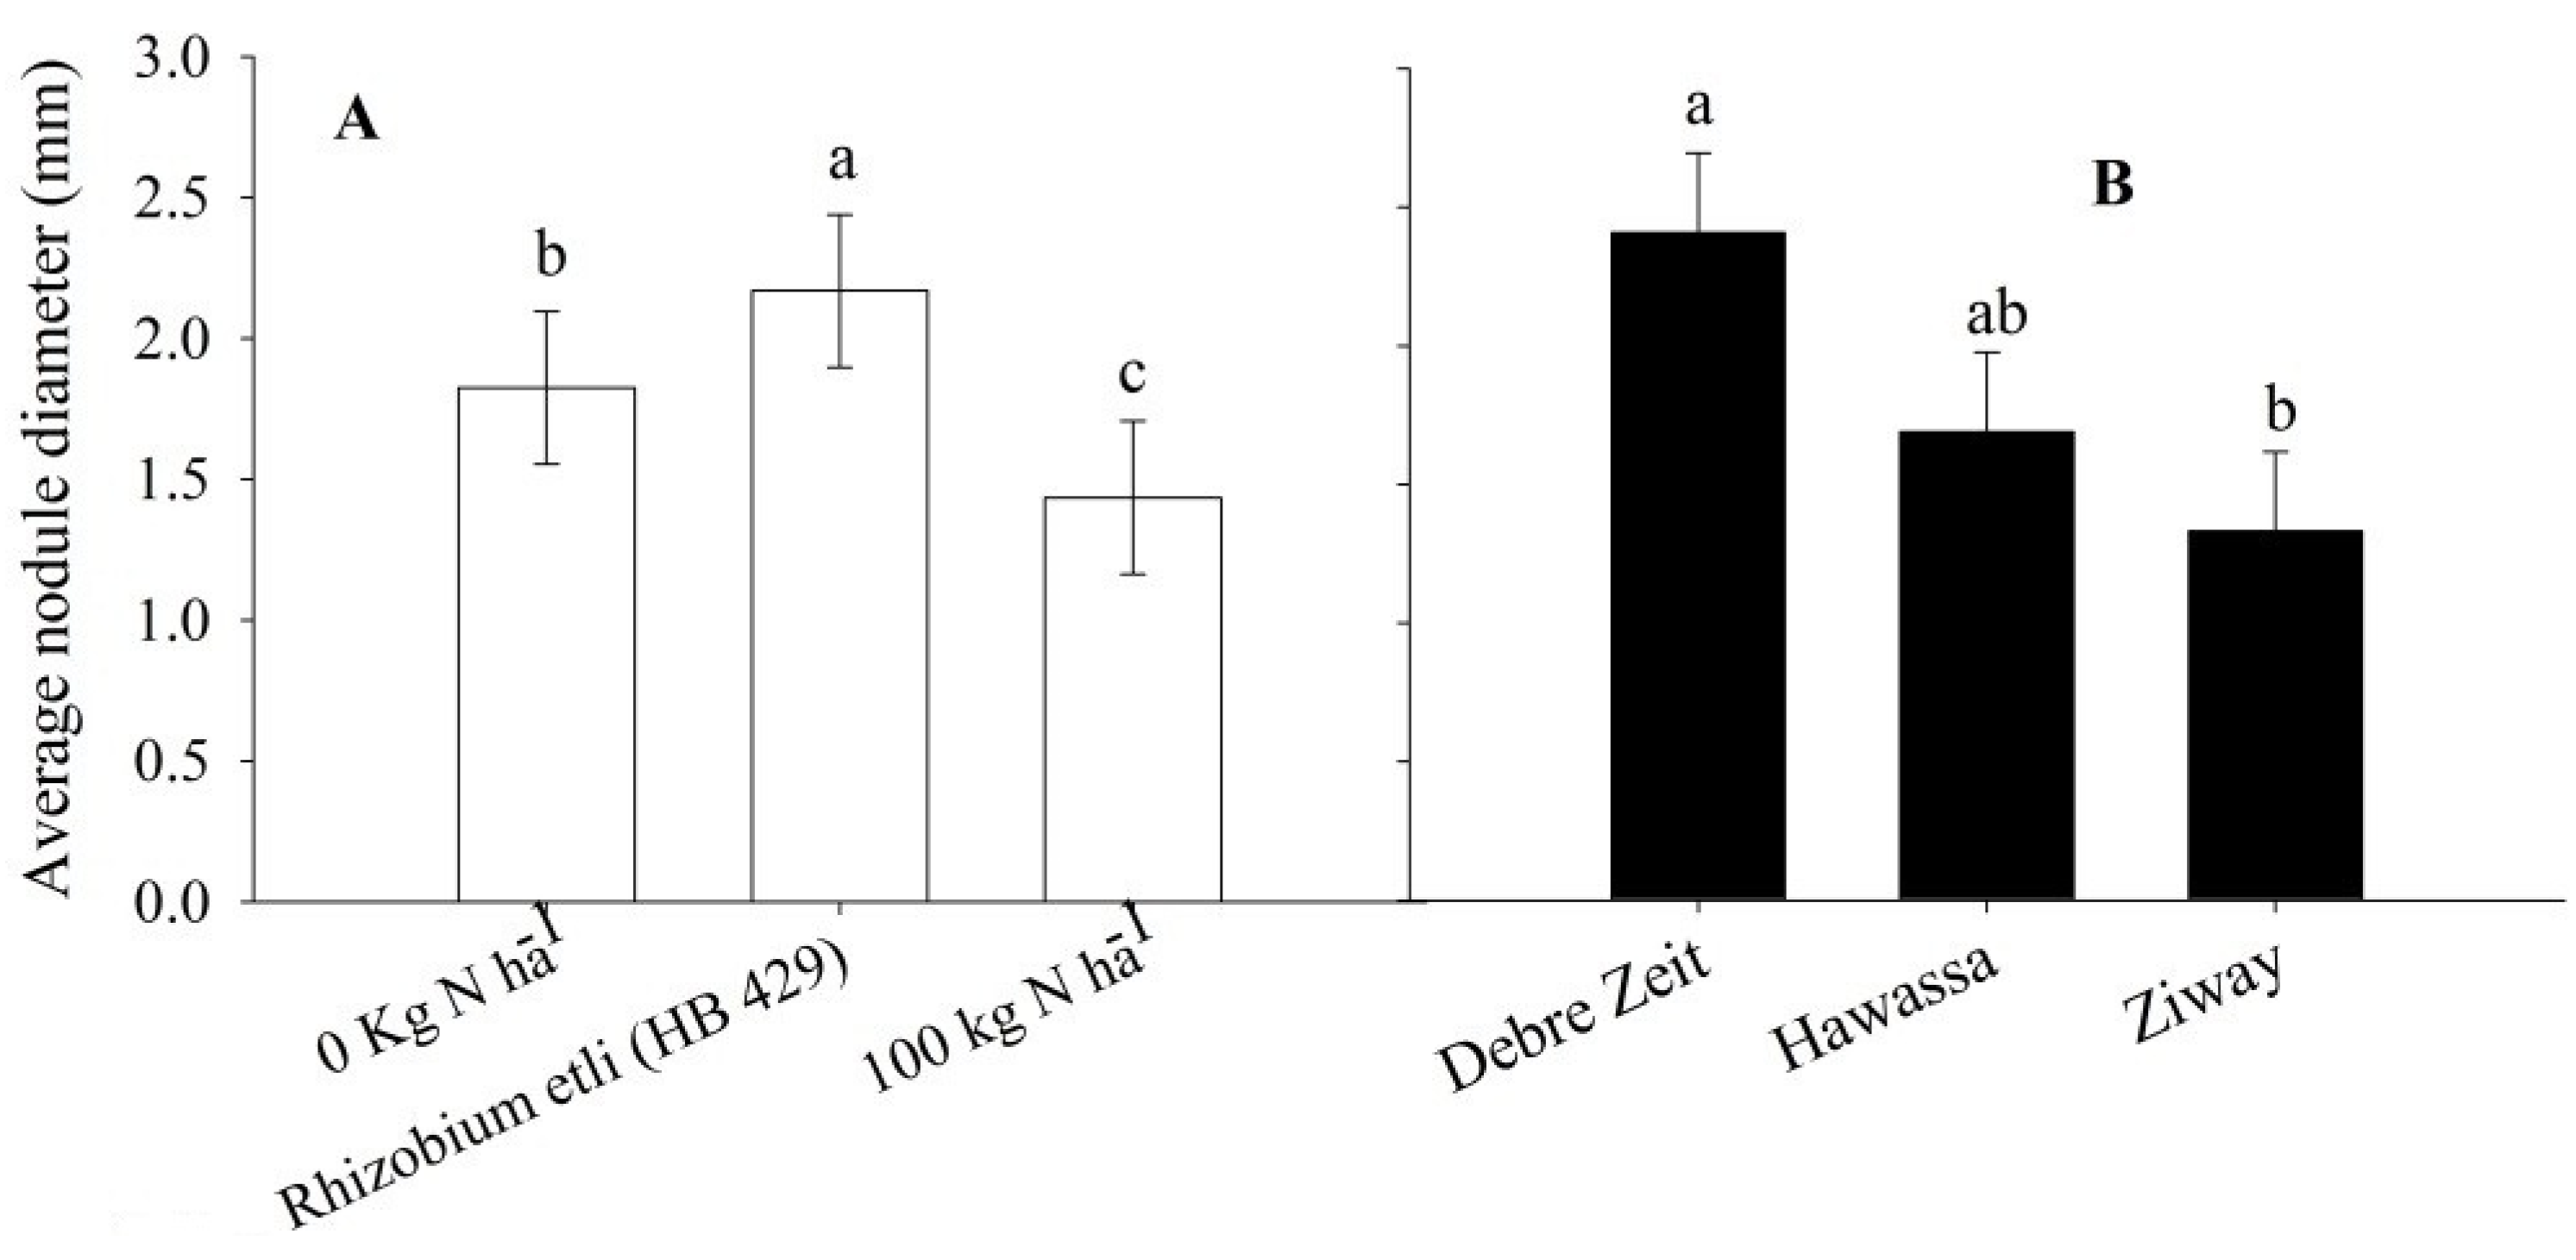
Nodulation parameters were all influenced by the treatments in this study. Nitrogen treatment and cultivar significantly (
p < 0.05) affected total nodule dry weight, nodule number and mean nodule diameter. Rhizobia inoculation resulted in the greatest nodule dry weight, nodule number (
Figure 3A) and largest nodule diameter (
Figure 4A). In contrast, N fertilizer application supressed all of these parameters. Variability across the cultivars was also observed for these nodulation parameters. Melkassa 1 produced the greatest nodule dry weight, greatest nodule number (
Figure 3B) and had the largest mean nodule diameter (
Figure 4C). Andante had the lowest followed by Boston for the nodulation parameters (
Figure 3B and
Figure 4C). Location significantly (
p < 0.05) affected only nodule diameter (
Figure 4B) out of the three nodule parameters. Nodule diameter was larger at Debre Zeit than at Ziway (
Figure 4B).
Figure 2.
Pod number per plant of snap bean as a result of nitrogen treatment by location interaction (A) and cultivar (B) in 2011 and 2012. The same lower letter on the bars (among all bars in panel (A)) and among the bars in panel (B) indicates that data are not statistically significant according to LSD at p < 0.05.
Figure 3.
Nodule number and nodule dry weight of snap bean influenced by nitrogen treatment (A) and cultivar (B) in 2011 and 2012. The same lower letter on the bars with the same legend within panels (A) and (B) indicates that data are not statistically significant according to LSD at p < 0.05
Figure 3.
Nodule number and nodule dry weight of snap bean influenced by nitrogen treatment (A) and cultivar (B) in 2011 and 2012. The same lower letter on the bars with the same legend within panels (A) and (B) indicates that data are not statistically significant according to LSD at p < 0.05
Figure 4.
Average nodule diameter of snap bean influenced by nitrogen treatment (A), location (B) and cultivar (C) in 2011 and 2012. The same lower letter on the bars within panels (A), (B) and (C) indicates that data are not statistically significant according to LSD at p < 0.05.
Figure 4.
Average nodule diameter of snap bean influenced by nitrogen treatment (A), location (B) and cultivar (C) in 2011 and 2012. The same lower letter on the bars within panels (A), (B) and (C) indicates that data are not statistically significant according to LSD at p < 0.05.
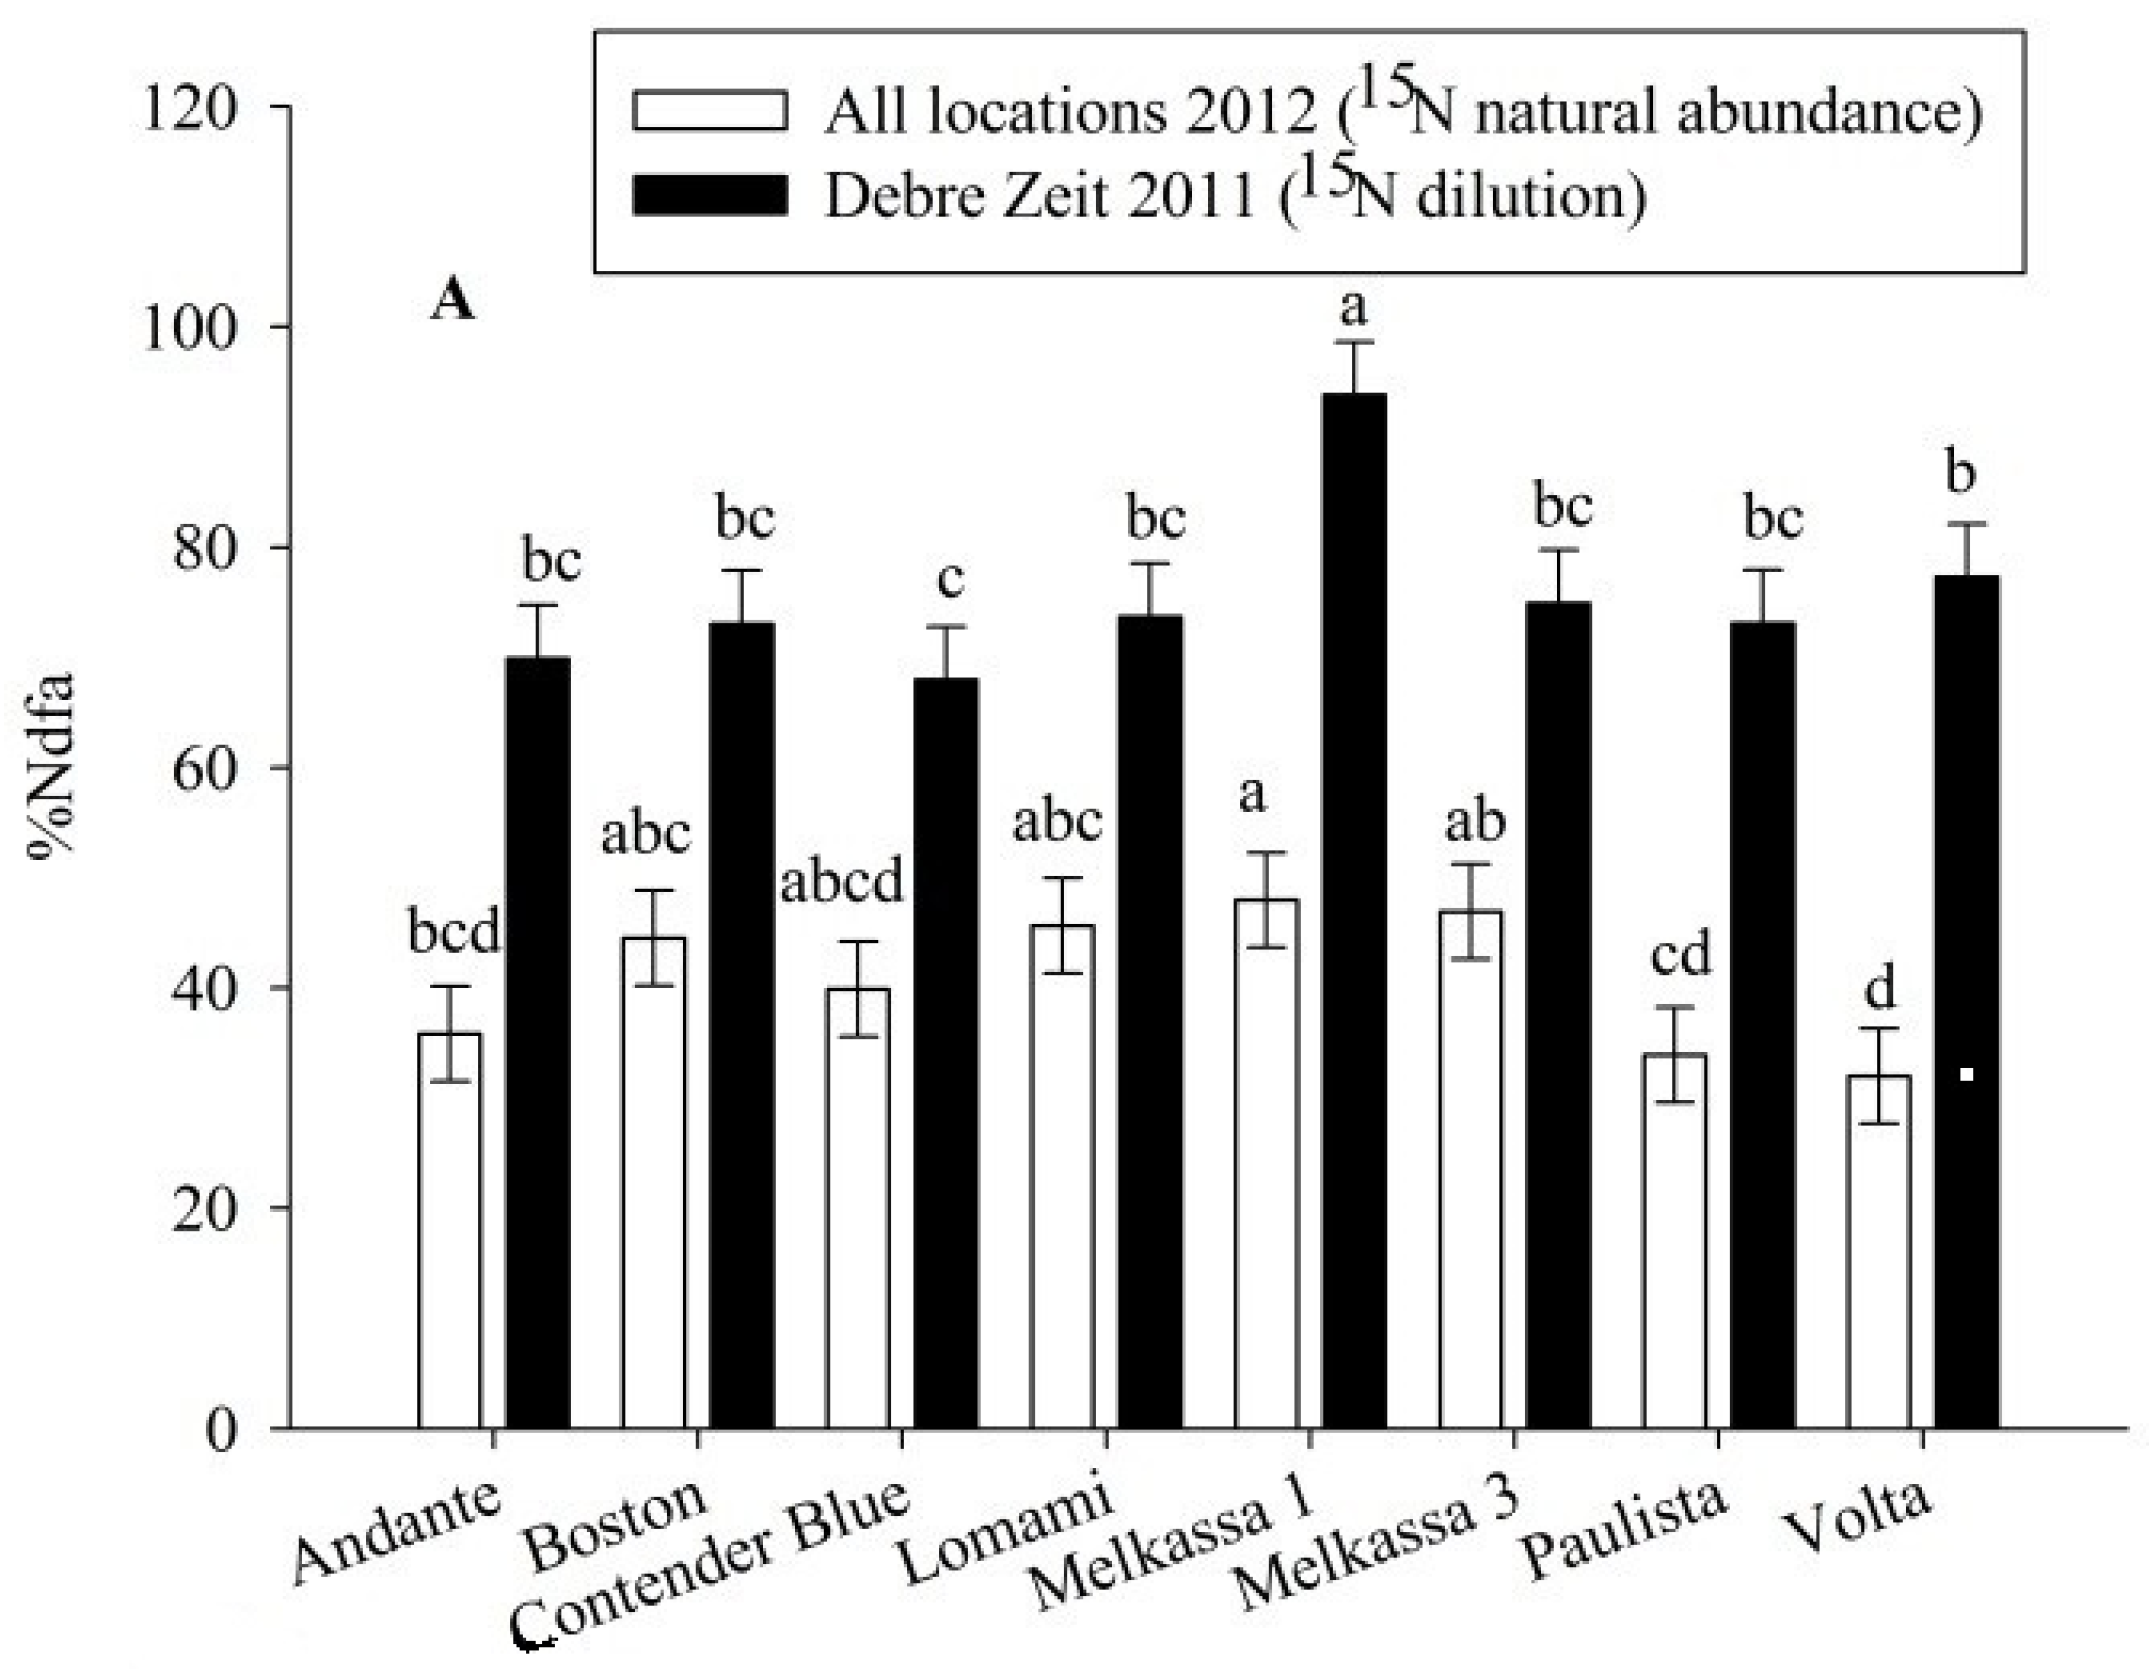
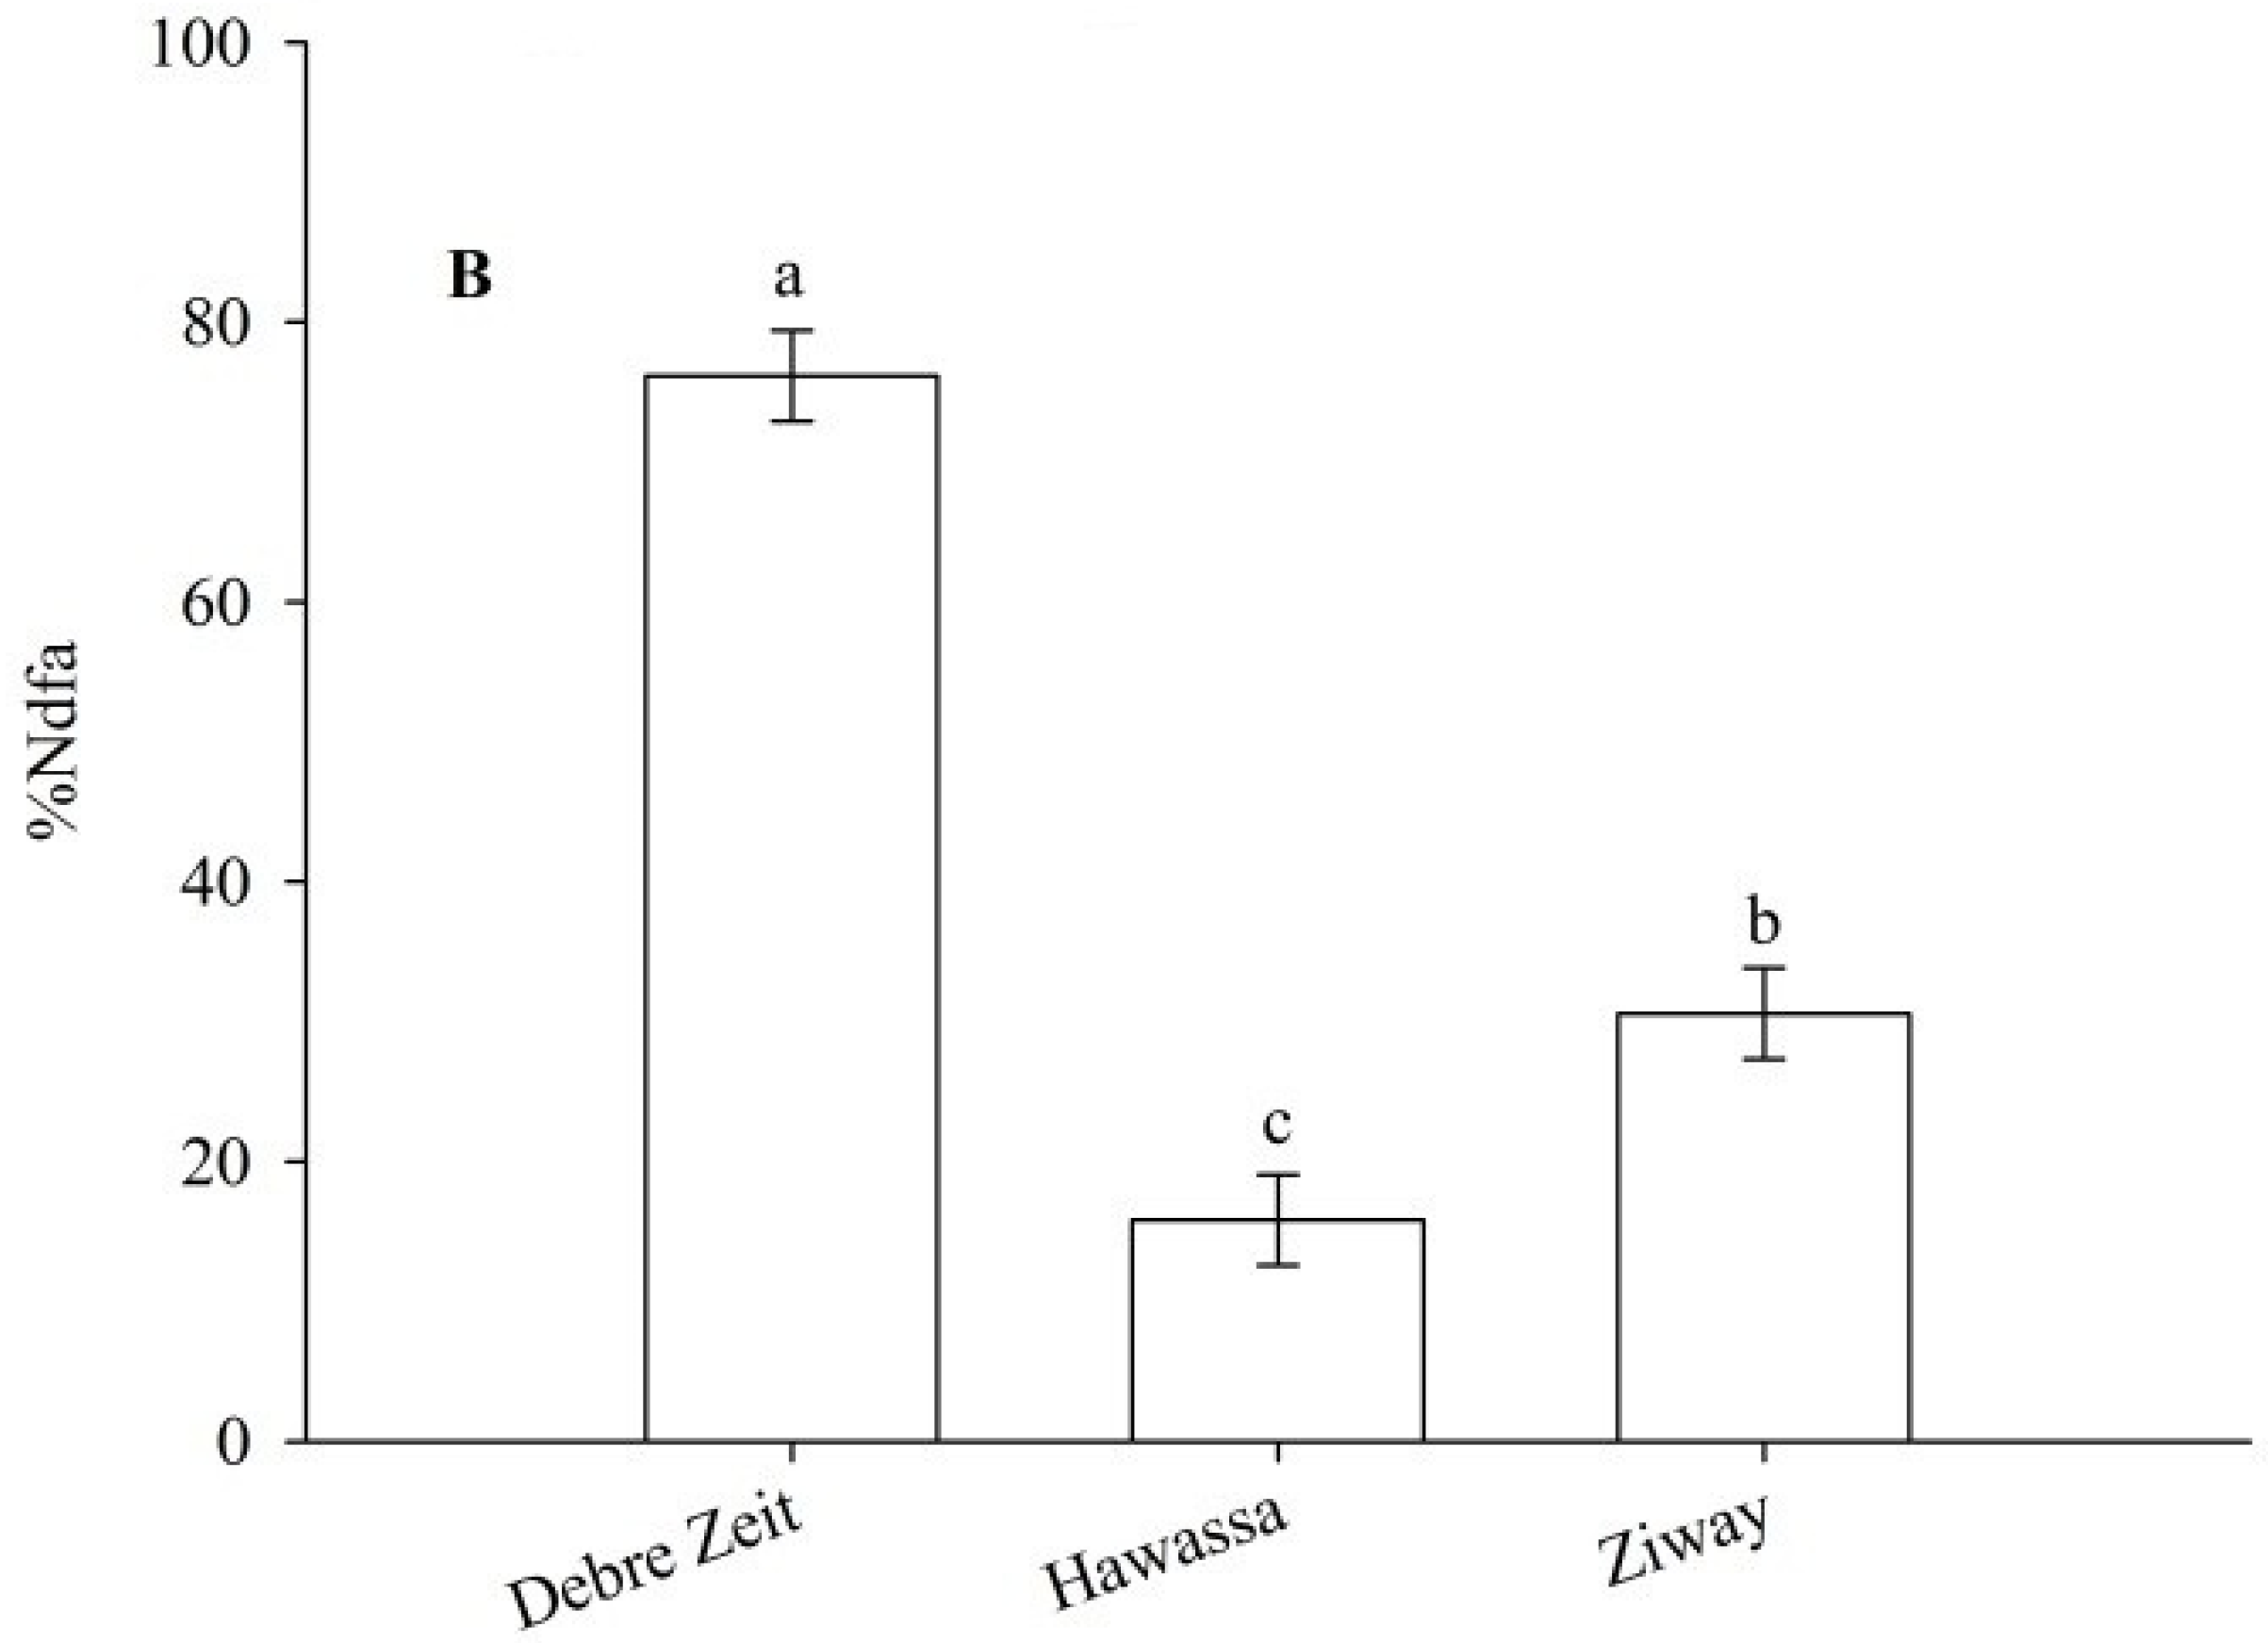
There were significant (
p < 0.05) differences among cultivars for %Ndfa which was determined by both
15N dilution (Debre Zeit, 2011) and natural
15N abundant methods (all the three sites, 2012) (
Figure 5A). Results from both
15N dilution and
15N abundance methods indicated that Melkassa 1 had the highest %Ndfa. This cultivar was significantly different from Andante, Paulista and Volta in %Ndfa according to estimates using the natural
15N abundance method and from all other cultivars according to the
15N dilution method (
Figure 5A). According to the
15N dilution method Contender Blue was the lowest N fixer of all cultivars N (
Figure 5A). The results of this experiment also indicated that %Ndfa was highest at Debre Zeit followed by Ziway, and the least at Hawassa (
Figure 5B). The correlation analysis showed that there was a positive significant correlation (
r = 0.91;
p < 0.05) in 2011 and (
r = 0.93;
p < 0.05) in 2012, between %Ndfa and yield of snap bean cultivars at Debre Zeit. This correlation was weak and non-significant (
r = 0.61;
p > 0.05) both at Hawassa and Ziway in 2012.
Figure 5.
Biological nitrogen fixation by snap bean as influenced by cultivar (A) and location (B). The same lower letter on bars with the same legend within panels (A) and (B) indicates that the data are not statistically significant according to LSD at p < 0.05.
Figure 5.
Biological nitrogen fixation by snap bean as influenced by cultivar (A) and location (B). The same lower letter on bars with the same legend within panels (A) and (B) indicates that the data are not statistically significant according to LSD at p < 0.05.
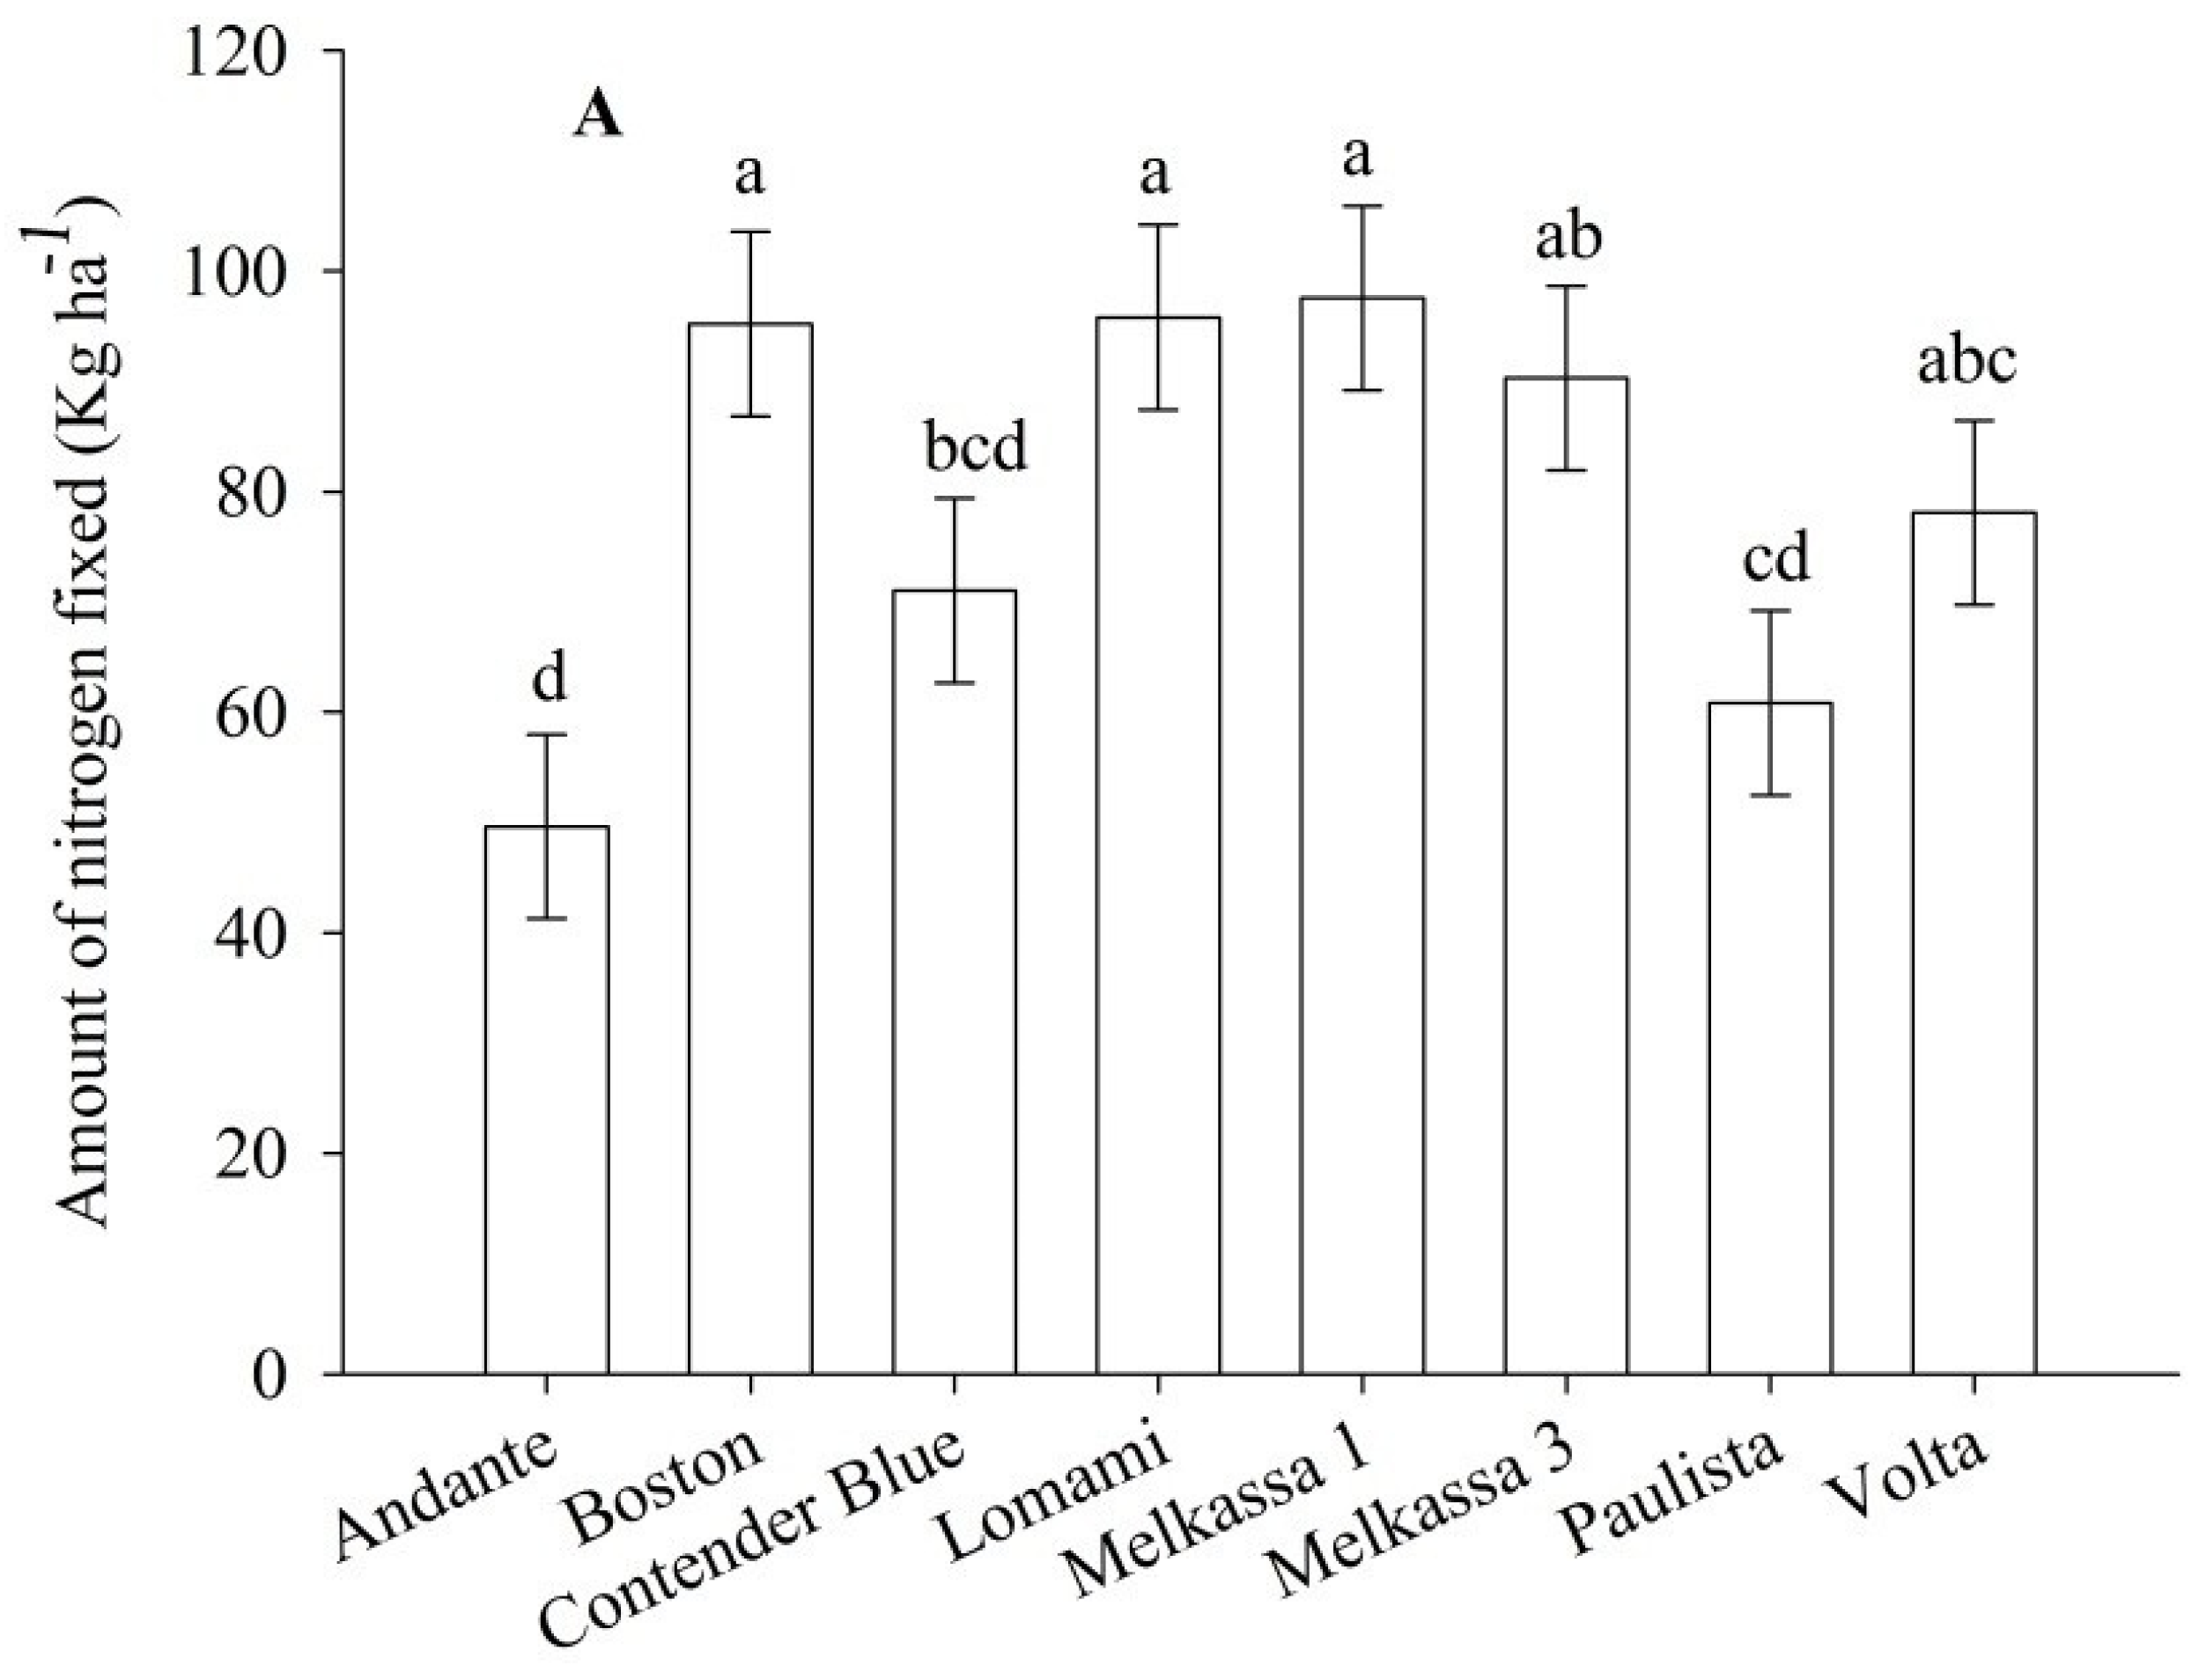
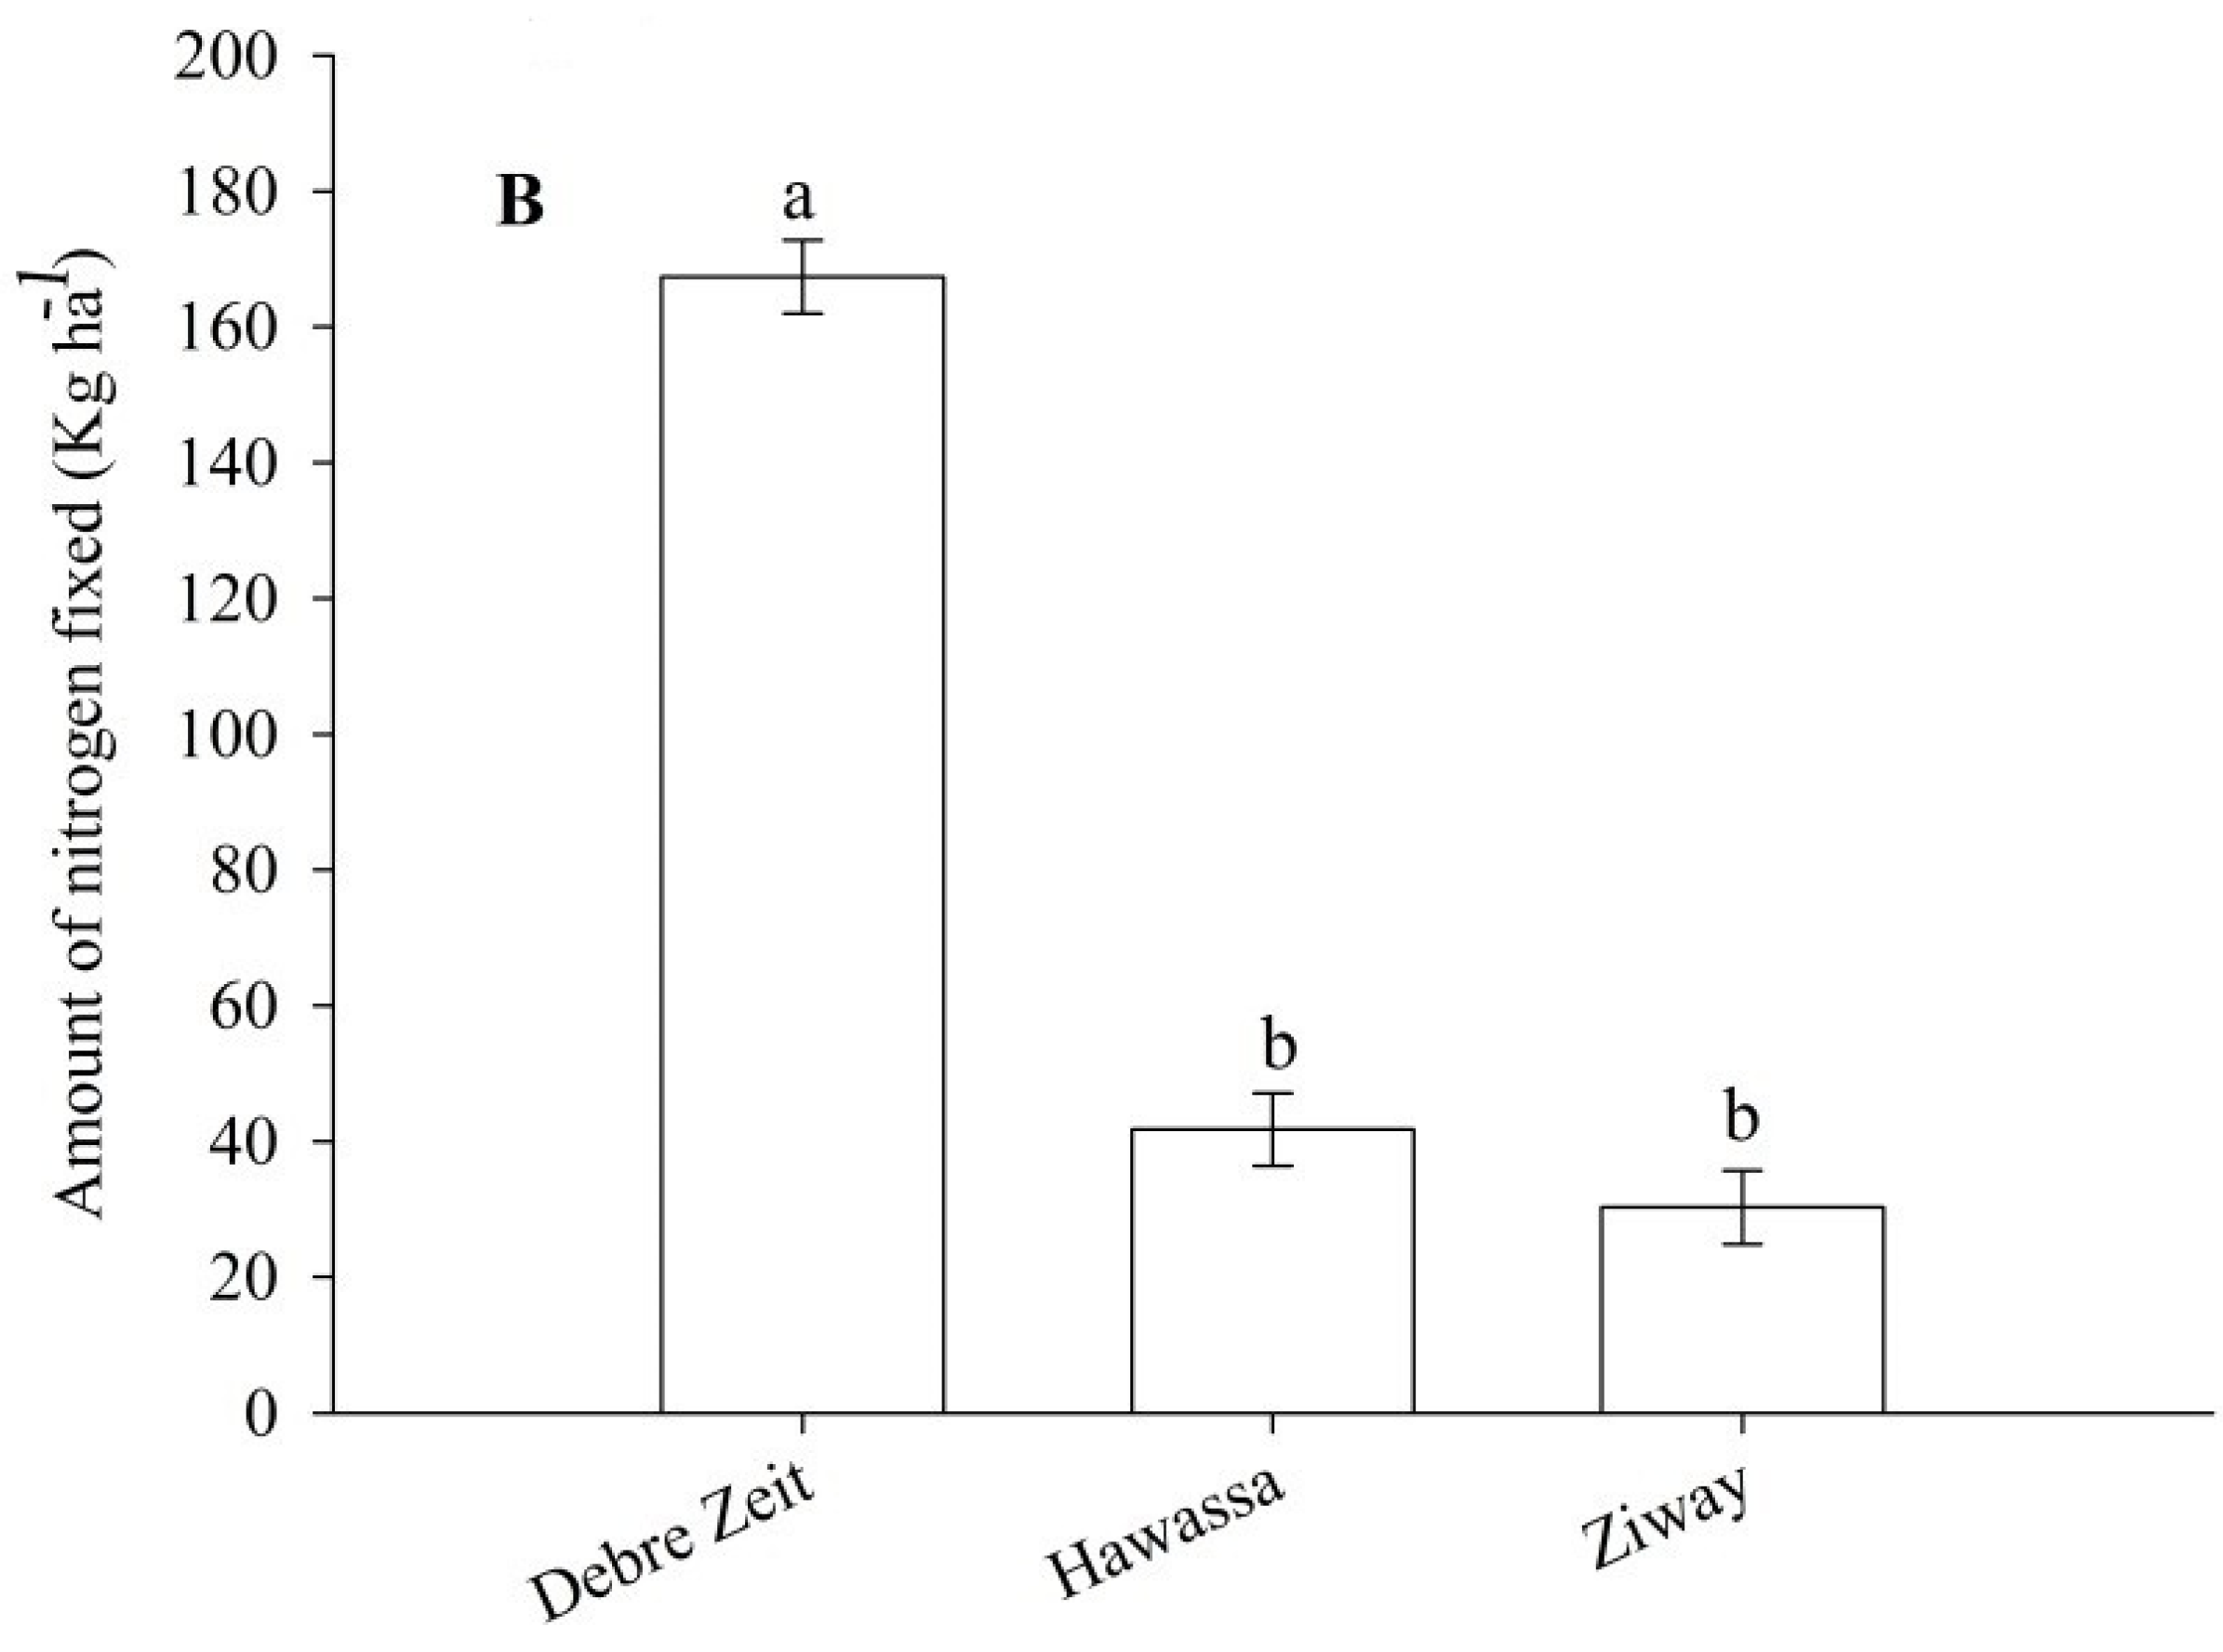
Total fixed N ha
−1 was significantly affected by cultivar and location (
p < 0.05). Melkassa 1 fixed the highest N ha
−1 (
Figure 6A). Andante fixed the lowest N followed by Paulista (
Figure 6A). Melkassa 1 cultivar fixed N almost twice of Andante (
Figure 6A). These two cultivars are contrasted also for plant size and fresh pod yield. The greatest fixed N ha
−1 was from Debre Zeit (
Figure 6B). Total fixed N was low at Hawassa and Ziway (
Figure 6B). Total fixed N followed similar pattern with %Ndfa with the exceptions of cultivars Contender Blue and Volta (
Figure 5A and
Figure 6A).
Figure 6.
Total nitrogen fixed by inoculated snap bean as influenced by cultivar (A) and location (B) 2012. The same lower letter on the bars within panels (A) or (B) indicates that data are not statistically significant according to LSD at p < 0.05.
Figure 6.
Total nitrogen fixed by inoculated snap bean as influenced by cultivar (A) and location (B) 2012. The same lower letter on the bars within panels (A) or (B) indicates that data are not statistically significant according to LSD at p < 0.05.
4. Discussion
This study demonstrated that N application consistently increased total yield, pod dry weight and pod number per plant of snap bean cultivars. Rhizobia inoculation increased the total yield and yield components of snap bean relative to an unfertilized and uninoculated treatments. Increased yield (42%) due to applied inorganic N fertilizer was far greater than yield increases achieved by rhizobia inoculation (18%), suggesting that not all N requirements were met via biological N
2 fixation, or alternatively, that N
2 fixation taxed the energy requirements of the plant. Legumes need extra energy to fix N
2 from the air into useable forms by themselves [
28,
29]. Moreover, common bean has greater mineral N uptake efficiency as compared to when it is fixing N
2 [
14]. This may indicate that snap bean’s early N demand could have been satisfied from the applied N source than N from fixation so early N supply would have contributed to the rapid growth of leaves and accumulation of dry matter. Additionally, N
2 fixation by legumes is affected by a number of edaphic, climatic and biotic factors [
30] that may reduce its effectiveness when compared to applied N.
According to our preliminary survey on snap production in the Rift Valley regions of Ethiopia, the productivity of commercial snap bean ranges between 10–20 t·ha−1. The commercial producers applied on average of 100 kg·N·ha−1 for snap bean production under irrigated conditions. The current experiment showed that similar range of productivity levels can be achieved by rhizobial inoculation. However, applied N still can do better than the rhiziobial inoculation. Given the high cost of N fertilizer, small-scale resource-limited farmers can be benefited from using rhizobial inoculation.
The greater pod number was obtained by 100 kg·N·ha
−1 at Hawassa. Application of 100 kg·N·ha
−1 and rhizobia inoculation at Debre Zeit resulted in similar pod numbers with that of rhizobia inoculation and the control at Hawassa. Within each location, rhizobium inoculation was significantly different from the control only at Debre Zeit. This result clearly indicated that rhizobia inoculation was most effective at Debre Zeit. Hawassa was the most suitable area for increasing pod number of snap bean. A greater number of pods lead to higher yield as these two traits have direct association [
31]. Although applied N resulted in the highest pod yield and yield components of snap bean, rhizobial inoculation also improved the vegetable yield of snap bean (green pod yield) as compared to the control treatment. This result suggests that pod yield increases can be achieved by a N
2 fixation system sustained until commercial maturity of snap bean (green pod), and viable snap bean production can be realized using rhizobial inoculant under low input systems.
Inoculation with
R. etli (HB 429) increased nodule number, nodule dry weight and diameter of nodules, whereas, N application suppressed these parameters. The current result was similar with previous reports [
10,
32,
33,
34,
35] conducted on common bean and other grain legumes. Nodule numbers under 0 kg·N·ha
−1 were comparable to the inoculated treatment. This may be due to higher number of indigenous rhizobia in the research site which usually resulted in small ineffective nodules as reflected by nodule diameter and nodule dry weight.
Yield variability was observed among the current cultivars. Genetic variability affected the performance of common bean cultivars in terms of shoot biomass and yield [
36]. Our result indicated that Melkassa 1 was the best cultivar to grow under rain fed conditions. This cultivar exhibited substantial N
2 fixation and greatest yield compared to other cultivars under rain fed conditions. Melkassa 1 also had the greatest pod dry weight and was among the top cultivars for number of pods produced under rain fed conditions.
This study demonstrated that the cultivar Melkassa 1 has the potential to produce large numbers of nodules with larger nodule sizes resulting in greater overall nodule dry weights. Moreover, Melkassa 1 achieved relatively high levels of %Ndfa which was determined by both
15N dilution method from Debre Zeit site in 2011 and
15N natural abundance method across all locations in 2012. Most importantly Melkassa 1 also fixed the highest N·ha
−1. Previous investigations explained that effectiveness of N
2 fixation by rhizobia and further conversion into yield is affected by genotype in field bean [
9,
15,
17]. The current result further indicated the occurrence of variations among snap bean cultivars for effective N
2 fixation. The
15N dilution method in 2011 resulted in higher %Ndfa as compared to
15N natural abundance in 2012. In 2011, the
15N dilution method was used to determine %Ndfa only from single location (Debre Zeit). The nodulation and N
2 fixation data showed that higher N
2 fixation occurred at Debre Zeit as compared to other two locations. However, %Ndfa was determined by natural abundance method from all the three locations in 2012. Nodulation and N
2 fixation were lower at Hawassa and Ziway. The lower %Ndfa from Hawassa and Ziway may lower the average %Ndfa in 2012. This may be the main reason for the discrepancy between
15N dilution and natural abundance methods on %Ndfa in the current experiment.
The greater N
2 fixation response in this experiment compared to previous reports on common bean [
10,
37] may be due to the effectiveness of the strain we used, the response of the cultivars, appropriate site selection or suitable growing season during experiments. Many other factors including improved crop management may also contribute to a favorable outcome. Moreover, several reports demonstrated that significant improvement of yield and yield components in common bean was due to N
2 fixation [
9,
32,
38,
39,
40].
Our study also demonstrated that %Ndfa and total fixed N·ha
−1 were highest at Debre Zeit which was also reflected in the number of pods per plant from interactions between N treatment and location. The correlation analysis also showed that fresh pod yield had a significant positive correlation with %Ndfa at Debre Zeit both in 2011 and 2012. In addition to other factors [
18,
19], higher %Ndfa and total fixed N·ha
−1 at Debre Zeit may be due to greater copper concentration in the soil that contributed to the effectiveness of N
2 fixation [
41,
42]. Nodule size was greater at Hawassa than at Ziway, but the reverse was observed for %Ndfa for these two locations. This may indicate that the presence of nodules and their average size may not necessarily guarantee effective N
2 fixation. However, large biomass at Hawassa may contribute to high total N leading to high fixed N compared to at Ziway.


