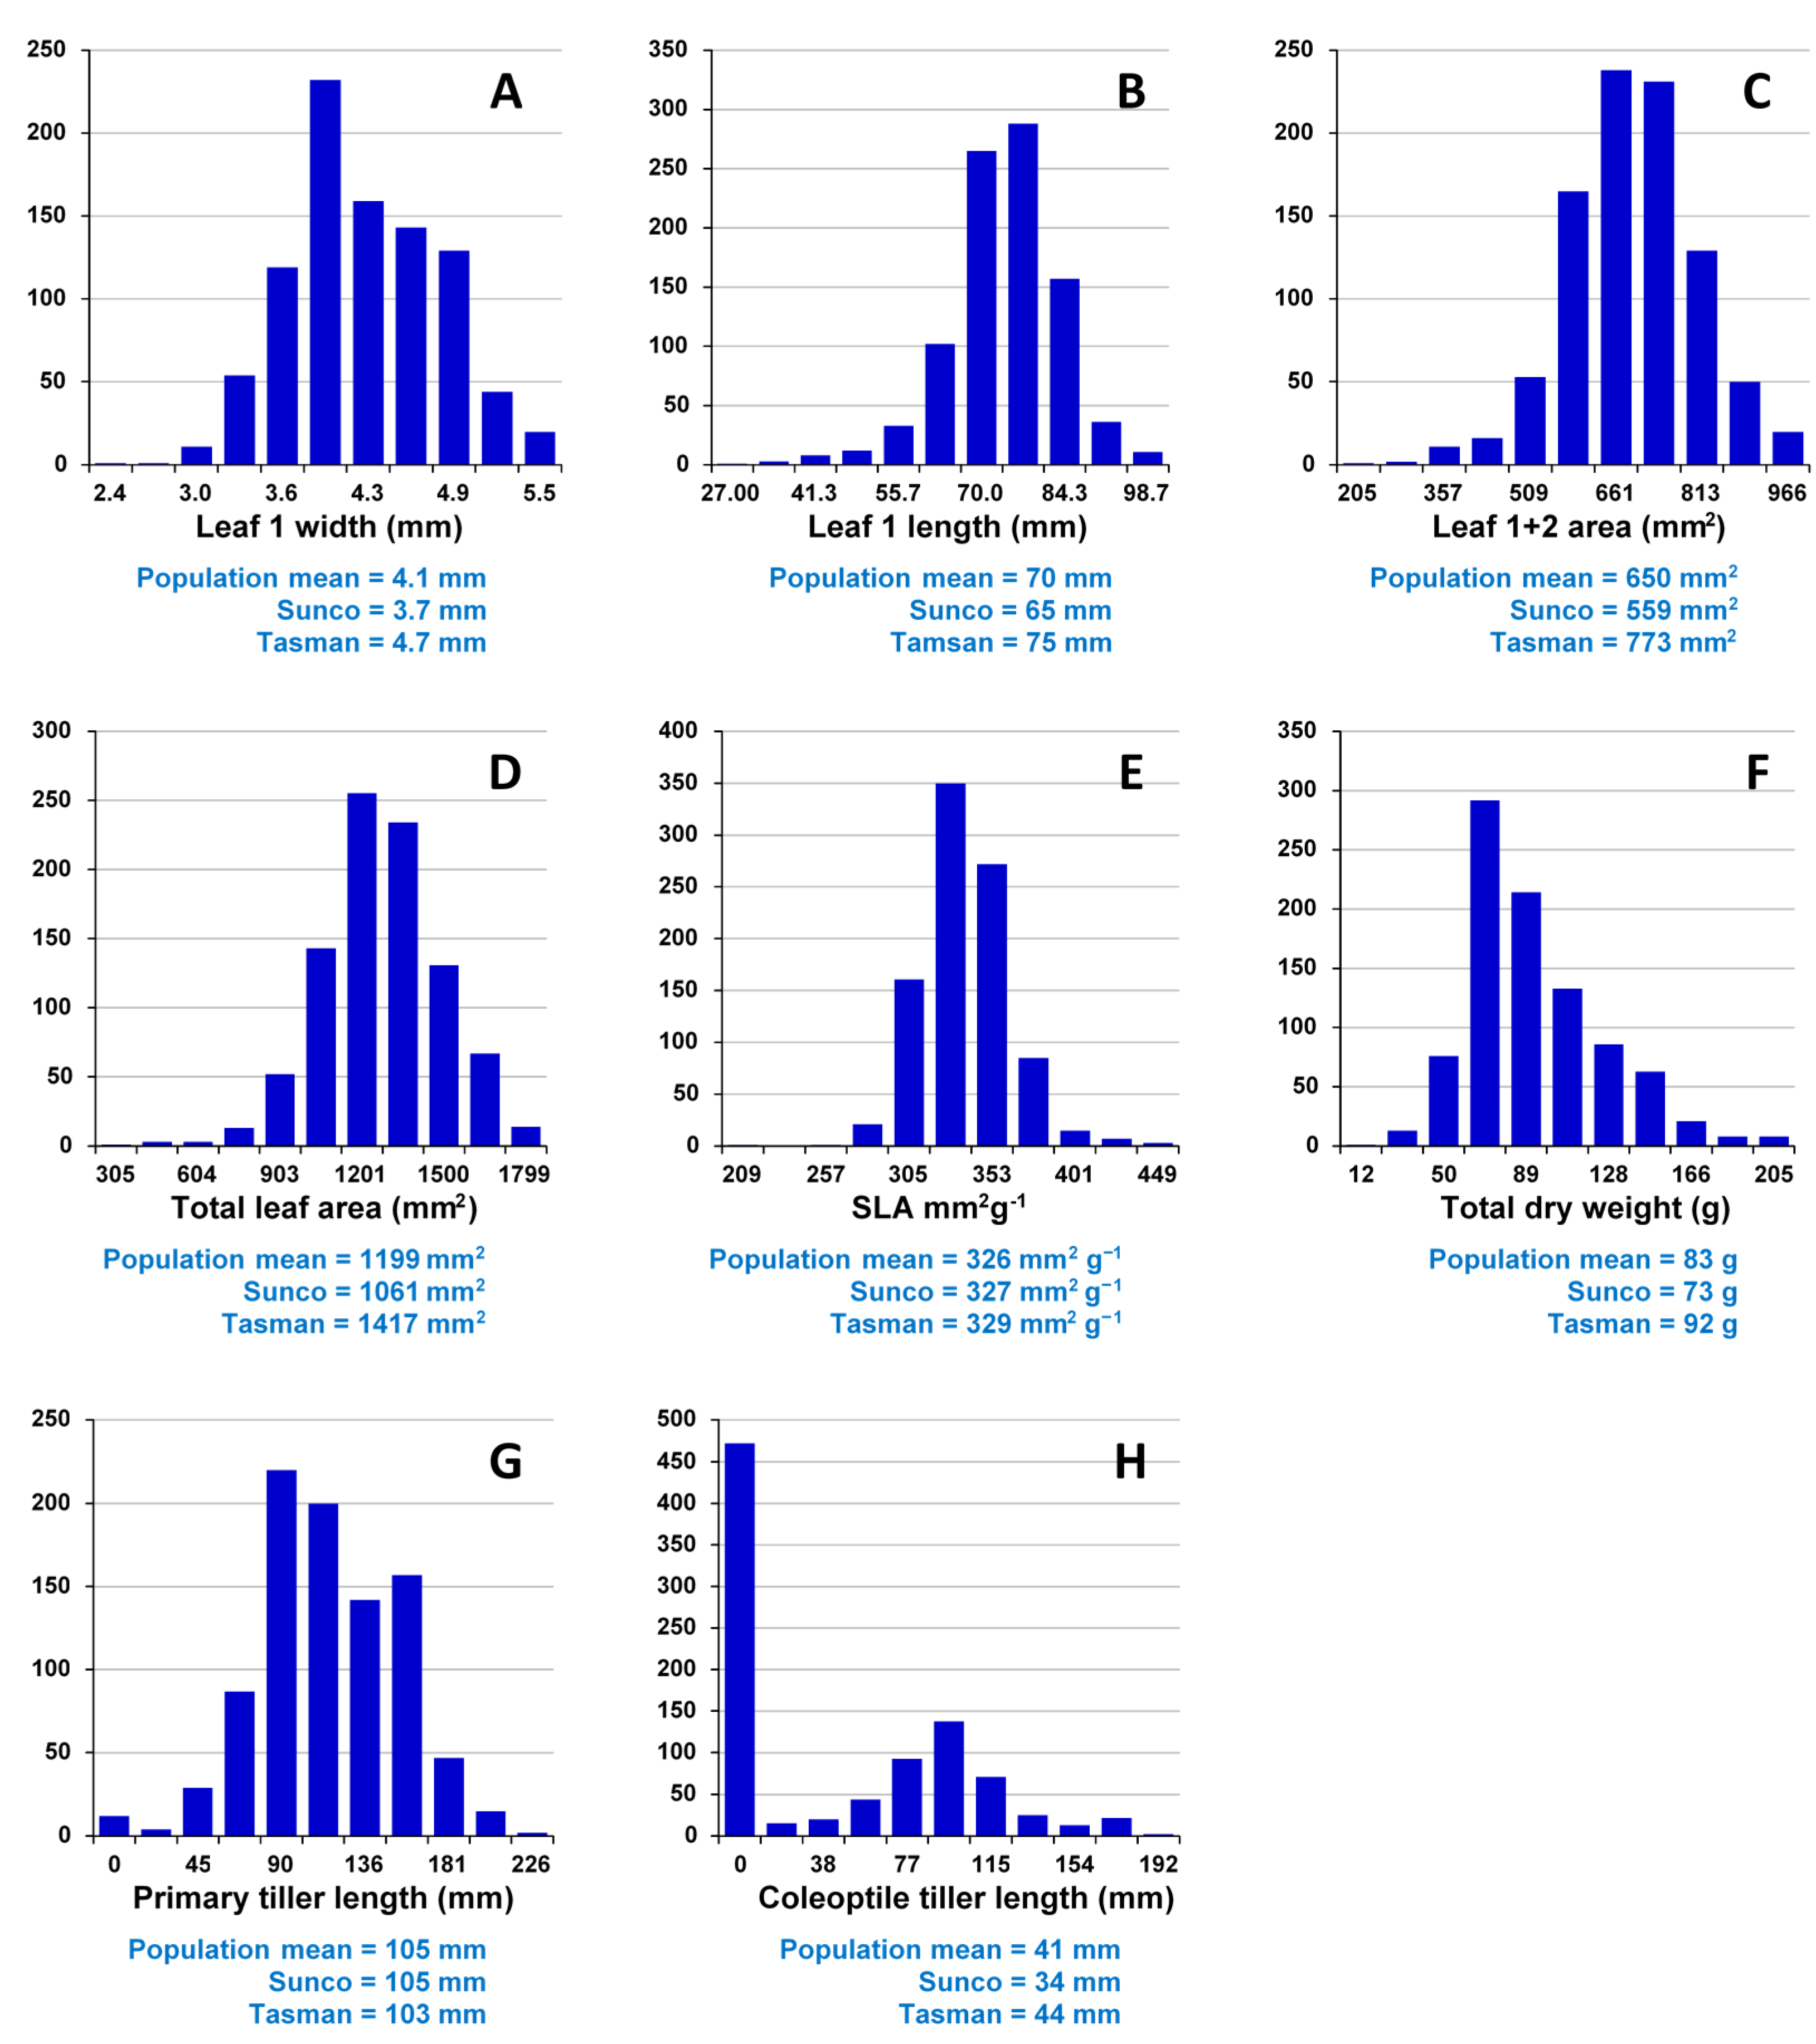
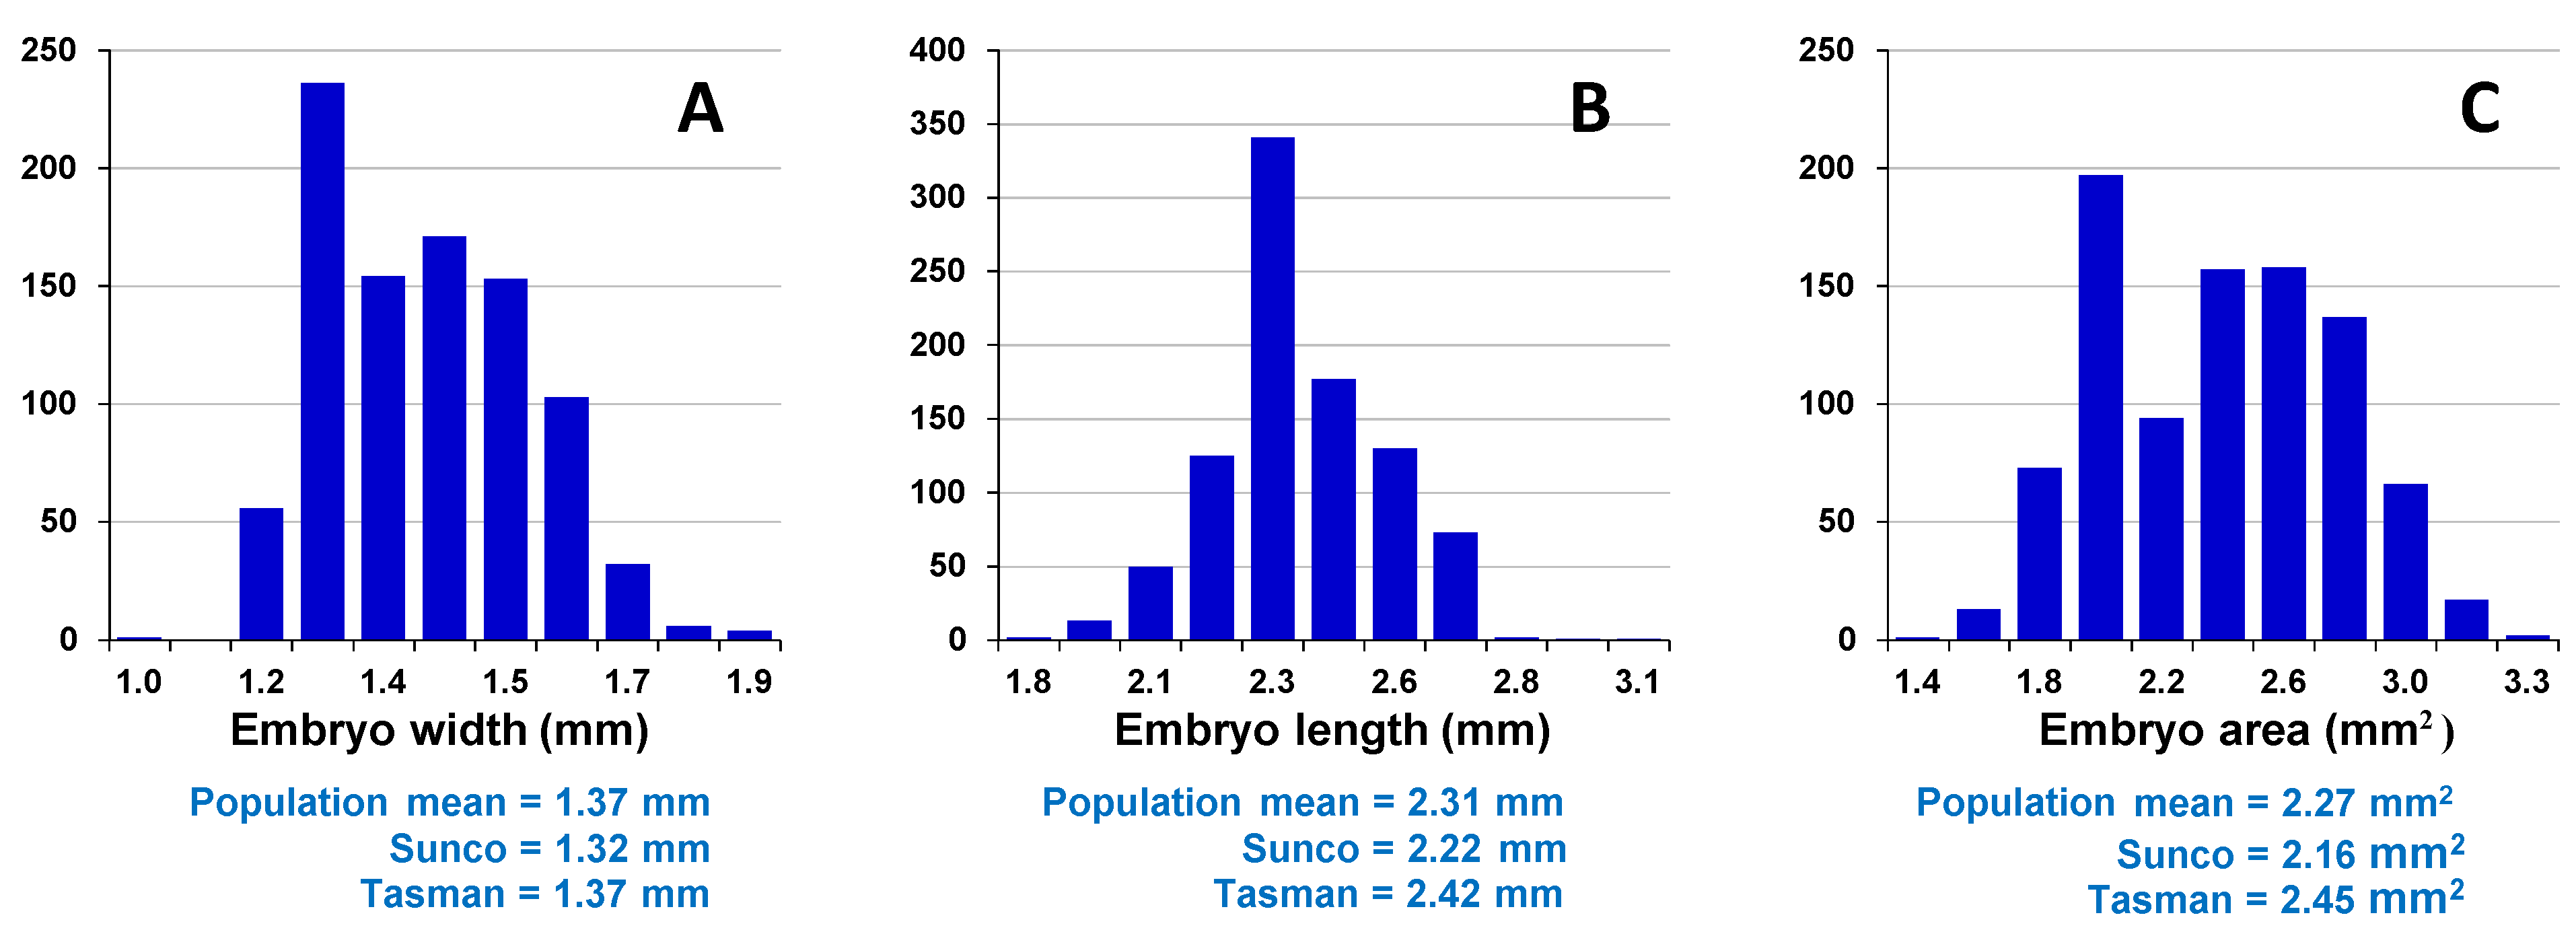
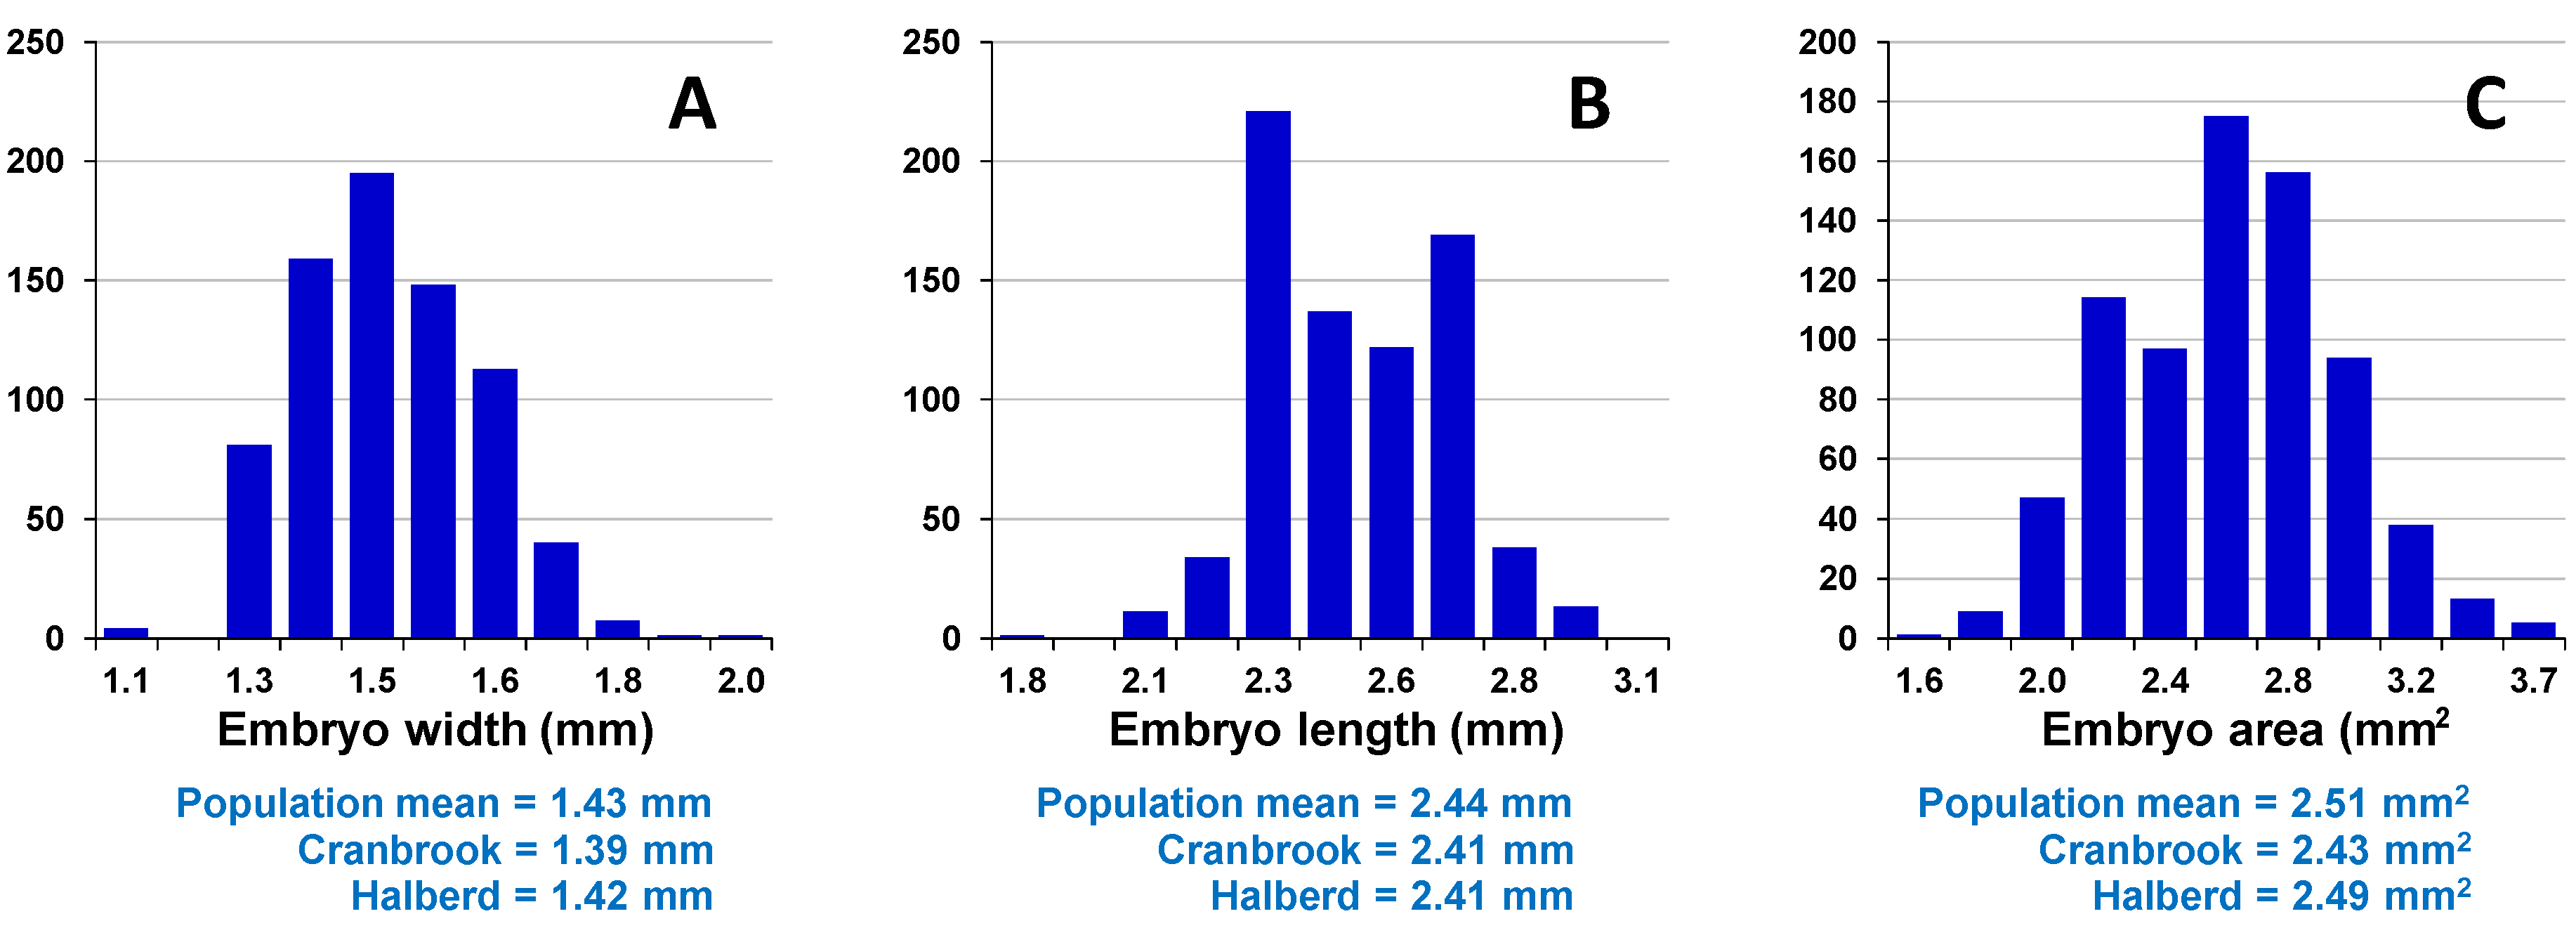
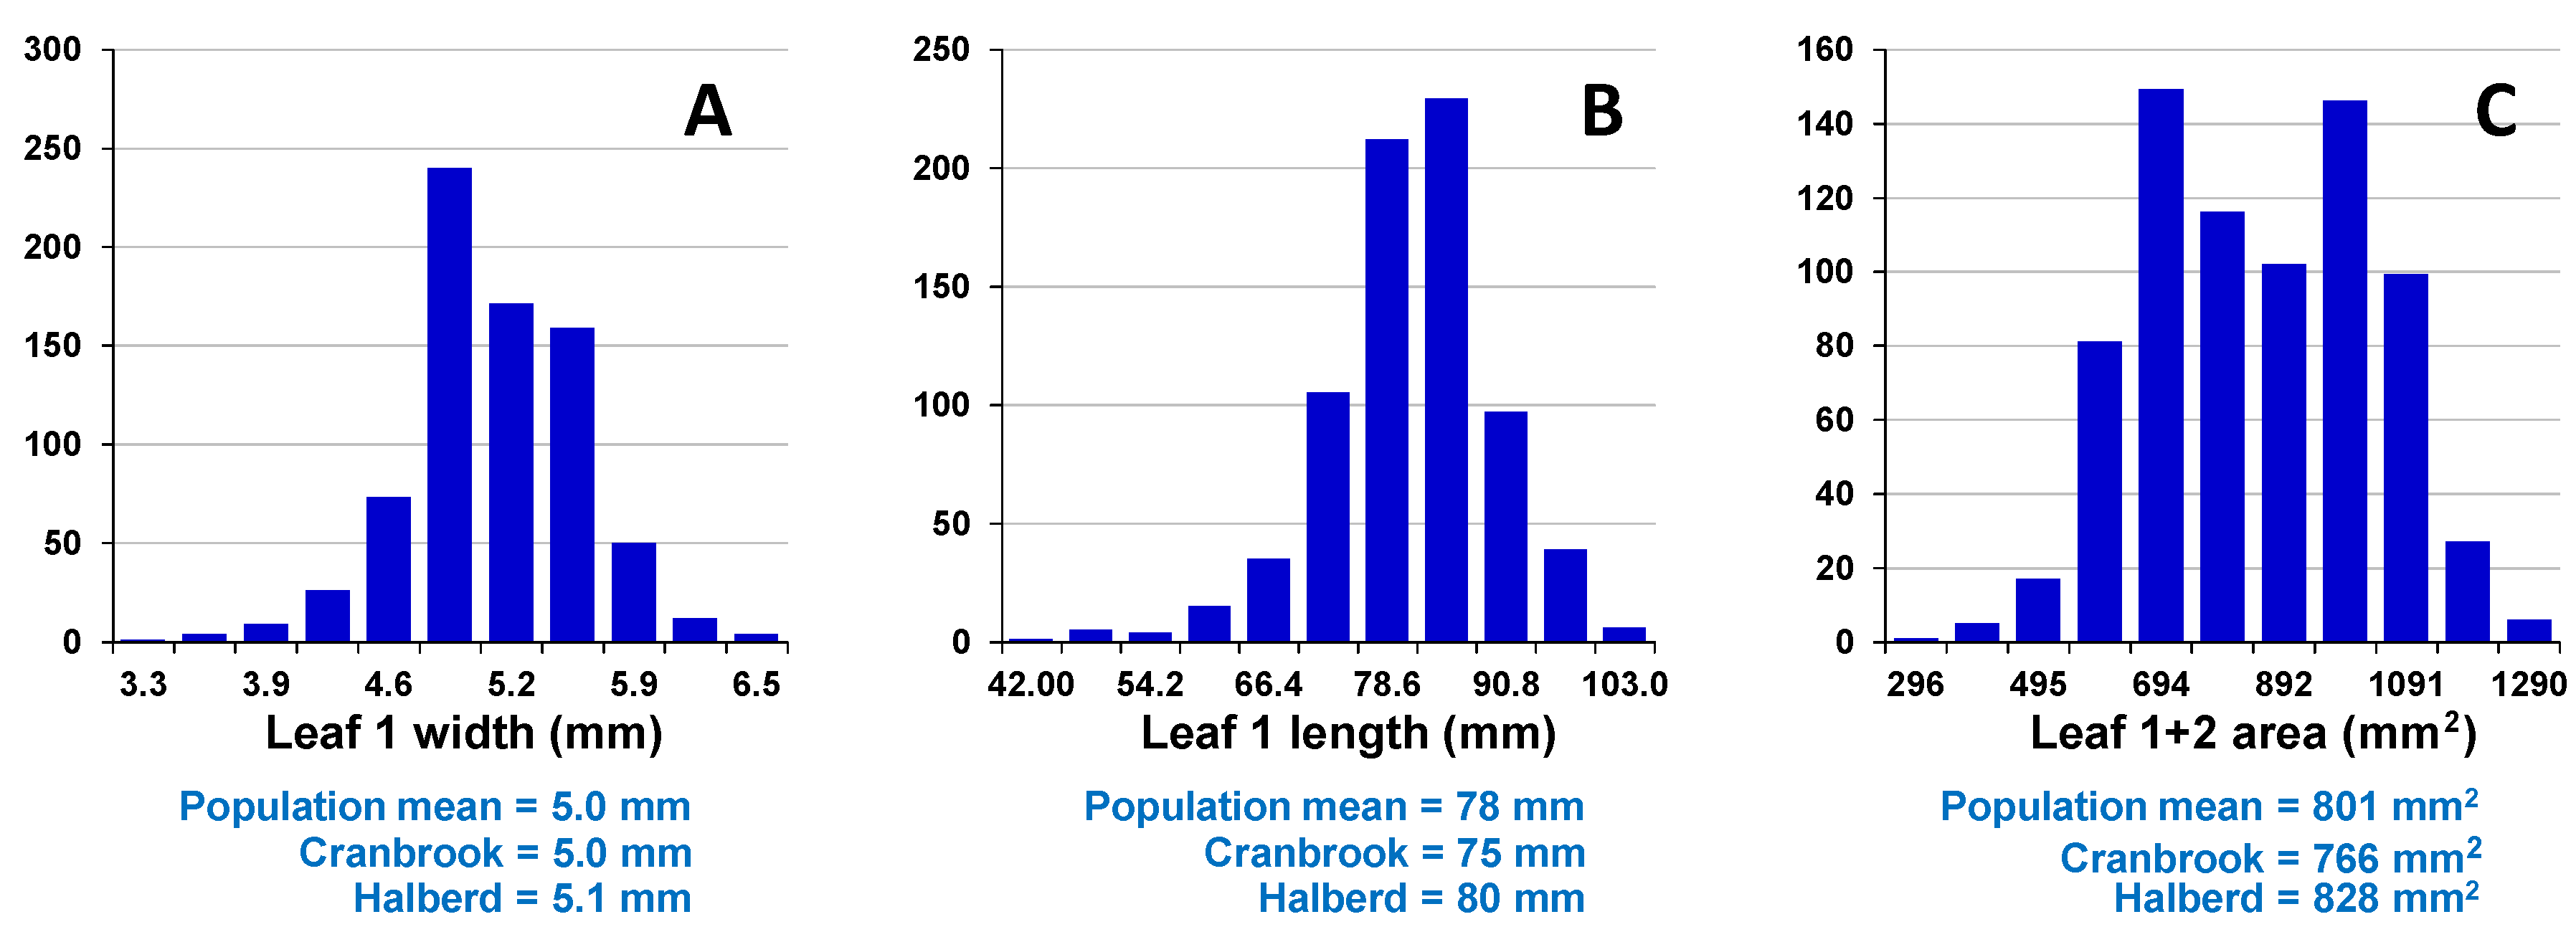
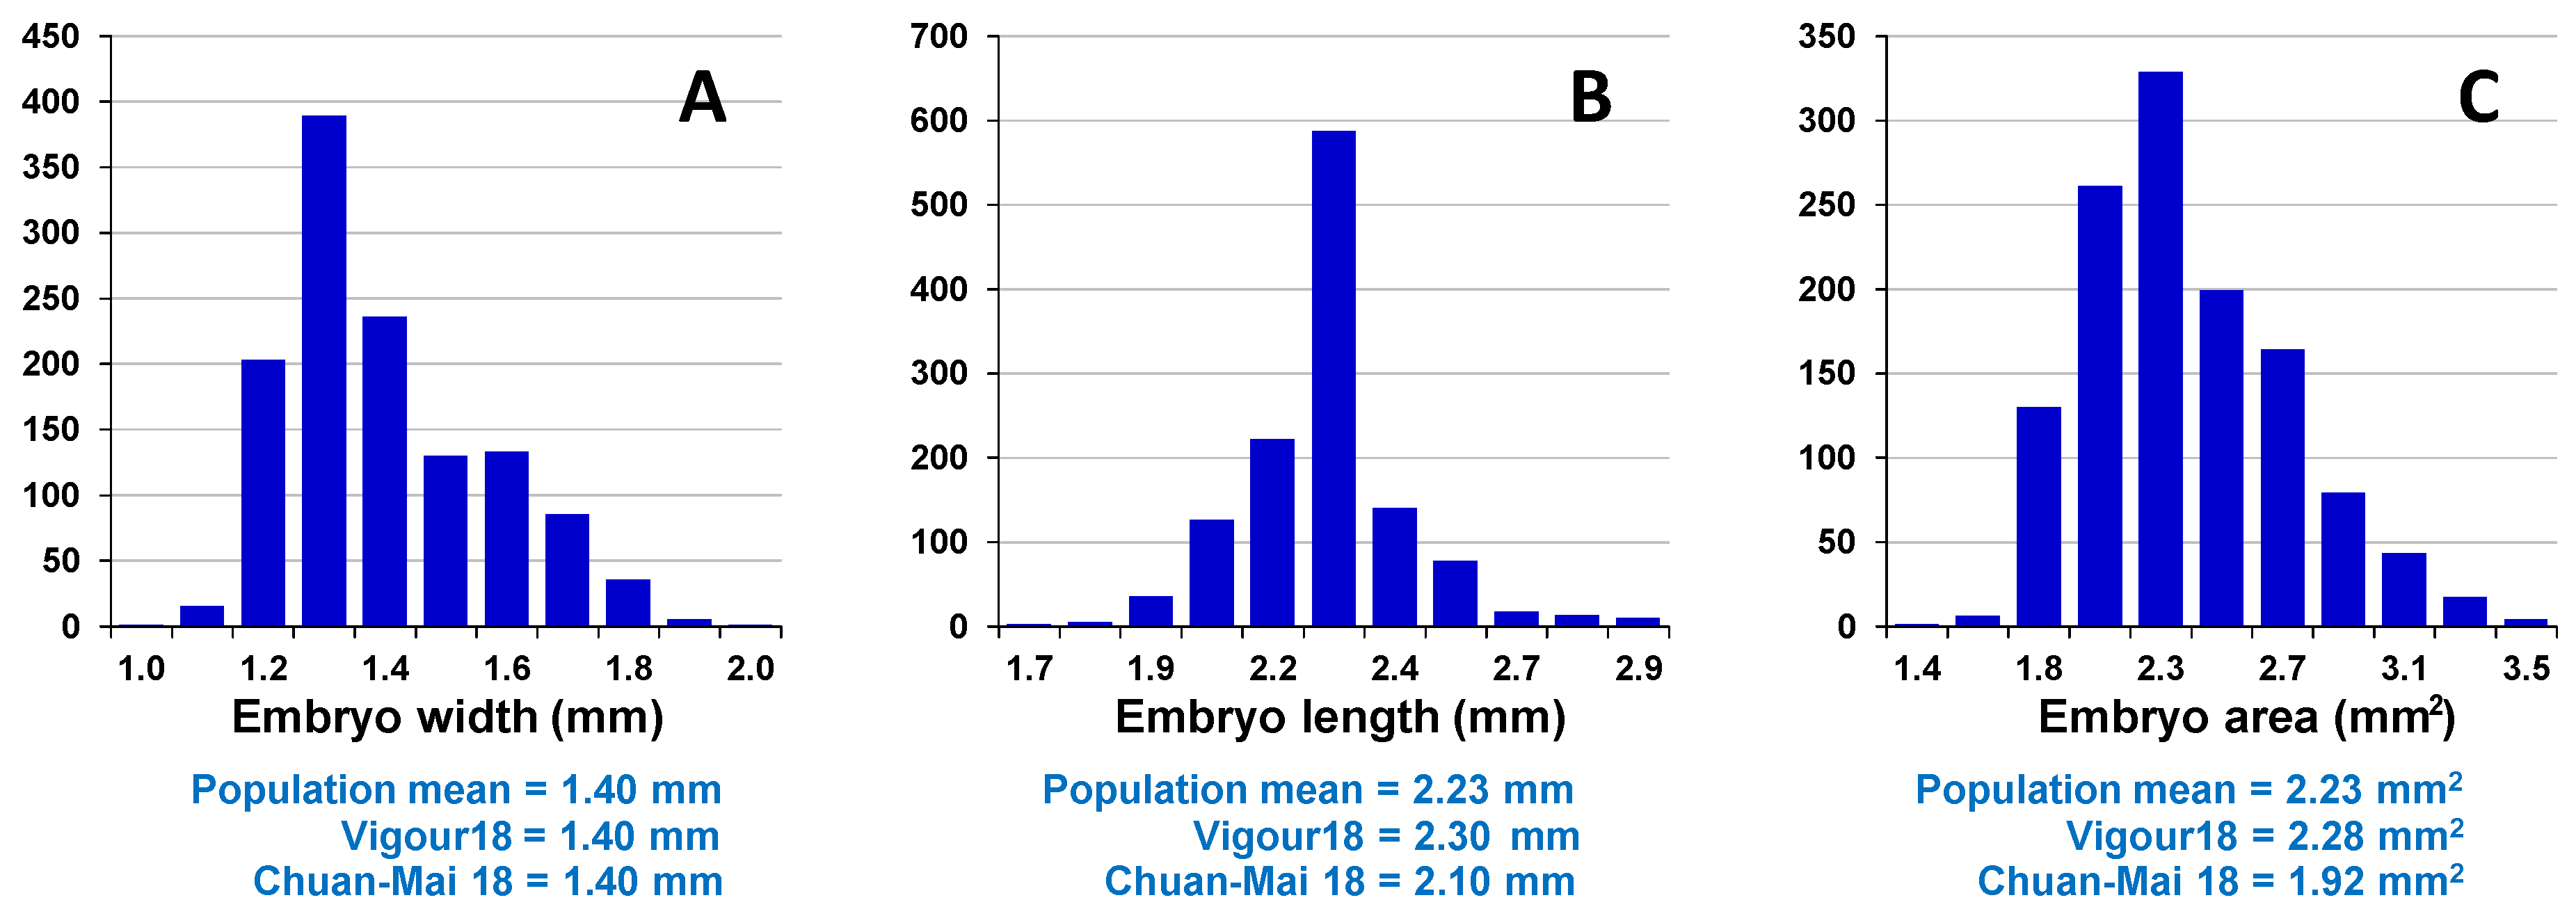
Assessment of embryo size and early vigour will be reported on a population basis. The QTL analyses on the Sunco/Tasman and Cranbrook/Halberd populations will then be discussed separately.
2.2. QTL Analyses
The chromosomal locations identified from the QTL analysis of embryo size and early vigour traits are shown for the Sunco/Tasman and Cranbrook/Halberd populations in
Figure 7 and
Table 8, respectively. Allelic effects and chromosomal location are given in
Table 7,
Table 8 and
Table 9. It is important to note that although several publications have reported QTL for traits related to early vigour (e.g., [
29,
30,
31,
32,
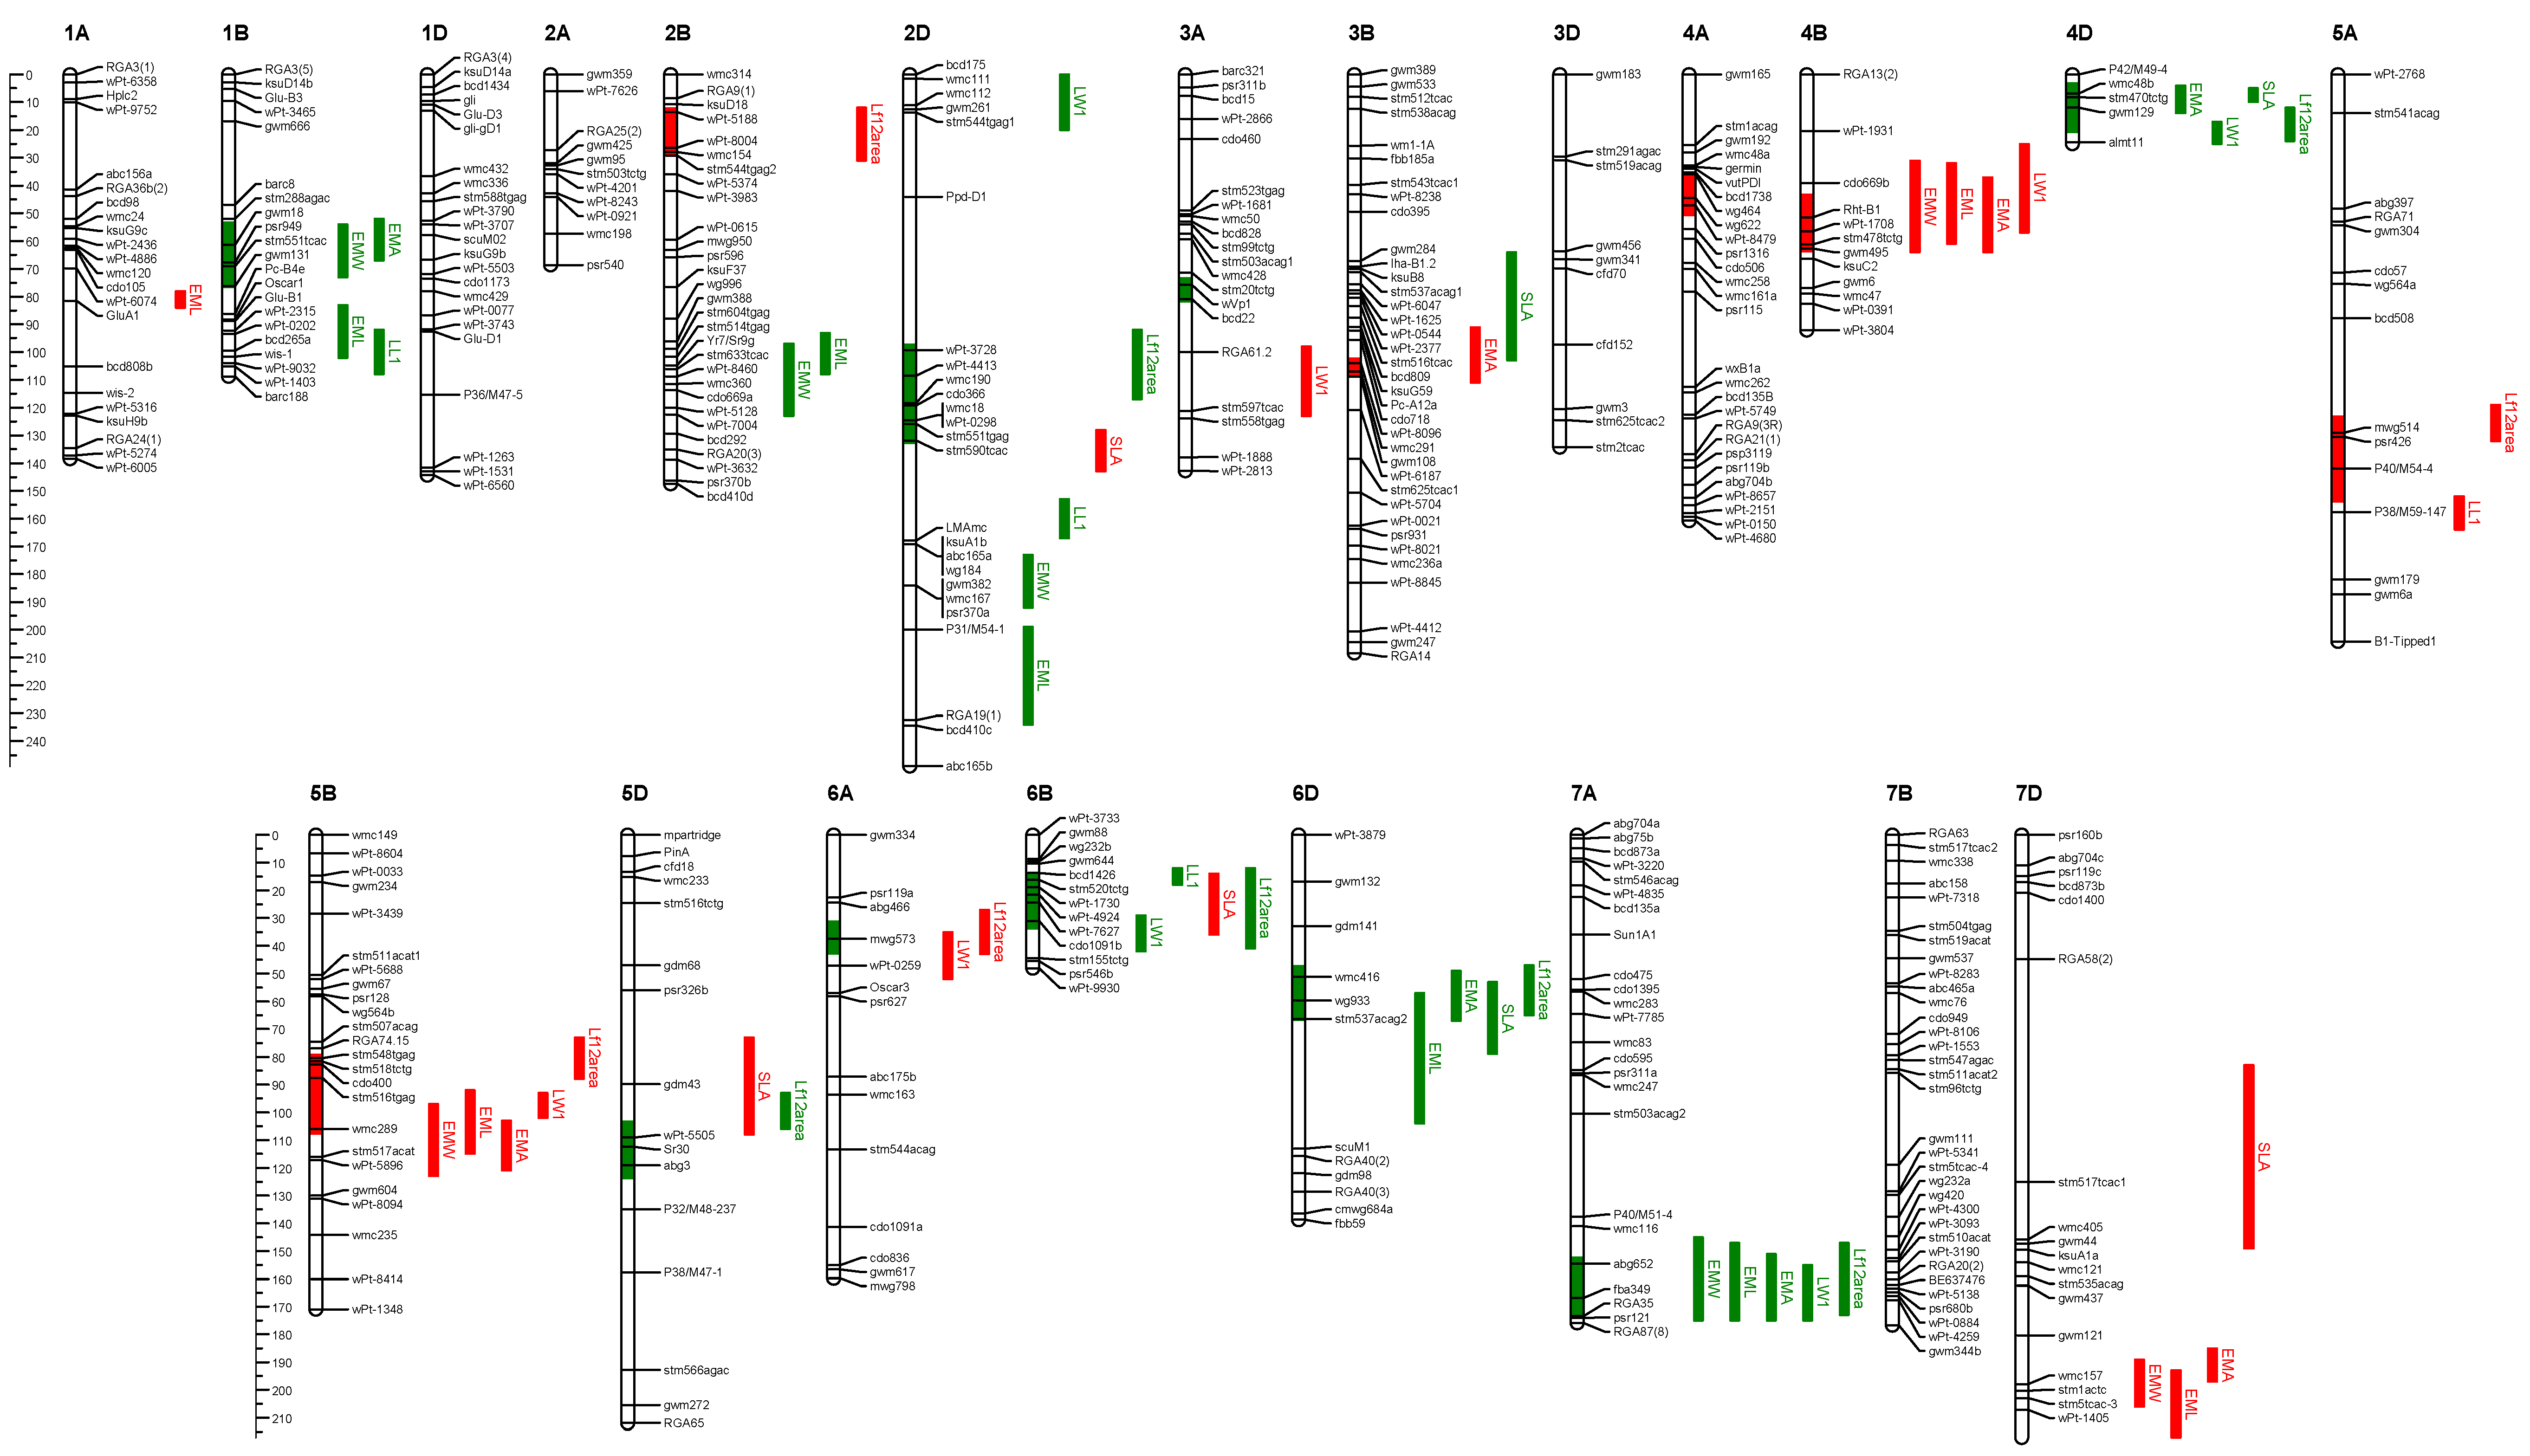
33]), to date there have been no QTL reported for embryo size in wheat. The QTL shown in green indicate the first parent (e.g., Sunco or Cranbrook) contributes a positive allele (e.g., increased embryo width) while a red QTL indicates the first parent contributes a negative allele (e.g., reduced embryo width) at the designated QTL.
Numerous QTL were identified for embryo size and early vigour in the Sunco/Tasman population (
Figure 7). For example, Sunco contributes positive alleles for embryo size QTL on chromosomes 1B, 4D, 5A, 5D, 6B and 7D. Positive genetic effects for embryo area were located on chromosomes 1B, 5A, 5D and 7D (
Table 9). Embryo size QTL with negative Sunco genetic effects (
i.e., positive genetic effects from Tasman) were identified on chromosomes 1A, 2A, 2B, 3B, 4A, 4B and 7B, and embryo area on chromosomes 2B and 4A. Key alleles for early vigour (total leaf area) with positive effect contributed by Sunco were located on chromosomes 1B, 3B, 4D, 5A and 7D. Alleles of significant positive effect contributed by the Tasman parent were identified on chromosomes 1A, 2B, 4B, 5B and 6B. A number of the embryo area QTL co-located with component measures of embryo width and/or length (
Figure 7). These were most obvious on chromosome 1B, 2B and 7D.
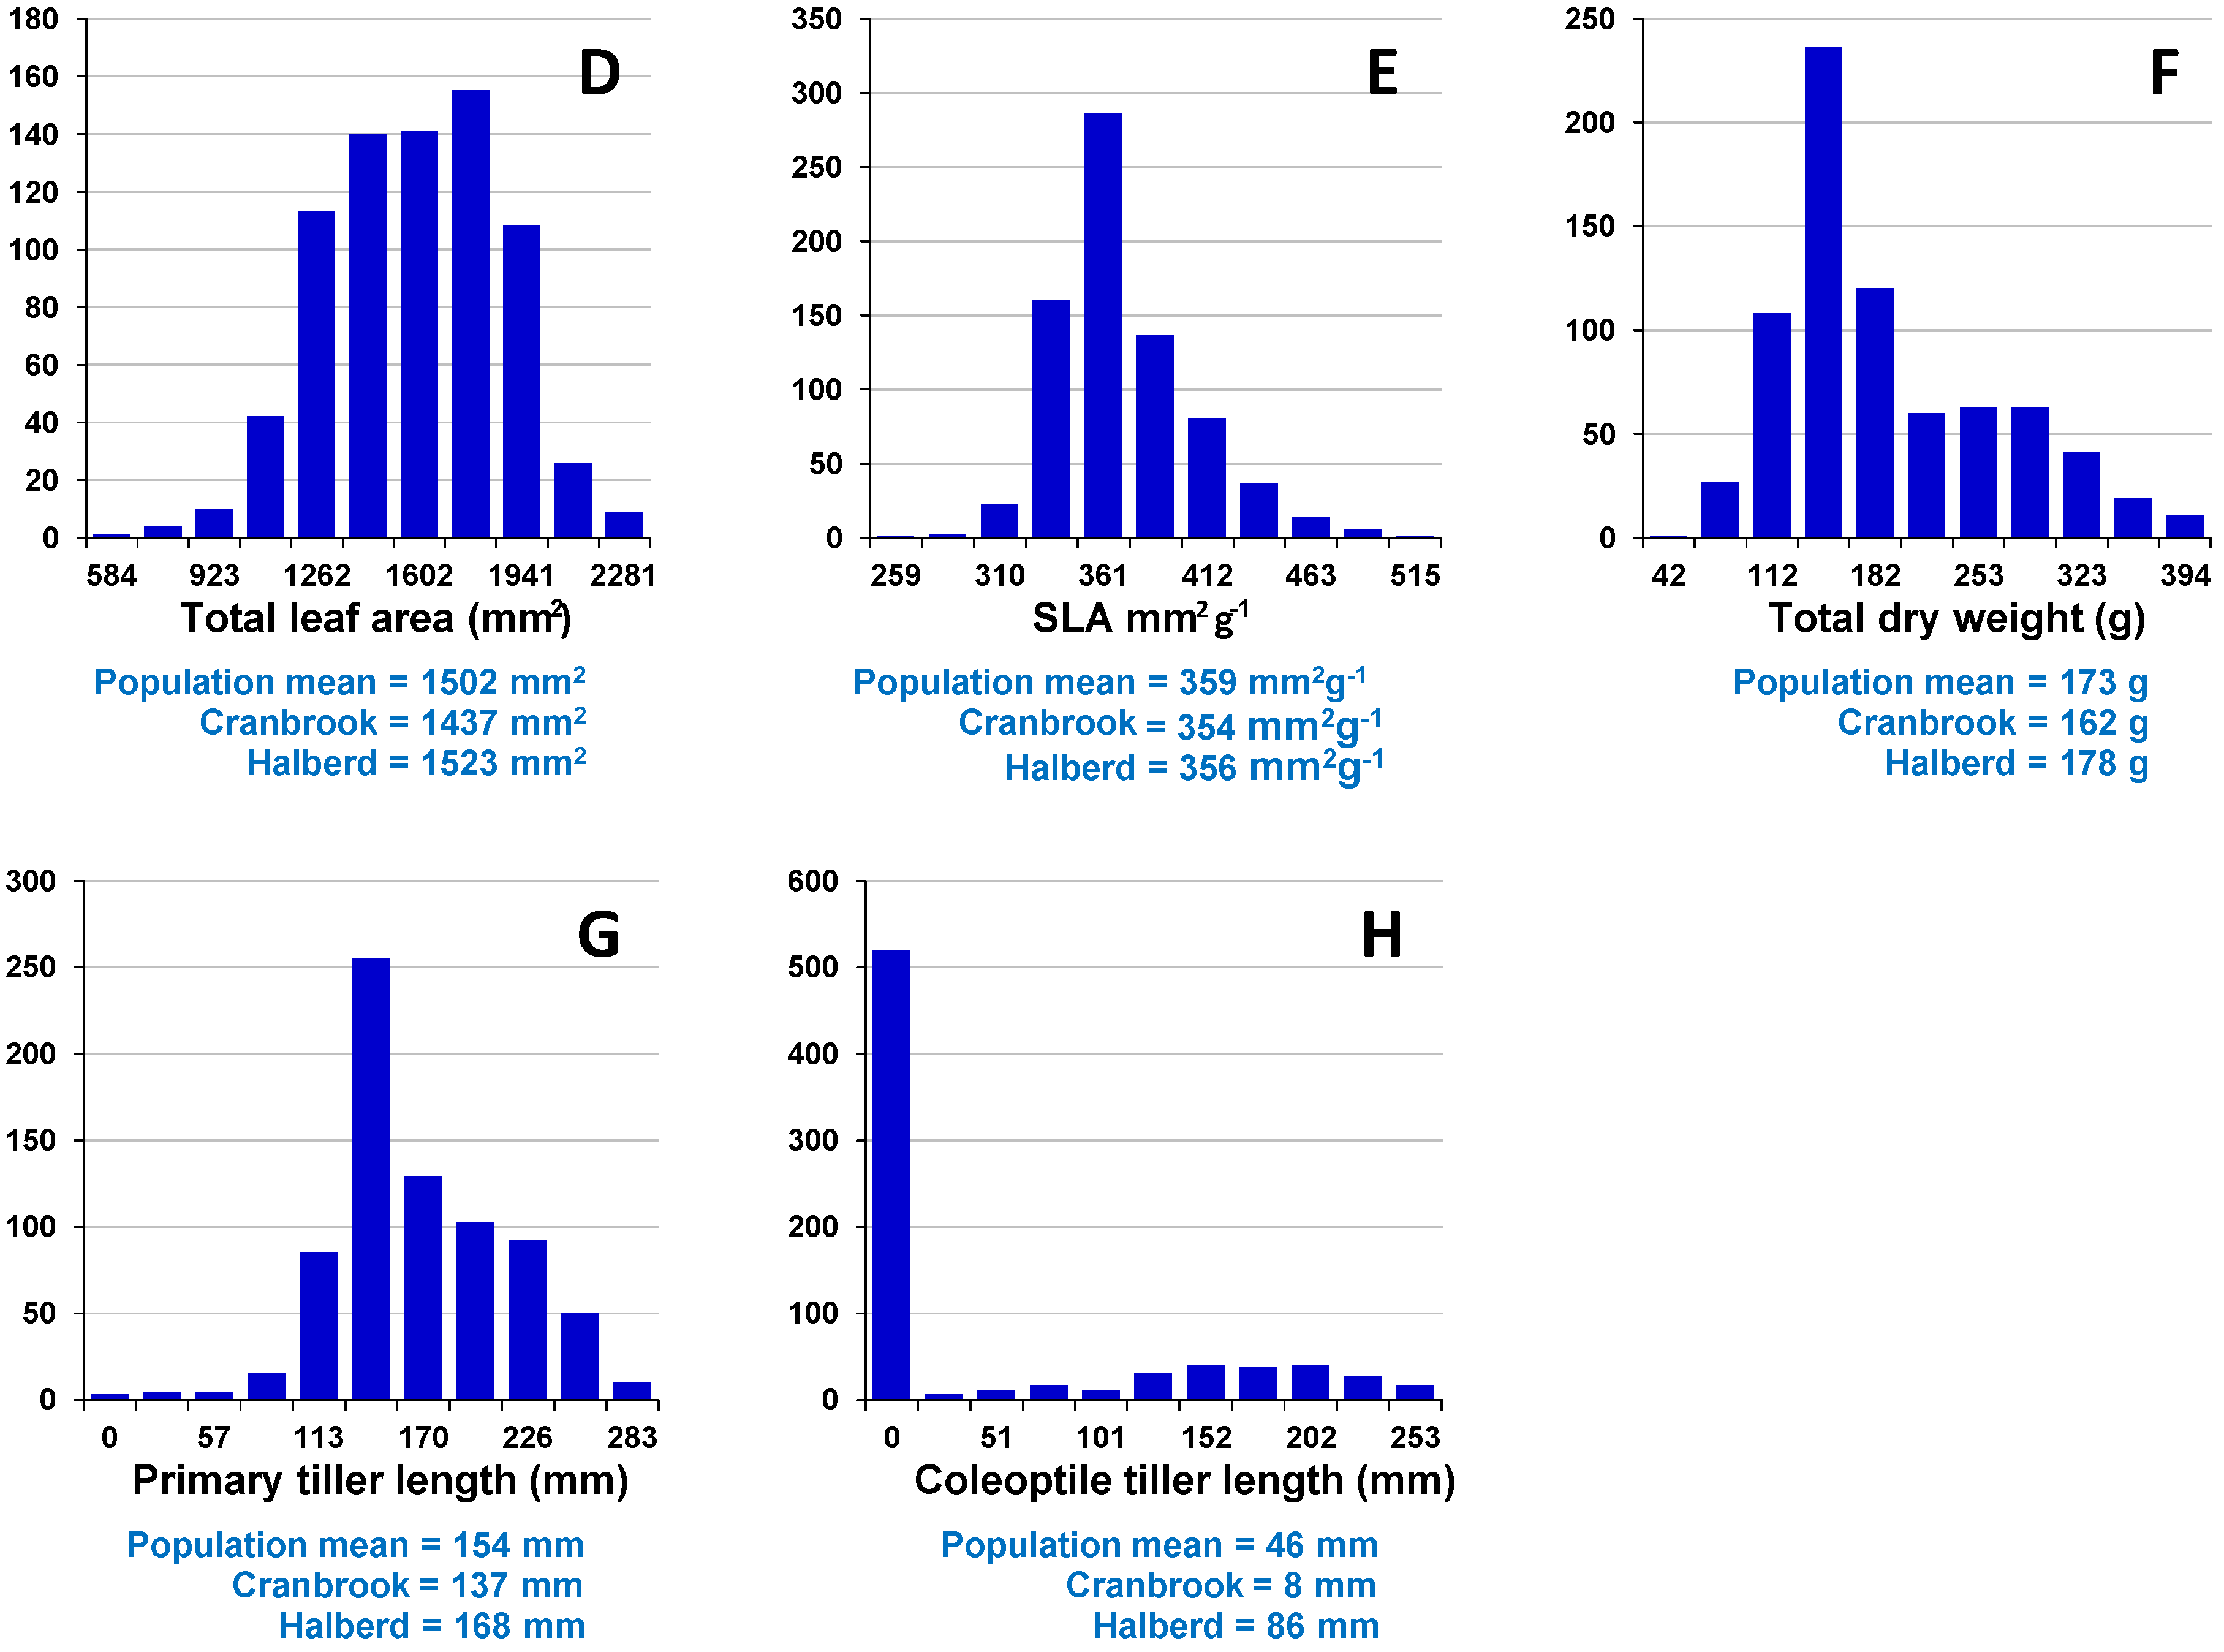
In the Cranbrook/Halberd population, the embryo size QTL of positive genetic effect from parent Cranbrook were identified on chromosomes 1B, 2B, 2D, 4D, 6D, 7A and 7D (
Figure 8), and embryo area on chromosomes 1B, 4D, 6D, 7A and 7D (
Table 9). The QTL of negative genetic effect (positive effects from Halberd) were located on chromosomes 1A, 3B, 4B, 5B and 7D, and embryo area on 3B, 4B and 5B (
Table 9). Cranbrook alleles of positive genetic effect for early vigour were identified on chromosomes 1B, 2D, 4D, 5D, 6B, 6D and 7A (
Table 7). Important positive alleles contributed by Halberd in this population were identified on chromosomes 2B, 4A, 4B, 5A, 5B and 6A. As for the Sunco/Tasman population above, embryo width and length QTL co-located with genomic regions for embryo area on chromosomes 1B, 4B, 5B, 7A and 7D (
Figure 8).
In many cases, positive QTL for total leaf area were co-located with increased embryo and leaf width (
cf. Table 7,
Table 8 and
Table 9). This was evident for chromosome 1B and 7D where the Sunco parent contributed alleles for increased leaf area and both larger embryo and leaf one width. Equally, for Cranbrook on chromosomes 4B and 5B, and Halberd on chromosomes 4D and 7A. The Tasman allele co-locating leaf area, embryo size and leaf one width on chromosome 2B in the Sunco/Tasman population represents a
T. timopheevi translocation inherited from Sunco.
It is noteworthy that common chromosomal regions were apparent across populations for total leaf area (chromosome 1B, 2B, 4B and 6B), leaf one width (3A, 4B, 5B and 6B) and embryo dimensions (1B, 2B, 4B and 7D) (
Figure 7 and
Figure 8).
Table 7.
Estimated additive (a) genetic effect, percent phenotypic variance, and chromosomal location of QTL for total leaf area measured on random doubled-haploid progenies from the Sunco/Tasman and Cranbrook/Halberd bread wheat populations evaluated across multiple sowings in favourable conditions. Positive additive effects indicate that the first parent allele (e.g., Cranbrook or Sunco) increases the value of the trait.
| Chromosome A | Nearest Marker | QTL Position (cM) | a Genetic Effect B (mm2) | % Phenotypic Variance |
|---|
| Sunco/Tasman |
| 1AS | bcd808 | 41.3 | −17.3 ¶ | 4 |
| 1BL | gwm11 | 83.2 | 53.4 ** | 8 |
| 2BS | wmc35a | 54.1 | −161.1 ** | 18 QE |
| 3BS | gwm566 | 57.3 | 27.2 * | 4 |
| 4BS | Rht-B1 | 14.6 | −11.6 ¶ | 3 |
| 4DS | Rht-D1 | 2.9 | 44.5 * | 5 QE |
| 5AS | gwm443 | 7.4 | 59.1 ** | 7 QE |
| 5BS | psr167 | 2.8 | −54.7 ** | 7 |
| 6BS | gwm644 | 11.7 | −38.7 * | 4 |
| 7DS | gwm295 | 21.1 | 64.8 ** | 9 |
| Cranbrook/Halberd |
| 1BL | gwm18 | 61.3 | 35.5 ¶ | 2 |
| 2BS | wPt-8004 | 29.9 | −68.7 ** | 4 |
| 2DL | cdo366 | 104.1 | 157.7 ** | 9 |
| 4AS | wg622 | 46.1 | −59.0 * | 4 |
| 4BS | gwm6 | 79.2 | −49.3 ¶ | 3 |
| 4DS | almt11 | 21.1 | 53.2 * | 3 |
| 5AL | mwg514 | 121.7 | −133.4 ** | 8 QE |
| 5BS | stm518tctg | 85.4 | −43.2 ¶ | 2 QE |
| 5DS | wPt-5505 | 100.4 | 109.5 ** | 7 |
| 6AS | mwg573 | 34.1 | −134.8 ** | 8 QE |
| 6BS | bcd1426 | 14.3 | 87.4 ** | 5 QE |
| 6DS | wg933 | 56.4 | 97.1 ** | 6 QE |
| 7AL | rga35 | 195.4 | 101.5 ** | 6 |
Table 8.
Estimated additive (a) genetic effect, percent phenotypic variance, and chromosomal location of QTL for leaf one width measured on random doubled-haploid progenies from the Sunco/Tasman and Cranbrook/Halberd bread wheat populations evaluated across multiple sowings in favourable conditions. Positive additive effects indicate that the first parent allele (e.g., Cranbrook or Sunco) increases the value of the trait.
| Chromosome A | Nearest Marker | QTL Position (cM) | a Genetic Effect B (mm) | % Phenotypic Variance |
|---|
| Sunco/Tasman |
| 1AS | glu-A1 | 26.0 | −0.09 ** | 4 |
| 1BL | gwm11 | 83.9 | 0.09 ** | 5 |
| 2AS | gwm588 | 6.9 | −0.07 ** | 4 QE |
| 2BS | wmc35a | 54.0 | −0.32 ** | 14 |
| 2DS | wmc190 | 64.7 | −0.12 ** | 6 |
| 3AL | P39-M50-152 | 87.2 | 0.10 | 5 |
| 4AS | wg232a | 42.3 | 0.07 * | 3 |
| 4BS | Rht-B1 | 12.0 | −0.06 * | 3 |
| 4DS | Rht-D1 | 3.7 | 0.09 ** | 5 |
| 5AL | wg232c | 90.1 | −0.06 * | 3 |
| 5BS | P36-M40-1 | 24.2 | −0.05 * | 3 |
| 6BS | gwm626 | 12.1 | −0.05 * | 3 |
| 7DS | gwm295 | 0.0 | 0.04 * | 3 |
| Cranbrook/Halberd |
| 2DS | gwm261 | 14.2 | 0.09 * | 5 |
| 3AL | rga61.2 | 113.7 | −0.15 ** | 11 QE |
| 3DL | cfd70 | 88.2 | 0.11 * | 8 QE |
| 4BS | Rht-B1 | 64.1 | −0.07 ¶ | 4 |
| 4DL | almt11 | 20.7 | 0.11 * | 5 |
| 5BL | cdo400 | 95.1 | −0.12 ** | 9 |
| 6AS | mwg573 | 39.1 | −0.18 ** | 14 QE |
| 6BS | cdo1091b | 37.1 | 0.12 * | 9 |
| 7AL | rga35 | 197.3 | 0.17 ** | 13 |
Table 9.
Estimated additive (a) genetic effect, percent phenotypic variance, and chromosomal location of QTL for embryo area measured on random doubled-haploid progenies from the Sunco/Tasman and Cranbrook/Halberd bread wheat populations evaluated across multiple sowings in favourable conditions. Positive additive effects indicate that the first parent allele (e.g., Cranbrook or Sunco) increases the value of the trait.
| Chromosome A | Nearest Marker | QTL Position (cM) | a Genetic Effect B (mm2) | % Phenotypic Variance |
|---|
| Sunco/Tasman |
| 1BL | gwm11 | 93.2 | 0.53 ** | 8 |
| 2BS | wmc35a | 54.1 | −1.61 ** | 18 |
| 4AS | gwm610 | 17.3 | −0.27 * | 4 |
| 5AS | gwm443 | 7.4 | 0.59 ** | 7 |
| 5DS | gwm190 | 2.8 | 0.55 ** | 7 |
| 7DS | gwm295 | 4.7 | 0.39 * | 4 |
| Cranbrook/Halberd |
| 1BL | gwm18 | 59.7 | 1.10 ** | 8 |
| 3BL | ksug59 | 96.1 | −0.81 * | 6 |
| 4BS | cdo669b | 47.3 | −0.92 ** | 7 |
| 4DS | wmc48b | 6.7 | 0.51 * | 4 |
| 5BL | wmc289 | 115.9 | −0.90 ** | 7 |
| 6DS | wmc416 | 53.1 | 1.22 ** | 11 |
| 7AL | psr121 | 173.4 | 0.93 ** | 7 |
| 7DS | wmc157 | 193.4 | 0.41 ¶ | 4 |
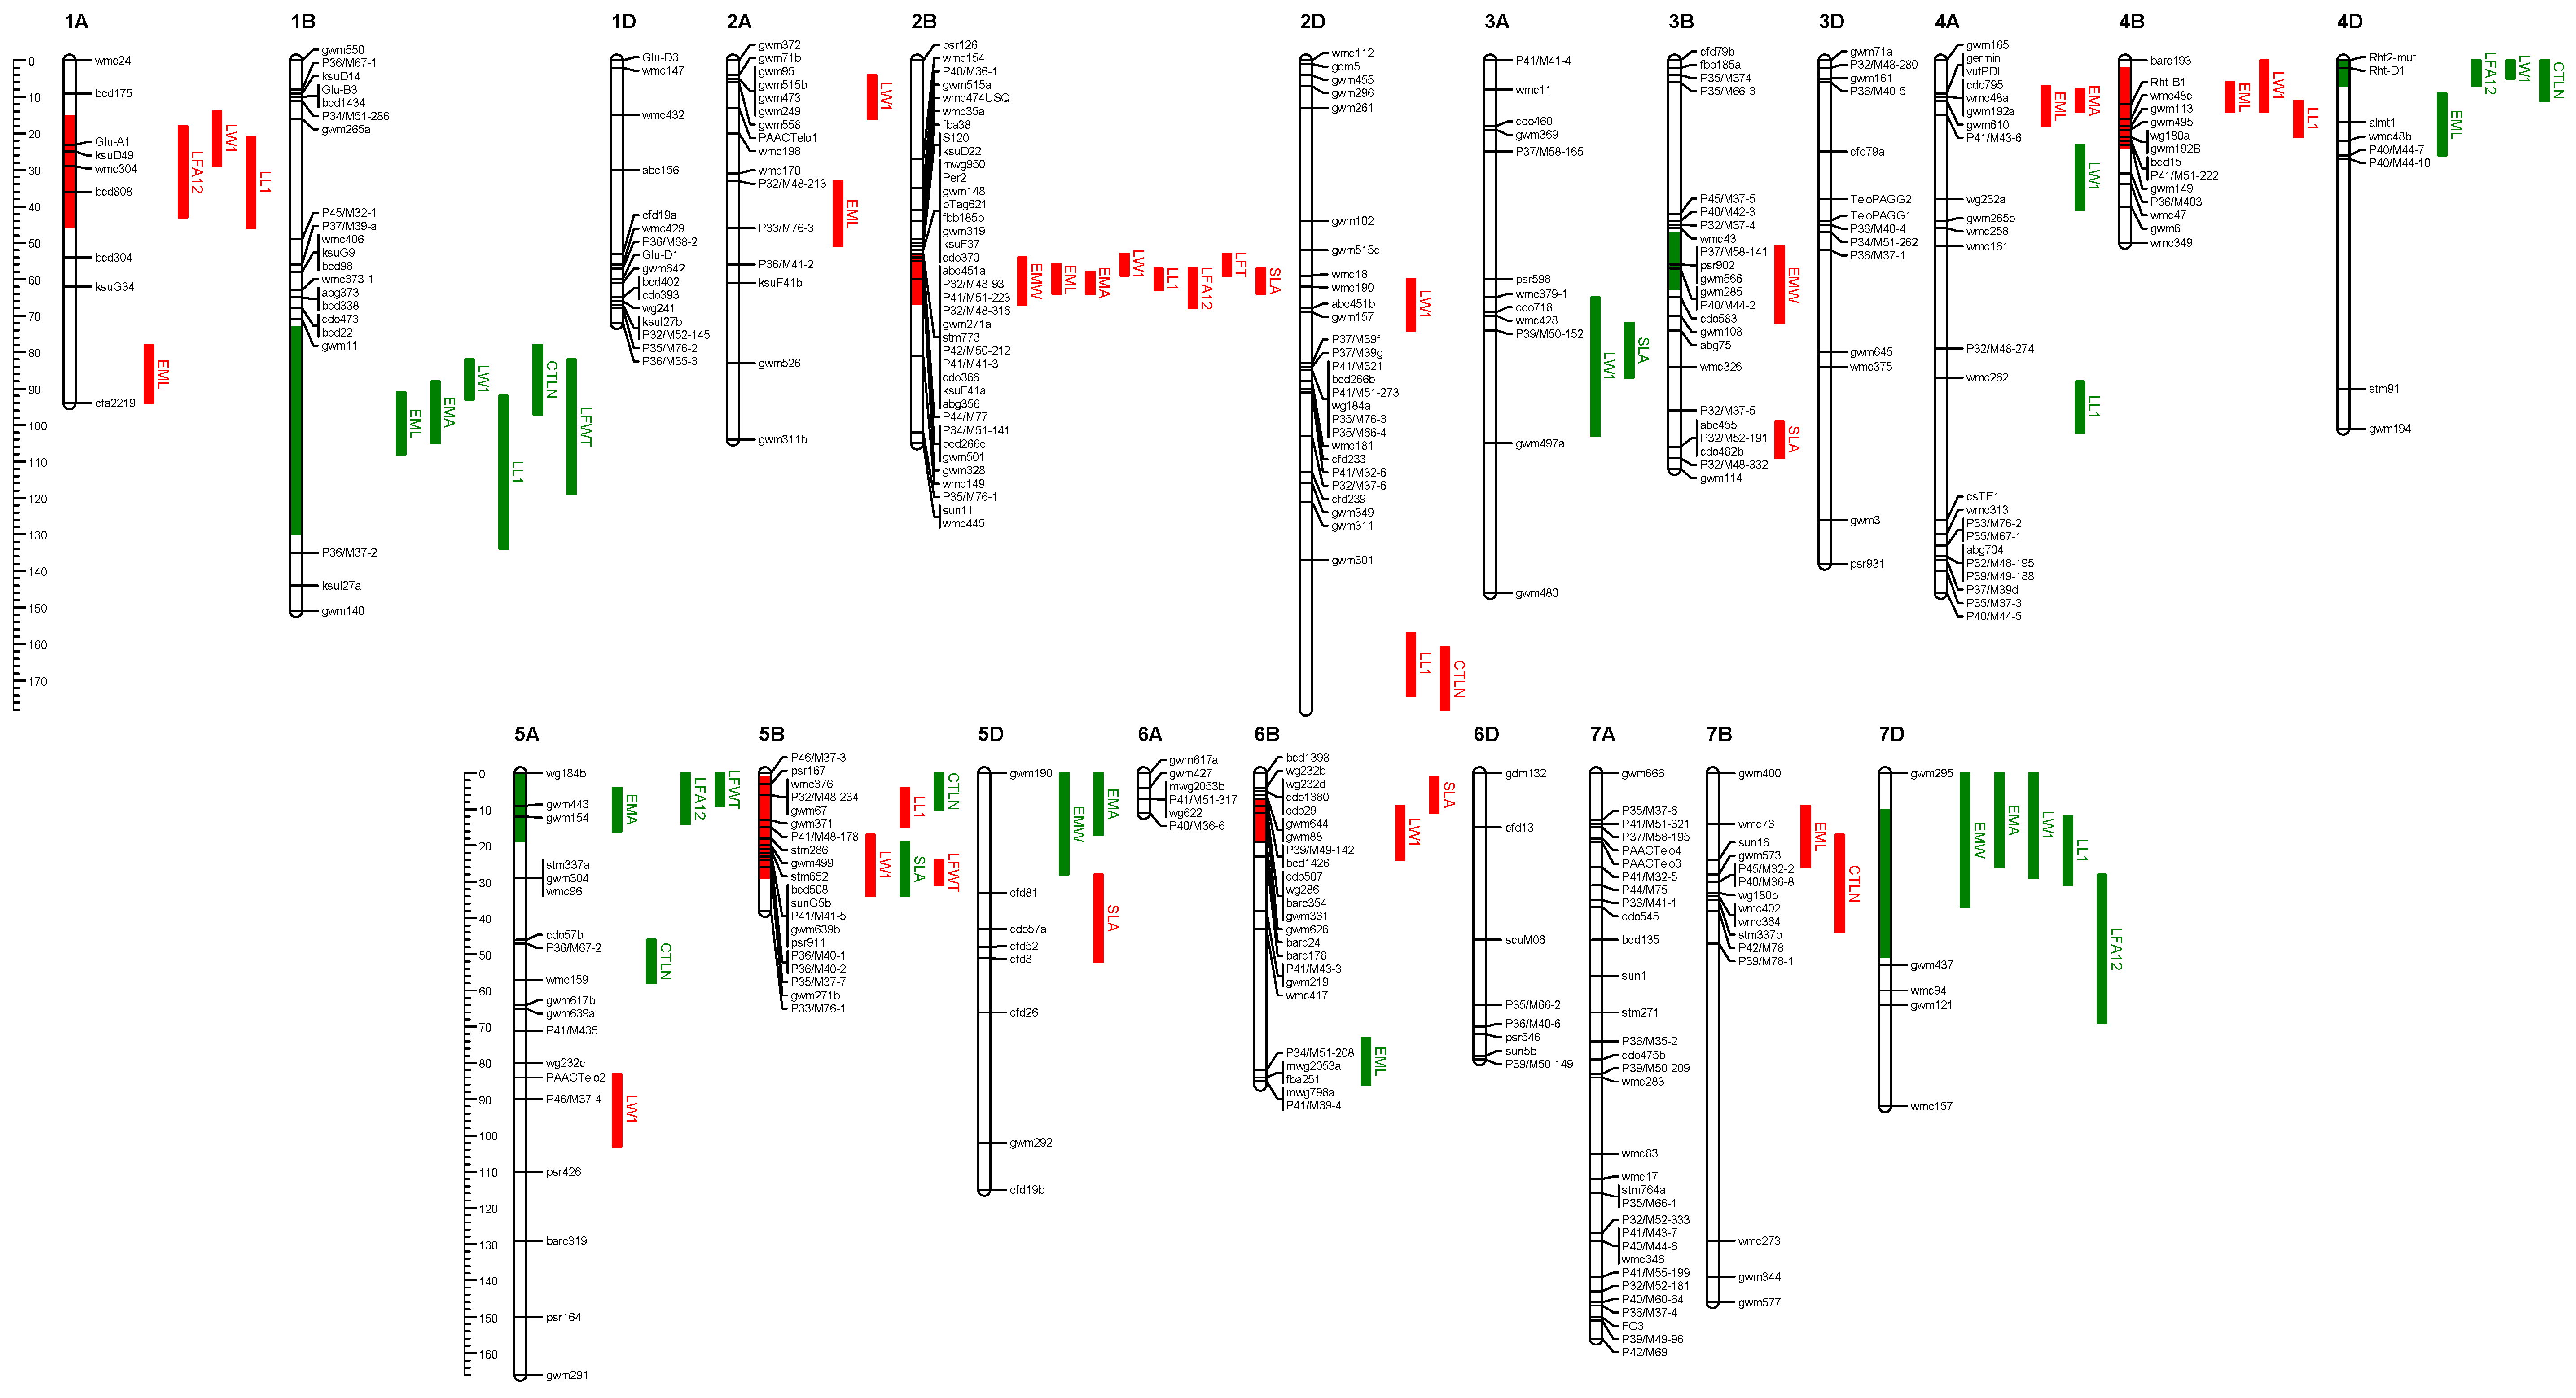
Figure 7.
Chromosomal locations of QTL for embryo size and early vigour from the Sunco/Tasman bread wheat mapping population. QTL are indicated to the right of the linkage group, and the coloured bars indicate significant (p = 0.01) QTL. Red and green colouring indicates negative and positive genetic effects respectively from the Sunco parent. QTL located on the chromosomes represent total leaf area. Other traits illustrated are: EMA = embryo area; EML = embryo length; EMW = embryo width; SLA = specific leaf area; LW1 = Leaf one width; LL1 = Leaf one length; LFA12 = leaf 1 + 2 area; LFWT = total leaf weight; CTLN = coleoptile tiller length.
Figure 8.
Chromosomal locations of QTL for embryo size and early vigour from the Cranbrook/Halberd bread wheat mapping population. QTL are indicated to the right of the linkage group, and the coloured bars indicate significant (p = 0.01) QTL. Red and green colouring indicates negative and positive genetic effects respectively from the Cranbrook parent. QTL located on the chromosomes represent total leaf area. Other traits illustrated are: EMA = embryo area; EML = embryo length; EMW = embryo width; SLA = specific leaf area; LW1 = Leaf one width; LL1 = Leaf one length; LF12Area = leaf 1 + 2 area; LFWT = total leaf weight; CTLN = coleoptile tiller length.


