Comparative Evaluation of Common Savannahgrass on a Range of Soils Subjected to Different Stresses I: Productivity and Quality

Abstract
:1. Introduction
2. Materials and Methods

| Series | USDA Soil Taxonomy | Organic Matter | Clay | Sand | Silt | pH | Dry Bulk Density † |
|---|---|---|---|---|---|---|---|
 % %  | mg/m3 | ||||||
| Talparo | Aquentic Chromuderts | 1.8 | 67.0 | 5.0 | 28.0 | 4.2 | 1.09 (1.25) |
| Princes Town | Aquentic Chromuderts | 2.7 | 68.3 | 5.0 | 26.7 | 6.8 | 1.06 (1.21) |
| River Estate | Fluventic Eutropepts | 1.5 | 17.6 | 16.9 | 65.5 | 5.7 | 1.16 (1.31) |
| Piarco | Aquoxic Tropudults | 1.2 | 8.0 | 51.0 | 41.0 | 3.8 | 1.28 (1.38) |
2.1. Statistical Analysis
3. Results and Discussion
| Source of Variation | Clipping Yield | Chlorophyll Index | Visual Quality |
|---|---|---|---|
| Soil | 25.83 *** | 1.76 | 7.73 ** |
| Grass | 88.06 *** | 323.26 *** | 476.54 *** |
| Sand | 14.31 ** | 1.71 | 32.11 *** |
| Stress | 275.54 *** | 259.58 *** | 1,753.22 *** |
| Soil × Grass | 2.87 * | 0.69 | 4.46 ** |
| Soil × Sand | 10.80 *** | 1.76 | 5.45 ** |
| Grass × Sand | 1.76 | 2.26 | 58.81 *** |
| Soil × Stress | 2.96 * | 4.05 ** | 15.29 *** |
| Grass × Stress | 7.03 *** | 17.20 *** | 151.30 *** |
| Sand × Stress | 1.29 | 6.96 ** | 2.83 |
| Soil × Grass × Sand | 2.24 | 1.11 | 3.54 * |
| Soil × Grass × Stress | 2.06 | 2.32 * | 2.44 * |
| Soil × Sand × Stress | 0.77 | 1.81 | 2.24 * |
| Grass × Sand × Stress | 1.17 | 5.62 ** | 5.91 ** |
| Time | 51.63 *** | 229.50 *** | 615.34 *** |
| Time × Soil | 3.09 *** | 1.30 | 2.76 ** |
| Time × Grass | 20.14 *** | 68.24 *** | 48.46 *** |
| Time × Sand | 2.24 * | 1.94 | 3.37 ** |
| Time × Stress | 26.29 *** | 15.86 *** | 37.55 *** |
| Time × Soil × Grass | 2.35 *** | 0.98 | 2.39 *** |
| Time × Soil × Sand | 1.32 | 0.73 | 0.61 |
| Time × Soil × Stress | 1.35 | 1.14 | 1.38 |
| Time × Grass × Sand | 2.14 * | 1.64 | 4.51 *** |
| Time × Grass × Stress | 6.03 *** | 5.39 *** | 5.74 *** |
| Time × Sand × Stress | 0.99 | 2.83 ** | 2.02 * |
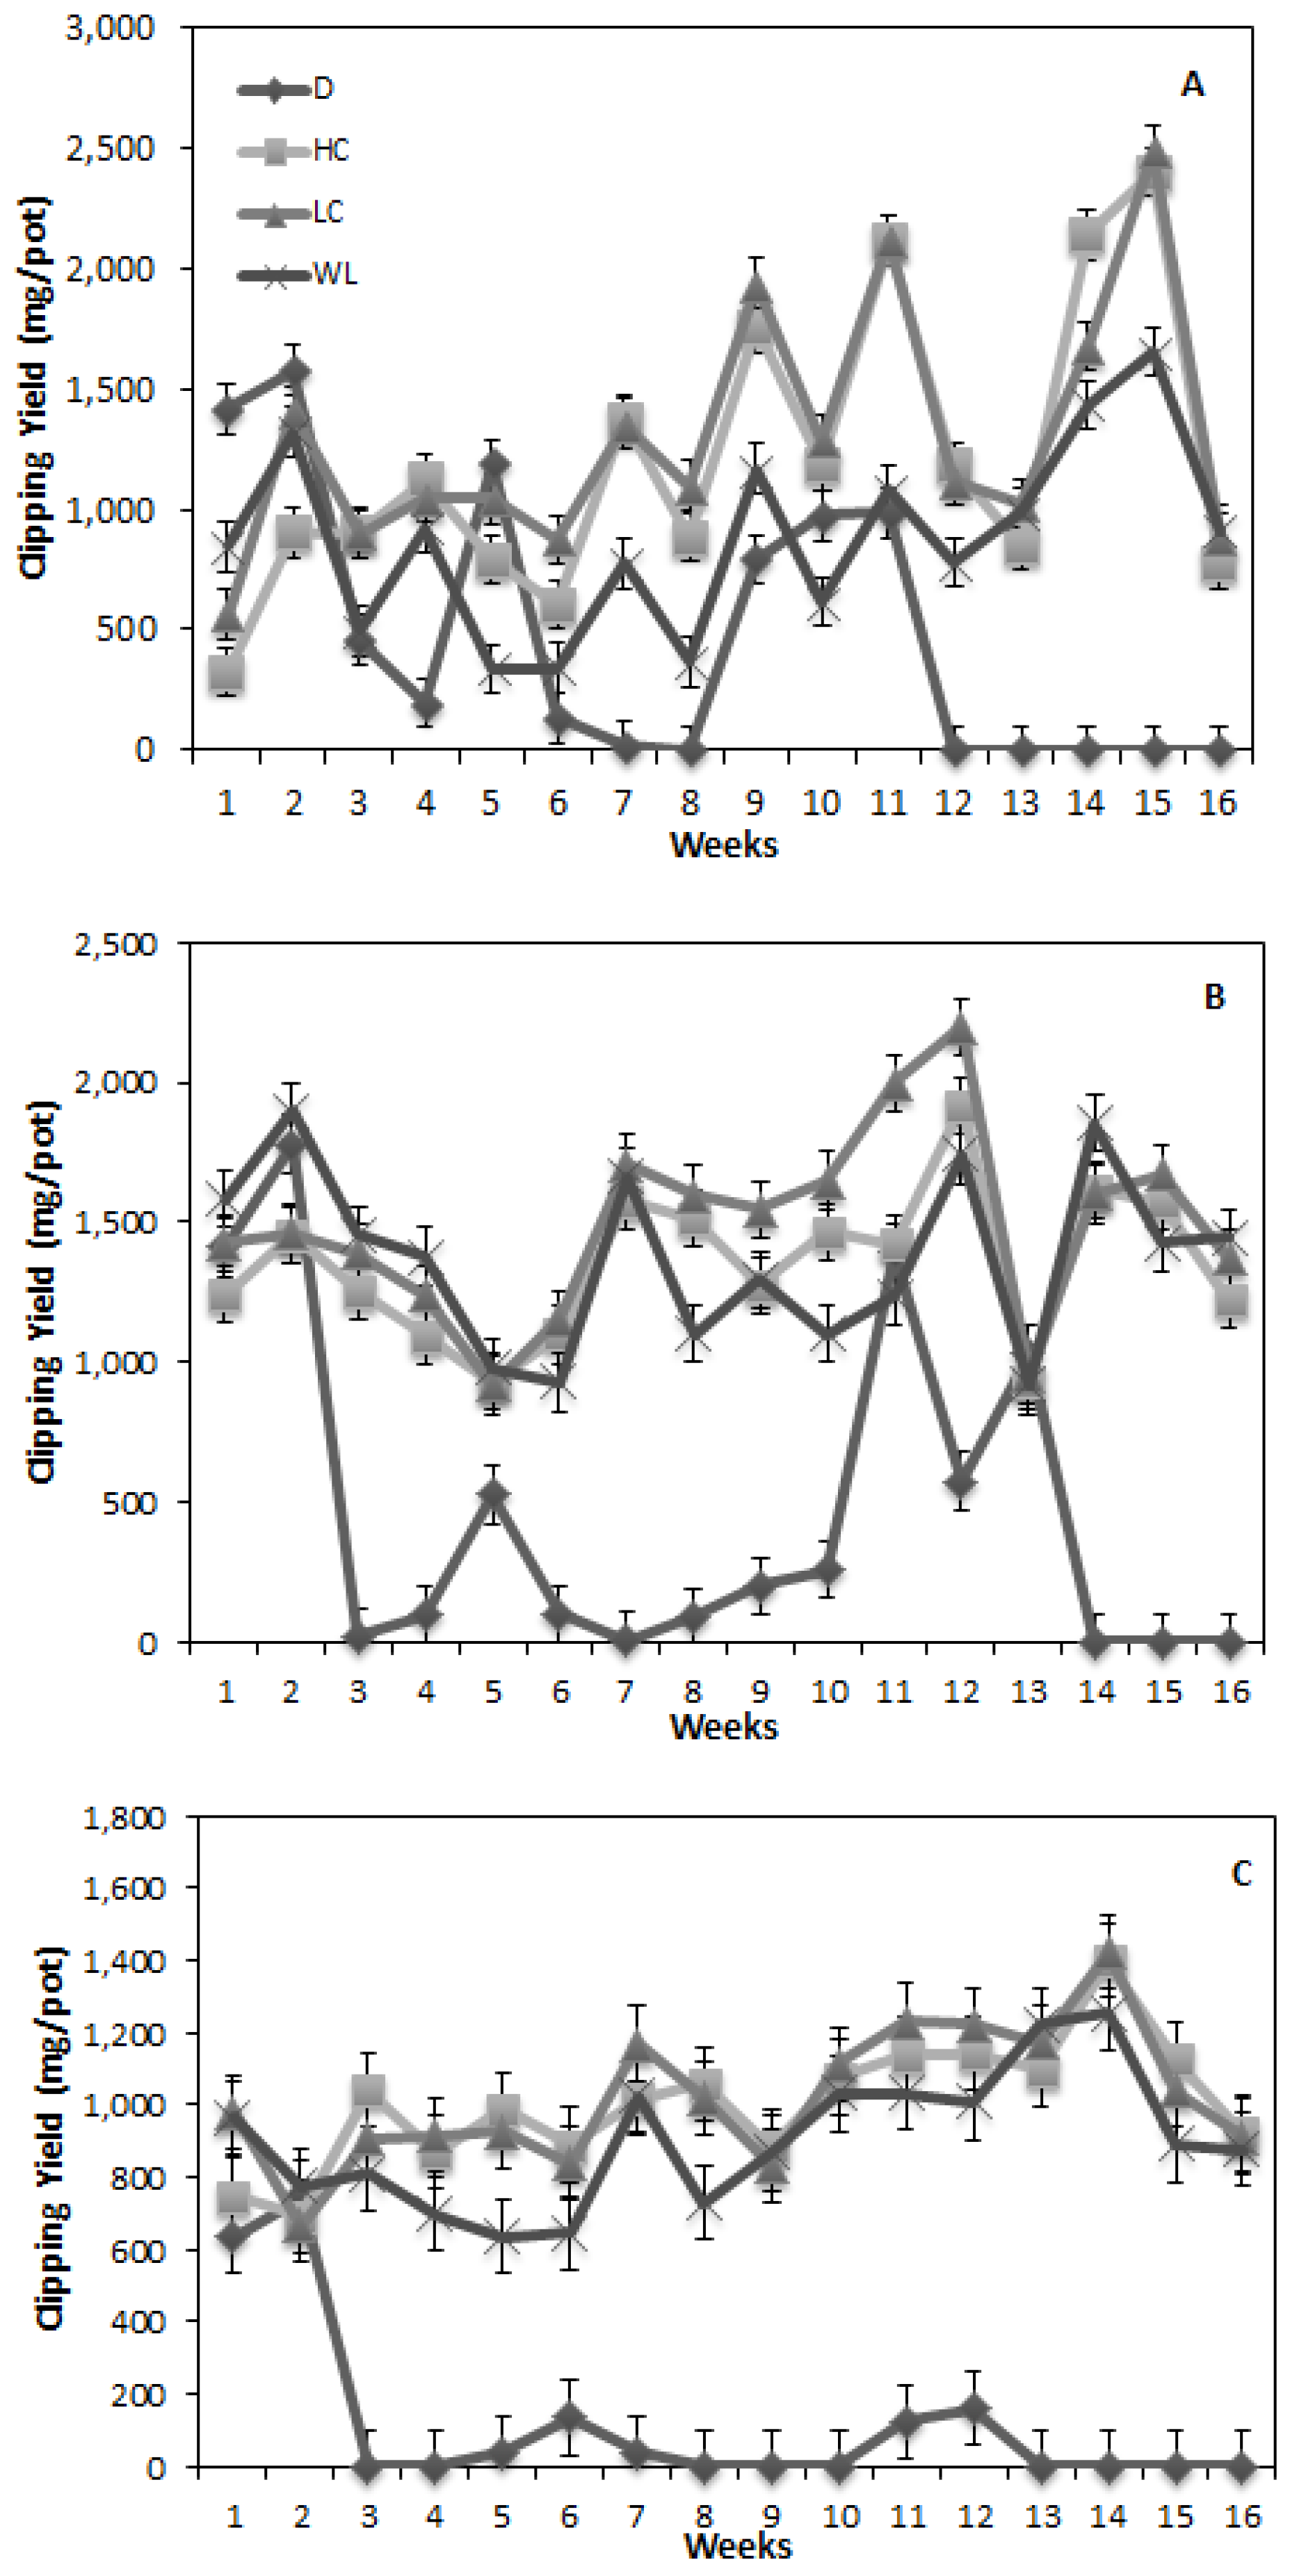
3.1. Clipping Yield
| Soil | Sand | ||
|---|---|---|---|
| mg/pot | |||
| Piarco | 1,225.3 a ‡ | 1,089.2 b | 1,157.2 a |
| Princes Town | 822.2 d | 1,001.7 bc | 911.9 b |
| River Estate | 863.6 cd | 959.3 c | 911.4 b |
| Talparo | 765.1 d | 1,006.2 bc | 885.7 b |
| Sand means § | 919 b | 1,014. a | |
| Grass | Stress | ||||
|---|---|---|---|---|---|
| mg/pot | |||||
| Bermuda | 483.7f ‡ | 876.4 e | 1,205.2 c | 1,300.0 bc | 966.3 b |
| Savannah | 467 f | 1,374.7 ab | 1,349.3 b | 1,492.7 a | 1,170.9 a |
| Zoysia | 116.9 g | 904.3 de | 1,005.5 de | 1,023.2 d | 762.5 c |
| Stress means § | 355.8 d | 1,051.8 c | 1,186.6 b | 1,272 a | |

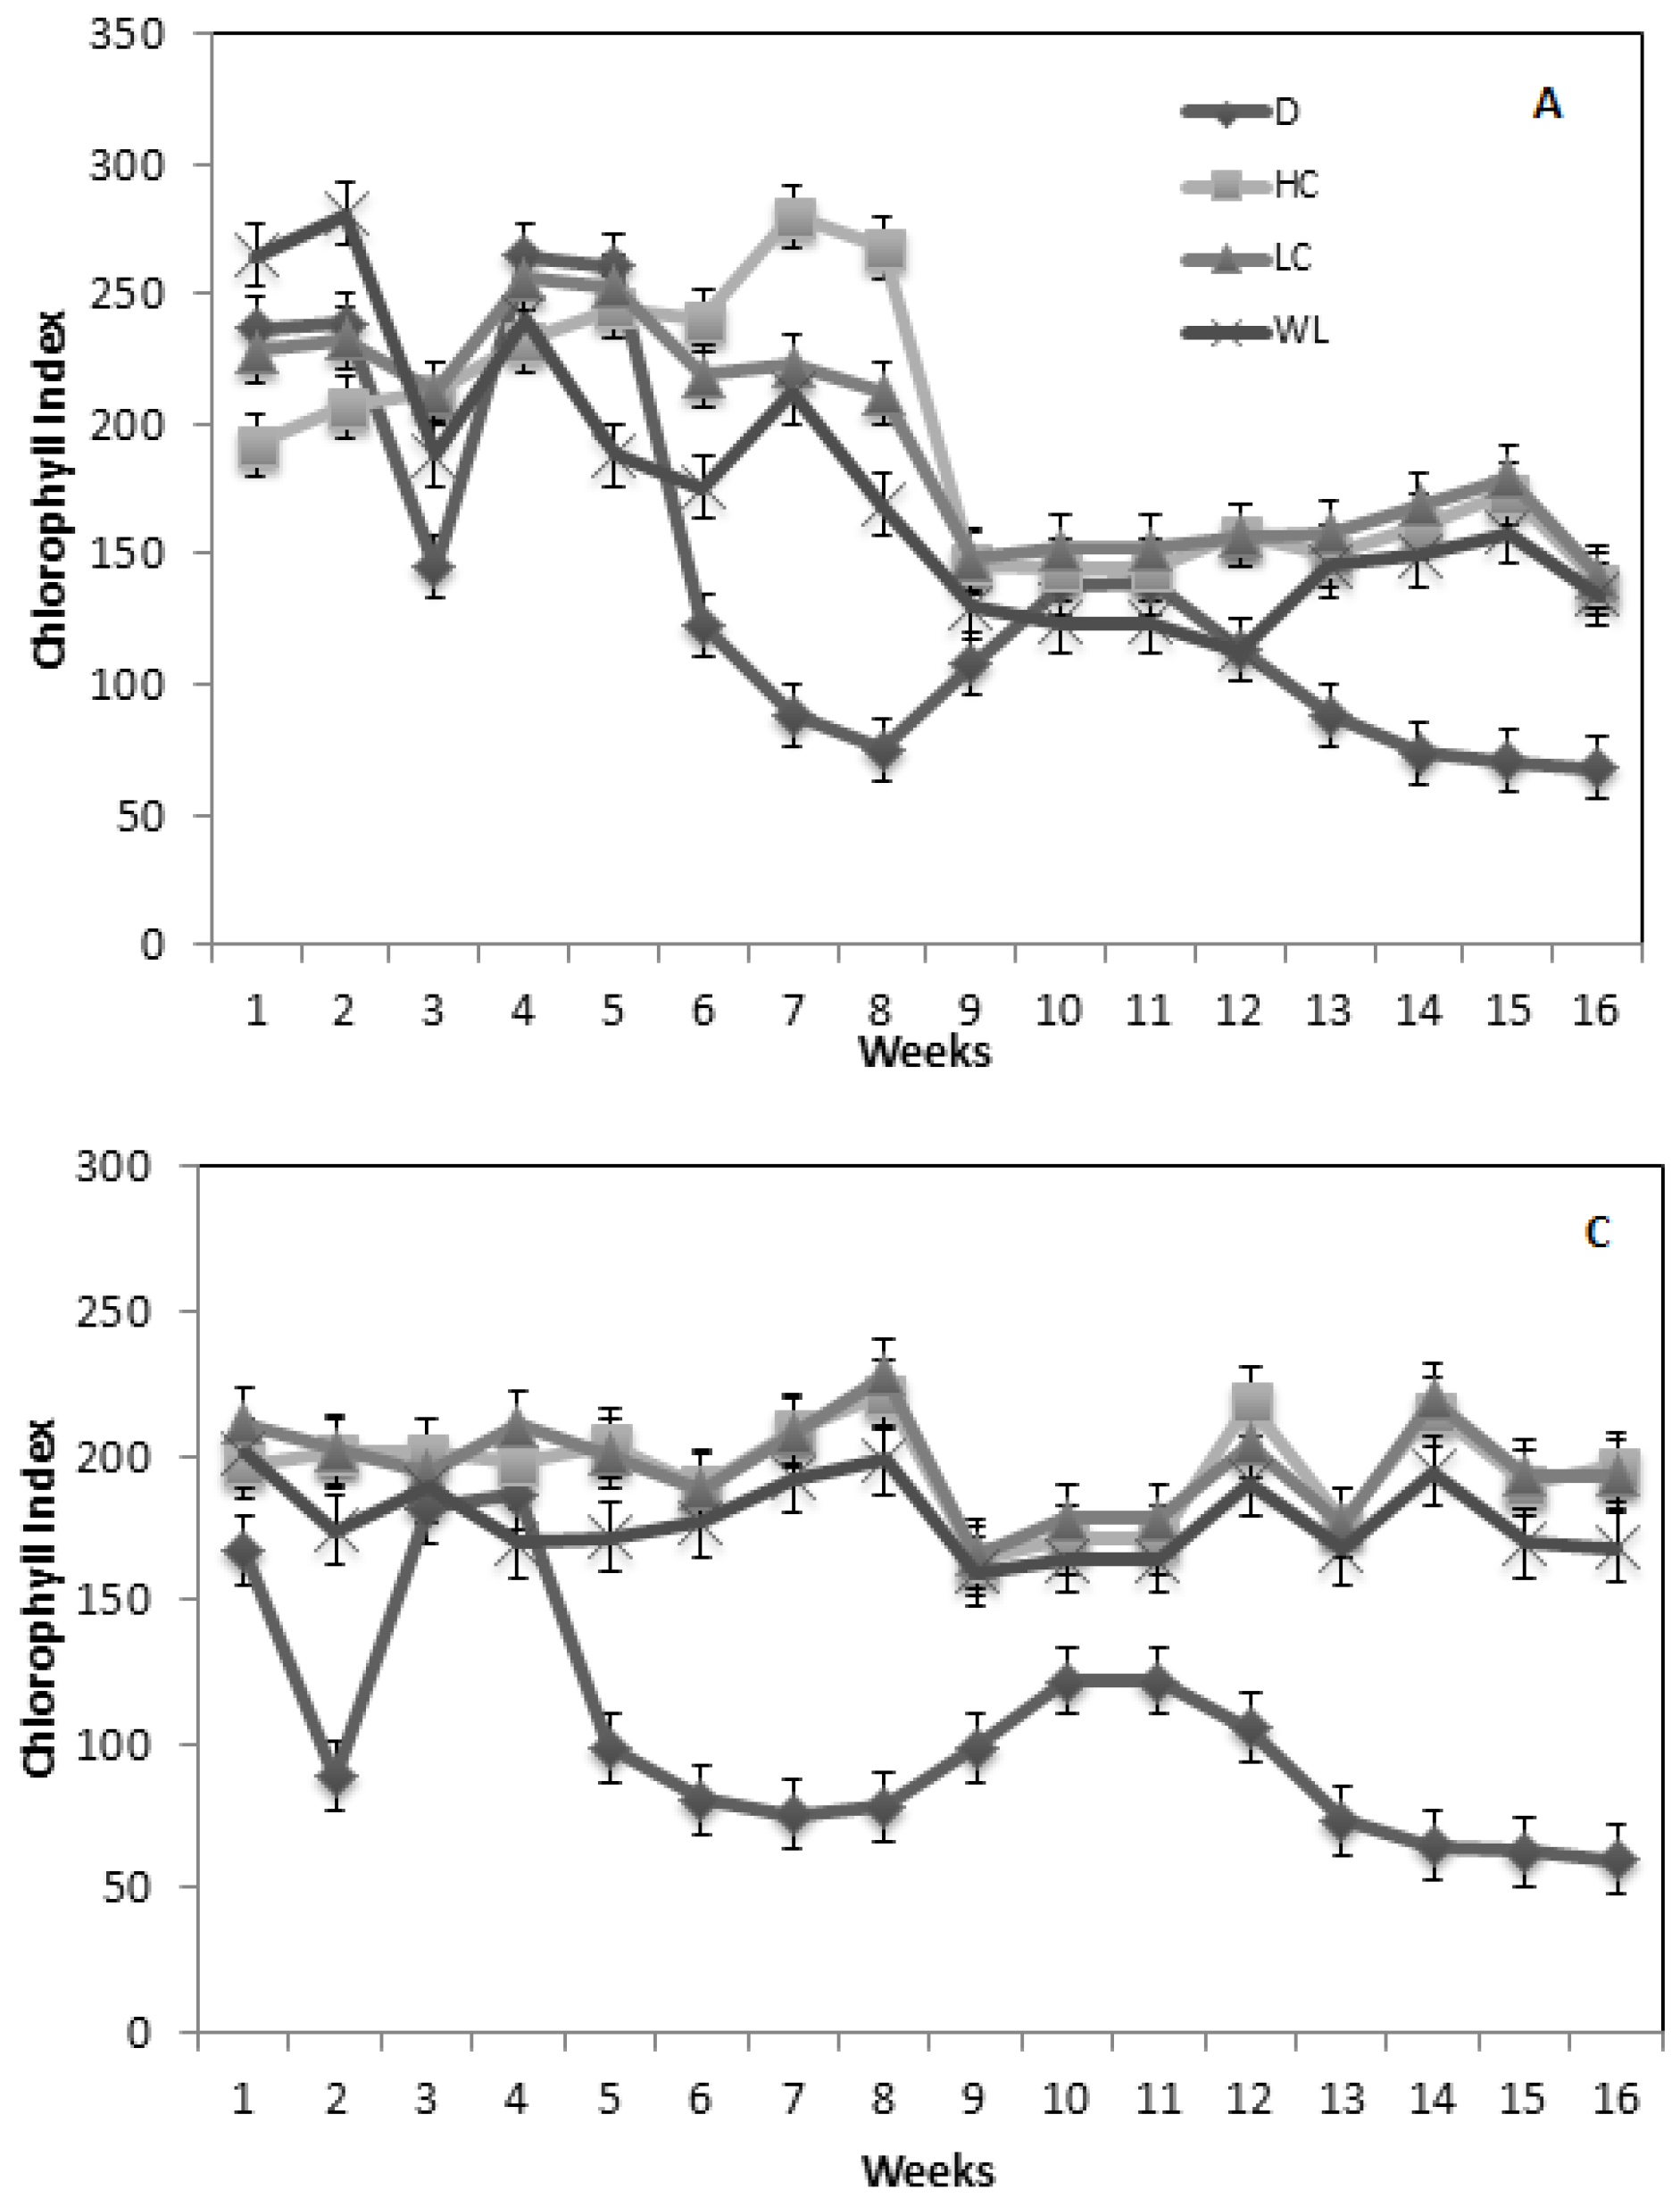
3.2. Chlorophyll Index
| Grass | Stress | ||||
|---|---|---|---|---|---|
| Reading | |||||
| Bermuda | 139.46 f ‡ | 176.18 e | 195.75 c | 194.86 cd | 176.56 b |
| Savannah | 153.33 f | 261.66 b | 286.87 a | 298.28 a | 250.04 a |
| Zoysia | 105.91 g | 180.37 de | 198.74 c | 199.79 c | 171.21 b |
| Stress means § | 132.90 c | 206.07 b | 227.12 a | 230.98 a | |

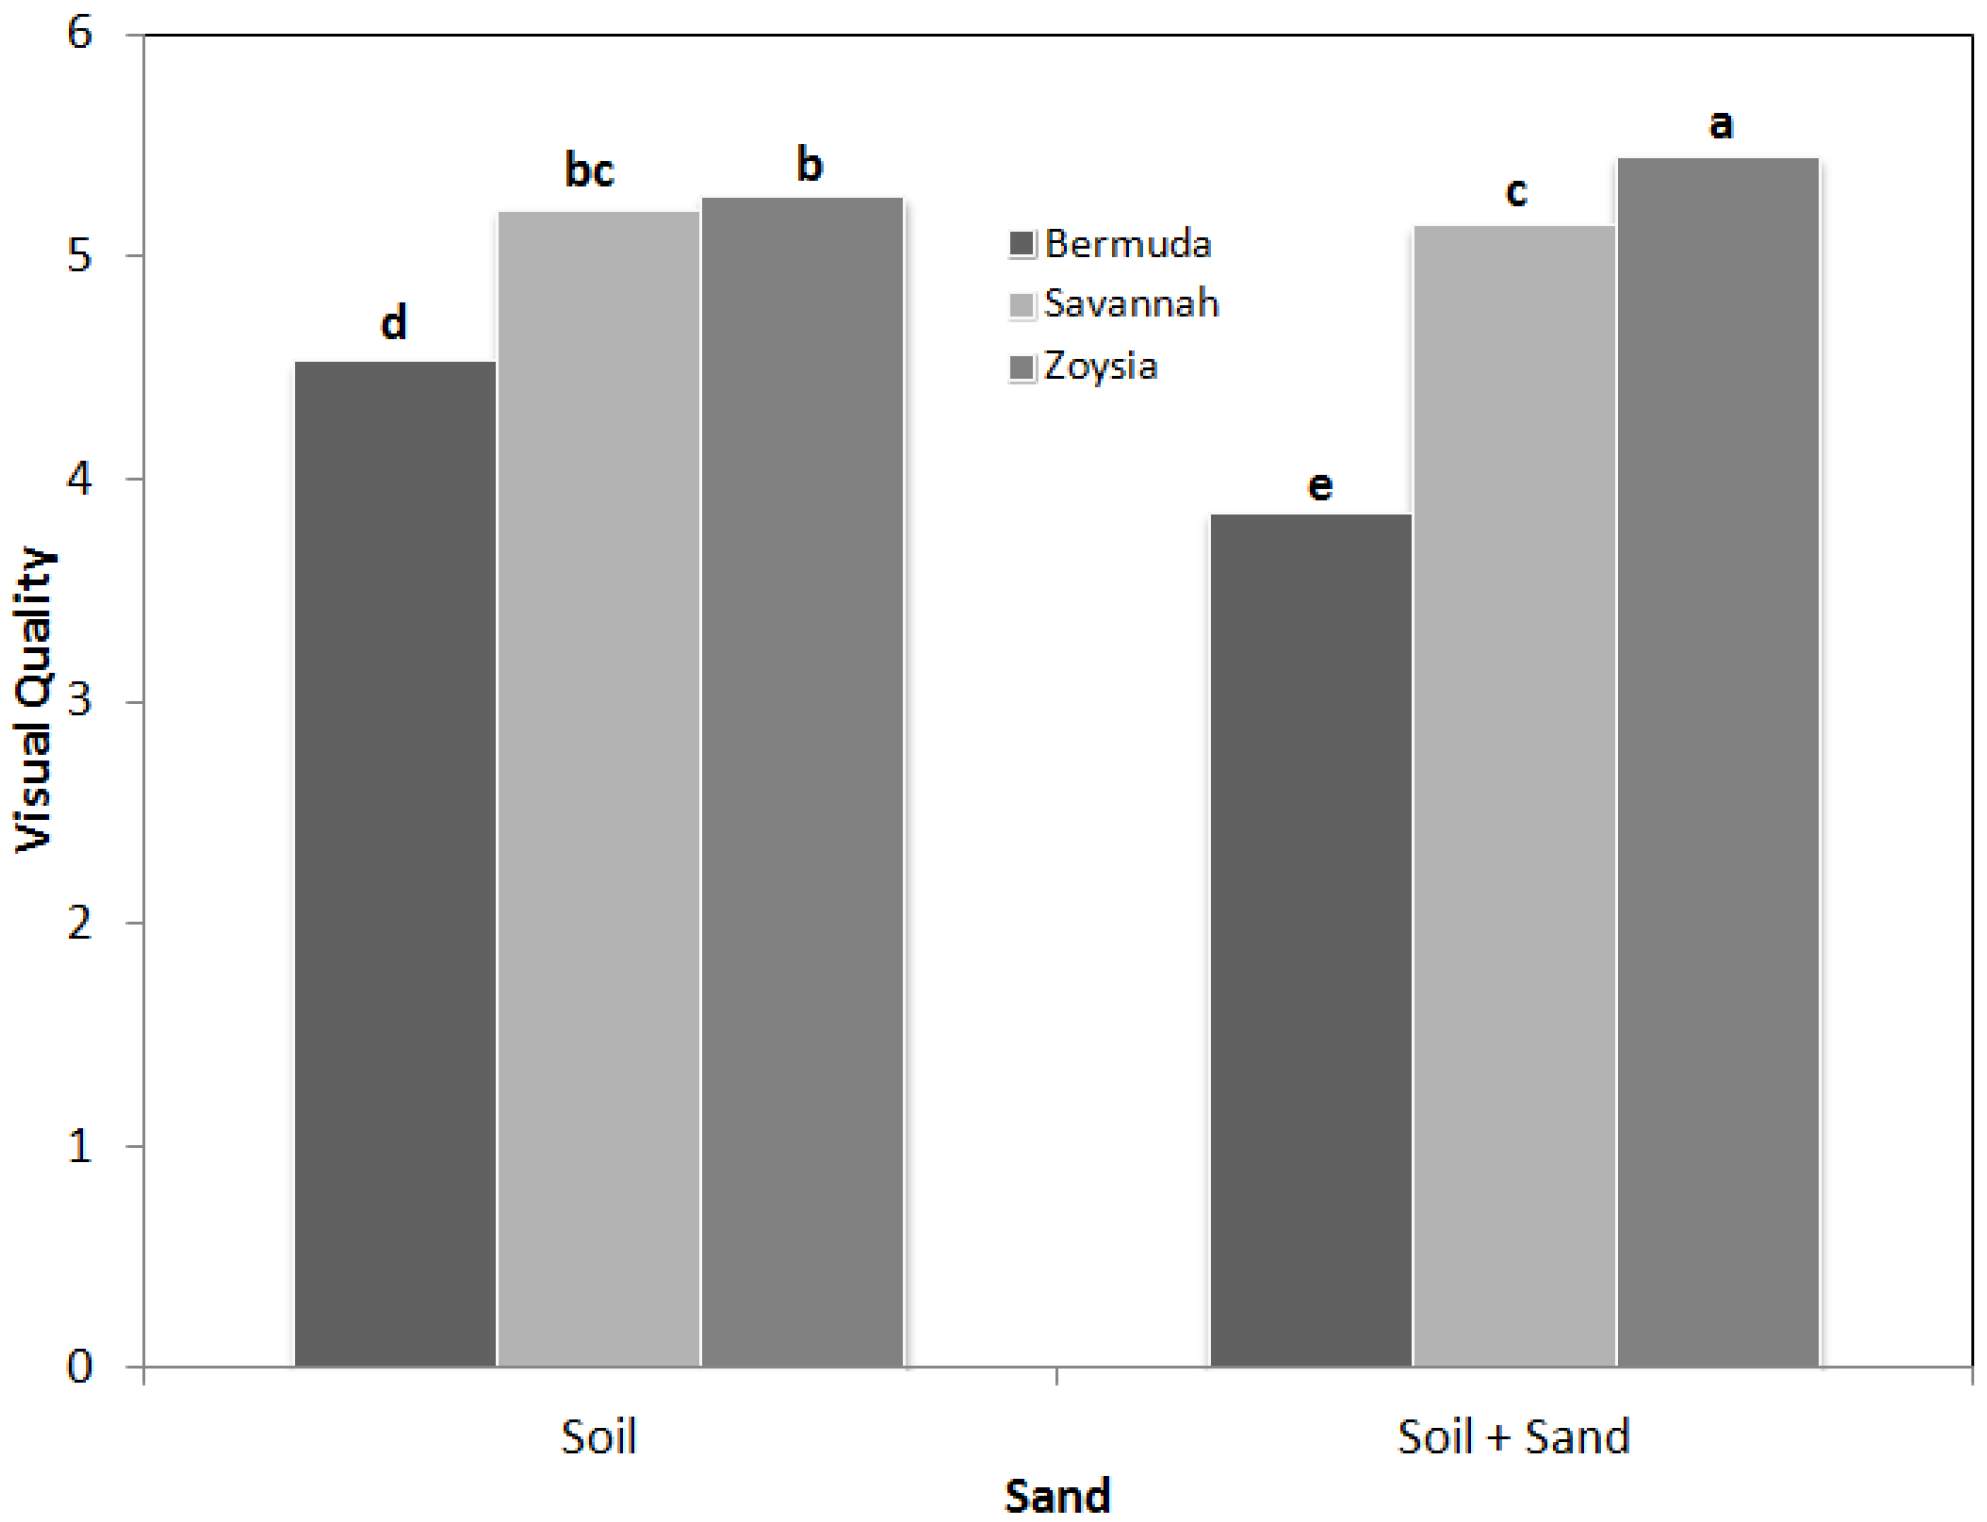
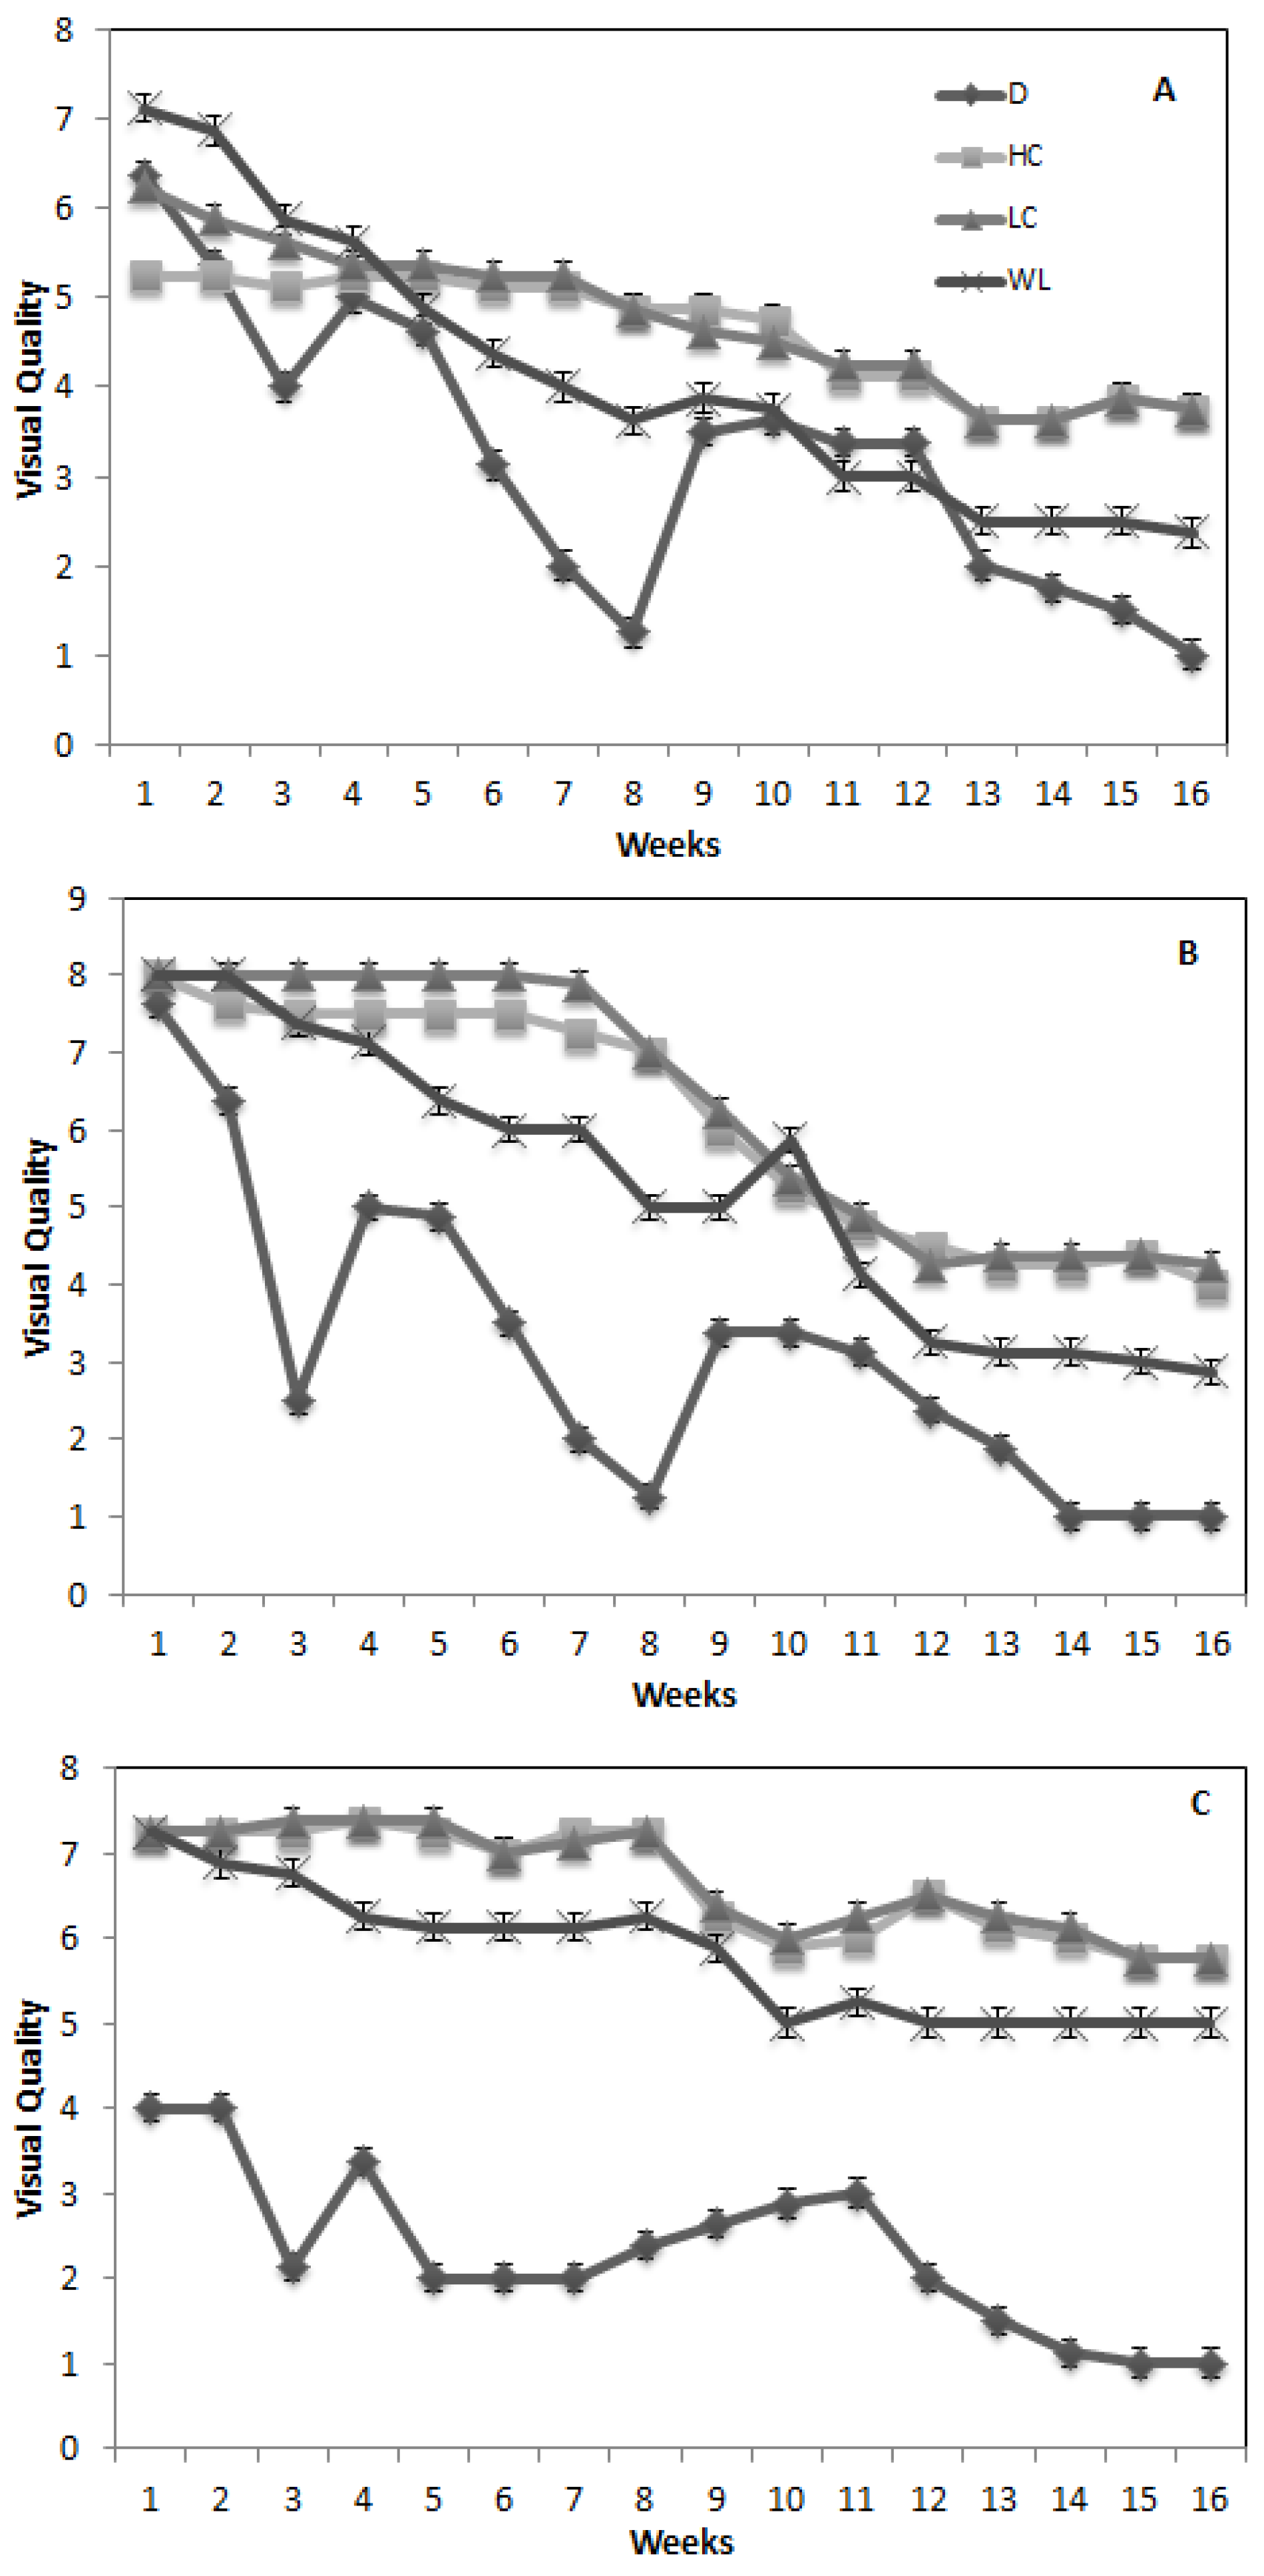
3.3. Visual Quality

| Grass | Stress | ||||
|---|---|---|---|---|---|
| Reading | |||||
| Bermuda | 139.46 f ‡ | 176.18 e | 195.75 c | 194.86 cd | 4.188 c |
| Savannah | 153.33 f | 261.66 b | 286.87 a | 298.28 a | 5.174 b |
| Zoysia | 105.91 g | 180.37 de | 198.74 c | 199.79 c | 5.359 a |
| Stress means § | 2.898 d | 5.029 c | 5.779 b | 5.922 a | |

4. Conclusions
Acknowledgments
Author Contributions
Conflict of Interest
References
- Canaway, P.M.; Baker, S.W. Soil and turf properties governing play. Int. Turfgrass Soc. Res. J. 1993, 7, 192–200. [Google Scholar]
- Brosnan, J.T.; McNitt, A.S.; Serensits, T.J. Effects of varying surface characteristics on the hardness and traction of baseball field playing surfaces. Int. Turfgrass Soc. Res. J. 2009, 11, 1–13. [Google Scholar]
- Dest, W.M.; Ebdon, J.S.; Guillard, K. Differentiating between the influence of wear and soil compaction and their interaction of turfgrass stress. Int. Turfgrass Soc. Res. J. 2009, 11, 1067–1083. [Google Scholar]
- Jiang, Y.; Wang, K. Growth, physiological, and anatomical responses of creeping bentgrass cultivars to different depths of waterlogging. Crop Sci. 2006, 46, 2420–2426. [Google Scholar] [CrossRef]
- Cashman, A.; Nurse, L.; John, C. Climate change in the Caribbean: The water management implications. J. Environ. Dev. 2010, 19, 42–67. [Google Scholar] [CrossRef]
- Bray, E.A. Plant responses to water-deficit. Trends Plant Sci. 1997, 2, 48–54. [Google Scholar] [CrossRef]
- Huang, B.; Duncan, R.R.; Carrow, R.N. Drought-resistance mechanisms of seven warm-season turfgrasses under surface soil drying: I. Shoot response. Crop Sci. 1997, 37, 1858–1863. [Google Scholar] [CrossRef]
- Zhang, J.; Baker, S.W. Sand characteristics and their influence on the physical properties of rootzone mixes used for sports. J. Turfgrass Sci. 1999, 75, 66–73. [Google Scholar]
- Kowalewski, A.R.; Roger, J.N., III; Crum, J.R.; Dunne, J.C. Sand topdressing applications improve shear strength and turfgrass densit on trafficked athletic fields. Horttechnology 2010, 20, 867–872. [Google Scholar]
- Miller, G.L. An evaluation of crumb rubber and clacined clay for topdressing sports fields. Acta Hort. 2008, 783, 381–390. [Google Scholar]
- Waddington, D.V.; Gover, A.E.; Beegle, D.B. Nutrient concentrations of turfgrass and soil test levels as affected by soil media and fertilizer rate and placement. Commun. Soil Sci. Plant Anal. 1994, 25, 1957–1990. [Google Scholar] [CrossRef]
- Ahmad, N. Soils of the Caribbean; Ian Randle Publishers: Kingston, Jamaica, 2011. [Google Scholar]
- Richardson, D.M.; Karcher, E.D.; Highnight, K.; Rush, D. Drought tolerance and rooting capacity of Kentucky bluegrass cultivars. Crop Sci. 2008, 48, 2429–2436. [Google Scholar] [CrossRef]
- Sills, M.J.; Carrow, R.N. Soil compaction effects on nitrogen use in tall fescue. J. Am. Soc. Hortic. Sci. 1983, 107, 934–946. [Google Scholar]
- Samaranayake, H.; Lawson, T.J.; Murphy, J.A. Traffic stress effects on bentgrass putting greens and fairway turf. Crop Sci. 2008, 48, 1193–1202. [Google Scholar] [CrossRef]
- Bell, G.E.; Martin, D.L.; Wiese, S.G.; Dobson, D.D.; Smith, M.W.; Stone, M.L.; Solie, J.B. Vehicle-mounted optical sensing: An objective means for evaluating turf quality. Crop Sci. 2002, 42, 197–201. [Google Scholar] [CrossRef]
- Gee, G.W.; Or, D. Particle-size analysis. In Methods of Soil Analysis Part (4) Physical Methods; Dane, J.H., Topp, G.C., Eds.; SSSA: Madison, WI, USA, 2002; pp. 255–294. [Google Scholar]
- Nelson, D.W.; Sommers, L.E. Total carbon, organic carbon, and organic matter. In Methods of Soil Analysis Part (3) Chemical Methods; Sparks, D.L., Ed.; SSSA: Madison, WI, USA, 1996; pp. 961–1010. [Google Scholar]
- Thomas, G.W. Soil pH and soil acidity. In Methods of soil analysis Part (3) Chemical Methods; Sparks, D.L., Ed.; SSSA: Madison, WI, USA, 1996; pp. 475–490. [Google Scholar]
- Quinn, G.P.; Keough, M.J. Experimental Design and Data Analysis for Biologists; Cambridge University Press: Cambridge, UK, 2002. [Google Scholar]
- Diaz-Zorita, M.; Grove, J.H.; Perfect, E. Laboratory compaction of soils using a small mold procedure. Soil Sci. Soc. Am. J. 2001, 65, 1593–1598. [Google Scholar] [CrossRef]
- Li, D.; Hunt, W.F. Soccer-wear simulation on sport turf mixtures. Trans. CSAE 1997, 13, 164–168. [Google Scholar]
- Hoffman, L.; Ebdon, J.S.; Dest, W.M.; DaCosta, M. Effects of nitrogen and potassium on wear mechanisms in perennial Ryegrass: I. Wear tolerance and recovery. Crop Sci. 2010, 50, 357–366. [Google Scholar] [CrossRef]
- Englesjord, M.; Singh, B.R. Effects of slow-release fertilizers on growth and on uptake and leaching of nutrients in Kentucty bluegrass turfs established on sand-based root zones. Can. J. Plant Sci. 1997, 77, 433–444. [Google Scholar] [CrossRef]
- Li, D.; Joo, Y.K.; Chirstians, N.E.; Minner, D.D. Inorganic soil amendment effects on sand-based sports turf media. Crop Sci. 2000, 40, 1121–1125. [Google Scholar] [CrossRef]
- Baker, S.W.; Canaway, P.M. The effects of sand topdressing on the performance of winter games pitches of different construction types. II. Playing quality. J. Sports Turf Inst. 1992, 68, 62–72. [Google Scholar]
- Bush, E.W.; Shepard, D.P.; Wilson, P.W.; McCrimmon, J.N. Carpetgrass and centipedegrass tissue iron and manganese accumulation in response to soil waterlogging. J. Plant Nutri. 1999, 22, 435–444. [Google Scholar] [CrossRef]
- Fry, J.D. Submersion tolerance of warm-season turfgrasses. HortScience 1991, 26, 927. [Google Scholar]
- Jiang, Y.; Huang, B. Osmotic adjustment and root growth associated with drought preconditioning-enhanced heat tolerance in Kentucky bluegrass. Crop Sci. 2001, 41, 1168–1173. [Google Scholar] [CrossRef]
- Christians, N. Fundamentals of Turfgrass Management; John Wiley: Hoboken, NJ, USA, 2004. [Google Scholar]
- Qian, Y.; Fry, J.D. Water relations and drought tolerance of four turfgrasses. J. Am. Soc. Hort. Sci. 1997, 122, 129–133. [Google Scholar]
- Nahar, K.; Gretzmacher, R. Effect of water stress on nutrient uptake, yield and quality of tomato (Lycopersicon esculentum Mill.) under subtropical conditions. Die Bodenkultur 2002, 53, 45–51. [Google Scholar]
- Silva, E.C.; Nogueira, R.J.M.C.; Silva, M.A.; Bandeira, M. Drought stress and plant nutrition. Plant Stress 2011, 5, 32–41. [Google Scholar]
- Malik, A.I.; Colmer, T.D.; Lambers, H.; Schortemeyer, M. Changes in physiological and morphological traits of roots and shoots of wheat in response to different depths of waterlogging. Aust. J. Plant Physiol. 2001, 28, 1121–1131. [Google Scholar]
- Springer, R.; Eudoxie, G.; Gouveia, G. Comparative evaluation of common Savannahgrass on a range of soils subjected to different stresses II: Rootzone physical condition. Agronomy 2014, 4, 124–143. [Google Scholar] [CrossRef]
- Beard, J.B. Turfgrass water stress: Drought resistance components, physiological mechanisms and species-genotype diversity. Proc. Int. Turfgrass Res. Conf. Japan 1989, 6, 23–28. [Google Scholar]
- Lawlor, D.W.; Cornic, G. Photosynthetic carbon assimilation and associated metabolism in relation to water deficits in higher plants. Plant Cell Environ. 2002, 25, 275–294. [Google Scholar] [CrossRef]
- Flexas, J.; Medrano, H. Drought-inhibition of photosynthesis in C3 plants: Stomatal and non-stomatal limitations revised. Ann. Bot. 2002, 89, 183–189. [Google Scholar] [CrossRef]
- Beard, J.B.; Beard, H.J. Beard’s Turfgrass Encyclopedia for Golf Courses, Grounds, Lawns, and Sports Fields; Michigan State University Press: East Lansing, MI, USA, 2005. [Google Scholar]
- Liao, C.; Lin, C. Physiological adaptation of crop plants to flooding stress. Proc. Natl. Sci. Counc. Repub. China 2001, 25, 148–157. [Google Scholar]
© 2014 by the authors; licensee MDPI, Basel, Switzerland. This article is an open access article distributed under the terms and conditions of the Creative Commons Attribution license (http://creativecommons.org/licenses/by/3.0/).
Share and Cite
Springer, R.; Eudoxie, G.; Gouveia, G. Comparative Evaluation of Common Savannahgrass on a Range of Soils Subjected to Different Stresses I: Productivity and Quality. Agronomy 2014, 4, 202-216. https://doi.org/10.3390/agronomy4020202
Springer R, Eudoxie G, Gouveia G. Comparative Evaluation of Common Savannahgrass on a Range of Soils Subjected to Different Stresses I: Productivity and Quality. Agronomy. 2014; 4(2):202-216. https://doi.org/10.3390/agronomy4020202
Chicago/Turabian StyleSpringer, Raymond, Gaius Eudoxie, and Gregory Gouveia. 2014. "Comparative Evaluation of Common Savannahgrass on a Range of Soils Subjected to Different Stresses I: Productivity and Quality" Agronomy 4, no. 2: 202-216. https://doi.org/10.3390/agronomy4020202
APA StyleSpringer, R., Eudoxie, G., & Gouveia, G. (2014). Comparative Evaluation of Common Savannahgrass on a Range of Soils Subjected to Different Stresses I: Productivity and Quality. Agronomy, 4(2), 202-216. https://doi.org/10.3390/agronomy4020202