Article

REU-YOLO: A Context-Aware UAV-Based Rice Ear Detection Model for Complex Field Scenes

1
College of Information and Communication Engineering, Hainan University, Haikou 570228, China
2
Key Laboratory of Tropical Intelligent Agricultural Equipment, Ministry of Agriculture and Rural Affairs, Hainan University, Danzhou 571927, China
3
College of Mechanical and Electrical Engineering, Hainan University, Haikou 570228, China
*
Authors to whom correspondence should be addressed.
Agronomy 2025, 15(9), 2225; https://doi.org/10.3390/agronomy15092225
Submission received: 9 August 2025 / Revised: 7 September 2025 / Accepted: 14 September 2025 / Published: 20 September 2025
(This article belongs to the Section Precision and Digital Agriculture)

Abstract

Accurate detection and counting of rice ears serve as a critical indicator for yield estimation, but the complex conditions of paddy fields limit the efficiency and precision of traditional sampling methods. We propose REU-YOLO, a model specifically designed for UAV low-altitude remote sensing to collect images of rice ears, to address issues such as high-density and complex spatial distribution with occlusion in field scenes. Initially, we combine the Additive Block containing Convolutional Additive Self-attention (CAS) and Convolutional Gated Linear Unit (CGLU) to propose a novel module called Additive-CGLU-C2F (AC-C2f) as a replacement for the original C2f in YOLOv8. It can capture the contextual information between different regions of images and improve the feature extraction ability of the model, introduce the Dropblock strategy to reduce model overfitting, and replace the original SPPF module with the SPPFCSPC-G module to enhance feature representation and improve the capacity of the model to extract features across varying scales. We further propose a feature fusion network called Multi-branch Bidirectional Feature Pyramid Network (MBiFPN), which introduces a small object detection head and adjusts the head to focus more on small and medium-sized rice ear targets. By using adaptive average pooling and bidirectional weighted feature fusion, shallow and deep features are dynamically fused to enhance the robustness of the model. Finally, the Inner-PloU loss function is introduced to improve the adaptability of the model to rice ear morphology. In the self-developed dataset UAVR, REU-YOLO achieves a precision (P) of 90.76%, a recall (R) of 86.94%, an mAP0.5 of 93.51%, and an mAP0.5:0.95 of 78.45%, which are 4.22%, 3.76%, 4.85%, and 8.27% higher than the corresponding values obtained with YOLOv8 s, respectively. Furthermore, three public datasets, DRPD, MrMT, and GWHD, were used to perform a comprehensive evaluation of REU-YOLO. The results show that REU-YOLO indicates great generalization capabilities and more stable detection performance.

1. Introduction

Rice stands as a primary food crop in global agriculture, with China regularly maintaining the position of the largest producer, leading with 30% of total global output. Rice serves as the primary food source for over half of the population in China [1]. Cultivating superior rice varieties constitutes a crucial basis and assurance for advancing agricultural development. The significant movement of rural labor into various industries, coupled with the decrease in arable land, has positioned the enhancement of crop yield as the primary focus for developing superior rice varieties [2]. Estimating rice yields enables agricultural professionals and breeders to anticipate rice production, analyze the variables influencing yield, and subsequently enhance crop breeding and cultivation management strategies by summarizing experience. Traditional methods used to estimate rice yield primarily depend on three key indicators: the number of rice ears per unit area, the average number of filled grains per ear, and the thousand-grain weight. Notably, the number of rice ears reflects the tillering capacity of varieties and serves as a crucial indicator in determining rice yield. Rice ears in the field are densely distributed and overlapping, and the process of manual counting is characterized by significant subjectivity and prone to errors. An efficient, accurate, and convenient method for detecting and counting rice ears is urgently required.
In recent years, the application of high-tech in agricultural production has become increasingly mature. UAV remote sensing has the advantages of flexibility and high throughput. It can collect a large amount of field data information at a relatively low cost and has been widely used in field detection. For example, Li et al. [3] proposed a marijuana detection model, AMS-YOLO, utilizing an asymmetric backbone network and a multi-scale fusion neck structure based on UAV remote sensing. Moldvai et al. [4] proposed an accurate row detection technique with UAV imagery, which produces weed density distribution maps and uses the in-row concentration ratio to avoid mistakes in row detection resulting from significant weed contamination. Zhu et al. [5] proposed a maize tassel detection model, MSMT-RTDETR, utilizing Faster-RPE and dynamic cross-scale feature fusion modules based on UAV imagery in complex field environments. Based on the above application examples, it can be seen that UAV remote sensing technology has great potential in the agricultural field, with strong adaptability to complex environments and reduced labor intensity. Therefore, it can effectively support rice ear detection in complex field environments.
The application of crop phenotypic detection has been extensively documented in the fields of computer vision and machine learning. Earlier studies into the detection and counting of rice ears can be classified into two methods: traditional machine learning and deep learning. In terms of traditional machine learning, Zhu et al. [6] introduced a two-stage method for wheat ear detection. During the initial detection stage, machine learning techniques were employed to identify potential wheat ear regions. During the fine detection stage, the integration of the densely extracted scale-invariant transformation features with the Fisher Vector encoding produced middle-level feature representations, which, when combined with classifiers, effectively separated wheat ears from non-ear regions. Xiong et al. [7] introduced Panicle-SEG-CNN, a rice ear segmentation model, which combines appropriate image processing techniques, obtaining precision and recall rates of 82.1% and 73%, respectively. Bai et al. [8] combined the gradient histogram technique with CNN to develop a rice ear recognition method with cascade multi-classifiers, employing color as the target feature for SVM to separate rice ears from the background. Zhou et al. [9] obtained three types of features from wheat ear images, fused them using kernel principal component analysis, and then constructed a dual support vector machine segmentation model for wheat ear segmentation and counting. Fernandez-Gallego et al. [10,11] used Laplace frequency filtering and median filtering to denoise wheat ear images and introduced a segmentation and counting approach for wheat ears based on searching the largest value. Simultaneously, they employed a handheld infrared device to capture images based on the temperature difference between the ear and the surrounding canopy, and introduced an automated ear detection method using contrast enhancement and filtering techniques. Xu et al. [12] employed the K-means clustering algorithm to autonomously segment wheat ears, defined four label categories to establish a segmentation dataset, and then developed a convolutional neural network for rapid and precise detection of wheat ears. Ji et al. [13] used the color attenuation prior model to preprocess the corn tassel images and introduced an automatic identification method for corn tassels based on the Itti visual saliency algorithm, achieving a recall rate of 86.3% and an accuracy rate of 91.44%. Traditional machine learning methods have benefits in crop phenotyping, including speed and non-invasive assessment. However, their dependence on manual feature extraction makes them vulnerable to environmental variations, plant differences, and morphological variety across organs, hence limiting the generalization performance of the model. Specifically, the detection accuracy declines substantially in field conditions due to the complicated spatial distribution of rice ears and occlusions.
Deep learning algorithms provide significant learning capabilities and flexibility to extensive datasets. The rapid detection of rice ears using deep learning and image processing technologies is now regarded as a crucial method. Chen et al. [14] introduced a rice ear counting algorithm to address the issue of significant variations in rice ears due to the scale of UAV image acquisition. It employs fine feature fusion through precise quantization scales, extracting and integrating relevant features accordingly and achieving a mean counting accuracy rate of 92.77%. Teng et al. [15] introduced the Panicle-AI model, an algorithm based on YOLOv5 that integrates a custom PB module with an SE attention mechanism for UAV-based rice ear detection, achieving an average accuracy of 96.7%. They furthermore created a cloud computing platform. Tan et al. [16] introduced the RiceRes2Net model, an RCNN-based system for detecting rice ears and recognizing growth stages under complex field conditions, achieving average accuracies of 96.8%, 93.7%, and 82.4% for the booting, heading, and filling stages, respectively. Wei et al. [17] introduced a rice ear detection and counting model using YOLOv8 for UAV rice ear images, integrated with the LSKA attention mechanism and Hornet module, achieving an average accuracy of 98% and a detection speed of 20 ms. Liang et al. [18] introduced a rotating rice ear identification model based on YOLOv5, incorporating circular smooth labels to address challenges in detecting densely overlapping and variably positioned rice ears in the field, achieving an average accuracy of 95.6%. Lan et al. [19] introduced a rice ear detection method called RICE-YOLO based on YOLOv5 to address challenges such as elevated shooting angles and susceptibility to edge distortion in UAV imagery; the method combines an efficient multiscale attention mechanism with a small target detection head, achieving an average accuracy of 94.8% and a recall rate of 93.1%. Song et al. [20] introduced a lightweight rice ear detection model, YOLO-Rice, based on YOLOv8, which integrates FasterNet and a normalized attention module, achieving an accuracy of 93.5% and an average precision of 95.9%. Guo et al. [21] proposed a lightweight multi-scale rice panicle detection model, FRPNet, by utilizing the Panicle-AI dataset DRPD. The model employs a self-calibrated convolutional backbone network and a dynamic bidirectional feature pyramid network. The mAP0.5 and mAP0.5:0.95 reached 89.31% and 55.53%, respectively, demonstrating effective background noise reduction. Zheng et al. [22] constructed a C2f-Faster-EMA module and proposed a model named YOLO_ECO for detecting rice ears and growth stages in fields, integrated with a Slim Neck and a lightweight shared convolutional detection head. The mAP0.5 reached 87.2%, and they further created an Android application derived from the concept. In conclusion, to date, there have been few investigations on models for detecting and counting rice ears in high-density and mutually occluded distributions. The majority of the study subjects are characterized by readily recognizable erect ears and field distributions with low planting density.
In order to solve the above problems, we propose a UAV-based rice ear detection model using YOLOv8 s, designed to effectively detect and count rice ears in difficult field environments characterized by significant occlusion. The Additive Block and CGLU modules were initially integrated into the C2f module, which enabled the development of the AC-C2f module to enhance the feature extraction capability of the model. The SPPF module was subsequently substituted with the SPPFCSPC_G module to improve the feature expression across various scales and the robustness of the model. Simultaneously, we developed an MBiFPN feature fusion network to dynamically integrate features of various levels by bidirectional weighting that avoids information loss. The Inner-PloU loss function was ultimately conducted to enhance the accuracy of the model. To verify the efficacy of REU-YOLO, we performed comparison experiments using the self-developed UAVR dataset and three public datasets: DRPD, MrMT, and GWHD. The model effectively detects rice ears and other plants in complex field environments, serving as a reference for the rapid counting of small, irregular targets in challenging agricultural environments.

2. Materials and Methods

2.1. Field Data Collection

The data collecting location for this study was situated at the Batou Experimental Base, Yazhou District, Sanya City, Hainan Province, China (18.24° N, 109.10° E). The data were collected on 14 March and 28 September 2024, from 9 am to 11 am. The rice varieties used were Guangtaiyoutianhongsimiao, Guangtaiyou No. 6 and Qi1you387, including the heading and filling stages. A DJI Mavic 3E (DJI Technology Co., Ltd., Shenzhen, China) UAV was used to perform image acquisition tasks (Figure 1). To precisely capture images of rice fields, the flying altitude was set at 2 to 4 m with the camera pointed straight downward at a 90-degree angle. Multiple regions of interest were randomly picked above the experimental field to guarantee image variety, and the resolution of the original images was 5280 × 3956 pixels.
The rice images presented in this study were obtained from a multifaceted field background, including images of different rice varieties captured at varying acquisition heights, growth stages, and planting densities, thereby creating a comprehensive representation of rice ear phenotypes. UAV low-altitude capturing of rice images may cover a broader field area, but it is influenced by inconsistent illumination and plant overlap. Height variations may influence the capacity to identify characteristics of an individual ear, and certain rice ears may appear as spikelets due to occlusion, with only a small part exposed (Figure 1a). We identified indica rice varieties characterized by loose ears. The phenotype of rice ears shows significant variation in color, size, and shape across different growth stages (Figure 1c). The ear shape is compact and small during the heading stage, similarly to the leaves. Throughout the filling stage, rice ears progressively increase in plumpness, with their shape gradually tilting and dispersing. This process involves varying degrees of occlusion both among ears and between ears and leaf stems. Differences in planting densities also influence both the amounts and forms of ear groups in the image (Figure 1d). At low planting densities, rice ears appear more prominent and intact, accompanied by a richer background. With increasing densities, the occlusion between leaves and ears increases. The variety and intricacy of rice ear phenotypes provide serious challenges for ear detection and counting methods.

2.2. UAVR Dataset

2.2.1. Field Data Processing

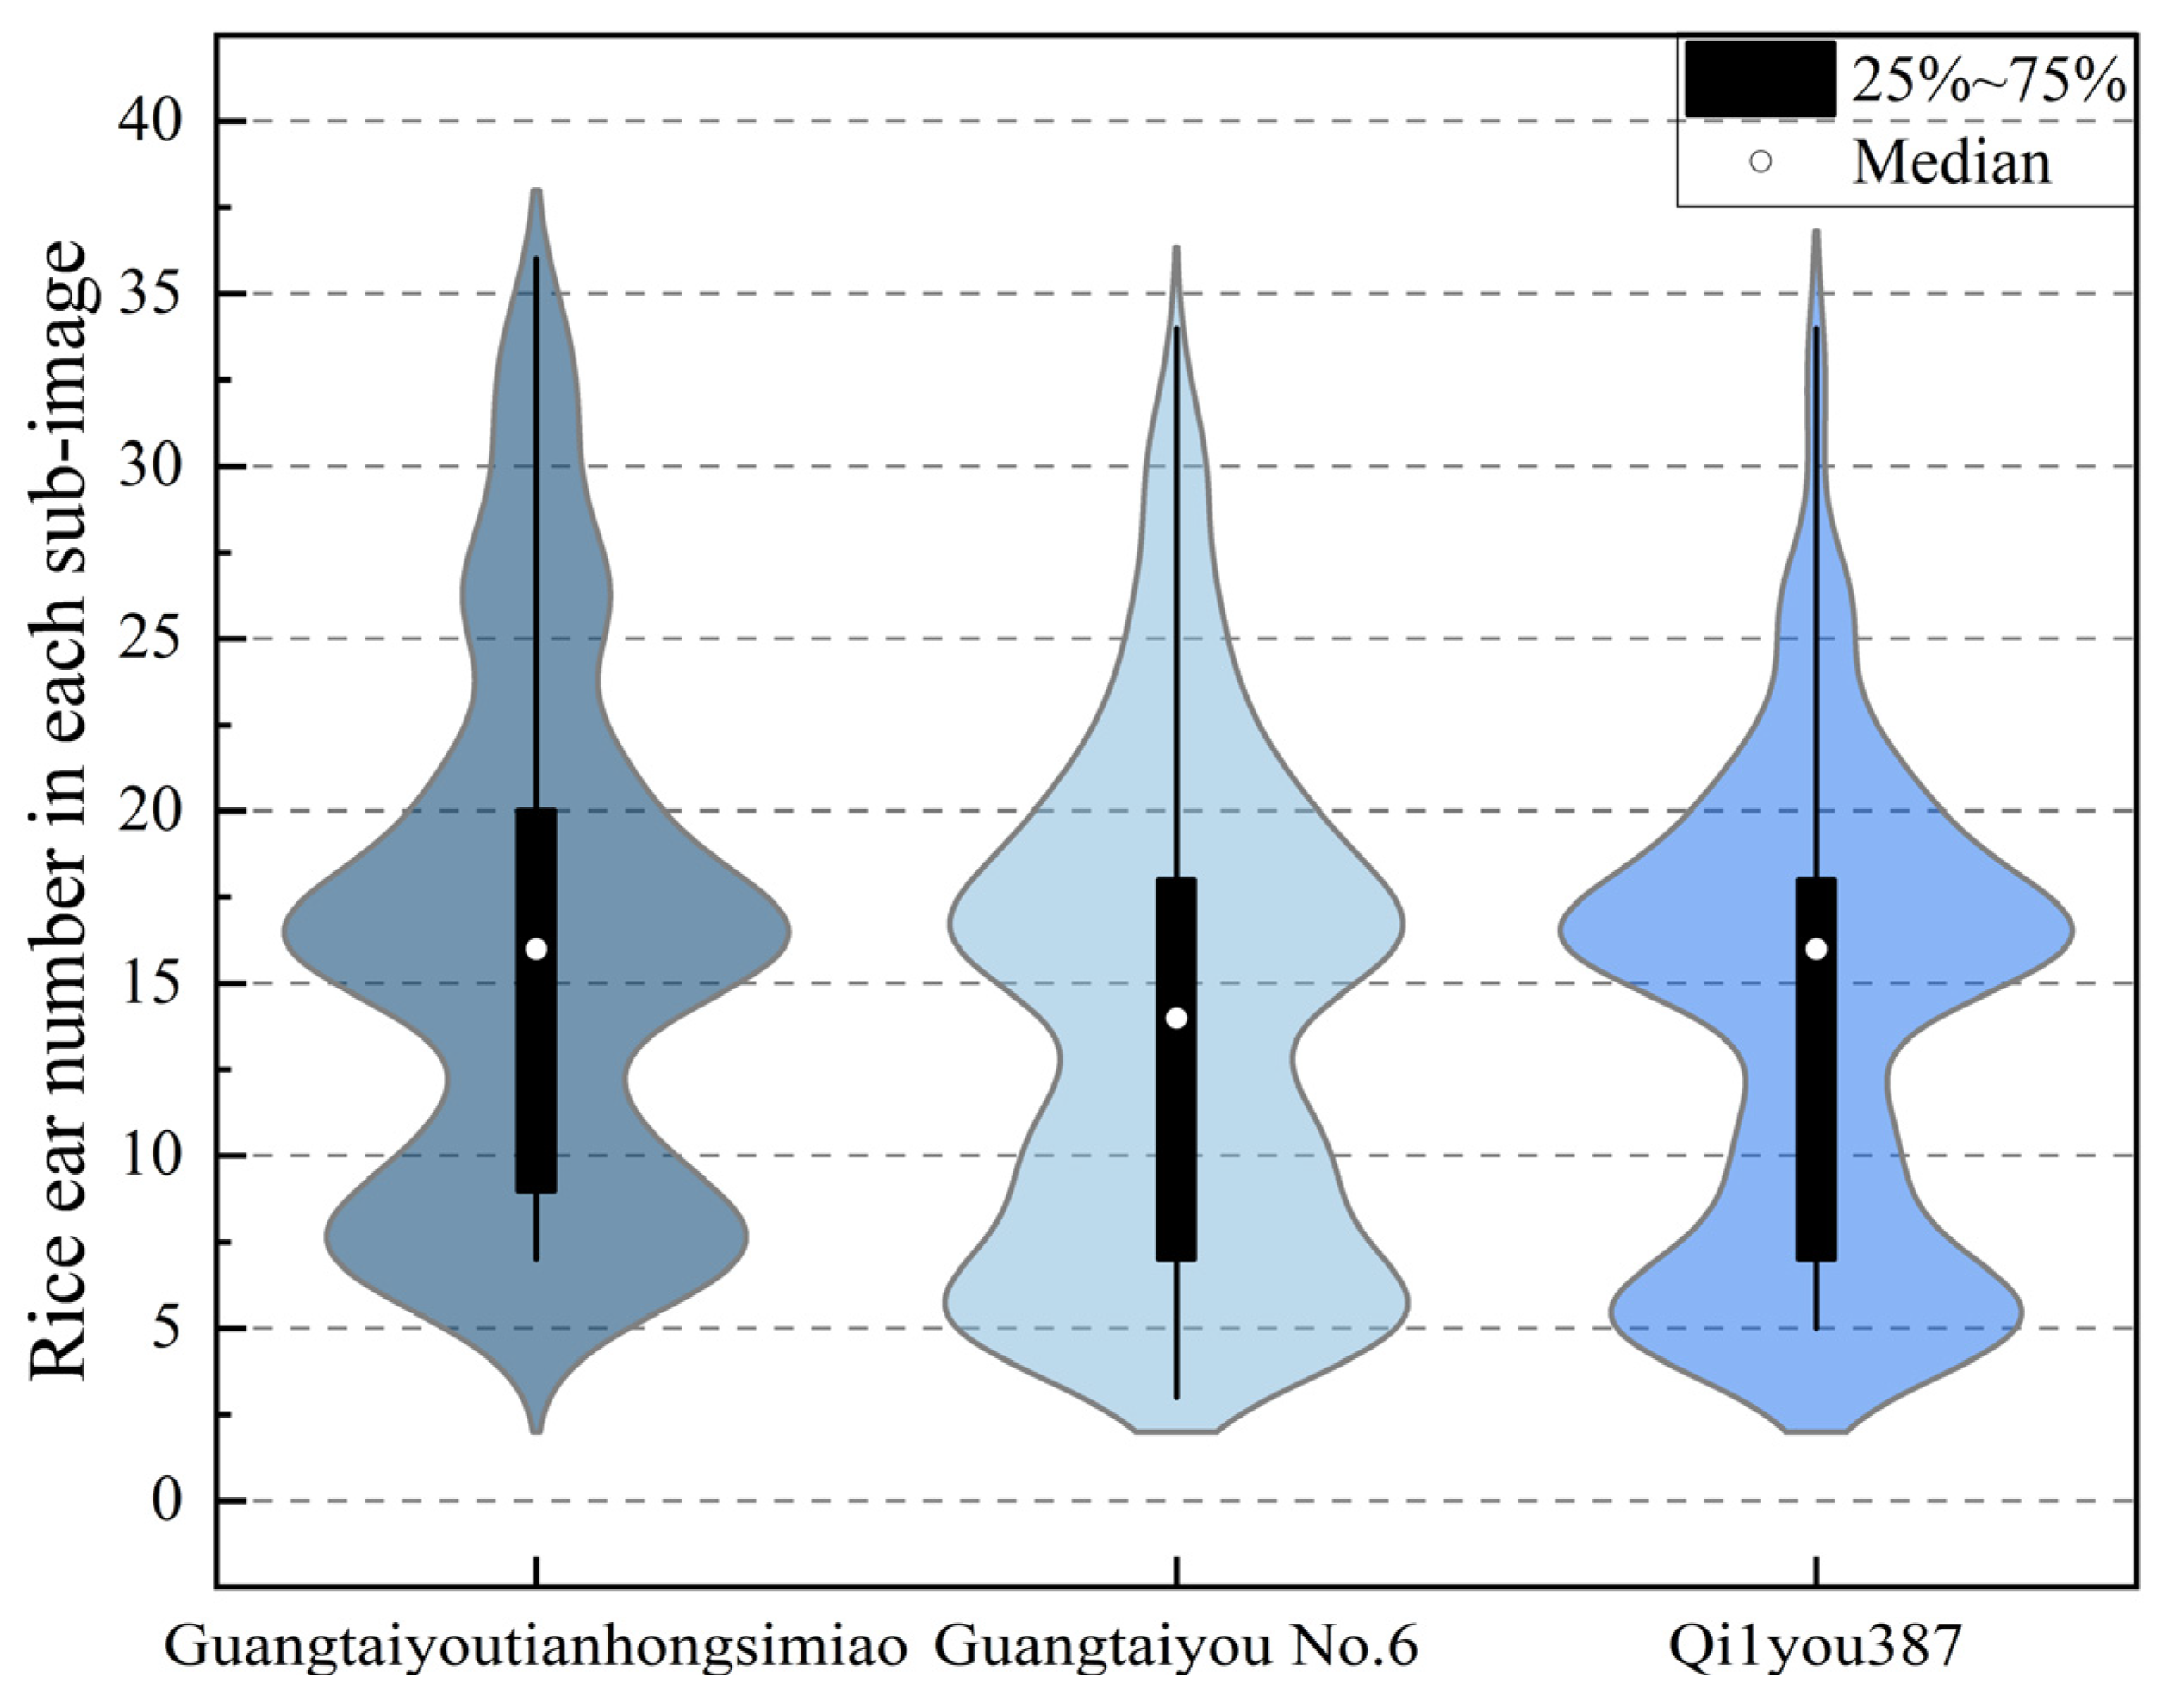
Field data processing involves image cropping and annotation. The central portion of UAV images is initially captured at a resolution of 4032 × 3024 pixels, owing to the distortion present at the edges. To enhance computational efficiency and expedite model training, each image is divided into 32 sub-images measuring 504 × 504 pixels (Figure 1b). After image cropping, the number of rice ears in each image ranges from 1 to 37. Specifically, 125 and 132 original images were collected at the heading stage and filling stage, respectively, for a total of 257 images. After image cropping, 2863 images were selected during the heading stage, and 1462 images were selected during the filling stage, for a total of 4325 images as the dataset, which was named UAVR. Figure 2 shows the violin plot of the rice ear number in each sub-image of three varieties. The images have been split into a training set, validation set, and test set in an 8:1:1 ratio.
Due to the complexity of the field environment, manual annotation of rice ear images is very challenging. The LabelImg (Tzutalin, https://github.com/tzutalin/labelImg) (accessed on 5 December 2024) tool under the Ubuntu system was used to manually annotate the rice ear images. The smallest external rectangular frame was used to frame the independent rice ears in the image. We focused on the detection and counting of rice ears, with all rice ears in the dataset labeled as the same category. The annotation dataset was saved as a txt file in YOLO format.

2.2.2. Data Augmentation

Data augmentation serves as a simple and effective method to reduce overfitting and enhances the generalization and robustness of the model [23]. This research employs the imgaug data augmentation toolbox to augment the original rice ear dataset, allowing the simultaneous transformation of both the image and the label bounding box. The employed data augmentation techniques consist of Gaussian blur, flip horizontal, flip vertically, cutout, and random brightness (Figure 1e). Image flipping enhances the robustness and detection performance of the model. Blurring can weaken background interference and guiding the model’s attention to the outline and detailed features of the target. Cutout simulates the occlusion issue of rice panicles, while brightness adjustment reduces the effects of brightness deviation caused by ambient light changes on the model.

2.3. Other Datasets

The DRPD dataset [15]. The dataset comprises UAV images of rice ears across various varieties and growth stages from three altitudes across multiple geographical locations. The resolution of all images is 512 × 512 pixels, consistent with this study; thus, they were chosen to assess the model’s generalization. It involved the random selection of 200 training images and 220 test images from the dataset compiled by 7 m to maintain comparability and consistency in the results.
The MrMT dataset [24]. This dataset comprises images of corn tassels captured under various lighting and weather conditions and growth stages across multiple geographic locations. Since corn tassels resemble dispersed rice ears, they were chosen to assess the model’s generalization. It involved the random selection of 230 training images and 280 test images under various conditions from the dataset.
The GWHD dataset [25]. This dataset comprises images of wheat ears from various varieties and growth stages across multiple geographic locations. Since wheat ears display morphological and distributional similarities to rice ears, they were chosen to assess the model’s generalization. It involved the random selection of 210 training images and 230 test images under various conditions from the dataset.

2.4. YOLOv8 Algorithm Principle

Detection of rice ear images necessitates rapid and precise identification. Therefore, we selected the YOLOv8 s model, which demonstrates balanced performance in accuracy and speed within the single-stage target detection algorithm, and made improvements on this model. The network structure, shown in Figure 3, consists of three primary modules: the backbone feature extraction network, the neck network, and the output head. The backbone mainly uses three modules, CBS, C2f, and SPPF (spatial pyramid pooling fast) [26], to extract features from the input image. The neck network uses a Feature Pyramid Network (FPN) [27] and Path Aggregation Network (PAN) [28] structure to fuse the features extracted from the backbone. The head network produces detection outcomes for targets of varying sizes utilizing three detection heads, informed by the loss function and the integrated image features.

2.5. Improvement of YOLOv8

The rice ear images captured by UAVs have issues such as a wide target scale variation, close distribution of rice ears and leaves with mutual occlusion, and a complex background. We introduce an enhanced YOLOv8 model, named REU-YOLO. In REU-YOLO, the Additive Block and CGLU [29] modules were integrated into all C2f modules, resulting in the AC-C2f module, which effectively captures contextual information across various regions to extract significant features of rice ears. The SPPF module in the backbone was replaced with the SPPFCSPC_G module to enhance the model’s capacity for recognizing occluded rice ears. Furthermore, in order to reduce the loss of shallow positional information, an MBiFPN was developed to dynamically fuse features across different levels through multi-branch information integration. The Inner-PloU loss function is introduced to enhance adaptation to the bounding box of rice ears in complex field environments.

2.5.1. Improved Feature Extraction Module AC-C2f

The distribution of rice ear targets in UAV images is uneven and intertwined, meanwhile variations in density distributions and growth stages result in multi-scale differences in rice ears. The surrounding background is complex, containing numerous similar objects, such as leaves and weeds with comparable colors, which complicates feature extraction and severely impedes rice ear detection. YOLOv8 uses the C2f module for feature extraction, but it has limitations in the capacity to capture long-range image dependencies by combining contextual information.
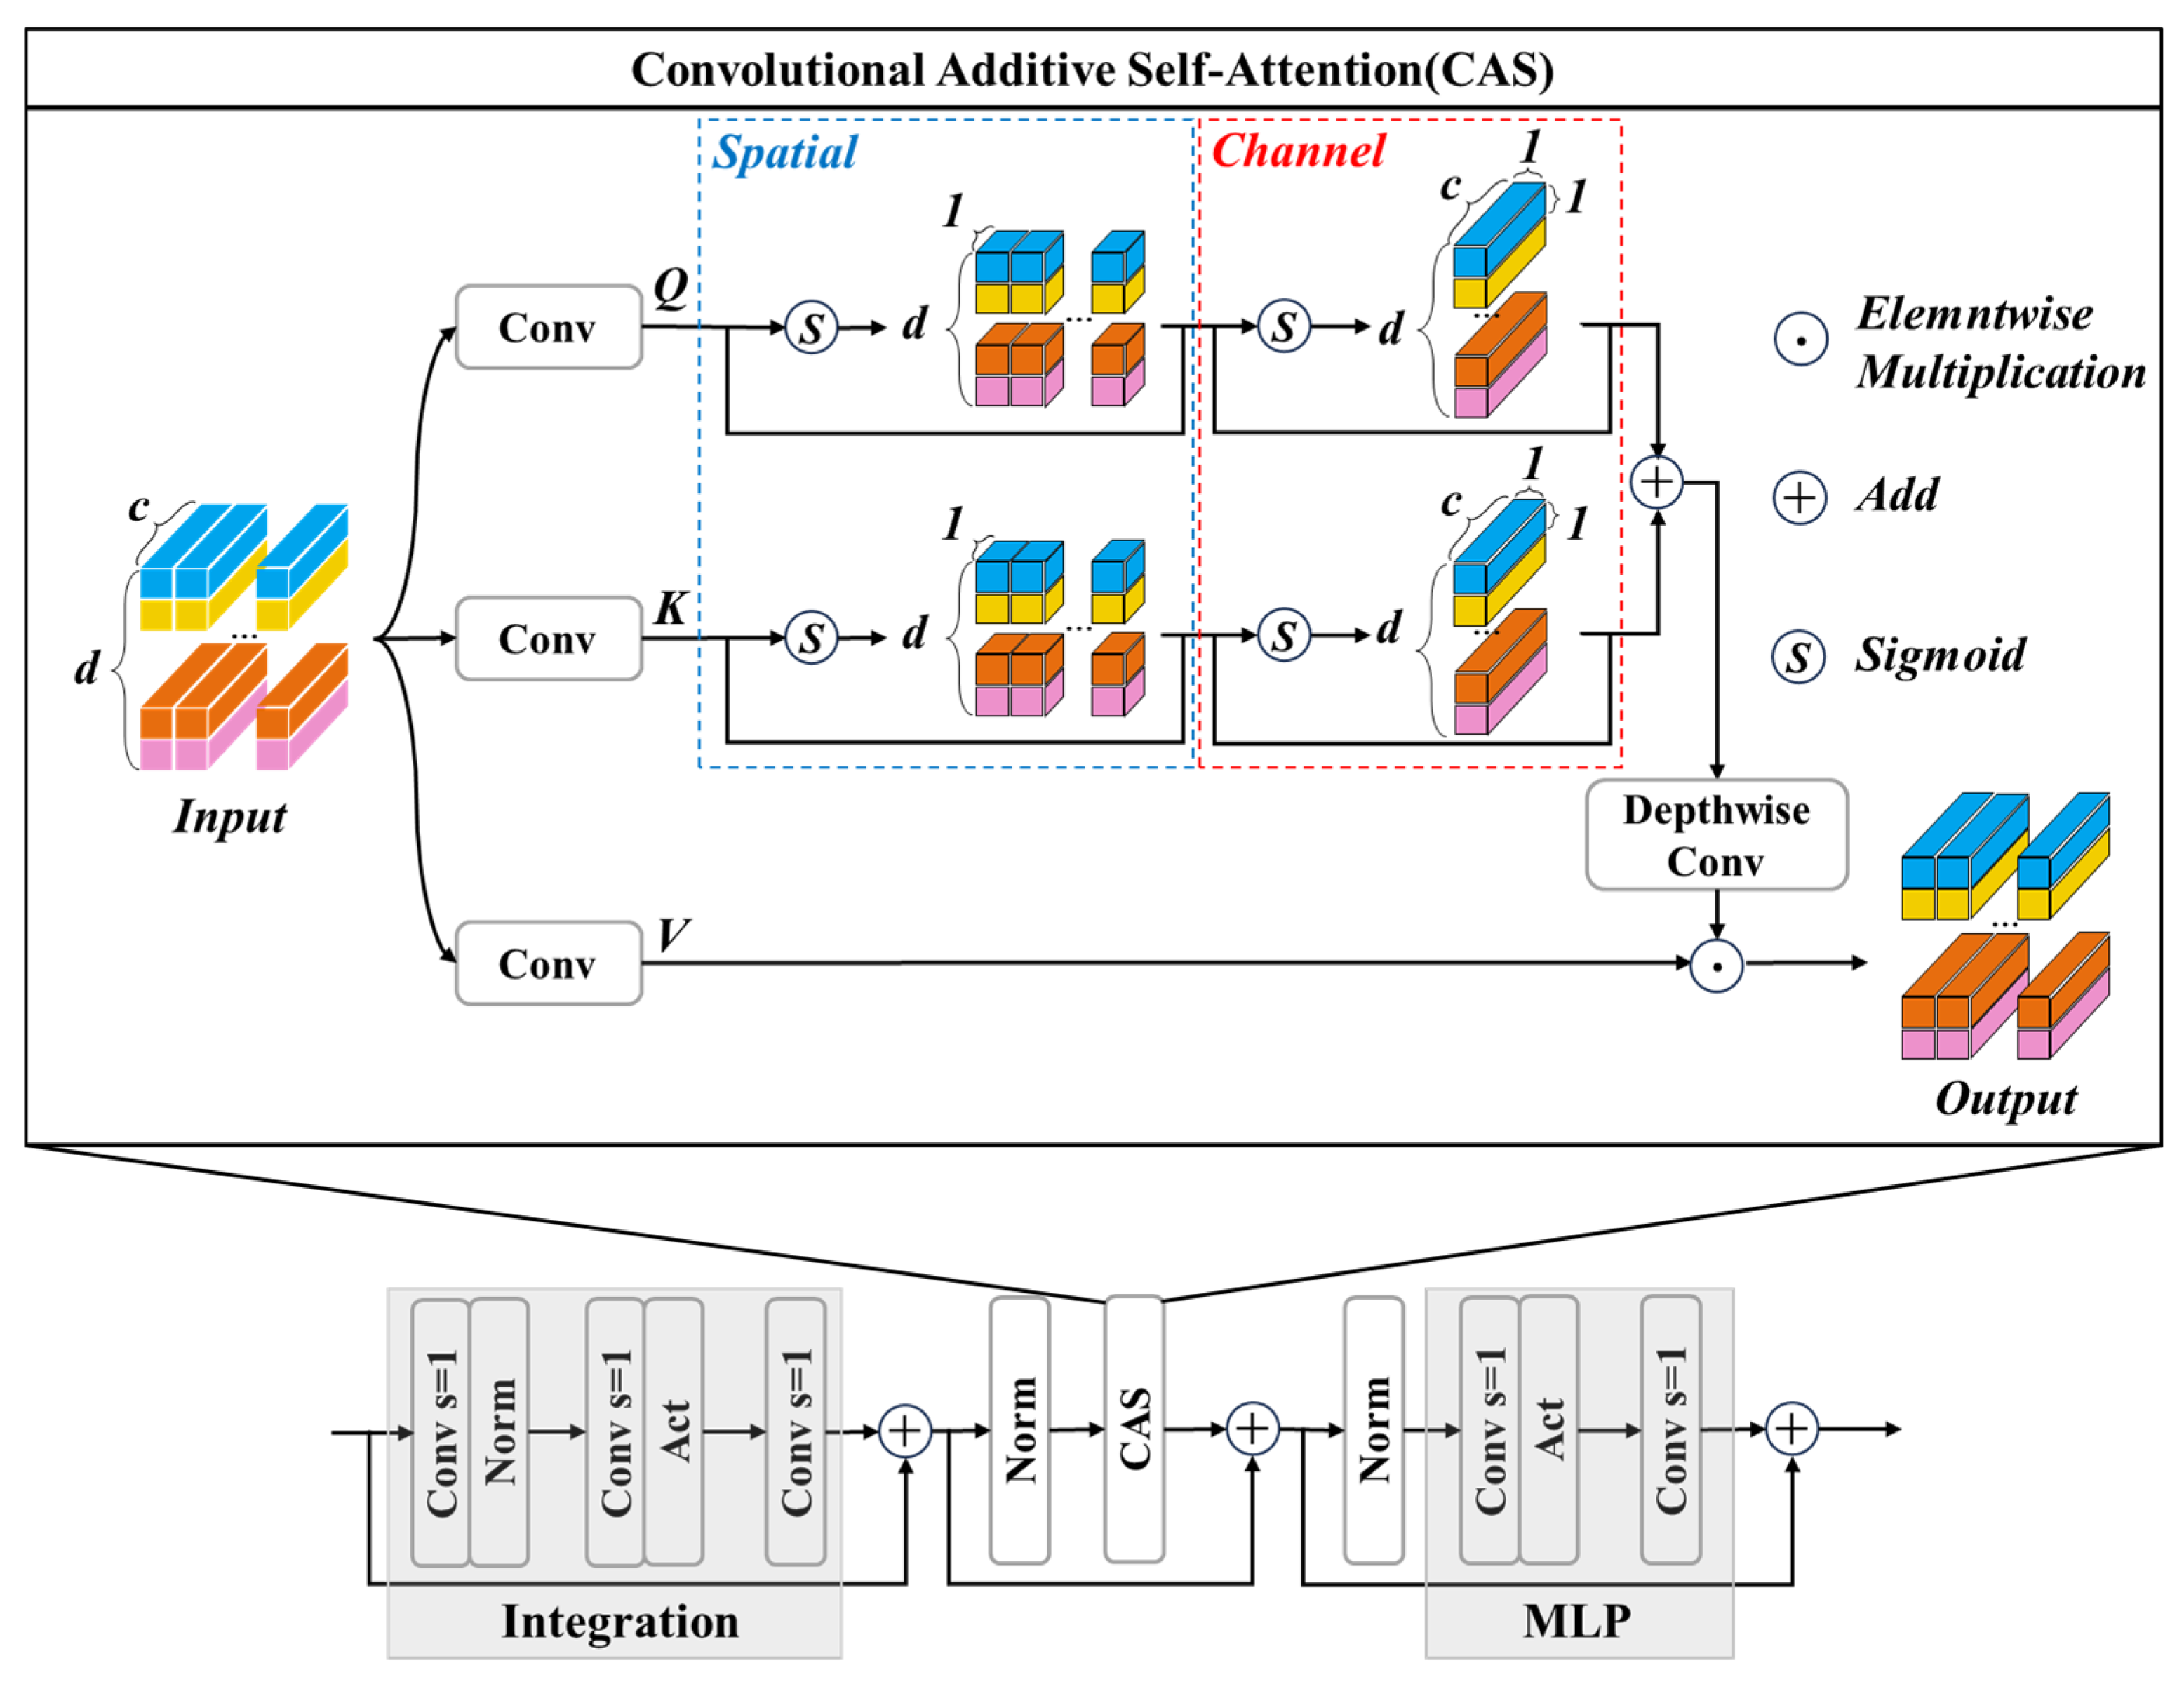
The self-attention mechanism effectively captures contextual information across various regions of the image by analyzing the global information of all pixels present. The mechanism can adaptively modify attention weights, enhancing recognition capabilities for complex images. It can dynamically adjust the attention weight based on input image characteristics and enhance recognition ability for complex images. However, this adaptability also leads to increased complexity and global information imbalance within the self-attention mechanism. We introduce the Additive Block in CAS-ViT [30], which includes three parts with residual shortcuts: Integration, Convolutional Additive Self-attention (CAS), and Multilayer Perceptron (MLP). The structure is shown in Figure 4. Among them, CAS uses convolution as a linear transformation to capture the global contextual relationships in the spatial and channel dimensions of Query and Key, enhancing the model’s ability to capture long-range image dependencies while reducing complexity.
The operational principle involves initially using 1 × 1 convolution for linear feature mapping on the input, followed by feature mapping through WQ, WK, and WV to derive the Query (Q), Key (K), and Value (V) matrices, which are calculated as follows:
Q = W Q × i n p u t , K = W K × i n p u t , V = W V × i n p u t
The context mapping function Φ(·) is developed through the integration of Sigmoid-based channel attention C(·) and spatial attention S(·). The spatial and channel domain information of Q and K are combined through the additive similarity function to obtain the global contextual information. The formula for calculation is as follows:
S i m Q , K   =   Φ   +   Φ K   s . t .   Φ Q   =   C S Q
Then, a 3 × 3 deep convolution is used as a linear transformation to integrate the contextual information. Ultimately, the value matrix V is multiplied with the result, with the following output:
O u t p u t   =   C o n v S i m Q , K V
The CAS module uses Element-wise Multiplication and Sigmoid to handle complex operations like matrix multiplication and Softmax, thereby facilitating efficient reasoning while being lightweight.
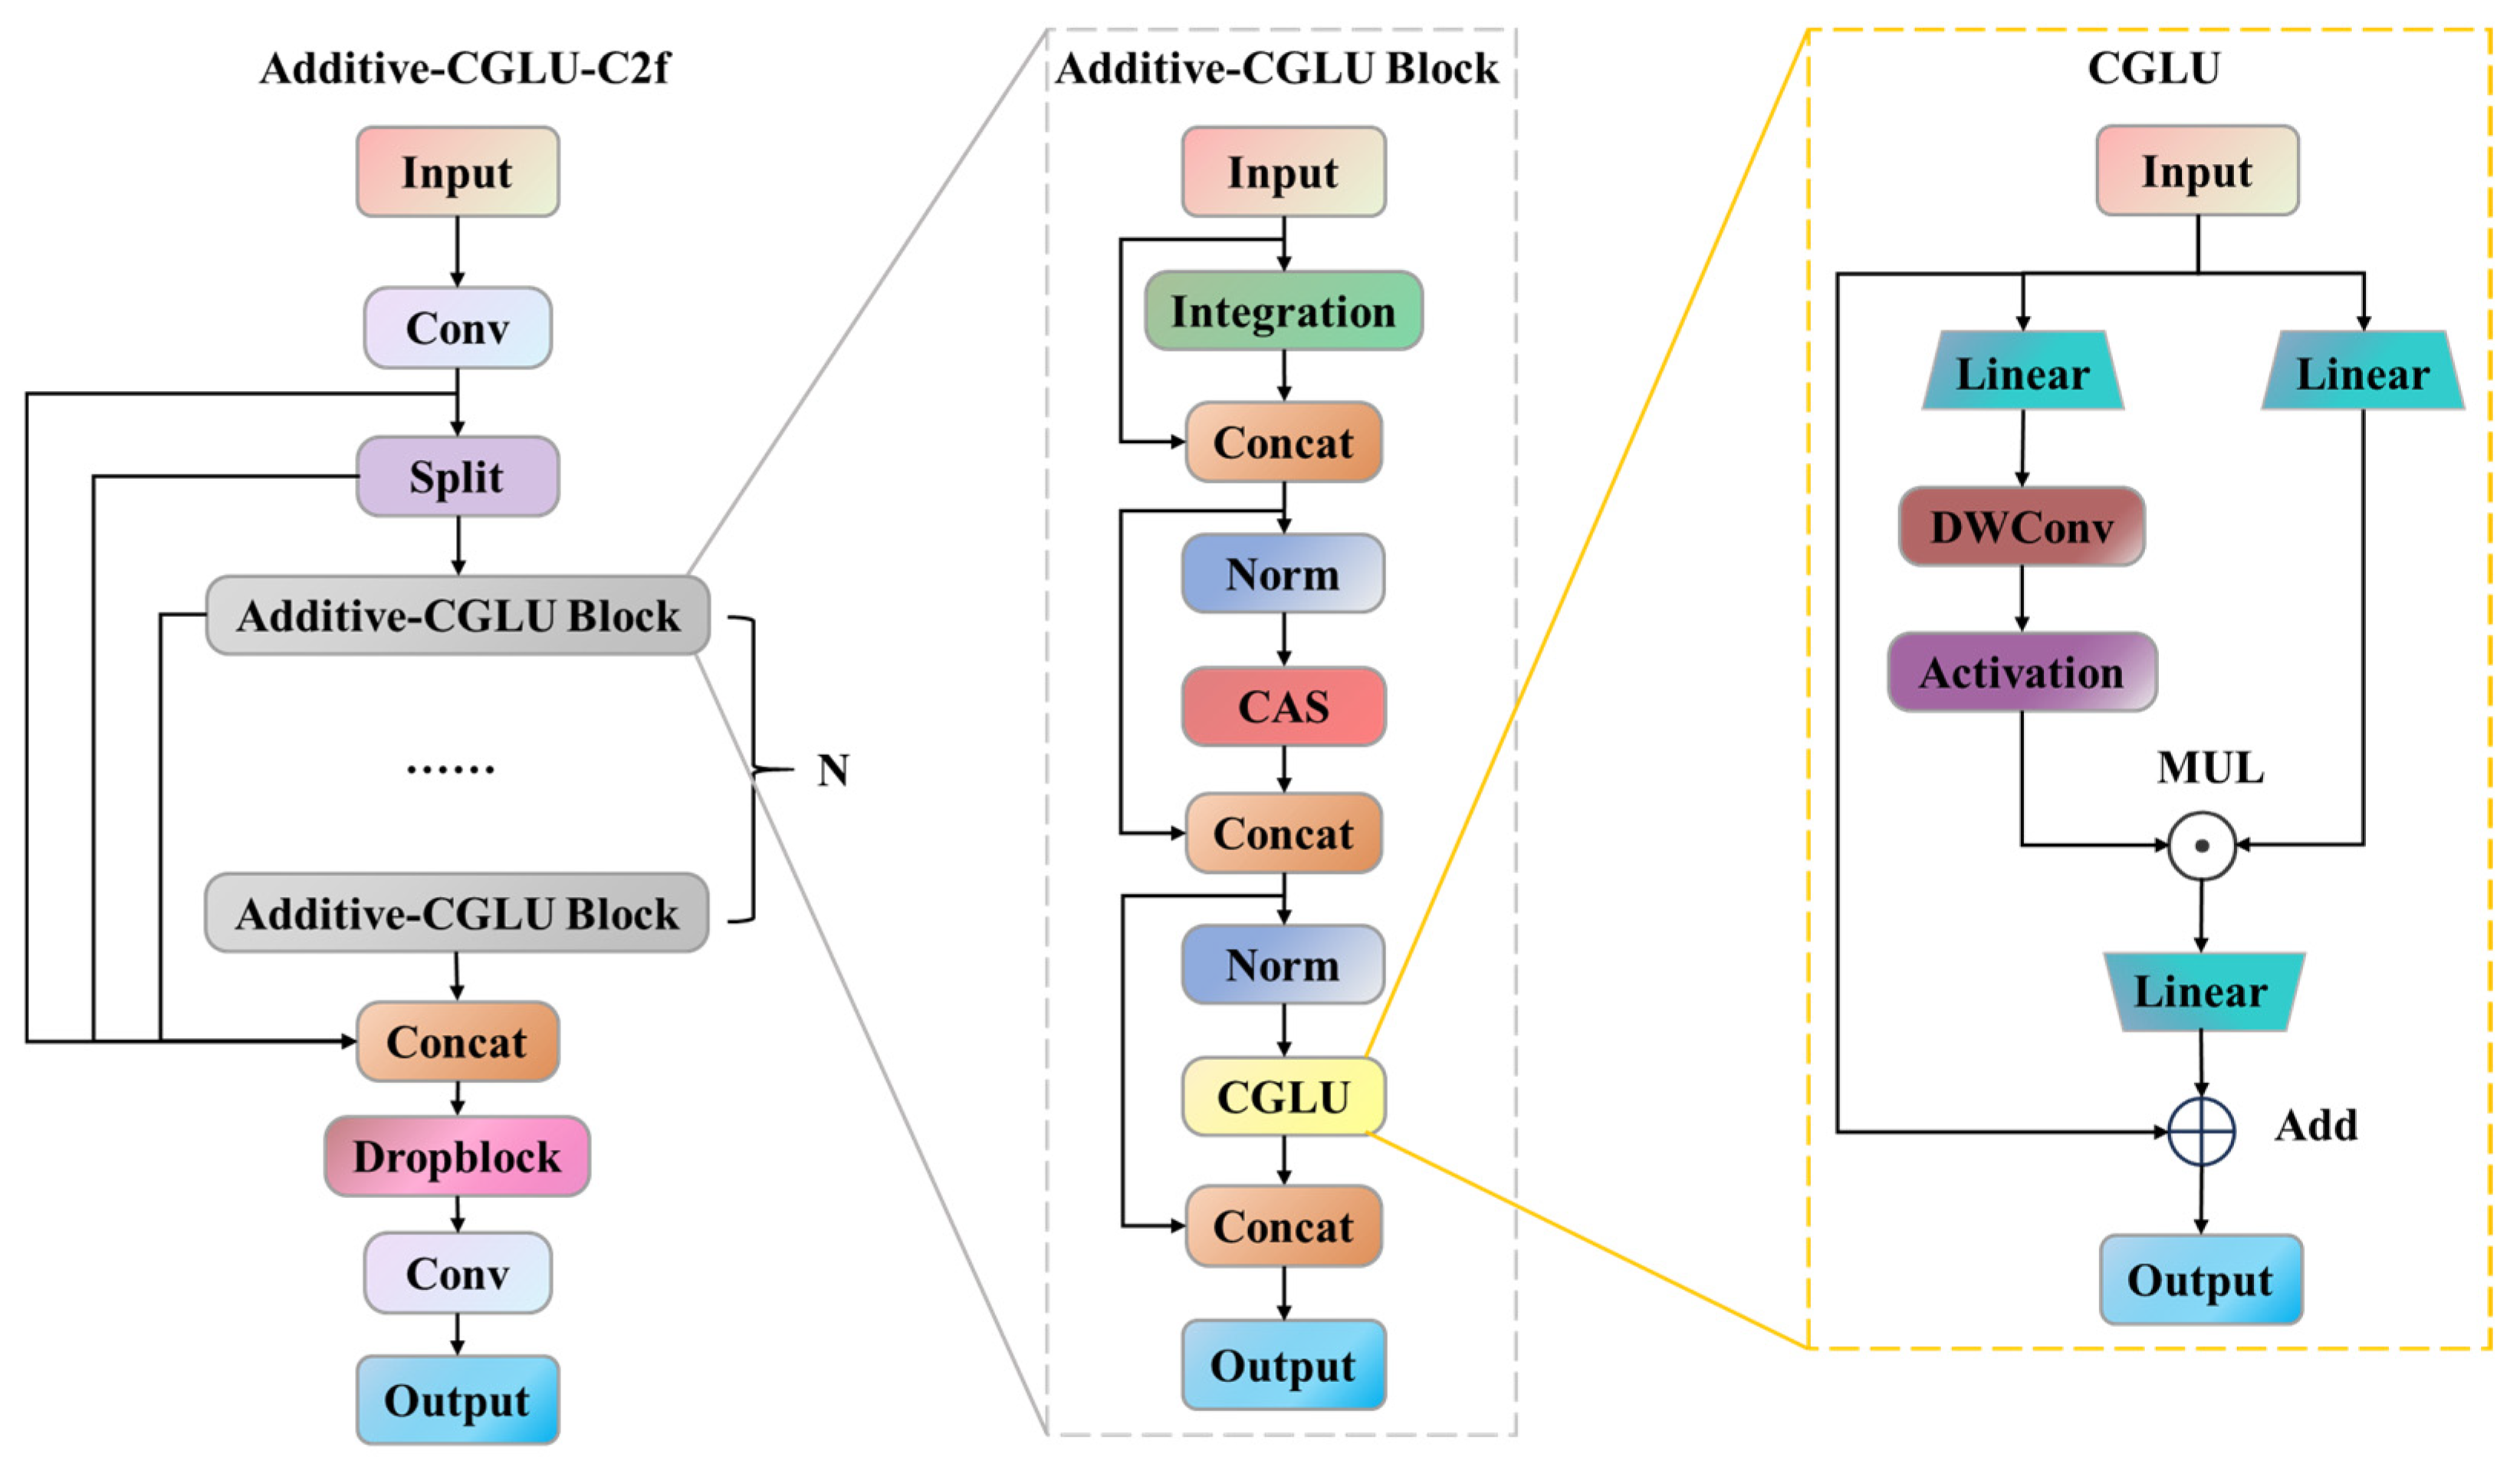
In addition, CGLU is integrated into Additive Block. CGLU functions as a channel mixer by incorporating a 3 × 3 deep convolution behind the activation function of GLU gated branch. This modification transforms it into a gated channel attention mechanism that uses nearest neighbor features, thereby enhancing both the computational speed and robustness of the model. In summary, we integrate the Additive Block and CGLU concepts into the C2f module, replacing the bottleneck with the Additive-CGLU Block, and incorporate Dropblock following the Concat layer to reduce overfitting. The AC-C2f module has been formed, and its structure is shown in Figure 5.

2.5.2. Spatial Pyramid Pooling with Cross Stage Partial Convolutions

The SPPF module in YOLOv8 s conducts pooling operations on feature maps from various dimensions to enhance the receptive field. The fixed size (5 × 5) of the maximum pooling operation in SPPF limits the model’s adaptability to targets of different scales. This method fails to sufficiently capture the complex and diverse spatial characteristics of rice ear targets. UAVs are significantly influenced by various factors, including weather conditions, light intensity, and leaf occlusion during rice ear detection tasks. Consequently, the SPPFCSPC_G module replaces the original SPPF module in the YOLOv8 s model, as shown in Figure 6. The module uses group convolution as replacement for the ordinary convolution. It divides the input channels into multiple independent groups and conducts convolution operations on each group individually, which decreases the module parameters while maintaining the representational capacity of the network. This module separates the features extracted from Backbone into two branches. One branch uses multiple group convolutions to conduct fine-grained processing on the features, then improves feature extraction abilities by the SPPF module to capture multi-scale information within the image. The other branch uses the cross-stage partial connection (CSPC) optimization strategy. Original feature information is better preserved through 1 × 1 group convolution, and feature reusability is enhanced [31]. Finally, the two branches are spliced and fused, with the addition of a convolution module to integrate the deep and shallow features effectively, thereby enhancing the model’s capacity to comprehend complex scenes.
The SPPFCSPC_G module enables cross-scale feature fusion, enhancing the model’s capacity to capture contextual information. Under conditions of occlusion, it can more effectively extract the complicated spatial distribution and morphological features of rice ears, thereby offering robust algorithmic support for rice ear detection tasks in complex field environments.

2.5.3. Multi-Branch Bidirectional Feature Pyramid Network

The neck component of YOLOv8 utilizes the FPN + PAN architecture. Due to the irregular shape and size of rice ears in the field, significant occlusion phenomena occur. In addition, image shearing leads to incomplete small target rice ears, resulting in substantial loss of small target information during the transmission process of UAV rice ear images.
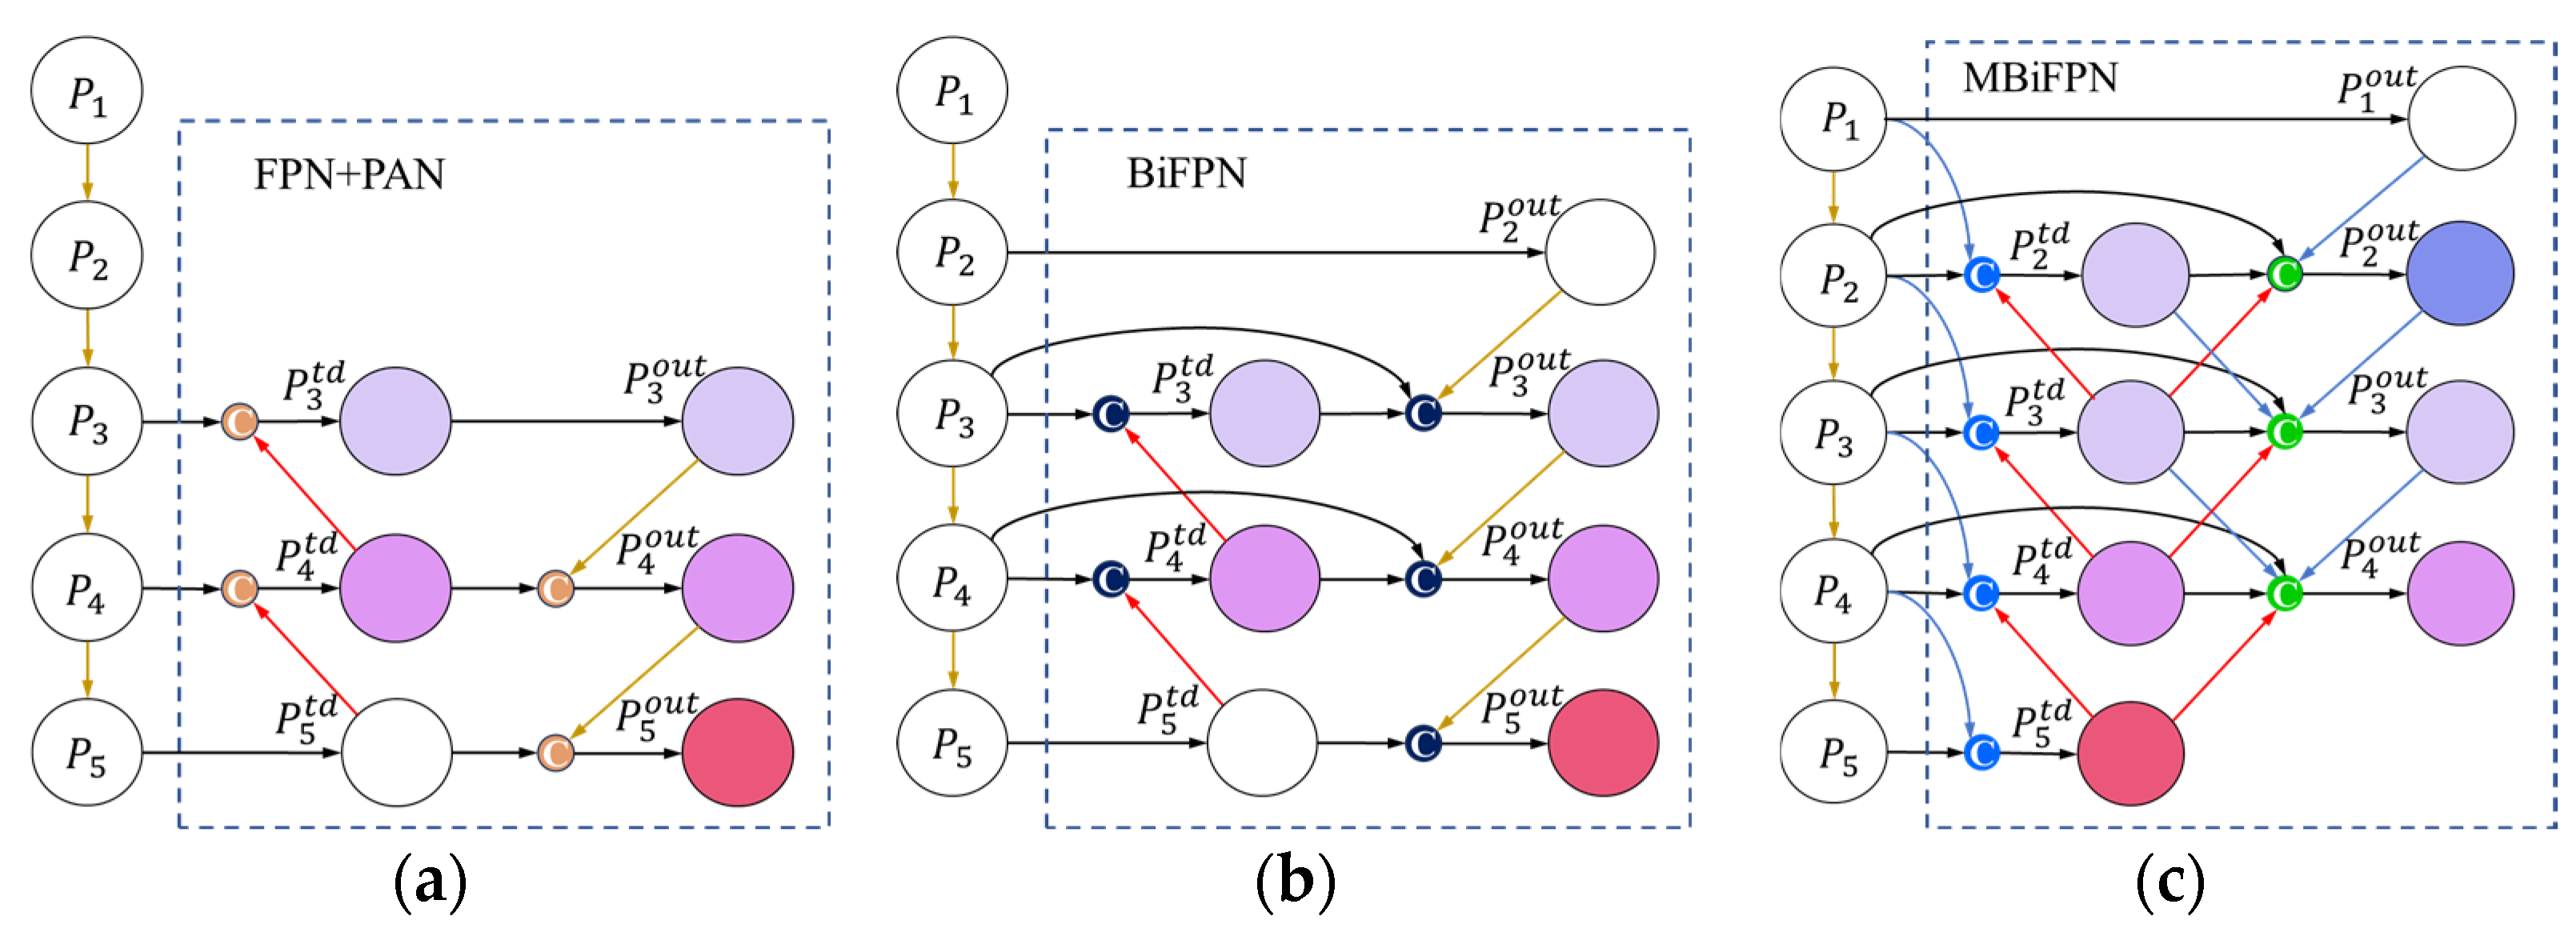
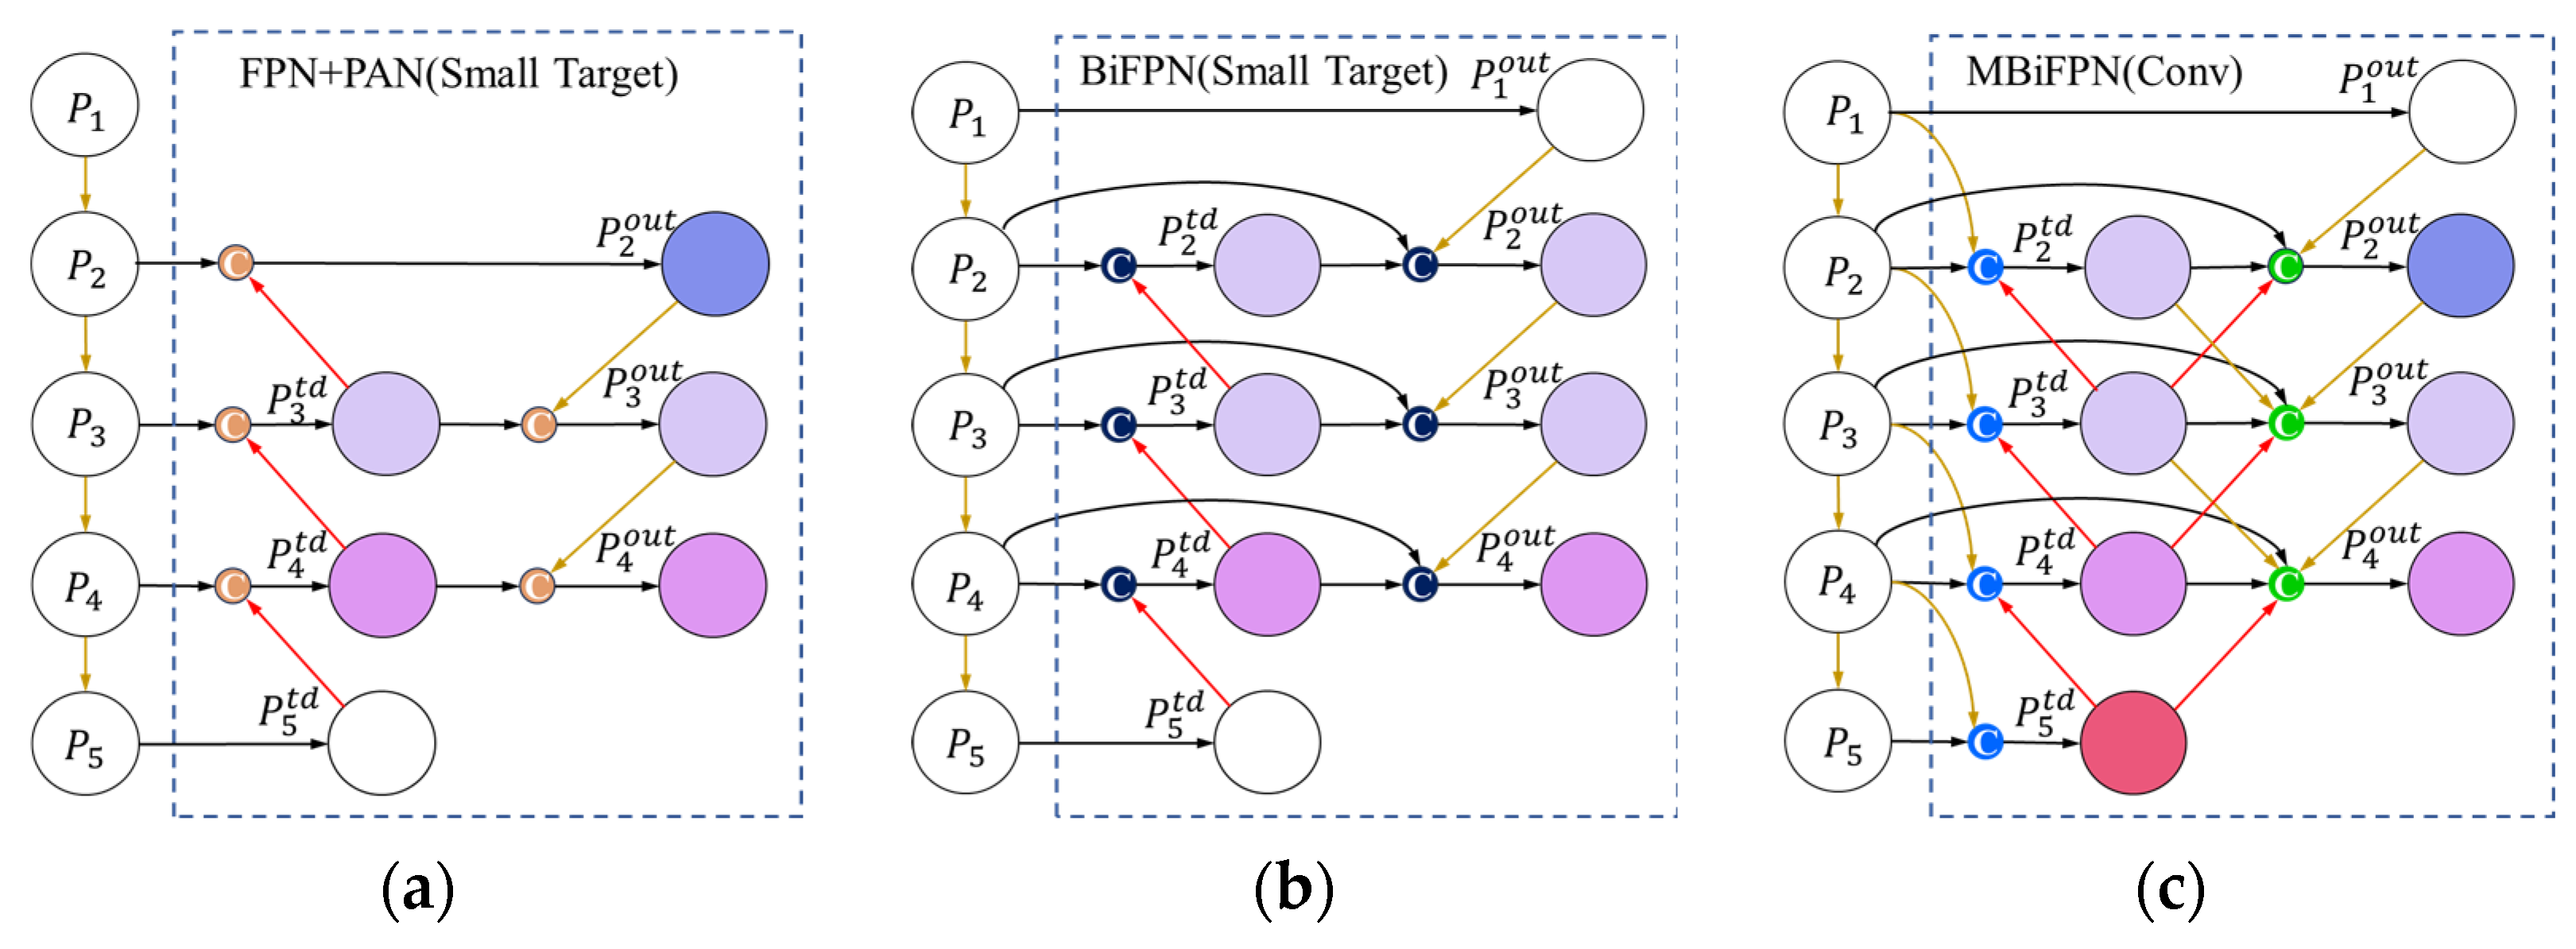
We introduce the Bi-directional Feature Pyramid Network (BiFPN) as a solution to the above problems, with its structure illustrated in Figure 7b. BiFPN uses bidirectional fusion to concurrently transmit deep semantic and shallow positional information, integrate feature data across various scales [32], and create bidirectional links between feature maps of identical scales, thereby effectively mitigating feature information loss. It creates bidirectional connections among feature maps of identical scale, effectively alleviating the issue of feature information loss. BiFPN also introduces a weighted feature fusion method that enables adaptive adjustment of feature contributions through learned weights. We developed a Multi-branch Bidirectional Feature Pyramid Network (MBiFPN) based on the BiFPN to optimize the utilization of features extracted by the backbone network, as shown in Figure 7c. To address the challenges caused by image cutting and occlusion on small target rice ears, an upsampling layer is added into the neck to obtain a 160 × 160 feature map. The detection head scales are configured at 160 × 160, 80 × 80, and 40 × 40, which allows a more precise distinction of small targets and detailed information.
The design of the feature fusion mechanism necessitates the preservation of shallow spatial details from the backbone, which is crucial for enhancing the detection performance for small targets. Although the backbone network can extract fundamental features, this information is susceptible to noise interference. In pursuit of this objective, we developed the UBiConcat module, as illustrated in Figure 7d, which uses the weighted feature fusion method of BiFPN. This module dynamically integrates high-resolution shallow features with deep features through adaptive average pooling, thereby preserving background information and overall feature distribution, while improving the model’s robustness to targets of various scales. The implementation steps are as follows:
P n t d = C o n c a t w n P n + w n + 1 U p P n + 1 t d + w n + 2 A d P n 1 w n + w n + 1 + w n + 2 + ε
where: Pn is the input layer feature. Pntd is the fusion layer feature. ε is a very small non-zero constant, specifically set to 0.0001 in this study to prevent the denominator from equaling zero. Up is an upsampling operation. Ad is an adaptive average pooling operation. wn is a feature fusion learning factor.
The DBiConcat module is designed for deep feature fusion, establishing a bidirectional information interaction channel, as shown in Figure 7e. Multi-branch information integration enables the dynamic fusion of features at various levels, enhancing the representation learning of targets across different scales. The implementation steps are outlined as follows:
P n o u t   =   C o n c a t w n P n + w n + 1 P n t d + w n + 2 U p P n + 1 t d + w n + 3 A d P n 1 t d + w n + 4 A d P n 1 o u t w n + w n + 1 + w n + 2 + w n + 3 + w n + 4 + ε
where: Pnout is the output layer feature.
The MBiFPN effectively integrates multi-scale features, allowing local details from shallow features and global information from deep features to complement one another. This network maintains consistency in global information and transmits contextual information across various levels of abstraction, thus reducing the loss of rice ear information.

2.5.4. Inner-PloU Loss Function

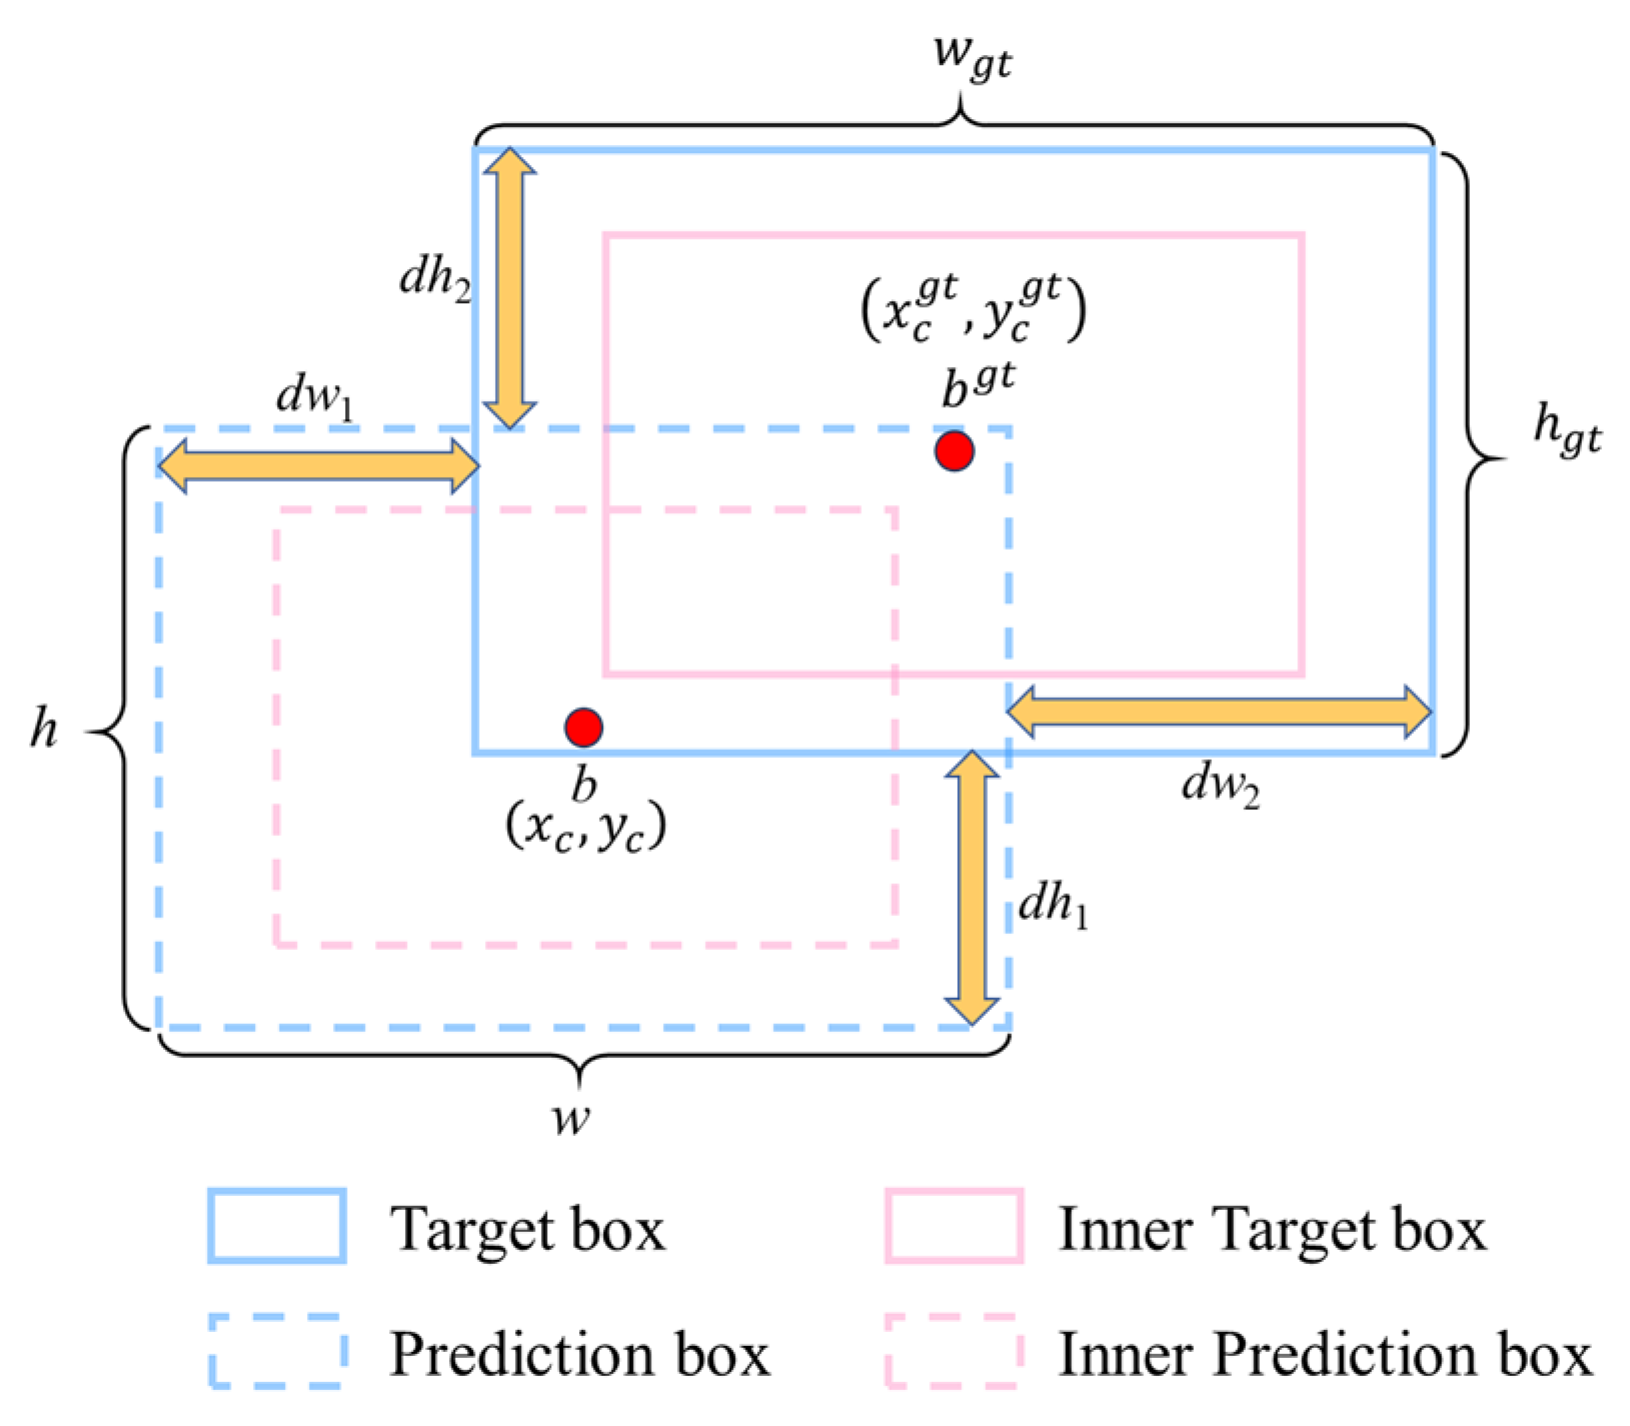
YOLOv8 uses CIoU as the bounding box regression loss function, which initially enlarges the predicted box to enhance its overlap with the target box during the regression process. The morphology of rice ears in the field exhibits significant variation, leading to unstable aspect ratios. The application of aspect ratios as a metric in CIoU may result in excessive penalties for low-quality samples. This further leads to a decrease in the generalization ability of the model, making it unable to adapt well to the complex changes in rice ear shape and occlusion in the field environment. To address the aforementioned shortcomings, we integrate the Powerful IoU (PloU) loss function [33] and the Inner IoU loss function [34] to introduce a new bounding box regression Inner-PIoU loss function for optimization and adjustment, as shown in Figure 8.
PloU provides a more intuitive metric of similarity, effective for both overlapping and non-overlapping boxes. A penalty factor P is defined that adapts to the target size as follows:
P   =   d w 1 w g t + d w 2 w g t + d h 1 h g t + d h 2 h g t / 4
where: dw1, dw2, dh1, and dh2 denote the absolute values of the distances between the edges corresponding to the predicted box and the target box, respectively. wgt and hgt denote the width and height of the target box, respectively.
The penalty factor P is solely related to the dimensions of the target box and is not influenced by the dimensions of the minimal outer box that exists between the predicted box and the target box. Enlarging the predicted box does not impact its performance, thereby enhancing its adaptability to the target size. The formula for calculating the PIoU loss function is as follows:
L P I o U   =   2   I o U e P 2
To improve the capacity for focusing on medium- to high-quality predicted boxes, a non-monotonic attention function u(·) controlled by hyperparameters is integrated with PIoU to obtain the PIoU-v2 loss function, which is calculated as follows:
L P I o U v 2   =   u λ e P · L P I o U   =   3 · λ e P · e λ e P 2 · L P I o U
where: λ is the hyperparameter that controls the behavior of the attention function and takes a value of 1.3.
We introduced the Inner-IoU loss function, which enhances the model’s detection capability for highly overlapping targets. It regulates the generation of auxiliary bounding boxes of various scales through a scaling factor in the loss calculation. The Inner-IoU loss function is defined as follows:
i n t e r   =   m i n b r g t , b r m a x b l g t , b l · m i n b b g t , b b m a x b t g t , b t
u n i o n = w g t · h g t · R 2 + w · h · R 2 i n t e r
I o U I n n e r = i n t e r u n i o n
where: w and h respectively represent the height and width of the predicted box. wgt and hgt respectively represent the height and width of the target box. R is the scaling factor, which is taken as 0.7 in this study.
The vertex angles (bl gt, br gt, bt gt, bb gt) of the inner target box and the vertex angles (bl, br, bt, bb) of the inner predicate box are obtained through the following coordinate transformation:
b r g t , b l g t   =   x c g t + w g t · R 2 , x c g t w g t · R 2
b b g t , b t g t = y c g t + h g t · R 2 , y c g t h g t · R 2
b r , b l = x c + w · R 2 , x c w · R 2
b b , b t = y c + w · R 2 , y c w · R 2
where: xc gt and yc gt respectively represent the center point coordinates of the target box and inner target box, while xc and yc respectively represent the center point coordinates of the predicted box and inner predicted box.
We substitute the IoU in PloU with the concept of Inner-IoU to develop an auxiliary bounding box loss, introducing the Inner-PIoU loss function, defined as follows:
L I n n e r P I o U   =   3 · λ e P · e λ e P 2 · 2 I o U I n n e r e P 2

2.6. Evaluation Metrics

The primary evaluation metrics for assessing the performance of the REU-YOLO model are select precision (P), recall (R), and average precision (AP). AP represents the area under the curve plotted using P against R, with values ranging from 0 to 1. A greater value indicates superior model performance. There is only one category in this study; therefore, mAP is equivalent to AP.
P = T P T P + F P
R = T P T P + F N
A P = 0 1 P R d R
m A P = i = 1 c A P i c
where: TP denotes the count of accurately predicted rice ear targets. FP denotes the count of inaccurately predicted rice ear targets. FN denotes the count of missed rice ear targets. c represents the total number of detected categories. We addresses a single category label, thus c = 1 is taken.
Furthermore, to validate the robustness of REU-YOLO in detecting rice ear images from a UAV, the coefficient of determination (R2), mean absolute error (MAE), and root mean square error (RMSE) were employed as evaluation metrics to assess the model’s counting results against manual counts. The definitions are as follows:
R 2   =   1 i   =   1 n p i m i 2 i   =   1 n p i e i 2
M A E = 1 n i = 1 n p i m i
R M S E = 1 n i = 1 n p i m i 2
where: n denotes the number of rice ear images, while ei denotes the mean number of rice ears. pi and mi respectively represent the ground truth data of manual counting and model prediction in the i-th image. R2 is a statistical measure that indicates the extent of correlation between variables, used to assess the fit between predicted and actual values. Its range is from 0 to 1, with values approaching 1 signifying a superior fit. MAE quantifies the average absolute error between predicted and actual values, providing a clearer representation of prediction accuracy. RMSE assesses the deviation between predicted and actual values, thereby indicating the extent of sample dispersion.

3. Results

3.1. Experimental Environment and Parameters

The REU-YOLO model and all comparison models were trained on servers running the Ubuntu 22 operating system. Software parameters included Visual Studio Code 1.97.2, Python 3.8, Pytorch 1.8.1, and CUDA 11.3. The hardware setup consisted of an Intel(R) Xeon(R) Platinum 8488C CPU (3.8 GHz frequency) (Intel Corporation, Hillsboro, Oregon, USA), an NVIDIA GeForce RTX 4060 (24 GB) (NVIDIA Corporation, Santa Clara, CA, USA), and 512 GB of RAM.
The training parameters for the UAVR dataset are defined as follows: input image size of 640 × 640, initial learning rate of 0.02, weight decay of 0.0005, momentum of 0.937, batch size of 32, optimizer as stochastic gradient descent (SGD), and a training duration of 300 epochs. Furthermore, all other training parameters are maintained at their default configurations. For the remaining three datasets used to assess the model’s performance, YOLO’s built-in data augmentation techniques were employed due to their limited data size. The parameters included a color tone adjustment of 0.01, saturation of 0.5, brightness of 0.2, scaling of 0.5, and left–right image flip of 0.5, alongside open Mosaic. The batch size was adjusted to 4 for the training parameters, while keeping the remaining settings intact.

3.2. Experiments on UAVR Dataset

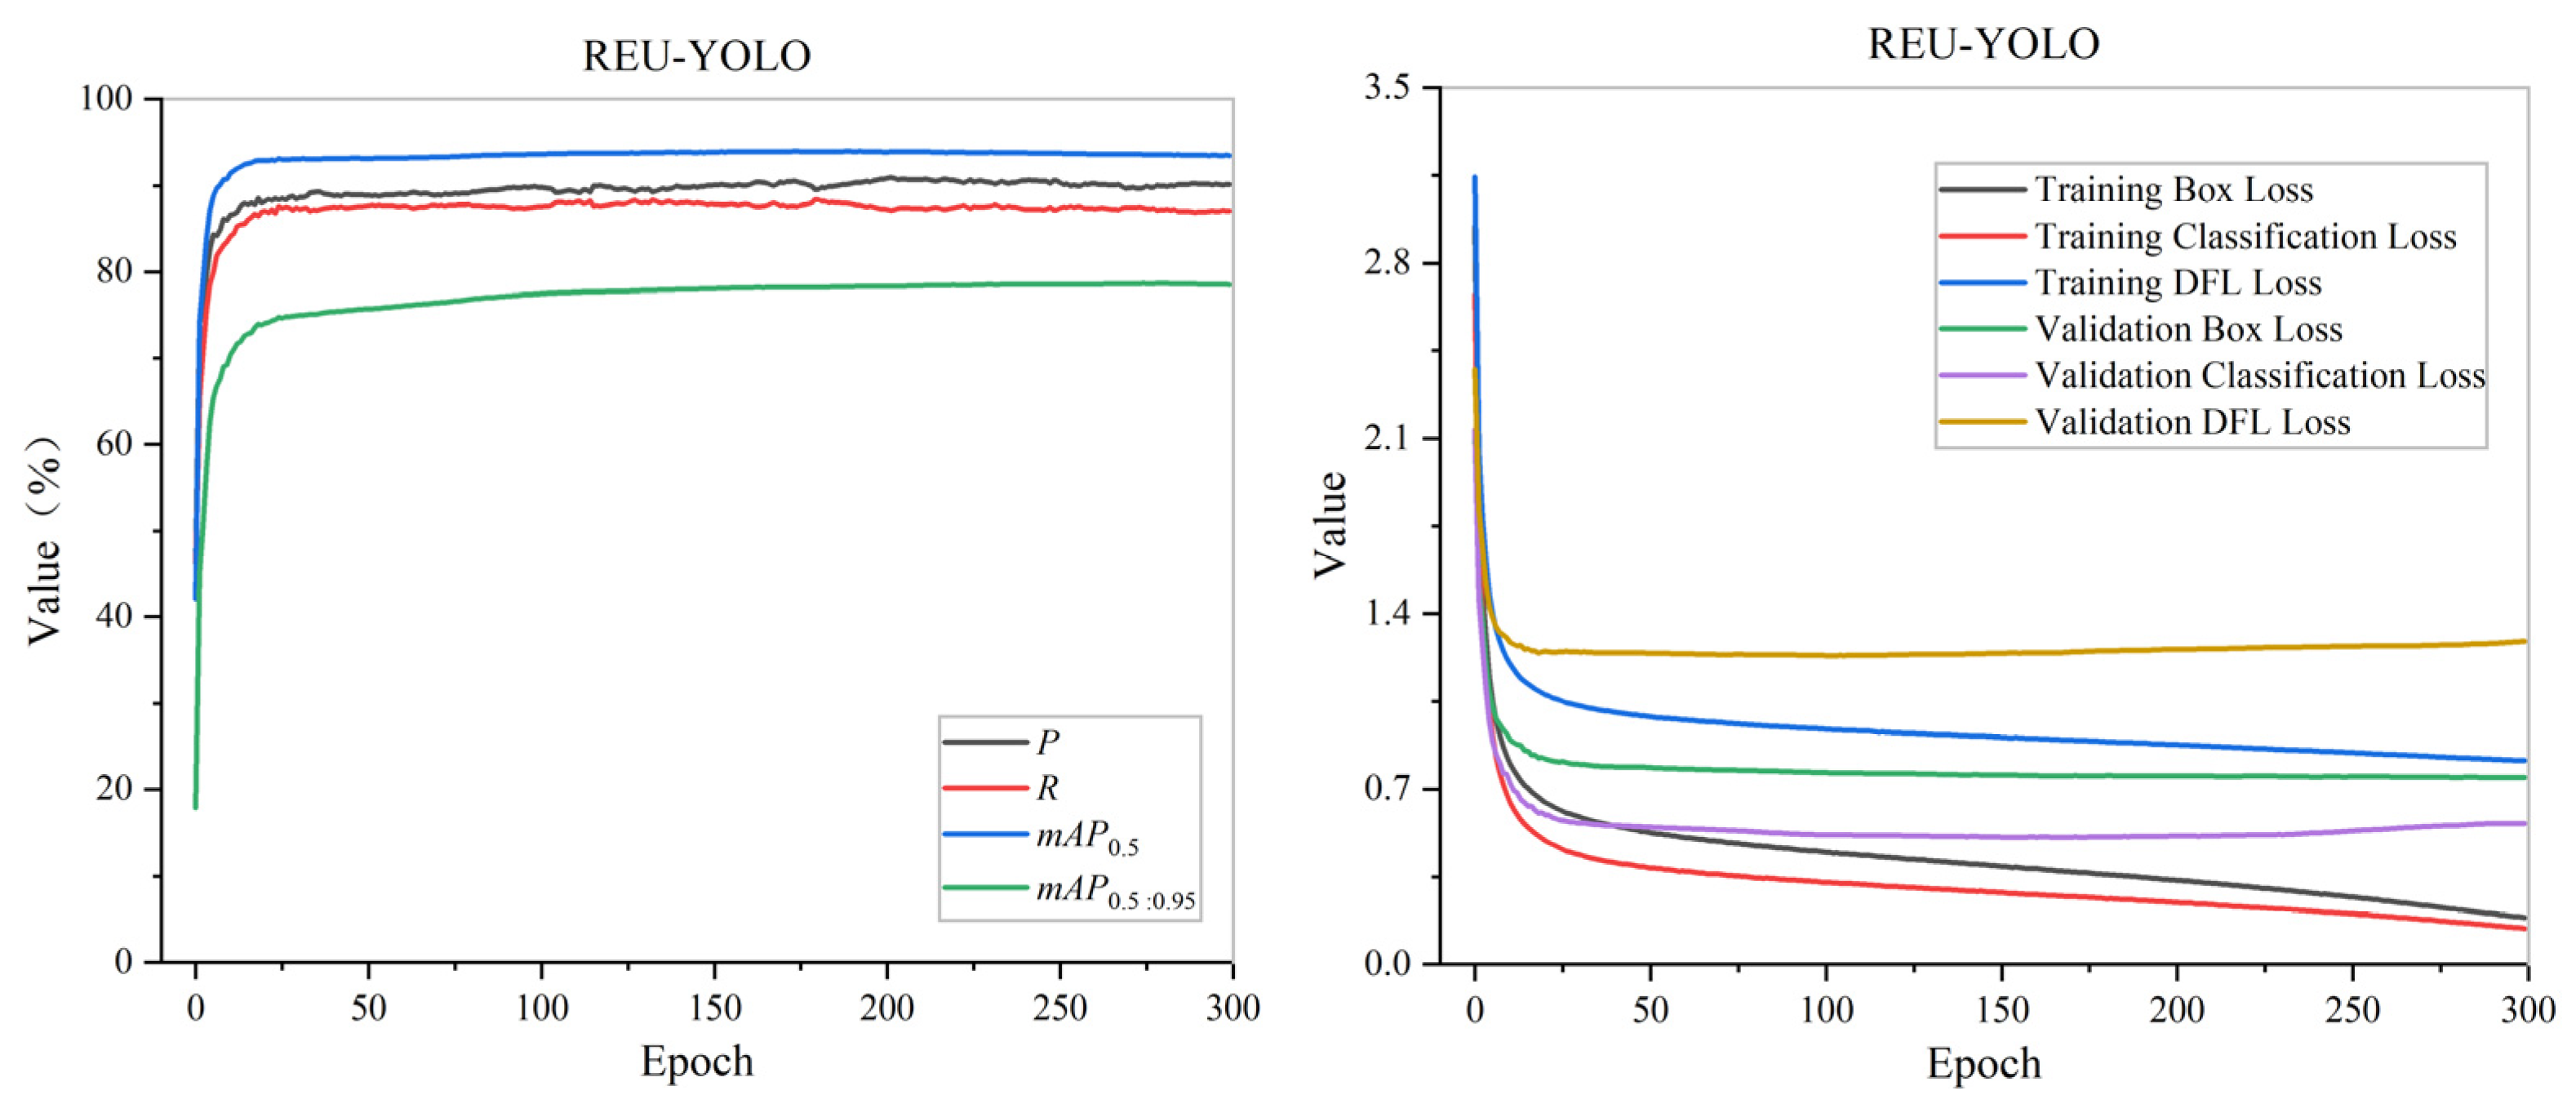
Figure 9 presents the training results for the REU-YOLO model. The P of REU-YOLO is 90.76%, the R is 86.94%, the mAP at IoU 0.5 (mAP0.5) is 93.51%, and the mAP at IoU 0.5:0.95 (mAP0.5:0.95) is 78.45%. Analysis of the training curve indicates that model performance stabilizes after 300 epochs of training. Throughout the training cycle, the model’s loss value consistently declines, while P and R increase concurrently, meaning a progressive enhancement towards optimal performance during the continual optimization process.

3.2.1. Analysis of MBiFPN Performance

We present an MBiFPN that uses adaptive average pooling and upsampling to weight and integrate cross-level features, while incorporating large-scale feature map information to enhance small object detection. Experimental research was conducted on six multi-scale feature fusion networks, including Figure 7a–c and Figure 10, to evaluate the detection performance of MBiFPN based on the previous improvement ideas.
Table 1 illustrates that Model 1, using the original feature fusion network, achieved a mAP0.5 of 93.21% and a mAP0.5:0.95 of 77.33%. This model has a params of 10.45 M and FLOPs of 24.5 G. The original feature fusion network incorporates large-scale feature map information and modifies the network header output to dimensions of 160 × 160, 80 × 80, and 40 × 40. The mAP0.5 and mAP0.5:0.95 for Model 2 respectively improved by 0.15% and 0.77%, alongside a reduction in params by 30.53% and an increase in FLOPs by 21.22%. The dataset comprises numerous small targets. BiFPN is introduced as a feature fusion network. In comparison to the original feature fusion network, Model 3 respectively presented increases of 0.01% and 0.07% in mAP0.5 and mAP0.5:0.95, alongside a 0.02% rise in params and a 0.08% rise in FLOPs. The bidirectional fusion strategy effectively integrates feature information across various scales, enhancing the network’s detection performance for rice ears. Following the incorporation of a small object detection structure into BiFPN, Model 4 respectively presented increases of 0.3% and 0.89% in mAP0.5 and mAP0.5:0.95, while the params decreased by 29.38% and FLOPs increased by 30.61%. This further validates the efficacy of the proposed improvement method. We propose the MBiFPN, which employs adaptive average pooling for downsampling instead of convolution. In comparison to Model 5, Model 6 presented a 0.23% improvement in mAP0.5:0.95, alongside a 0.06% decrease in params and a 0.06% reduction in FLOPs. Adaptive average pooling exhibits scale invariance, allowing the network to effectively manage targets of various sizes and shapes. This technique enhances the retention of contextual information, minimizes the loss of detailed features, reduces params and FLOPs, and mitigates the risk of network overfitting. In comparison to the original feature fusion network, Model 6 presented improvements of 0.4% in mAP0.5 and 1.31% in mAP0.5:0.95, while simultaneously reducing the params by 25.74% and increasing the FLOPs by 31.84%. The comparative experiment of the feature fusion network demonstrates a significant improvement in model accuracy. Despite the increase in FLOPs, there is a significant reduction in the params and the model size. The MBiFPN demonstrates efficacy.

3.2.2. Ablation Experiments

Improvements were implemented in the UAV-based rice ear detection model based on YOLOv8, and the impact of each improvement on the network model was accurately explained. To thoroughly assess the feasibility and effectiveness of AC-C2f, SPPFCSPC-G, MBiFPN, and the Inner-PIoU loss function for UAV-based rice ear detection, YOLOv8 s was chosen as the benchmark model. Ablation experiments were performed by introducing or removing specific components from the REU-YOLO model. The experimental results were employed to validate each enhanced strategy network. Table 2 presents the results of ablation comparison experiments, indicating ‘√’ for the application of the corresponding strategy model and ‘×’ for its absence.
The improved model 4 presented in Table 2 is the REU-YOLO model. The table data demonstrate the effectiveness and feasibility of the proposed method for rice ear detection in UAV images within field environments. In comparison to the original YOLOv8 s model, the assessed parameters P, R, mAP0.5 and mAP0.5:0.95 for the improved model 1 showed increases of 3.78%, 3.04%, 4.41%, and 5.92%, respectively. The results demonstrate that the AC-C2f module enhances the capture of contextual information across various regions through self-attention weighting, thereby maintaining global information consistency and reducing complexity. The introduction of the SPPFCSPC_G module resulted in increases of 0.48%, 0.27%, and 1.66% in the P, mAP0.5, and mAP0.5:0.95 metrics of the improved model 2, respectively. The improved module effectively extracts global features, facilitating the model’s comprehension of contextual information and enhancing accuracy. R experienced a reduction of 0.25%. This is due to the fact that while it decreases false positives, it can also result in poorer performance in certain low-confidence regions. Following the substitution of the feature fusion network with MBiFPN in Model 3, the metrics P, R, mAP0.5, and mAP0.5:0.95 exhibited enhancements of 0.23%, 1.25%, 0.59%, and 0.89%, respectively. These results indicate that MBiFPN effectively preserves the positional and detailed information of rice ears, integrates features across various levels, and enhances model prediction accuracy. The introduction of the Inner-PIoU loss function resulted in improvements of 0.28%, 0.14%, and 0.5% in R, mAP0.5, and mAP0.5:0.95 for Model 4, respectively, although P registered a slight decrease of 0.11%. This indicates that the loss function can effectively reduce excessive penalties on low-quality samples, thereby enhancing the model’s generalization. The introduction of each improved module positively influences model performance, leading to a significant improvement in the detection accuracy of the REU-YOLO model.
Gradient Weighted Class Activation Mapping (Grad CAM) heatmaps are employed to compare and analyze the feature extraction capabilities of the YOLOv8 s and REU-YOLO models, as illustrated in Figure 11. Red and yellow signify areas of high importance, whereas blue and green denote areas of low importance. The heatmap indicates that regions of higher importance significantly influence detection performance. From the figure, it can be seen that the YOLOv8 s model specifically focuses on certain features of rice ears. A high distribution density of rice ears increases the risk of missed and false detections. In addition, the detection of exposed rice ear images with a water background shows that the heat source is not fully concentrated on the rice ears, which indicates that the background environment disrupts the YOLOv8 s model’s performance. The figure demonstrates that the REU-YOLO model indicates a more concentrated attention area, accurately focusing on the heat source associated with the rice ear target. This demonstrates that the improved REU-YOLO possesses superior feature extraction capabilities for rice ears.

3.2.3. Comparison Experiments with Different Detection Models

To thoroughly assess REU-YOLO, we performed comparison experiments with notable one-stage object detection algorithms, including SSD, YOLOv5 s, YOLOv8 s, YOLOv9 s, and YOLOv10 s, by employing P, R, mAP0.5, mAP0.5:0.95, R2, MAE, and RMSE as metrics for assessment. Table 3 displays the comparison experimental results.
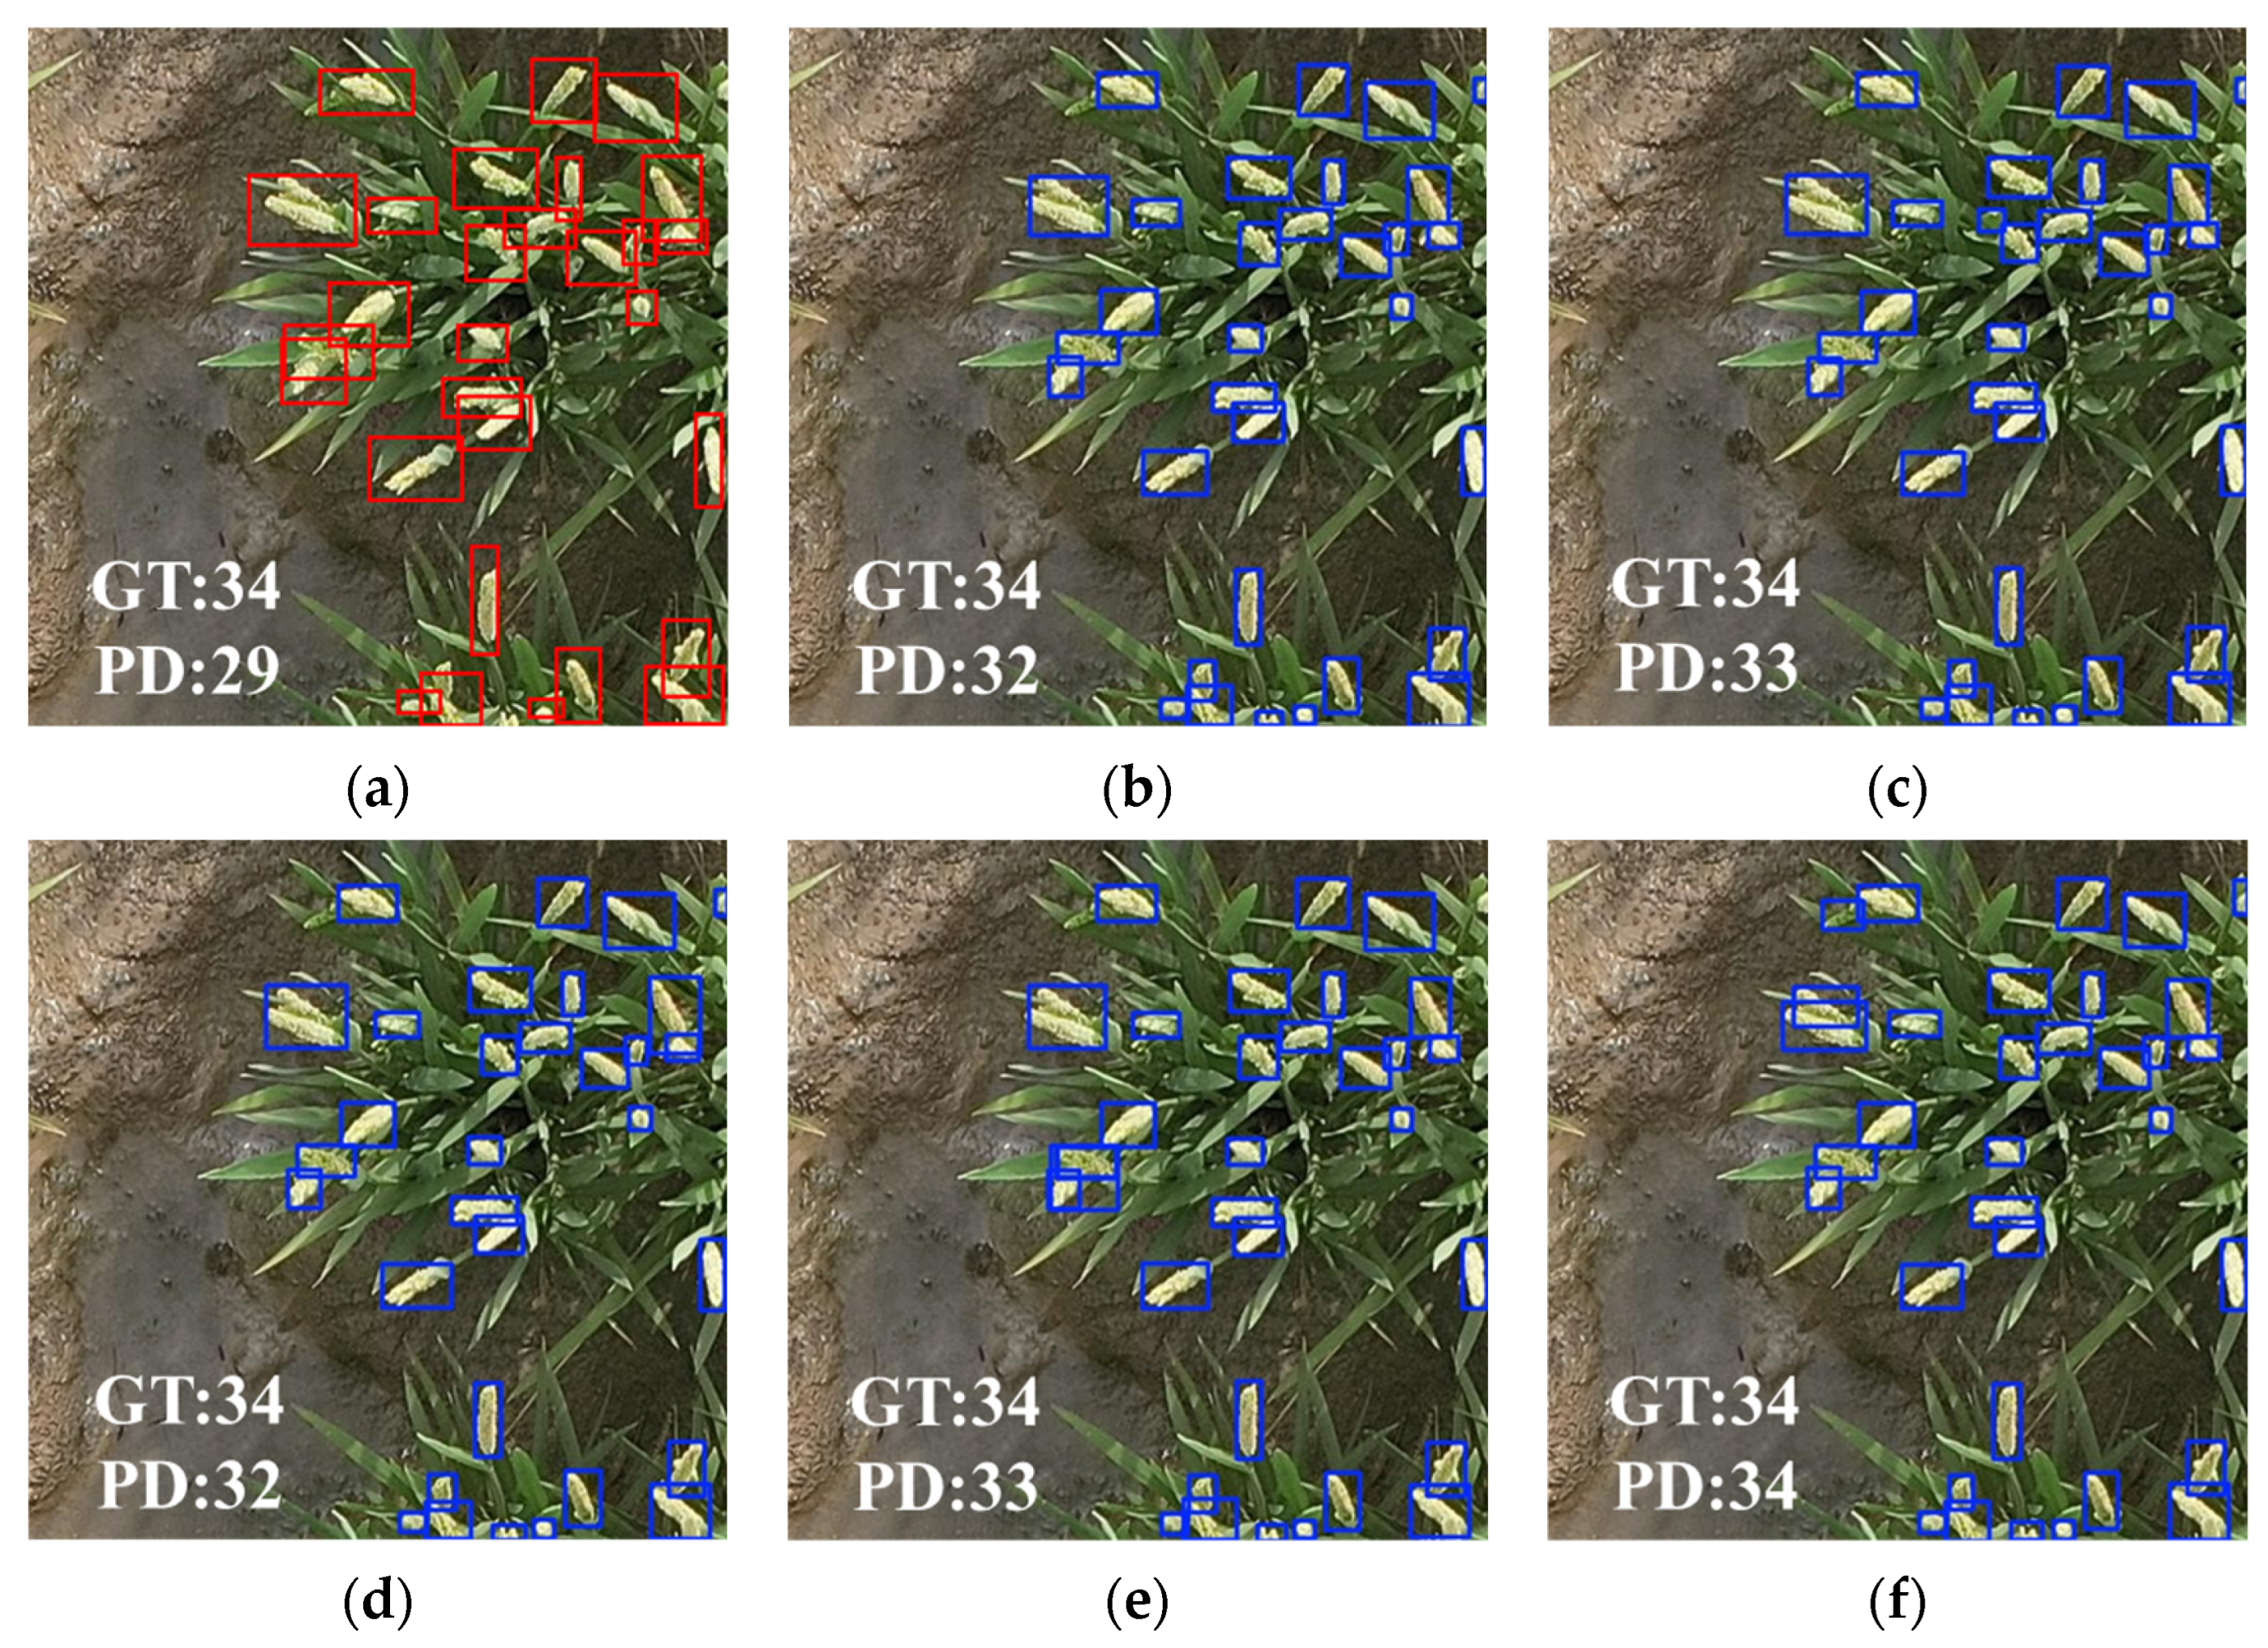
Table 3 indicates that the REU-YOLO model obtained the highest performance related to model accuracy. In comparison to the SSD, YOLOv5 s, YOLOv8 s, YOLOv9 s, and YOLOv10 s models, it demonstrated improvements in mAP0.5 of 9.35%, 5.43%, 4.85%, 3.28%, and 4.35%, respectively. Additionally, mAP0.5:0.95 showed increases of 29.68%, 9.55%, 8.27%, 5.83%, and 6.37%, respectively. The REU-YOLO model captured a MAE of 0.68 and an RMSE of 1.07 for rice ears, alongside an R2 value of 0.9502, demonstrating a strong correlation. This indicates that the model’s detection performance is more stable and capable of effectively detecting rice ears in complex field environments.
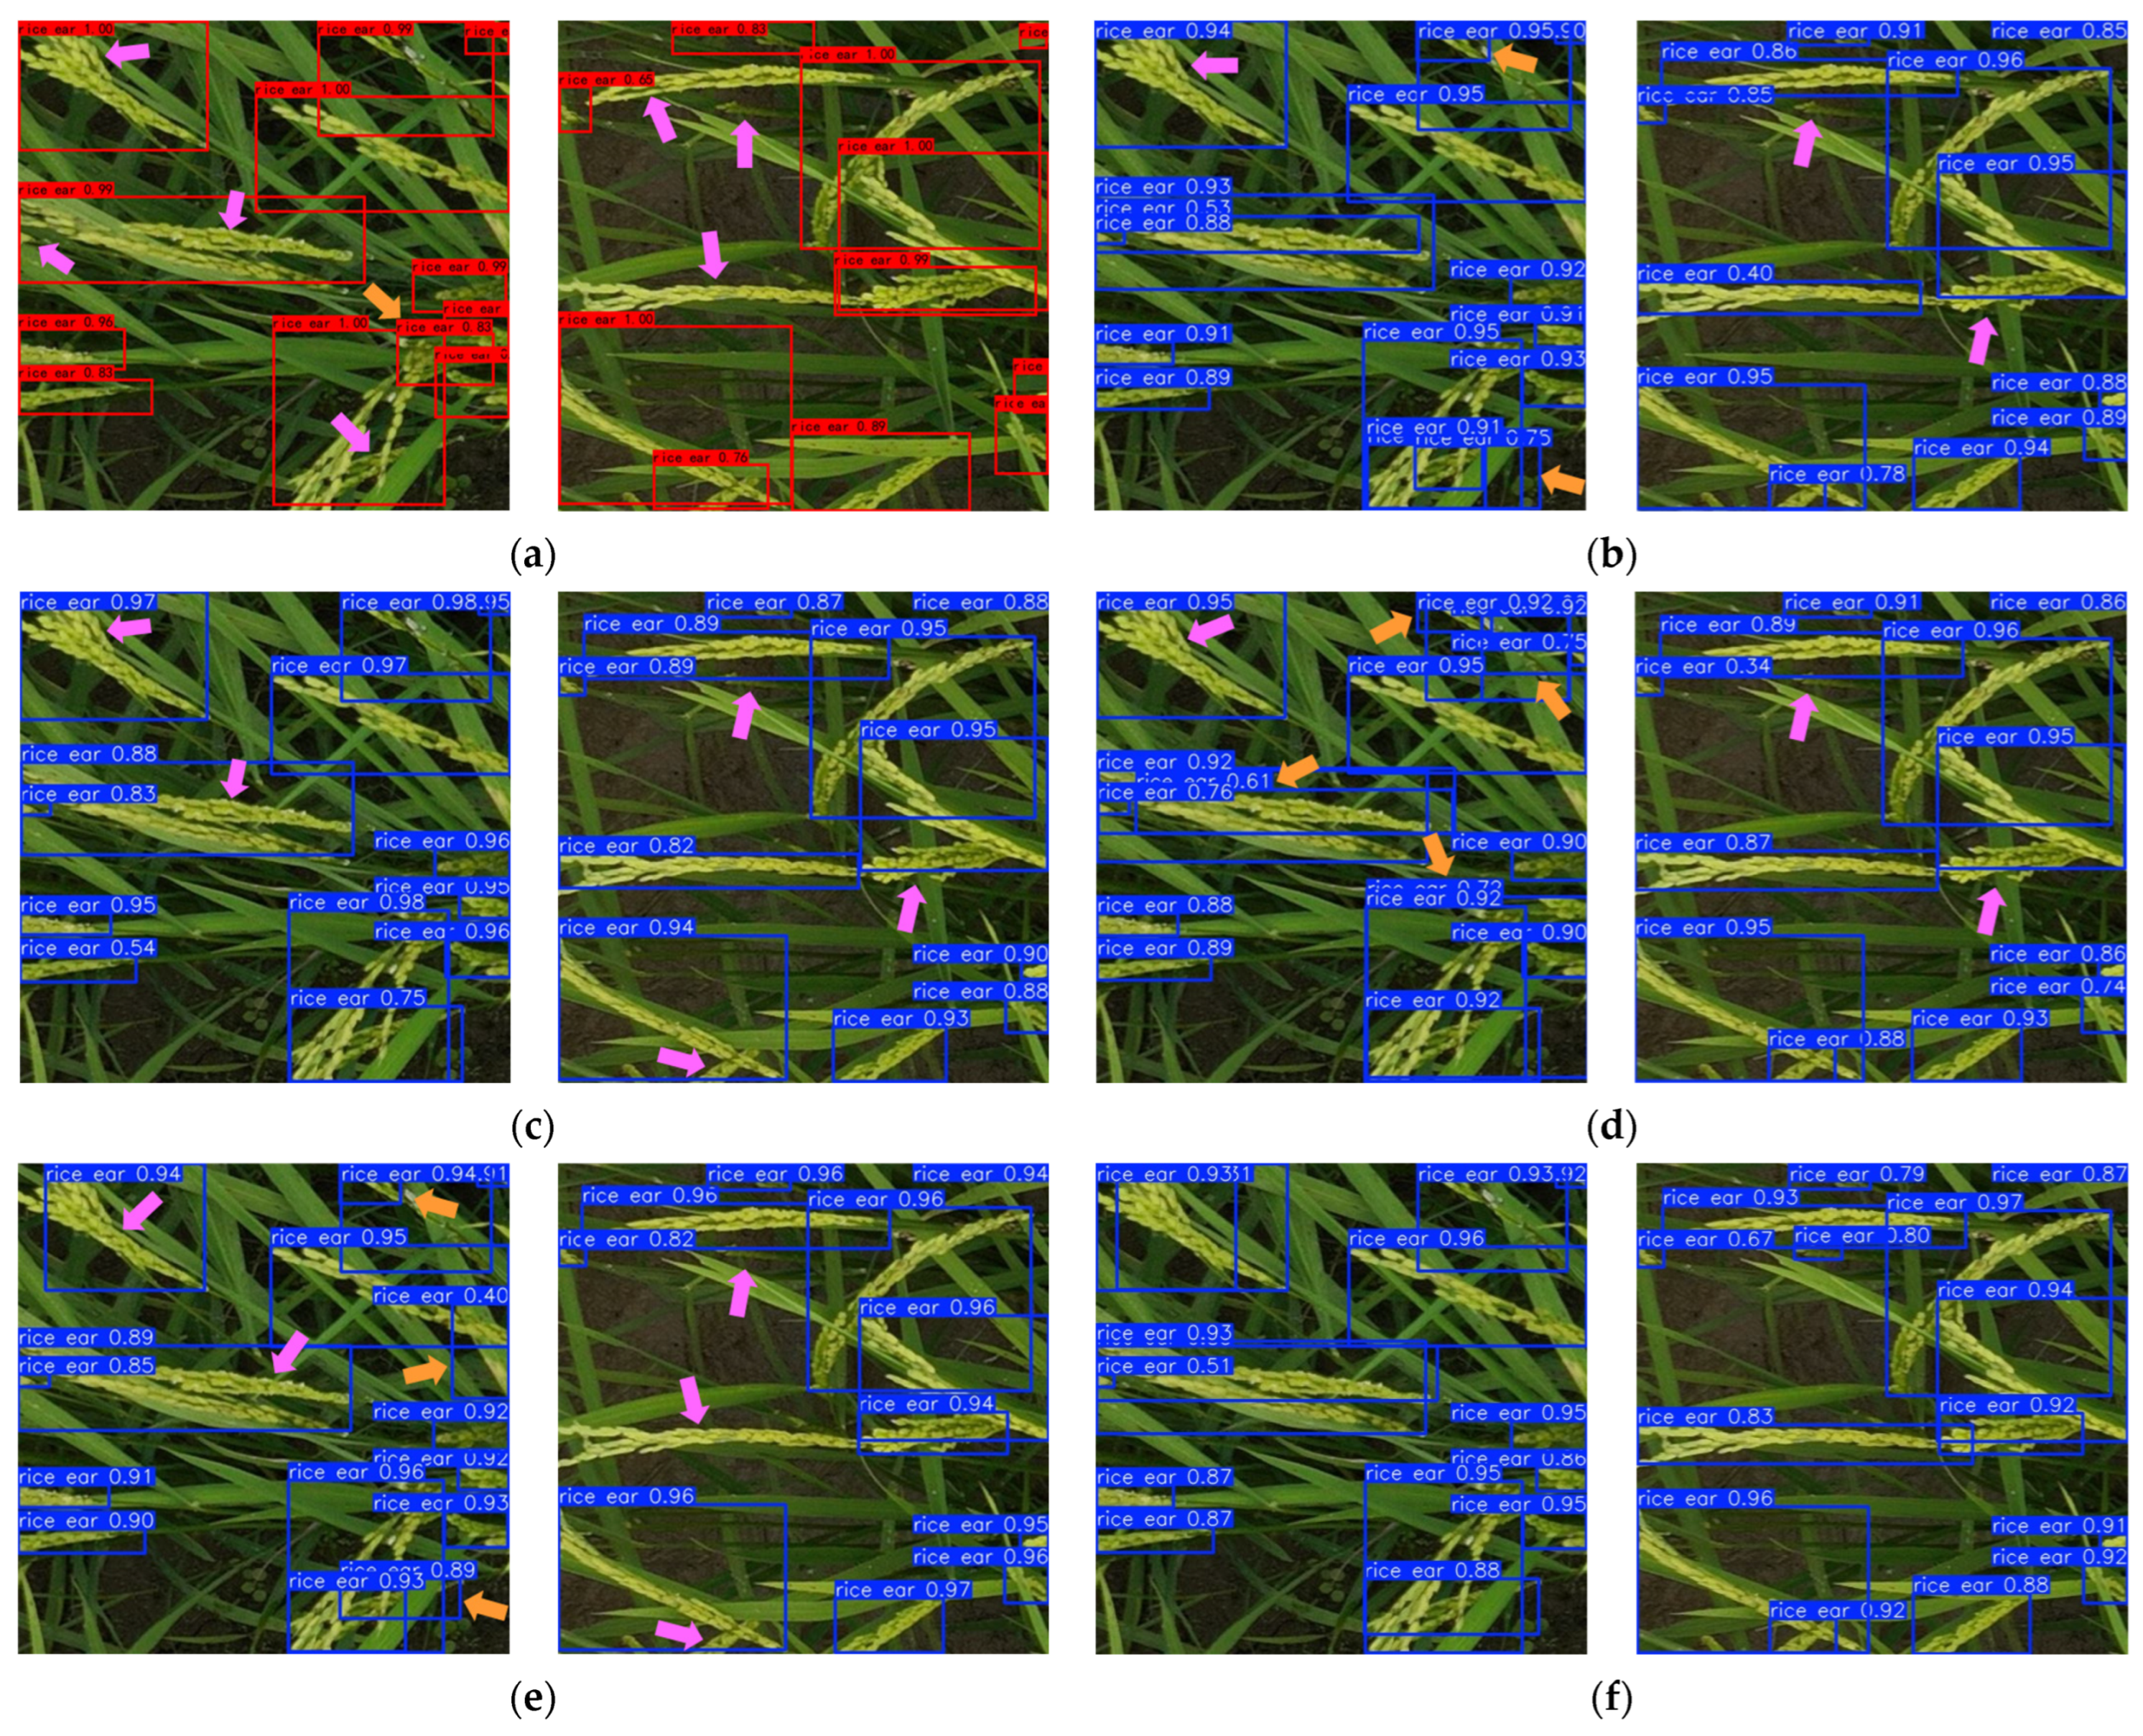
To thoroughly show the efficacy of the REU-YOLO model in detecting rice ears within complex environments, the visualization results for various models are presented in Figure 12. The figure illustrates that all models effectively detect the majority of rice ears, although issues continue to exist, including missed detections (indicated by the pink arrow) and false detections (indicated by the orange arrow) in situations where leaves and ears are occluded or when the rice ears are small and incomplete. REU-YOLO demonstrates effective detection capabilities for rice ears in complex environments. In densely distributed and compact regions of rice ears, the SSD model frequently fails to detect occlusions and connections between ears, while other YOLO series models demonstrate various levels of missed and false detections. SSD, YOLOv5 s, and YOLOv10 s displayed missed or false detections when detecting rice ear targets occluded by leaves in the lower-right region of the left image. All comparison models failed to detect the darker spikelet in the right image due to the influence of light. Only the REU-YOLO model demonstrated accurate detection. In summary, the REU-YOLO model demonstrates high detection performance and stability on UAVR datasets.

3.3. Experiments on Other Datasets

To validate the effectiveness and generalization of the REU-YOLO model for precise target localization in complex environments, a comparison experiment was performed between REU-YOLO and various detection models using publicly available datasets (DRPD dataset, MrMT dataset, and GWHD dataset) that exhibit characteristics similar to those of the study’s target.

3.3.1. Experiments on DRPD Dataset

Table 4 displays the comparative results for REU-YOLO and various other detection models on the DRPD dataset. The results indicate that REU-YOLO demonstrated superior performance in R, mAP0.5, mAP0.5:0.95, R2, MAE, and RMSE. In comparison to the YOLOv5 s, which was the second-best model, REU-YOLO demonstrated an increase in R of 2.08%, mAP0.5 of 0.85%, mAP0.5:0.95 of 1.66%, and R2 of 0.0024. Furthermore, REU-YOLO decreased the MAE and RMSE by 0.06 and 0.09, respectively, leading to enhanced stability in detection performance. In comparison to the YOLOv8 s model, the precision of REU-YOLO decreased by 1.09%, although other metrics displayed notable improvements.
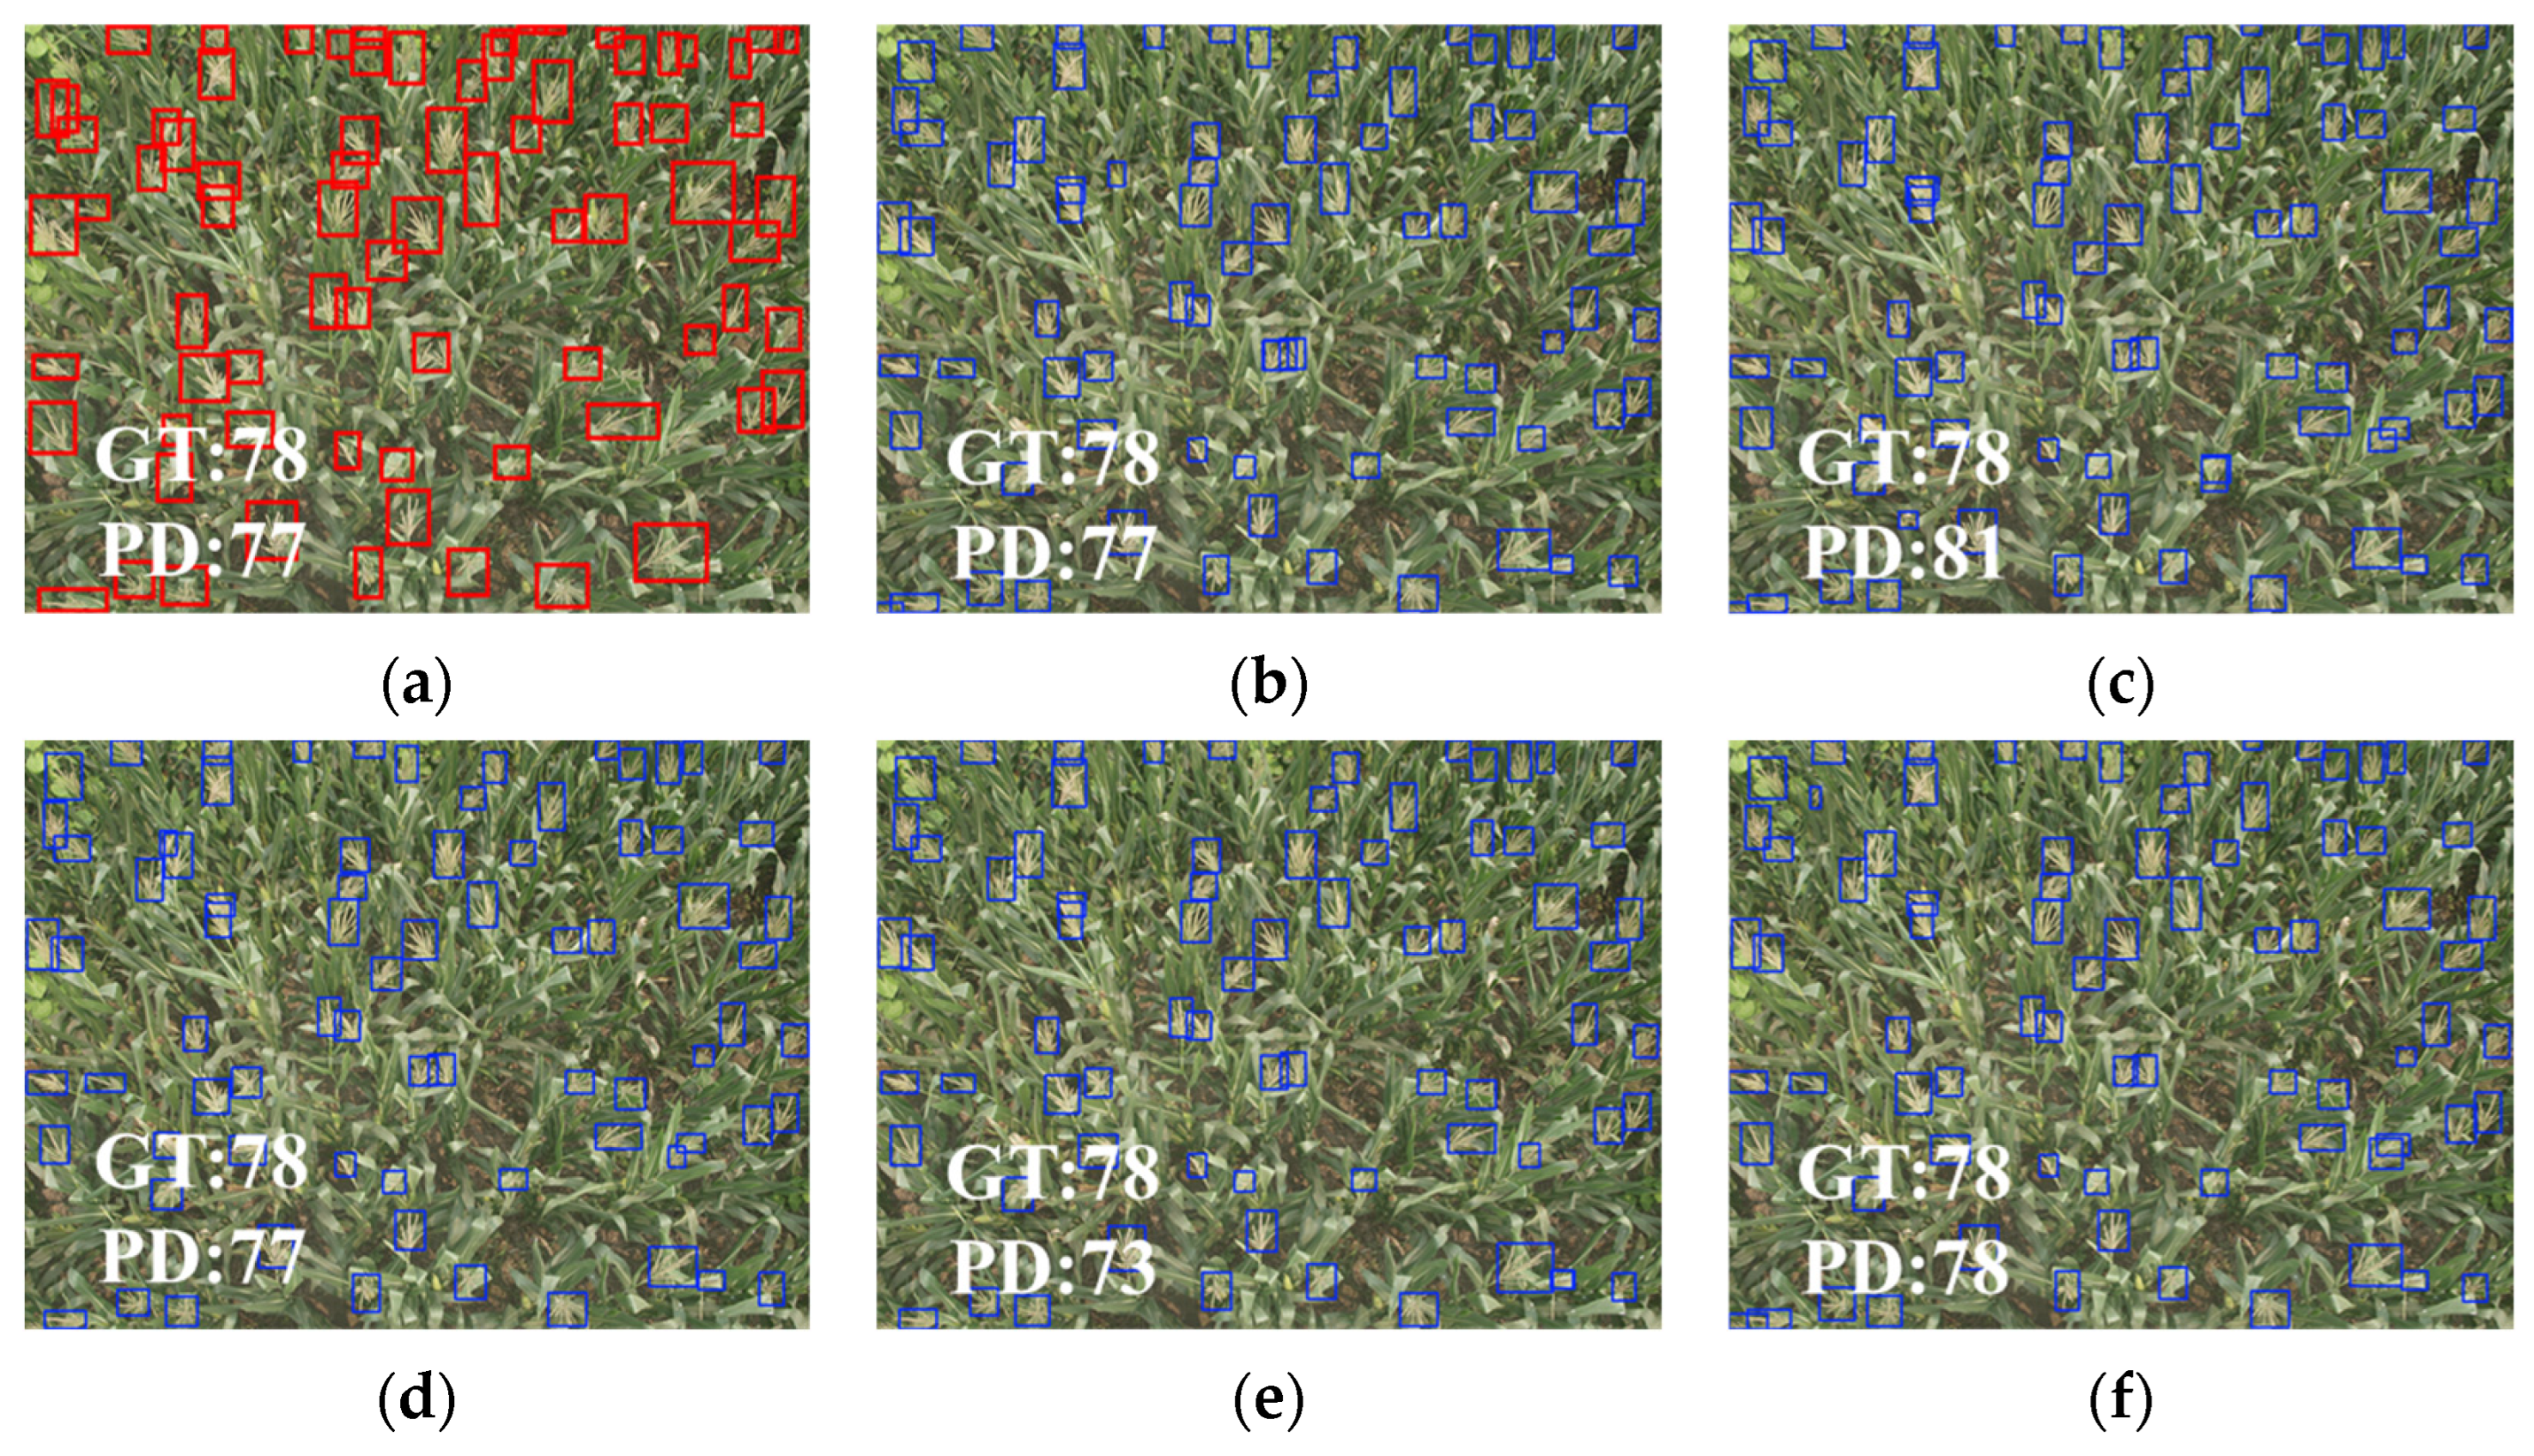
Figure 13 presents the visualization results for various detection models applied to the DRPD dataset. REU-YOLO can effectively distinguish and accurately detect rice ears by integrating contextual information, while maintaining the positional and detailed characteristics of ears in scenarios of occlusion and overlap. In conclusion, REU-YOLO demonstrates a significant improvement in detection performance on the DRPD dataset and shows effective model generalization.

3.3.2. Experiments on MrMT Dataset

Table 5 displays the comparative results for REU-YOLO and various other detection models on the MrMT dataset. The results indicate that REU-YOLO demonstrated superior performance in R, mAP0.5, mAP0.5:0.95, R2, MAE and RMSE. In comparison to YOLOv8 s, which was the second-best model, REU-YOLO demonstrated an increase in R of 0.76%, mAP0.5 of 0.85%, mAP0.5:0.95 of 0.1%, and R2 of 0.0051. Furthermore, REU-YOLO decreased the MAE and RMSE by 0.3 and 0.55, respectively, leading to enhanced stability in detection performance. In comparison to the YOLOv5 s model, the precision of REU-YOLO decreased by 0.27%, although other metrics displayed notable improvements.
Figure 14 presents the visualization results for various detection models applied to the MrMT dataset. As illustrated in the figure, REU-YOLO effectively detects corn tassels that are only partially exposed due to leaf occlusion or edge clipping. The model’s small target detection head enables it to reduce the loss of small targets in this context. In conclusion, REU-YOLO demonstrates significantly improved detection performance and effective model generalization on the MrMT dataset.

3.3.3. Experiments on GWHD Dataset

Table 6 displays the comparison results for REU-YOLO with various detection models on the GWHD dataset. The results indicate that REU-YOLO demonstrated superior performance in R, mAP0.5, mAP0.5:0.95, R2, MAE and RMSE. In comparison to YOLOv8 s, which was the second-best model, REU-YOLO demonstrated an increase in R of 2.21%, mAP0.5 of 0.32%, mAP0.5:0.95 of 0.53%, and R2 of 0.0123, while P only slightly decreased by 0.34%. In addition, REU-YOLO decreased the MAE and RMSE by 0.13 and 0.1, respectively, leading to enhanced stability in detection performance.
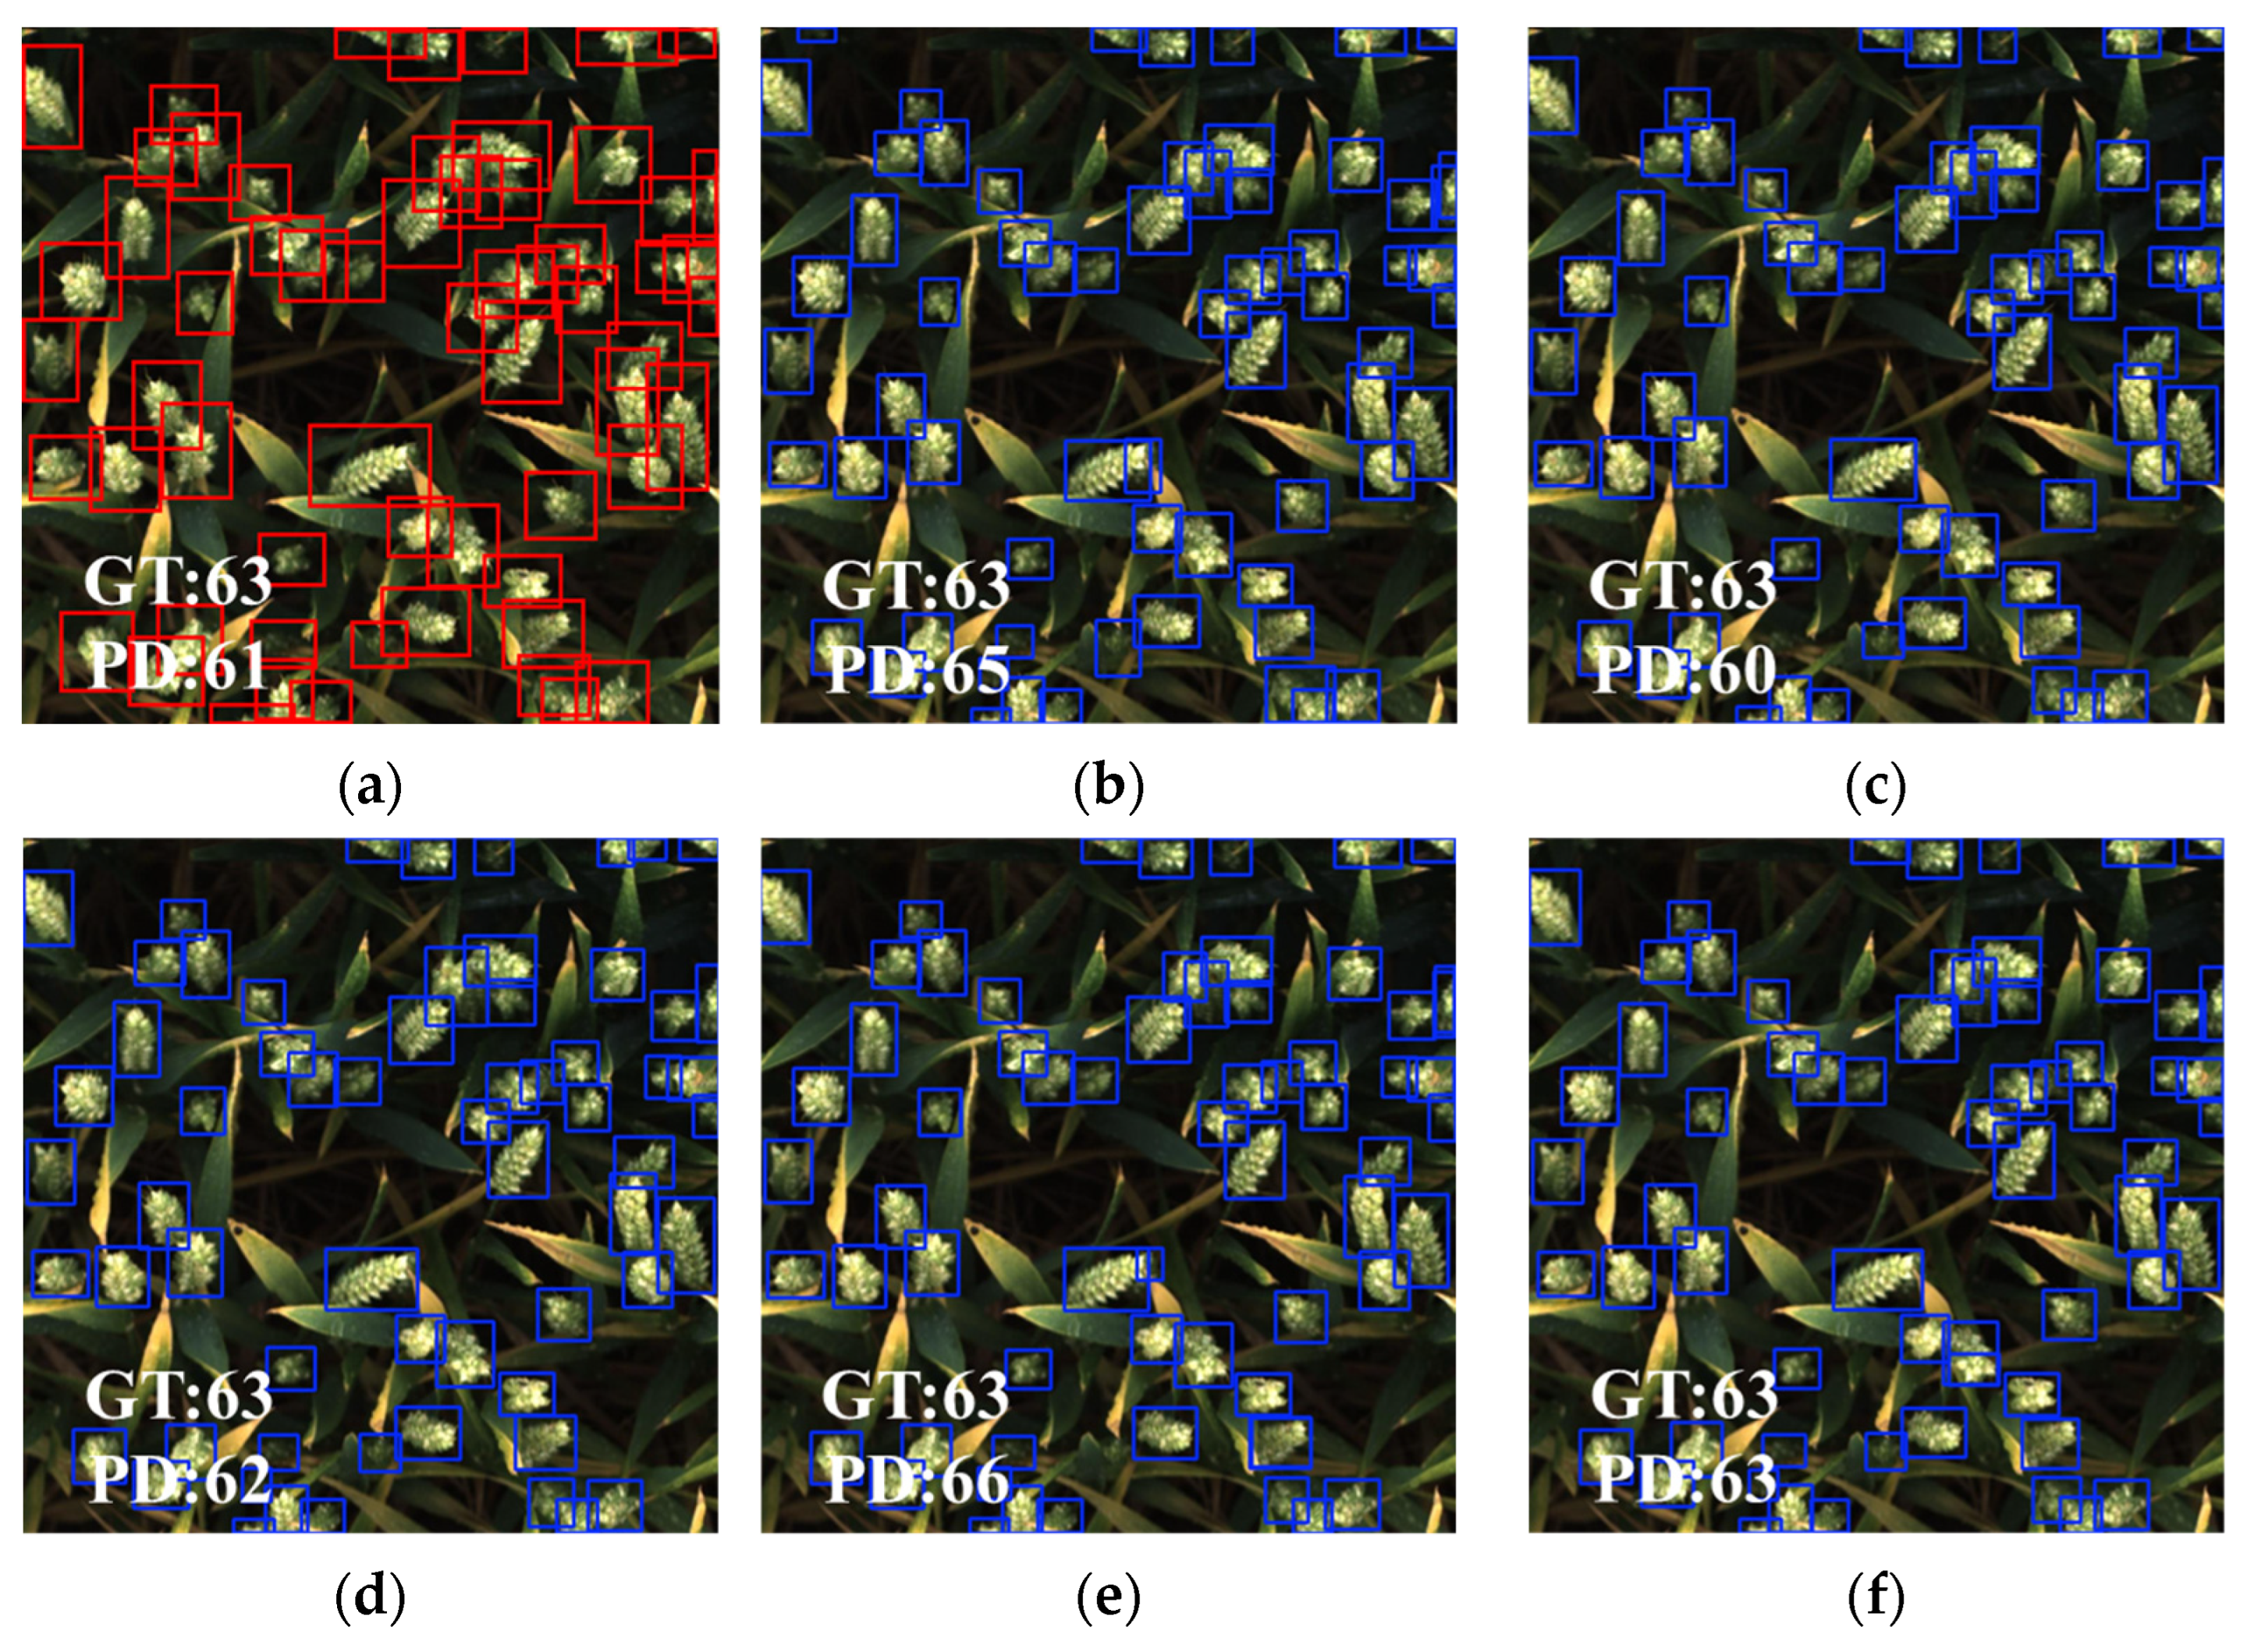
Figure 15 presents the visualization results for various detection models applied to the GWHD dataset. The figure illustrates that REU-YOLO can effectively distinguish and accurately detect wheat ears, even in situations where some ears are shaded and densely clustered among others. In conclusion, REU-YOLO demonstrates significantly improved detection performance on the GWHD dataset, showing notable model robustness and generalization capabilities.

4. Discussion

Detection of rice ears serves as a crucial indicator of phenotypes related to rice yield, and precise detection in complex field conditions can significantly reduce errors in yield estimation. Currently, the majority of relevant research concentrates on the detection of erect rice ears with low to medium densities. We investigate the detection of dispersed rice ears at various densities and introduced the REU-YOLO model, which has demonstrated effective detection results in complex field conditions. The primary focus is on enhancing occlusion along with target scale crossing. During the preliminary phase of model improvement, we observed a significant issue with model overfitting, as shown by the increasing validation loss throughout the training process. Therefore, we propose an AC-C2f feature extraction module aimed at capturing contextual information across various regions of the feature map. The Dropblock strategy is introduced in the module to reduce the model’s reliance on specific local detail features, thus enhancing the model’s generalization and robustness. This allows our model to perform effectively with small sample cross-domain data, akin to the work of PlantBiCNet [35], who implemented a Dropout module following the cascading of feature maps in the output layer to mitigate data overfitting and enhance model generalization. In contrast to dropout, Dropblock eliminates certain local features while maintaining the spatial relationships of other features by regional constraints, leading to reduced sensitivity to occlusion ratios. On the other hand, dropout necessitates accurate scaling adjustments to obtain optimal outcomes.
Furthermore, to reduce the loss of significant incomplete spikelet position information in UAV rice ear images during feature extraction and retain additional shallow spatial information, an MBiFPN feature fusion network was developed. The detection head was improved to increase the model’s focus on small and medium-sized rice ear targets. This approach parallels the research conducted by Lan et al. [19], who simplified the model architecture by incorporating a small object detection head while eliminating the large object detection head from the original network, thereby enhancing the model’s specificity. The MBiFPN not only enhances the detection head, but also integrates adaptive average pooling to dynamically weight and fuse high-resolution shallow features with deep features obtained from the AC-C2f module. This approach preserves more spatial and local information of the image, facilitates the transmission of contextual information across various levels, and enhances the model’s detection capability in complex environments. At the same time, we modified the SPPF to obtain the SPPFCSPC_G module, which effectively integrates feature information from deep and shallow layers at various scales. This enhancement increases adaptability to complex field environments and improves the network’s robustness. The Inner-PloU loss function is introduced to accommodate the varied shapes and occlusions of rice ears. In summary, the improvement strategy proposed in this study can be extended to other small and medium-sized object detection tasks with significant shape variations in complex environments.
Factors including various densities, lighting conditions, and backgrounds can influence the effectiveness of rice ear detection. As rice progresses to the filling stage post-heading, the volume proportion of rice ears will increase. Higher planting density leads to more severe obstruction between ears and between leaves and ears. Variations in lighting conditions during data collection can lead to huge differences in the images. Increased lighting intensity correlates with a higher risk of rice ears turning yellow, potentially resulting in blurred details. In low light conditions, rice ears exhibit a greenish hue, and their texture becomes more distinct. The image of the rice ear is sourced from the field, featuring a background that comprises branches, leaves, soil, water, and reflections, thereby illustrating a complex distribution. Figure 16 presents the detection results for the REU-YOLO model across various densities and lighting conditions. Figure 16a illustrates that REU-YOLO maintains effective detection performance with occlusion, dense distribution, and spikelets under exposure. As density increases, the rice ears in the image center are influenced by the low-altitude airflow of the UAV, leading to aggregation. This complicates the phenomena of intertwining, occlusion, and adhesion among the ears and between the ears and leaves, making the detection task more difficult. Consequently, REU-YOLO has encountered several missed detections (indicated by the pink arrow) and false detections (indicated by the orange arrow). Figure 16b illustrates that the distortion at the edge of the UAV image results in the elongation of rice ears, hence increasing their adherence and occlusion. In high-density distribution, certain attached rice ears may be detected collectively, leading to incomplete detections. Nonetheless, REU-YOLO successfully detected the majority of rice ears, demonstrating the model’s efficacy in diverse and complex field environments. Future study will concentrate on enhancing the dataset by employing higher-resolution cameras to capture data from elevated angles, thus preventing the aggregation and blurring of rice ears produced by low-altitude airflow and reducing image edge distortion.
In the latest research on rice panicle detection, Guo et al. [21] proposed a novel lightweight convolutional neural network for rice ear detection using the DRPD dataset, with an mAP0.5 of 89.31%. Our model achieved an mAP0.5 of 93.61% and 90.06% on the UAVR and part of the DRPD dataset, respectively. This shows that the REU-YOLO model is more sensitive to detecting the feature of rice ears across different types and scales. Zheng et al. [22] proposed the YOLO_ECO model based on YOLOv8n, which achieved an mAP0.5 of 87.2% in the detection of rice panicles, but its effectiveness decreased when rice ears were dense and overlapping. In comparison, the REU-YOLO model exhibits enhanced feature extraction capabilities and improved detection accuracy. Song et al. [20] proposed a lightweight YOLO-Rice model based on YOLOv8n, which achieved an mAP0.5 of 95.9%. However, the rice ears in their dataset were mostly upright and at the heading stage, characterized by low density and minimal occlusion between ears. The model proved challenging to adapt for detection in environments characterized by curved ears and high planting density. Overall, our research indicates that the proposed REU-YOLO model exhibits enhanced detection performance and robustness for rice ear detection in complex environments, thereby offering substantial technical support for rice yield estimation and precision agriculture.

5. Conclusions

This paper proposes a rice ear detection model named REU-YOLO, particularly designed for UAV-based field images. By integrating the AC-C2f and SPPFCSPC-G modules, the MBiFPN feature fusion network, and the Inner-PloU loss function, the model facilitates deeper feature extraction through the amalgamation of contextual information across various levels. In the self-developed UAVR dataset, the P of REU-YOLO was 90.76%, the R was 86.94%, the mAP0.5 was 93.51%, and the mAP0.5:0.95 was 78.45%, representing increases of 4.22%, 3.76%, 4.85%, and 8.27% over YOLOv8 s, respectively. The model demonstrated excellent detection ability and robustness, particularly in detecting rice ears and spikelets among complex field backgrounds characterized by high density, significant occlusion, and exposure. Moreover, we conducted an additional assessment of REU-YOLO using three publicly available datasets: DRPD, MrMT, and GWHD. The results indicated that our model has good generalization capability and successfully minimizes both missed and false detections in comparison to other models, ensuring more stable detection performance. This study is of great importance for predicting rice yields and detecting phenotypes, thus providing improved strategies and technological assistance for detecting irregular small targets in complex agricultural environments.
Although the REU-YOLO model proposed in this work yielded certain favorable detection outcomes, its computational complexity remains substantial. Consequently, in the future study, we will concentrate on optimizing the REU-YOLO model by addressing its complexity, pruning, and additional factors related to lightweighting, enhance the network architecture while preserving current detection accuracy, and increasing detection efficiency. Simultaneously, in the high-density distribution of rice ears, the model necessarily suffers partial missed and false detections. In the future, we will classify the distribution of rice ears with more certainty and identify the specific factors influencing detection performance. We will also explore how sub-images from the same image falling into different splits affect detection results. Moreover, we plan to integrate the attention mechanism to enhance the model’s detection efficacy for rice ears with significant occlusion and adhesion distribution.

Author Contributions

Conceptualization, D.C.; methodology, D.C. and K.X.; software, D.C., K.X. and D.L.; validation, K.X. and W.S.; formal analysis, D.C., K.X., W.S. and D.L.; investigation, R.Y.; resources, S.Y.; data curation, D.C., W.S. and D.L.; writing—original draft preparation, D.C., K.X. and W.S.; writing—review and editing, R.Y., S.Y. and J.Z.; visualization, J.Z.; supervision, R.Y. and J.Z.; project administration, R.Y.; funding acquisition, R.Y. All authors have read and agreed to the published version of the manuscript.

Funding

This research was funded by the National Key R&D Plan Project of China (grant number: 2023YFD2000400) and the National Talent Foundation Project of China (grant number: T2019136).

Data Availability Statement

The original contributions presented in the study are included in the article. Further inquiries can be directed to the corresponding author.

Conflicts of Interest

The authors declare no conflicts of interest.

References

  1. Yuan, L. Progress in super-hybrid rice breeding. Crop J. 2017, 5, 100–102. [Google Scholar] [CrossRef]
  2. Shang, S.; Yin, Y.; Guo, P.; Yang, R.; Sun, Q. Current situation and development trend of mechanization of field experiments. Trans. Chin. Soc. Agric. Eng. 2010, 26, 5–8. Available online: http://tcsae.org/en/article/id/20101302 (accessed on 1 August 2025).
  3. Li, X.; Yue, H.; Liu, J.; Cheng, A. AMS-YOLO: Asymmetric Multi-Scale Fusion Network for Cannabis Detection in UAV Imagery. Drones 2025, 9, 629. [Google Scholar] [CrossRef]
  4. Moldvai, L.; Mesterházi, P.Á.; Teschner, G.; Nyéki, A. Aerial Image-Based Crop Row Detection and Weed Pressure Mapping Method. Agronomy 2025, 15, 1762. [Google Scholar] [CrossRef]
  5. Zhu, Z.; Gao, Z.; Zhuang, J.; Huang, D.; Huang, G.; Wang, H.; Pei, J.; Zheng, J.; Liu, C. MSMT-RTDETR: A Multi-Scale Model for Detecting Maize Tassels in UAV Images with Complex Field Backgrounds. Agriculture 2025, 15, 1653. [Google Scholar] [CrossRef]
  6. Zhu, Y.; Cao, Z.; Lu, H.; Li, Y.; Xiao, Y. In-field automatic observation of wheat heading stage using computer vision. Biosyst. Eng. 2016, 143, 28–41. [Google Scholar] [CrossRef]
  7. Xiong, X.; Duan, L.; Liu, L.; Tu, H.; Yang, P.; Wu, D.; Chen, G.; Xiong, L.; Yang, W.; Liu, Q. Panicle-SEG: A robust image segmentation method for rice panicles in the field based on deep learning and superpixel optimization. Plant Methods 2017, 13, 104. [Google Scholar] [CrossRef] [PubMed]
  8. Bai, X.; Cao, Z.; Zhao, L.; Zhang, J.; Lv, C.; Li, C.; Xie, J. Rice heading stage automatic observation by multi-classifier cascade based rice spike detection method. Agric. For. Meteorol. 2018, 259, 260–270. [Google Scholar] [CrossRef]
  9. Zhou, C.; Liang, D.; Yang, X.; Yang, H.; Yue, J.; Yang, G. Wheat ears counting in field conditions based on multi-feature optimization and TWSVM. Front. Plant Sci. 2018, 9, 1024. [Google Scholar] [CrossRef]
  10. Fernandez-Gallego, J.A.; Kefauver, S.C.; Gutiérrez, N.A.; Nieto-Taladriz, M.T.; Araus, J.L. Wheat ear counting in-field conditions: High throughput and low-cost approach using RGB images. Plant Methods 2018, 14, 22. [Google Scholar] [CrossRef]
  11. Fernandez-Gallego, J.A.; Buchaillot, M.L.; Aparicio Gutiérrez, N.; Nieto-Taladriz, M.T.; Araus, J.L.; Kefauver, S.C. Automatic Wheat Ear Counting Using Thermal Imagery. Remote Sens. 2019, 11, 751. [Google Scholar] [CrossRef]
  12. Xu, X.; Li, H.; Yin, F.; Xi, L.; Qiao, H.; Ma, Z.; Shen, S.; Jiang, B.; Ma, X. Wheat ear counting using K-means clustering segmentation and convolutional neural network. Plant Methods 2020, 16, 1–13. [Google Scholar] [CrossRef]
  13. Ji, M.; Yang, Y.; Zheng, Y.; Zhu, Q.; Huang, M.; Guo, Y. In-field automatic detection of maize tassels using computer vision. Inf. Process. Agric. 2021, 8, 87–95. [Google Scholar] [CrossRef]
  14. Chen, Y.; Xin, R.; Jiang, H.; Liu, Y.; Zhang, X.; Yu, J. Refined feature fusion for in-field high-density and multi-scale rice panicle counting in UAV images. Comput. Electron. Agric. 2023, 211, 108032. [Google Scholar] [CrossRef]
  15. Teng, Z.; Chen, J.; Wang, J.; Wu, S.; Chen, R.; Lin, Y.; Shen, L.; Jackson, R.; Zhou, J.; Yang, C. Panicle-Cloud: An Open and AI-Powered Cloud Computing Platform for Quantifying Rice Panicles from Drone-Collected Imagery to Enable the Classification of Yield Production in Rice. Plant Phenomics 2023, 5, 0105. [Google Scholar] [CrossRef] [PubMed]
  16. Tan, S.; Lu, H.; Yu, J.; Lan, M.; Hu, X.; Zheng, H.; Peng, Y.; Wang, Y.; Li, Z.; Qi, L.; et al. In-field rice panicles detection and growth stages recognition based on RiceRes2Net. Comput. Electron. Agric. 2023, 206, 7704. [Google Scholar] [CrossRef]
  17. Wei, J.; Tian, X.; Ren, W.; Gao, R.; Ji, Z.; Kong, Q.; Su, Z. A Precise Plot-Level Rice Yield Prediction Method Based on Panicle Detection. Agronomy 2024, 14, 1618. [Google Scholar] [CrossRef]
  18. Liang, Y.; Li, H.; Wu, H.; Zhao, Y.; Liu, Z.; Liu, D.; Liu, Z.; Fan, G.; Pan, Z.; Shen, Z.; et al. A rotated rice spike detection model and a crop yield estimation application based on UAV images. Comput. Electron. Agric. 2024, 224, 109188. [Google Scholar] [CrossRef]
  19. Lan, M.; Liu, C.; Zheng, H.; Wang, Y.; Cai, W.; Peng, Y.; Xu, C.; Tan, S. RICE-YOLO: In-Field Rice Spike Detection Based on Improved YOLOv5 and Drone Images. Agronomy 2024, 14, 836. [Google Scholar] [CrossRef]
  20. Song, Z.; Ban, S.; Hu, D.; Xu, M.; Yuan, T.; Zheng, X.; Sun, H.; Zhou, S.; Tian, M.; Li, L. A Lightweight YOLO Model for Rice Panicle Detection in Fields Based on UAV Aerial Images. Drones 2025, 9, 1. [Google Scholar] [CrossRef]
  21. Guo, Y.; Zhan, W.; Zhang, Z.; Zhang, Y.; Guo, H. FRPNet: A Lightweight Multi-Altitude Field Rice Panicle Detection and Counting Network Based on Unmanned Aerial Vehicle Images. Agronomy 2025, 15, 1396. [Google Scholar] [CrossRef]
  22. Zheng, H.; Liu, C.; Zhong, L.; Wang, J.; Huang, J.; Lin, F.; Ma, X.; Tan, S. An android-smartphone application for rice panicle detection and rice growth stage recognition using a lightweight YOLO network. Front. Plant Sci. 2025, 16, 1561632. [Google Scholar] [CrossRef]
  23. Alzubaidi, L.; Zhang, J.; Humaidi, A.J.; Al-Dujaili, A.; Duan, Y.; Al-Shamma, O.; Farhan, L. Review of deep learning: Concepts, CNN architectures, challenges, applications, future directions. J. Big Data 2021, 8, 1–74. [Google Scholar] [CrossRef] [PubMed]
  24. Yu, Z.; Ye, J.; Li, C.; Zhou, H.; Li, X. TasselLFANet: A novel lightweight multibranch feature aggregation neural network for high-throughput image-based maize tassels detection and counting. Front. Plant Sci. 2023, 14, 1158940. [Google Scholar] [CrossRef] [PubMed]
  25. David, E.; Madec, S.; Sadeghi-Tehran, P.; Aasen, H.; Zheng, B.; Liu, S.; Kirchgessner, N.; Ishikawa, G.; Nagasawa, K.; Badhon, M.A.; et al. Global wheat head detection(GWHD) dataset: A large and diverse dataset of high-resolution RGB-labelled images to develop and benchmark wheat head detection methods. Plant Phenomics 2020, 2020, 3521852. [Google Scholar] [CrossRef] [PubMed]
  26. He, K.; Zhang, X.; Ren, S.; Sun, J. Spatial pyramid pooling in deep convolutional networks for visual recognition. IEEE Trans. Pattern Anal. Mach. Intell. 2015, 37, 1904–1916. [Google Scholar] [CrossRef]
  27. Lin, T.Y.; Dollar, P.; Girshick, R.; He, K.; Hariharan, B.; Belongie, S. Feature pyramid networks for object detection. In Proceedings of the IEEE Conference on Computer Vision and Pattern Recognition, Honolulu, HI, USA, 21–26 July 2017; pp. 2117–2125. [Google Scholar] [CrossRef]
  28. Liu, S.; Qi, L.; Qin, H.; Shi, J.; Jia, J. Path aggregation network for instance segmentation. In Proceedings of the IEEE Conference on Computer Vision and Pattern Recognition, Salt Lake City, UT, USA, 18–23 June 2018; pp. 8759–8768. [Google Scholar] [CrossRef]
  29. Shi, D. TransNeXt: Robust Foveal Visual Perception for Vision Transformers. arXiv 2024, arXiv:2311.17132. [Google Scholar]
  30. Zhang, T.; Li, L.; Zhou, Y. CAS-ViT: Convolutional Additive Self-attention Vision Transformers for Efficient Mobile Applications. arXiv 2024, arXiv:2408.03703. [Google Scholar]
  31. Wang, C.; Liao, H.; Wu, Y.; Chen, P.; Hsieh, J.; Yeh, I. CSPNet: A new backbone that can enhance learning capability of CNN. In Proceedings of the IEEE/CVF Conference on Computer Vision and Pattern Recognition Workshops, Seattle, WA, USA, 14–19 June 2020; pp. 390–391. [Google Scholar]
  32. Tan, M.; Pang, R.; Le, Q.V. EfficientDet: Scalable and Efficient Object Detection. In Proceedings of the IEEE/CVF Conference on Computer Vision and Pattern Recognition, Seattle, WA, USA, 13–19 June 2020. [Google Scholar]
  33. Liu, C.; Wang, K.; Li, Q.; Zhao, F.; Zhao, K.; Ma, H. Powerful-IoU: More straightforward and faster bounding box regression loss with a nonmonotonic focusing mechanism. Neural Netw. 2024, 170, 276–284. [Google Scholar] [CrossRef]
  34. Zhang, H.; Xu, C.; Zhang, S. Inner-IoU: More Effective Intersection over Union Loss with Auxiliary Bounding Box. arXiv 2023, arXiv:2311.02877. [Google Scholar]
  35. Ye, J.; Yu, Z.; Wang, Y.; Lu, D.; Zhou, H. PlantBiCNet: A new paradigm in plant science with bi-directional cascade neural network for detection and counting. Eng. Appl. Artif. Intell. 2024, 130, 107704. [Google Scholar] [CrossRef]
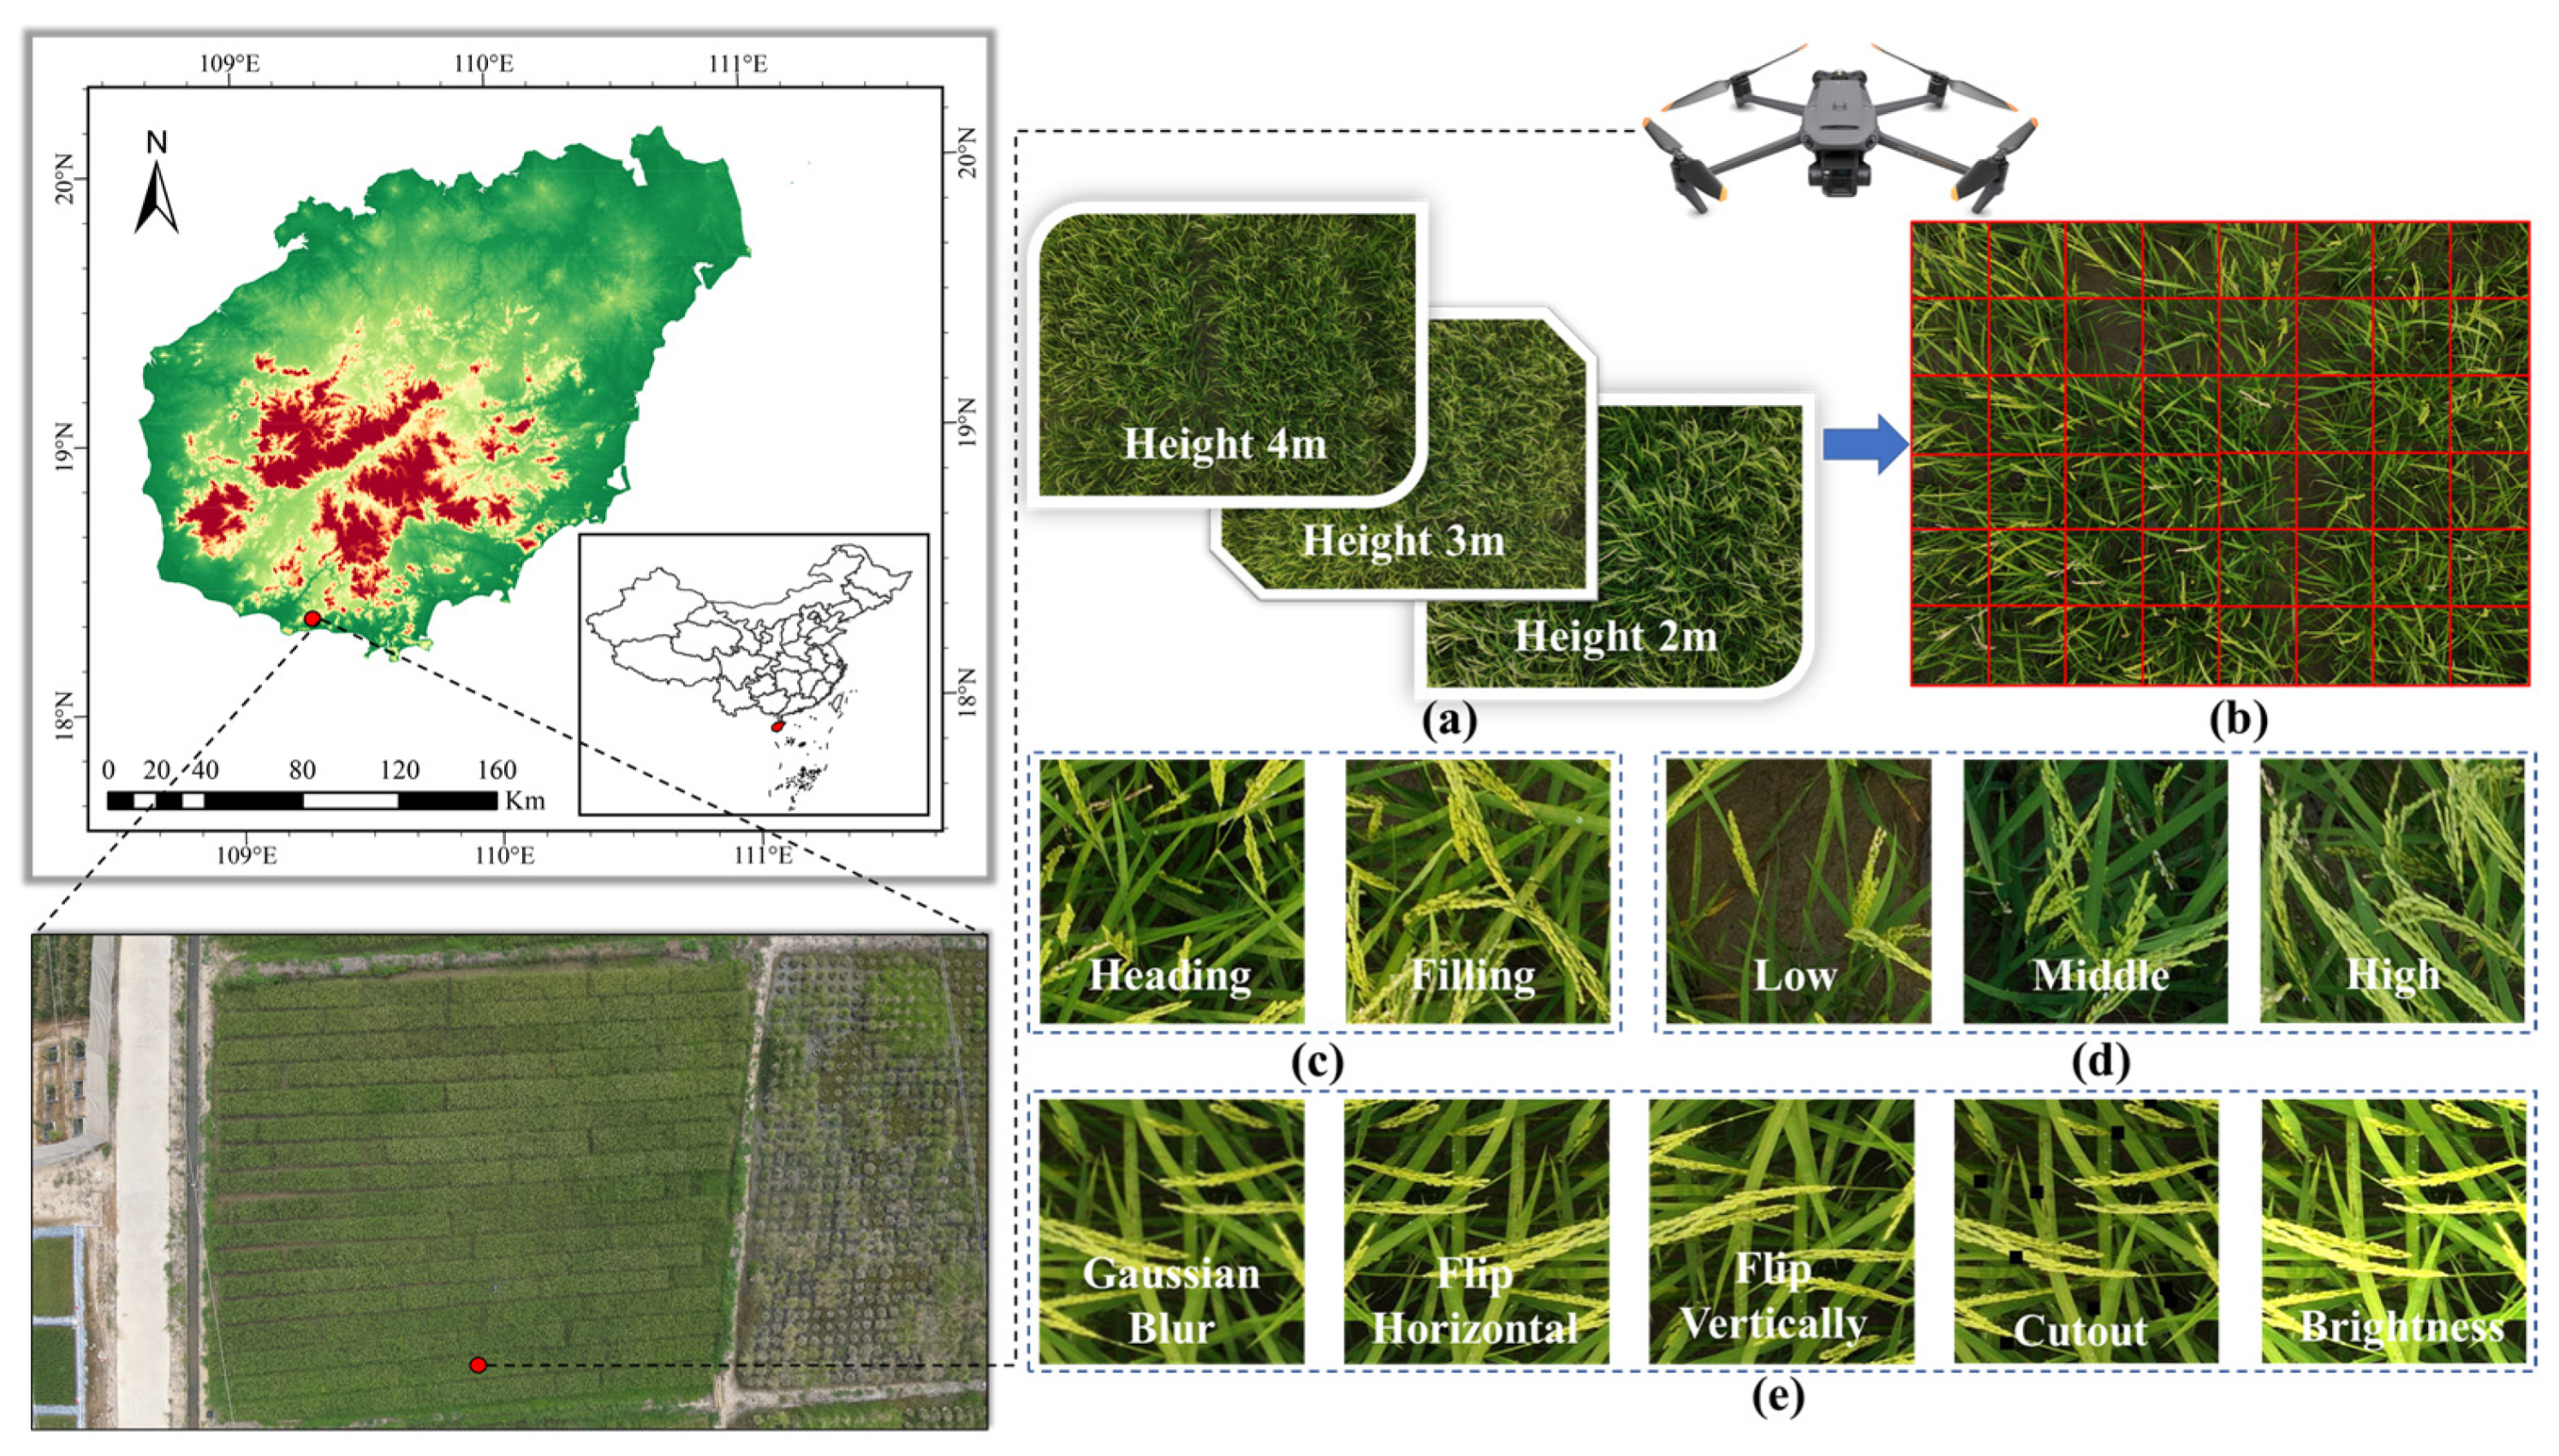
Figure 1. The experimental site and rice ear images. (a) Different image acquisition heights, (b) image cropping, (c) different growth stages, (d) different density, (e) date augmentation.
Agronomy 15 02225 g001
Figure 2. Violin plot of the rice ear number in each sub-image.
Agronomy 15 02225 g002
Figure 3. YOLOv8 s algorithm architecture. Note: ‘*’ represents n repeats of the bottleneck module.
Agronomy 15 02225 g003
Figure 4. Structure diagram of Additive Block.
Agronomy 15 02225 g004
Figure 5. Structure diagram of AC-C2f module.
Agronomy 15 02225 g005
Figure 6. Structure diagram of SPPFCSPC_G.
Agronomy 15 02225 g006
Figure 7. Comparison of different feature fusion network structures. (a) The structure of FPN + PAN, (b) the structure of BiFPN, (c) the structure of MBiFPN, (d) the structure of the UBiConcat module, (e) The structure of the DBiConcat module.
Agronomy 15 02225 g007aAgronomy 15 02225 g007b
Figure 8. Inner-PIoU principle diagram.
Agronomy 15 02225 g008
Figure 9. REU-YOLO model training results.
Agronomy 15 02225 g009
Figure 10. Different multi-scale feature fusion networks. (a) The structure of FPN + PAN (small target ver), (b) the structure of BiFPN (small target ver), (c) the structure of MBiFPN with Conv.
Agronomy 15 02225 g010
Figure 11. Heat maps of images of two varieties of rice using different models. (a) High-density original image, (b) heat map of high-density image using YOLOv8 s, (c) heat map of high-density image using REU-YOLO, (d) brighter original image, (e) heat map of brighter image using YOLOv8 s, (f) heat map of brighter image using REU-YOLO.
Agronomy 15 02225 g011
Figure 12. Detection results obtained by different models on the UAVR dataset. (a) SSD, (b) YOLOv5 s, (c) YOLOv8 s, (d) YOLOv9 s, (e) YOLOv10 s, (f) REU-YOLO.
Agronomy 15 02225 g012
Figure 13. Detection results obtained by different models on the DRPD dataset. (a) SSD, (b) YOLOv5 s, (c) YOLOv8 s, (d) YOLOv9 s, (e) YOLOv10 s, (f) REU-YOLO. Note: GT denotes the ground-truth count, and PD the predicted count.
Agronomy 15 02225 g013
Figure 14. Detection results obtained by different models on the MrMT dataset. (a) SSD, (b) YOLOv5 s, (c) YOLOv8 s, (d) YOLOv9 s, (e) YOLOv10 s, (f) REU-YOLO. Note: GT denotes the ground-truth count, and PD the predicted count.
Agronomy 15 02225 g014
Figure 15. Detection results obtained by different models on the GWHD dataset. (a) SSD, (b) YOLOv5 s, (c) YOLOv8 s, (d) YOLOv9 s, (e) YOLOv10 s, (f) REU-YOLO. Note: GT denotes the ground-truth count, and PD the predicted count.
Agronomy 15 02225 g015
Figure 16. Detection results for rice panicles under different densities and light conditions. (a) Detection results for rice panicles under high brightness lighting conditions, (b) detection results for rice panicles under low brightness lighting conditions.
Agronomy 15 02225 g016
Table 1. Comparative experiments of different feature fusion network.
ModelFeature Fusion NetworkmAP0.5
(%)
mAP0.5:0.95
(%)
Params
(M)
FLOPs
(G)
Model Size
(MB)
1FPN + PAN (Figure 7a)93.2177.3310.4524.5020.40
2FPN + PAN (small target ver) (Figure 10a)93.3678.107.2629.7014.48
3BiFPN (Figure 7b)93.2277.410.6626.5020.84
4BiFPN (small target ver) (Figure 10b)93.5178.227.3832.0014.74
5MBiFPN with Conv (Figure 10c)93.6678.458.2934.3016.52
6MBiFPN (Figure 7c)93.6178.687.7632.3015.50
Table 2. Experiments results of ablation study.
ModelAC-C2fSPPFCSPC_GMBiFPNInner-PIoUP
(%)
R
(%)
mAP0.5
(%)
mAP0.5:0.95
(%)
YOLOv8 s××××85.7583.4188.7670.41
Improvement 1×××89.0286.7592.7975.63
Improvement 2××89.5086.5093.0677.29
Improvement 3×90.0886.8993.4778.18
Improvement 489.9787.1793.6178.68
Table 3. Comparative results for different detection models on the UAVR dataset.
ModelP
(%)
R
(%)
mAP0.5
(%)
mAP0.5:0.95
(%)
R2MAERMSE
SSD70.862.1184.2649.000.89261.141.57
YOLOv5 s86.1181.8288.1869.130.91430.951.41
YOLOv8 s85.7583.4188.7670.410.92250.901.34
YOLOv9 s87.5185.4990.3372.850.93950.781.18
YOLOv10 s87.9381.5089.2672.310.91170.971.43
REU-YOLO89.9787.1793.6178.680.95020.681.07
Table 4. Comparative results for different detection models on the DRPD dataset.
ModelP
(%)
R
(%)
mAP0.5
(%)
mAP0.5:0.95
(%)
R2MAERMSE
SSD66.7058.6777.9032.600.88282.923.83
YOLOv5 s87.2583.2389.2155.060.92472.393.03
YOLOv8 s88.3381.9888.9855.340.91832.423.16
YOLOv9 s85.6380.6888.0355.140.90712.503.32
YOLOv10 s87.0279.6787.1453.950.90682.603.34
REU-YOLO87.2485.3190.0656.720.92712.332.94
Table 5. Comparative results for different detection models on the MrMT dataset.
ModelP
(%)
R
(%)
mAP0.5
(%)
mAP0.5:0.95
(%)
R2MAERMSE
SSD64.1854.9482.4034.300.97613.344.56
YOLOv5 s94.1791.7795.7358.170.98512.653.63
YOLOv8 s93.7892.4196.2358.880.98343.044.04
YOLOv9 s94.1091.8295.7858.230.98452.973.92
YOLOv10 s92.5190.7795.0557.760.98382.753.72
REU-YOLO93.9093.1796.3458.980.99022.353.08
Table 6. Comparative results for different detection models on the GWHD dataset.
ModelP
(%)
R
(%)
mAP0.5
(%)
mAP0.5:0.95
(%)
R2MAERMSE
SSD64.1854.9485.6038.200.92803.664.89
YOLOv5 s90.2585.3591.3050.480.95192.943.89
YOLOv8 s90.9285.291.7850.910.94882.803.78
YOLOv9 s89.8085.7791.1550.780.94773.134.18
YOLOv10 s89.3383.5790.5450.340.94443.134.20
REU-YOLO90.5887.4192.1051.440.96112.673.68
Disclaimer/Publisher’s Note: The statements, opinions and data contained in all publications are solely those of the individual author(s) and contributor(s) and not of MDPI and/or the editor(s). MDPI and/or the editor(s) disclaim responsibility for any injury to people or property resulting from any ideas, methods, instructions or products referred to in the content.