Article

Soil Calcium Gradients Drive Divergent Responses in Bacterial and Fungal Communities in Brassica Rhizosphere

1
Institute of Agricultural Resources and Environment, Hebei Academy of Agriculture and Forestry Sciences, Shijiazhuang 050051, China
2
Hebei Fertilizer Technology Innovation Center, Shijiazhuang 050051, China
*
Authors to whom correspondence should be addressed.
These authors contributed equally to this work.
Agronomy 2025, 15(9), 2212; https://doi.org/10.3390/agronomy15092212
Submission received: 21 August 2025 / Revised: 12 September 2025 / Accepted: 16 September 2025 / Published: 18 September 2025
(This article belongs to the Section Agricultural Biosystem and Biological Engineering)

Abstract

Calcium (Ca) is one of the most important elements determining vegetable yield, but the driving factors that regulate microbial community structure, microbial network system stability, and metabolic pathways along the soil Ca gradient remain unclear. In this work, the relationship between soil physicochemical properties and bacterial and fungal communities was investigated under distinct Ca gradients in well-established Chinese cabbage fields located in Shijiazhuang, Hebei Province, China, with sites named Group 1 (G1), Group 2 (G2), and Group 3 (G3) from lowest to highest along the soil Ca gradient. This study demonstrated that Ca exerts dual effects by modulating pH, electrical conductivity (EC), and soil organic carbon (SOC) dynamics, enhancing bacterial diversity while reinforcing fungal network stability through distinct metabolic adaptations. Bacterial networks showed reduced stability despite increased diversity, perhaps linked to the downregulation of ATP-binding cassette (ABC) transporters. Notably, Fe-Mn oxides counteracted Ca influences through selective nutrient adsorption, creating antagonistic selection pressures. Under calcium stress, both Ca and total P (TP) emerge as key drivers of microbial community restructuring, with fungal networks exhibiting significantly greater stability compared to their bacterial counterparts. This study bridges the knowledge gap in the driving mechanisms of microbial communities under soil Ca stress and provides a theoretical basis for improving vegetable yields, with implications for soil management in Ca-rich ecosystems.

Graphical Abstract

1. Introduction

Vegetables are crucial for human health because they typically support several essential substances for the human body, for example, dietary fiber, vitamins, antioxidants, etc. [1]. China is a major vegetable-producing country; its total cultivated land has increased ten-fold in the past two decades [2], and it has more than 80% of the total world cultivated land [3]. Such strong expansion largely depends on the widespread application of fertilizers, such as nitrogen (N), phosphorus (P), and potassium (K) [4,5]. Aside from these macronutrients, calcium (Ca) commonly plays a crucial role in the production of vegetables [6]. For instance, under conditions of low soil calcium concentration, cabbage exhibits symptoms such as “tipburn,” which significantly affects both crop yield and quality [7]. Notably, microorganisms are typically recognized as being key for the soil nutrient state, and their activity usually determines a plant’s biomass growth and allocation between above- and below-ground parts [8], thereby mechanistically controlling vegetable production and its quality. Nevertheless, knowledge of how Ca affects soil microbial activity and thus influences the quantity and quality of vegetables remains elusive, and addressing this knowledge gap may improve vegetable production.
Soil Ca likely plays a fundamental role in soil nutrient turnover and pH. Soil Ca deficiency can reduce the bioavailability of soil organic carbon (SOC) and increase SOC stocks [9]. Alleviating Ca stress can improve SOC persistence by increasing plant litter carbon and N transferred to soil-mineral-associated organic matter, which is primarily regulated by soil microbes [10]. Furthermore, the availability of soil NH4+ and K+ was highly associated with the binding capacity of soil colloids with Ca [11], and the lack of soil Ca can reduce the soil available P by accelerating the formation of insoluble Ca phosphates [12]. In addition, Ca can neutralize acidic ions via increasing soil pH [13]. In northern China, soil Ca predominantly exists as CaCO3, which correlates positively, albeit nonlinearly, with pH [14]. These important impacts of Ca will inevitably change the yield and quality of crops.
In addition, the structure of microbial communities can be altered by soil Ca. For example, Shabtai et al. demonstrated that soil Ca can increase hyphae-forming bacteria, increase litter input to the soil, and further affect microbial biomass, thus affecting the carbon use efficiency of the microbial community [10]. N, P, and K are most commonly used fertilizers in general, and it is well recognized that they play a critical role in soil microbial activity; yet, few studies consider the importance of Ca fertilizers [15]. In fact, as planting years are extended, vegetable absorption of Ca is seriously decreased [16], suggesting that an explicit understanding of Ca in soil microbes and vegetable production is urgently needed.
In North China, physiological Ca deficiency still occurs in vegetable growth even though soil Ca is typically sufficient, and is probably due to the other factors like soil temperature, humidity, and pH [17]. As such, physiological Ca deficiency has also been associated with different joint soil environmental factors [18]. Therefore, elucidating the impact of soil calcium on vegetable production through its regulation of microbial community structure and concomitant effects on soil physicochemical properties is essential to advance our understanding of the mechanisms by which calcium modulates yield and quality.
Chinese cabbage is one of the most important vegetables in China, with a very large planting area across North China [19]. In this study, the soil physicochemical properties were measured, and the microbial community structure was determined by high-throughput sequencing. The main objective of this study was to investigate the role of soil Ca on microbial community structure, as elucidating this process could influence vegetable production, i.e., quantity and quality.

2. Materials and Methods

2.1. Study Site

In this study, Chinese cabbage was collected as the sample vegetable. Three fields with different soil exchangeable Ca levels were chosen to represent the soil Ca gradient. Soil samples were obtained from four districts within Shijiazhuang, Hebei Province, China, including Xingtang (XT) (38°21′ N to 38°43′ N, 114°10′ E to 114°41′ E), Gaocheng (GC) (37°51′ N to 38°18′ N, 114°39′ E to 114°59′ E), Luancheng (LC) (37°47′ N to 37°59′ N, 114°28′ E to 114°47′ E), and Zhaoxian (ZX) (37°37′ N to 37°53′ N, 114°36′ E to 115°4′ E). These districts are situated in a warm temperate continental monsoon climate zone. The selected sampling areas are the principal regions for cabbage cultivation in Shijiazhuang, where the soil has been continuously cropped with cabbage (Brassica rapa L. subsp. pekinensis, cultivar “Beijing New No.3”) for more than two decades. The sampling period was 17 October–30 November 2022. Given their geographic proximity and minimal variation in soil physicochemical properties due to geographic factors, LC and ZX were consolidated into a single analytical zone. The sampling sites were categorized into three groups: Group 1 (XT, sampling points 1–7), Group 2 (GC, sampling points 1–6), and Group 3 (LC, sampling points 1–5; ZX, sampling points 1–2). According to the World Reference Base (WRB) for Soil Resources classification system, the study area comprises three distinct soil textural groups: Group 1 was characterized by sandy loam as the predominant textural class, Group 2 was primarily composed of loam, and Group 3 was dominated by silt loam textures (Figure S1 and Table S1). The soil types of Groups 1 and 3 were classified as Gleysols, and that of Group 2 was classified as Cambisols.

2.2. Sampling and Analysis

The 5-point sampling technique was used to collect soil samples [20]. Rhizosphere soils were collected for the analysis of fungal and bacterial communities. The soil directly adjacent to the cabbage roots, to a depth of 5 cm, was meticulously excavated. A soil sampler, angled at 45 degrees towards the roots, was employed to extract soil from a depth of 10–20 cm. These rhizosphere soil samples were placed in sterile bags, sealed, and then divided into two parts, one of which was flash-frozen in liquid nitrogen and expeditiously transported (to Shanghai Personal Biotechnology Co., Ltd., Shanghai, China) for DNA sequencing and subsequent analysis. The remaining part was passed through a 2 mm mesh sieve to remove debris, and subsequently utilized for the assessment of soil physicochemical properties after being air-dried.

2.3. Physical and Chemical Properties of Soil

The soil properties were assessed using the following analytical methods: SOC was quantified via the potassium dichromate oxidation method with external heating [21]; soil bulk density (BD) was determined using the core method [22]; total nitrogen (TN) was analyzed by the Kjeldahl method [23]; total phosphorus (TP) was assessed with the alkaline fusion-molybdenum-antimony spectrophotometric technique [24]; total potassium (TK) was quantified through hydrofluoric acid digestion [25]; nitrate nitrogen (NO3) was extracted with a potassium chloride solution, and subsequently measured spectrophotometrically [26]; available nitrogen (AN) was determined using a flow injection apparatus [27]; available phosphorus (AP) was determined by sodium bicarbonate extraction, followed by molybdenum-antimony spectrophotometry [28]; available potassium (AK) was analyzed using the ammonium acetate extraction method coupled with flame photometry [29]; and available zinc (Zn), manganese (Mn), iron (Fe), and copper (Cu) were measured by employing the diethylenetriamine pentaacetic acid (DTPA) extraction method [30]. Further, exchangeable calcium (Ca) and magnesium (Mg) were quantified using the ammonium acetate extraction method followed by atomic absorption spectrophotometry [31], and finally, soil electrical conductivity (EC) was measured using the glass electrode method [32].

2.4. Soil DNA Isolation

To investigate microbial properties in the selected sampling site, DNA was extracted from soil samples using the Power Soil DNA Isolation Kit (MoBio Laboratories, Carlsbad, CA, USA), starting with 0.5 g of fresh soil. The V3–V4 hypervariable region of the bacterial 16S rRNA gene was amplified with the primer pair 338F (5′-ACTCCTACGGGAGGCAGCA-3′) and 806R (5′-GGACTACHVGGGTWTCTAAT-3′; [33]). For fungal communities, the ITS1 region was amplified using the primers ITS5F (5′-GGAAGTAAAAGTCGTAACAAGG-3′) and ITS2R (5′-GCTGCGTTCTTCATCGATGC-3′; [34]). To permit multiplexing of samples, a 10 bp barcode unique to each sample was attached to the 5′ end of primers. Polymerase chain reaction (PCR) was performed with 50 μL reaction volumes: 5 μL 10× Ex Taq Buffer (Mg2+ plus), 4 μL 12.5 mM dNTP Mix, 1.25 U Ex Taq DNA polymerase (TaKaRa Bio Inc., Otsu, Shiga, Japan), 2 μL template DNA, and 36.75 μL ddH2O. For the 16s rRNA gene, the PCR thermal cycling condition was 94 °C for 2 min, followed by 30 cycles of 94 °C for 30 s, 57 °C for 30 s, and 72 °C for 30 s, with a final extension at 72 °C for 10 min. For the ITS1 region, the thermal cycling condition was 95 °C for 5 min, followed by 35 cycles of 95 °C for 45 s, 55 °C for 50 s, and 72 °C for 45 s, with a final extension at 72 °C for 10 min. PCR for each sample was performed in triplicate and negative controls were included in each batch of PCR. PCR products were pooled in equimolar concentrations and purified with the QIA quick Gel Extraction Kit (Qiagen, Hilden, Germany). The purified PCR products were sequenced on the Illumina MiSeq platform (Illumina, San Diego, CA, USA).

2.5. Data Analysis and Calculation

2.5.1. Analysis of Soil Physical and Chemical Properties

Soil physicochemical properties and microbial community composition were analyzed using Excel 2019 (Microsoft Corporation, Redmond, WA, USA) and Origin 2022 (OriginLab Corporation, Northampton, MA, USA). Statistical comparisons among groups were conducted using one-way analysis of variance (ANOVA) implemented in SPSS 26.0 (IBM Corporation, Armonk, NY, USA). Post hoc multiple comparisons were performed using Tukey’s Honestly Significant Difference (HSD) test if not otherwise specified.

2.5.2. Analysis of Microbiological

The data analysis and visualization were facilitated by RStudio 2024.12.1 Build 563 (Posit, Boston, MA, USA) and R (v4.4.3). To assess the variability in bacterial and fungal community compositions among different sites, hierarchical clustering analysis, principal coordinate analysis (PCoA), and permutational multivariate analysis of variance (PERMANOVA) were employed. Alpha diversity was used to assess species diversity within habitats, with the Chao1 index characterizing richness, the Shannon–Wiener index characterizing diversity, and the Pielou index characterizing evenness, with significance tests performed between groups.
In the study of microbial community, Detrended Correspondence Analysis (DCA) axis lengths >4 (4.9 for bacteria and 3.7 for fungi) indicate strong unimodal species–environment relationships, justifying the use of canonical correspondence analysis (CCA) [35]. CCA was performed using the “vegan” package (v2.6-8), and significance tests for environmental factors were performed using the “envfit” function (999 permutations) to identify significant drivers [36]. A two-way stepwise selection method was used to dynamically adjust the set of variables, and bacteria or fungi amplicon sequence variants (ASVs) were used as the response variable to screen out the environmental factors with both the minimum Akaike Information Criterion (AIC) and Variance Inflation Factor (VIF < 10), which effectively solved the complex covariance problem. Mantel tests were performed to assess the correlation between the screened environmental factors and the alpha diversity of the corresponding bacterial and fungal communities using the ‘linkET’ software package (v0.0.7.4). To determine species importance indicators, i.e., to find marker species, a random forest model (RFM) was used [37].
Bacterial and fungal co-occurrence networks were reconstructed using the Weighted Gene Co-expression Network Analysis (WGCNA) package (v1.73) [38]. To identify environmental–ASV associations, a secondary correlation matrix was constructed between ASVs and physicochemical parameters (e.g., pH, SOC). All p-values were adjusted for multiple comparisons using the Benjamini–Hochberg (BH) procedure at FDR < 0.05. The final networks were visualized in Gephi (v0.10), with node sizes scaled to betweenness centrality and edge weights reflecting correlation strength (|r| > 0.6, adjusted p < 0.05).

2.5.3. Calculation of Microbial Function Prediction

Microbial metabolic potentials were predicted from 16S rRNA amplicon sequencing data using Tax4Fun2 (v1.1.6) with default parameters, which map ASVs to Kyoto Encyclopedia of Genes and Genomes (KEGG) orthologs via a closed-reference approach against the SILVA132 database. We then normalized the ASV abundance by 16S rRNA gene copy numbers [39]. KEGG level 2 pathways were examined, and only pathway annotations with average relative abundance > 1% across samples were retained to focus on ecologically relevant functions [40]. For pathways exhibiting significant divergence at level 2, significance testing was subsequently conducted at level 3 resolution to identify the specific sub-pathways responsible for these differences (all p < 0.01, BH procedure). Fungal trophic modes, functional groups, and growth morphology were predicted from ITS rRNA amplicon sequencing data using a Python-implemented FUNGuild (v1.1) with the FUNGuild_db reference database [41].

3. Results

3.1. Physicochemical Properties of Soil

The physical and chemical properties of the soil samples in the study area varied greatly in terms of the chemical indicators pH and EC; the macroelements TP, AP, TK and NO3-N; medium elements Ca and Mg; the microelement Fe; and especially Ca, which increased significantly from G1 to G3 (Table 1). Specifically, there were no significant differences in soil BD, macroelements such as SOC, TN, AN, and AK, and microelements such as Mn, Cu, and Zn among the study sites (Table 1). Notably, there was an obvious exchangeable Ca gradient between the study sites; that is, compared with G1, the exchangeable Ca content of G2 and G3 was 3.31 and 3.79 times higher, respectively (Table 1). Meanwhile, soil pH exhibited the same trend with Ca among the sampling points. Compared with G1, the soil pHs of G2 and G3 were 1.33 and 1.47 units higher, respectively (Table 1). Additionally, soil TP and EC were significantly lower in G1 than in G2 (p < 0.05), while TK was significantly higher (p < 0.01). Moreover, the soil Fe and AP content was significantly higher in G1 than in G2 and G3 sites (p < 0.01), and the NO3 content in G3 was significantly lower than those in G1 and G2 (p < 0.05). For Mg distribution, a marked reduction of 30.8% occurred in G3 compared to G2 (p < 0.05). There was an obvious soil Ca gradient among the study sites, which may be largely attributed to the differences in their respective hydrological conditions and nutrient inputs.

3.2. Taxonomic and Compositional Differences in Soil Bacterial and Fungal Communities on a Soil Ca Gradient

The results of the hierarchical clustering analysis demonstrated that the composition of soil bacterial and fungal communities varied significantly along soil Ca gradients among sampling sites (Figure S2). Pairwise Adonis tests were performed to compare the bacterial and fungal communities across sampling sites (Table S2). The results showed that the species composition between G1, G2, and G3 differed significantly (Adonis, p < 0.01). The principal coordinate analysis (PCoA) revealed that the bacterial and fungal communities were distinctly separated along the first principal coordinate (PCoA1), with G1 completely distinct from G2 and G3 (Figure 1). In contrast, G2 and G3 exhibited a primary separation along the second principal coordinate (PCoA2), indicating significant differences (Adonis, p < 0.001).

3.3. Alpha Diversity and CCA of Soil Bacterial and Fungal Communities Across a Ca Gradient

The alpha diversity of soil bacteria and fungi was calculated and the results showed significant differences in soil Ca gradients (Figure 2). Bacterial community richness was found to be significantly higher in G2 than in G1, and diversity and evenness were also significantly higher in G2 and G3 than in G1, which may be due to the fact that soil Ca deficiency significantly reduces the alpha diversity of bacterial communities [42].
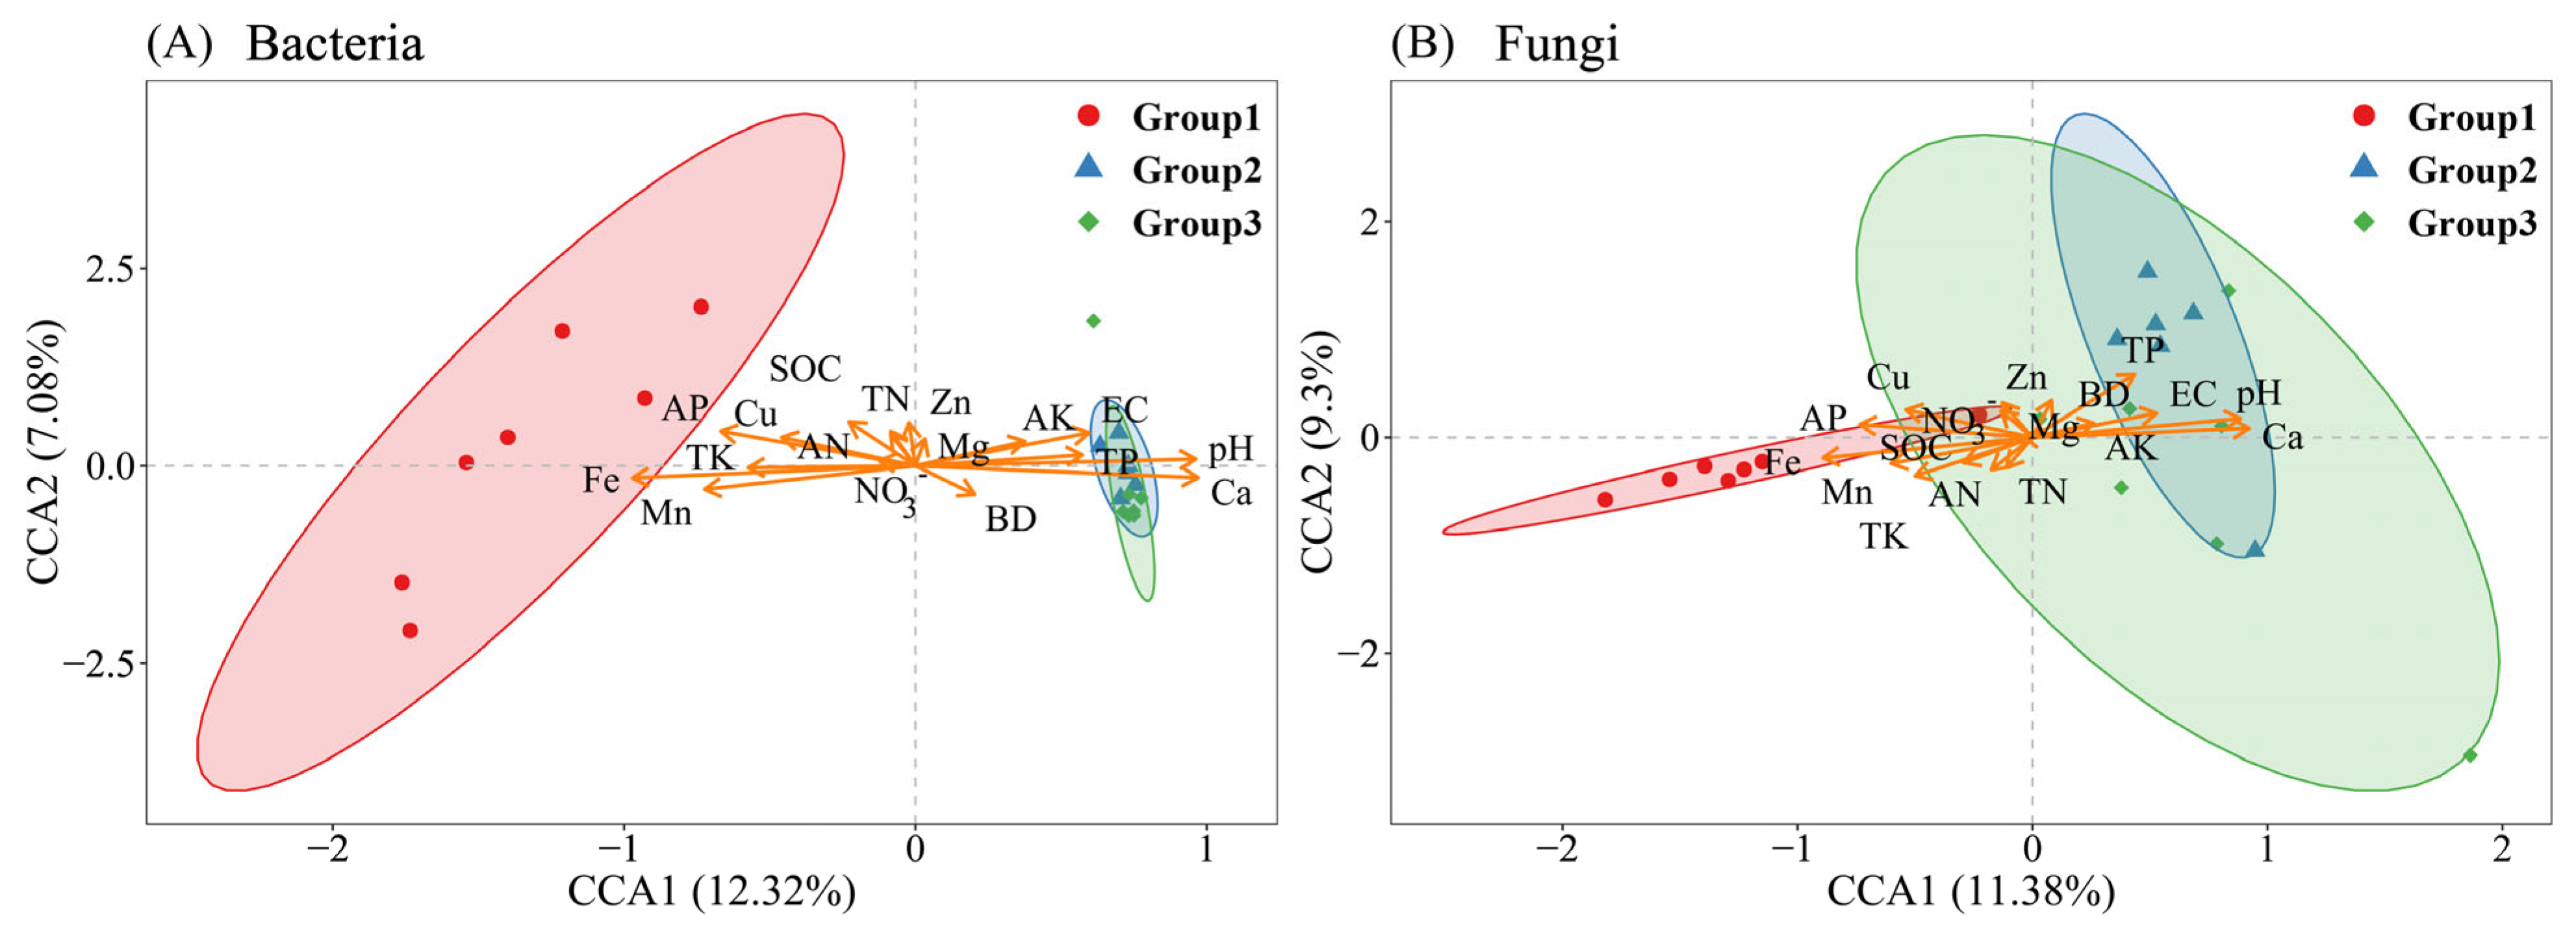
The CCA ordination revealed significant associations between bacterial and fungal community composition and environmental variables (Figure 3). Permutation-based “envfit” analysis identified ten environmental factors that significantly influenced bacterial community structure (Table S3). Of these factors, all except SOC also showed significant effects on fungal community structure (Table S4). In particular, pH, Ca, and Fe were identified as strong drivers (r2 > 0.8, p = 0.001) of both bacterial and fungal community structure. The ordination biplot demonstrated distinct environmental gradients along CCA 1: soil pH and Ca were strongly positively correlated with this axis, reflecting their dominant roles in shaping community composition. In contrast, Fe showed a significant negative correlation, suggesting an antagonistic effect. Furthermore, EC (r2 = 0.549, p = 0.001) and AP (r2 = 0.668, p = 0.001) were identified as significant drivers of bacterial community structure, whereas TP (r2 = 0.622, p = 0.001) emerged as a key determinant for fungal assemblages, highlighting divergent environmental controls between bacterial and fungal communities.

3.4. Drivers of Soil Bacterial and Fungal Community Alpha Diversity

The Mantel test was used to examine the effects of soil physicochemical properties on bacterial and fungal community composition, and the environmental factors screened showed different correlations with microbial community diversity (Figure 4).
At site G1, there was no significant correlation between soil environmental factors and bacterial Alpha diversity (Table S5). In the G1 site, soil TK (r = 0.800, p = 0.022) was strongly associated with the fungus Shannon–Wiener, while AK (r = 0.452, p = 0.045) was associated with Pielou (Table S6). In the G2 site, bacterial Chao1 was associated with AN (r = 0.473, p = 0.046), and TP (r = 0.879, p = 0.033) had a significant effect on bacterial Pielou (Table S7). In the G3 site, SOC, TN, Mn, AN, and Mg had a significant effect on fungal Shannon–Wiener and Pielou (r > 0.53, p < 0.05), in addition to TK (r = 0.400, p = 0.028) having a significant effect on fungal Shannon–Wiener and TP (r = 0.536, p = 0.036) having a significant effect on fungal Chao1 (Table S8). Notably, the absence of significant environmental drivers in G3 communities persisted despite rigorous variable selection, suggesting guild-specific environmental sensitivity (Figure 4E,F; Tables S9 and S10).
Finally, under different Ca gradient conditions, Ca and EC had significant effects on bacterial Shannon–Wiener and Pielou (p < 0.05), with only Ca having strong correlations in Shannon–Wiener (r = 0.539) and Pielou (r = 0.734) (Figure S3). In addition, bacterium Pielou was also significantly correlated with Cu (r = 0.234, p = 0.012) (Table S11). Meanwhile, the fungus Chao1 was significantly affected by Mn (r = 0.282, p = 0.025) and EC (r = 0.289, p = 0.011) (Figure S4; Table S12). These results highlight that the alpha diversity of bacterial and fungal communities on Ca gradients has different patterns of response to environmental variables, with Ca shaping the diversity and evenness of bacterial communities.

3.5. Important Species for Differences in Bacterial and Fungal Community Composition Along Soil Ca Gradient

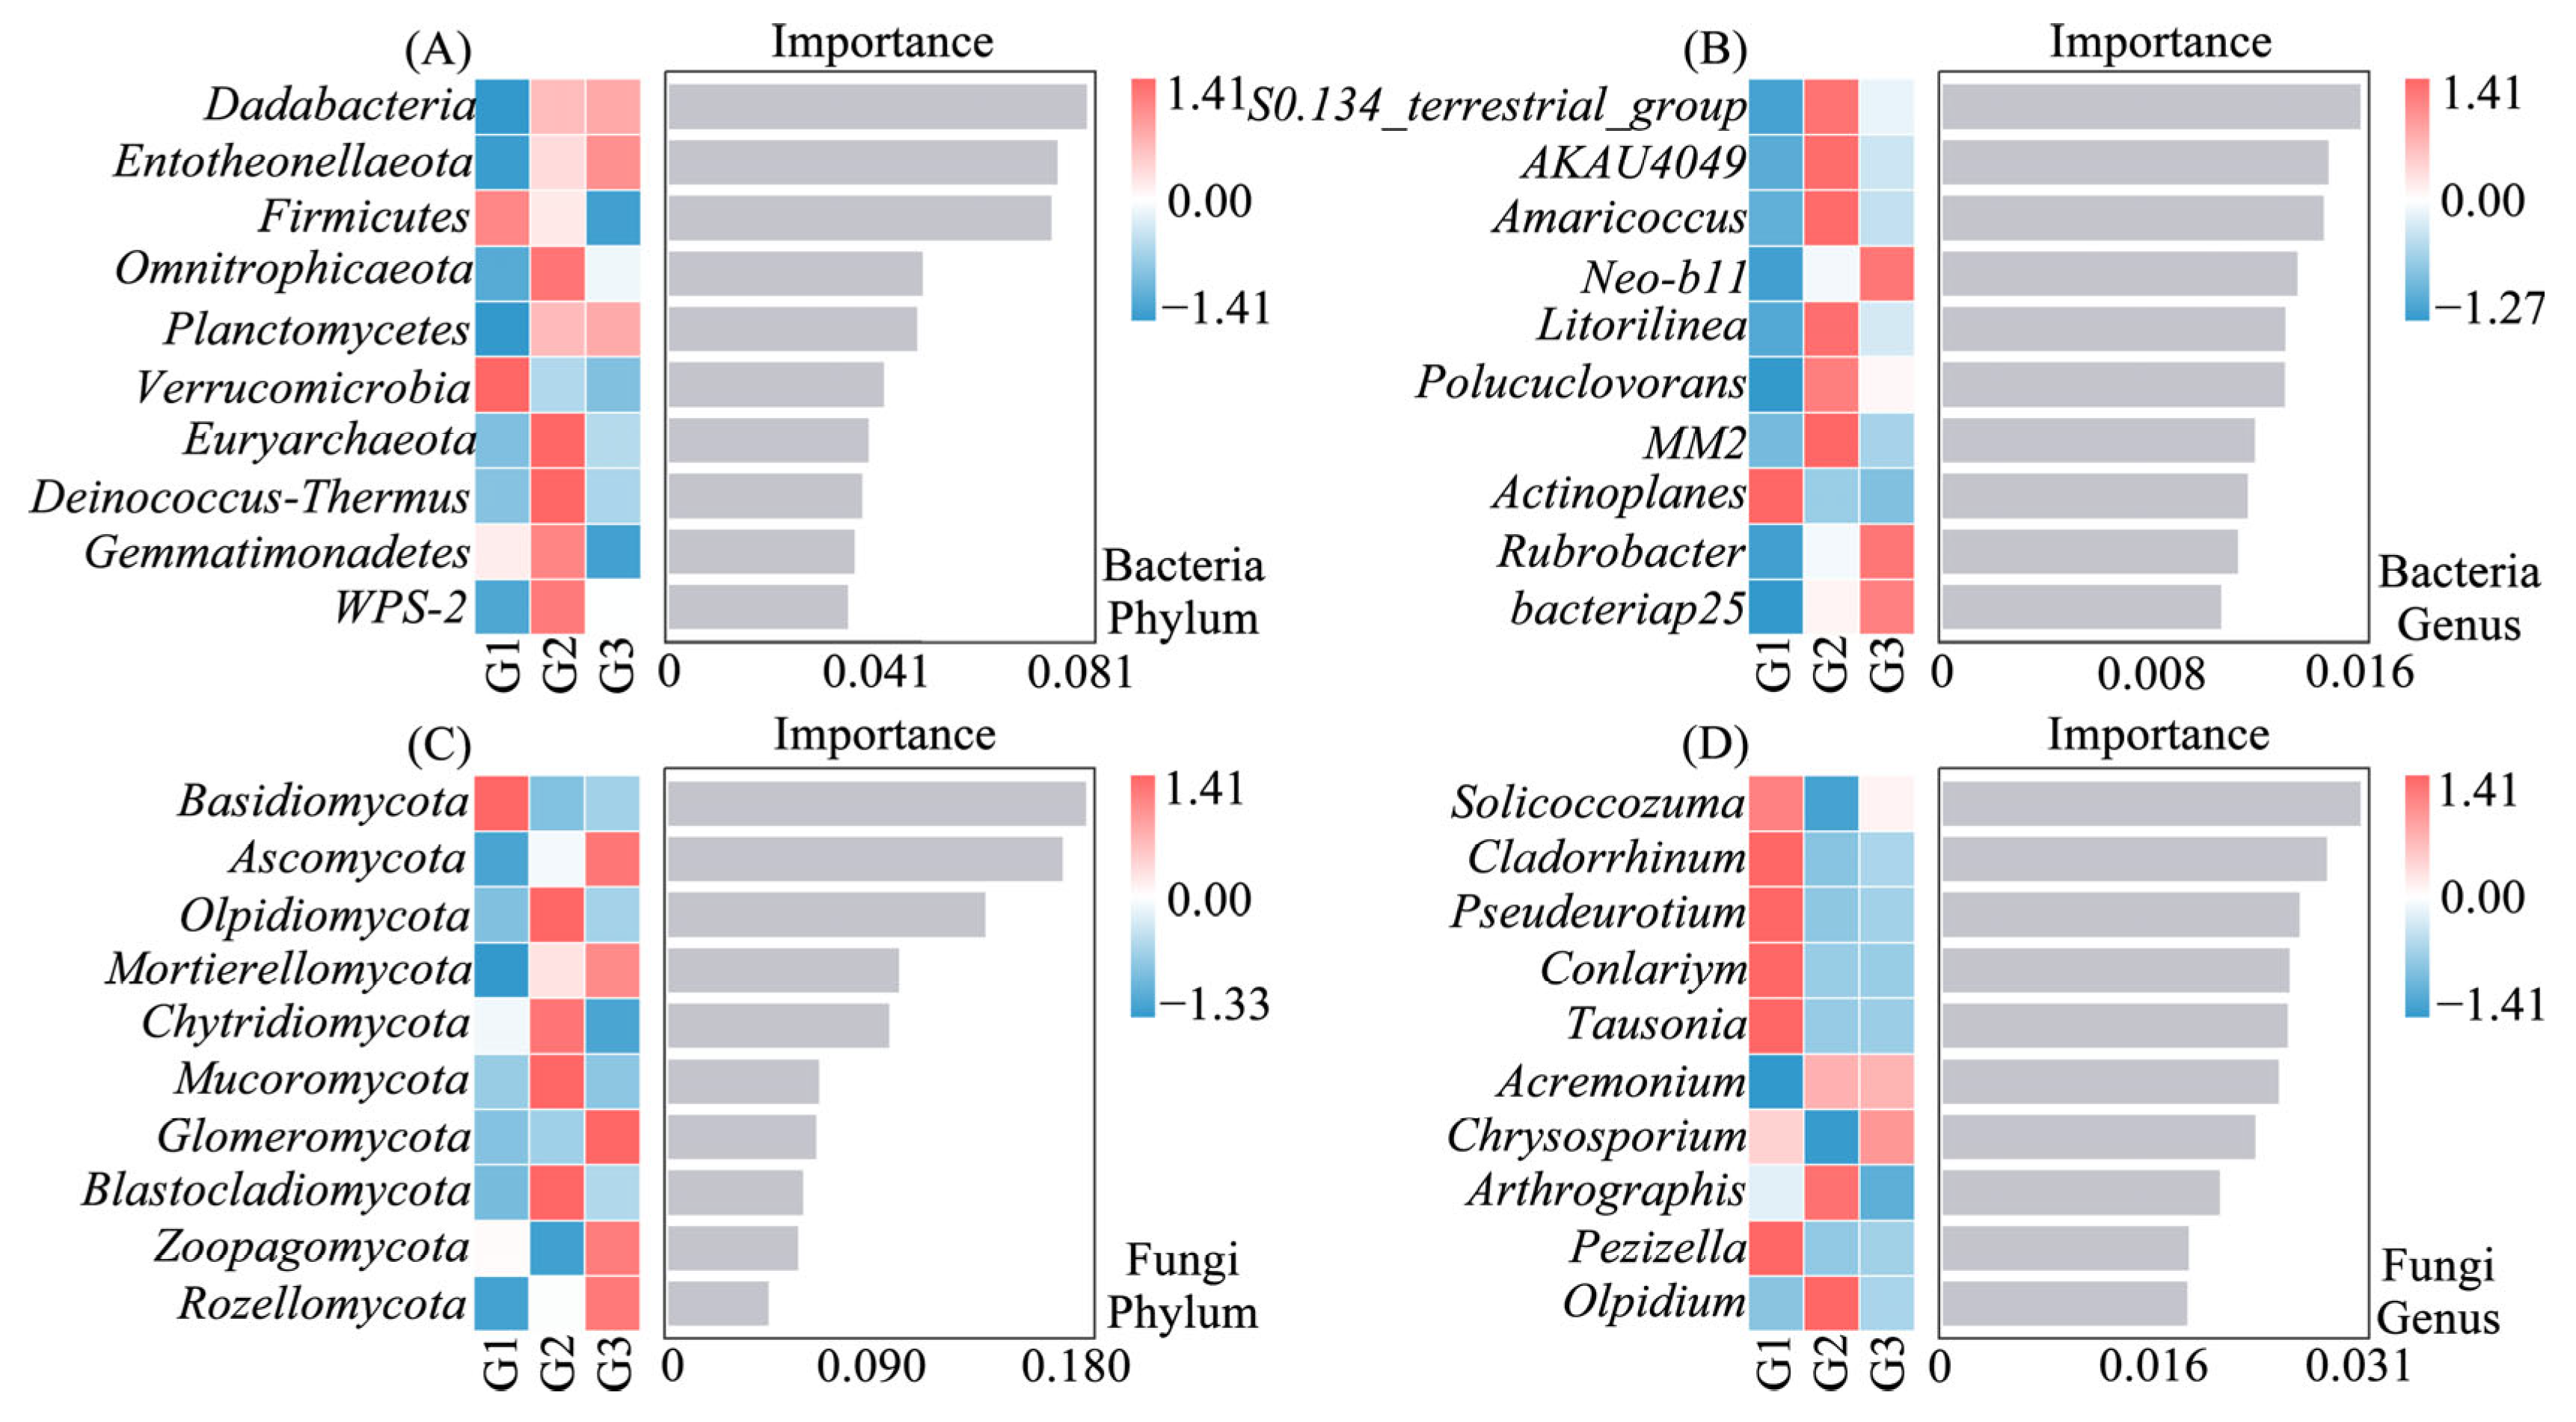
Indicator species reflecting differences in bacterial and fungal community composition along soil Ca gradients were identified at both the phylum and genus levels (Figure 5). At the phylum and genus level, species with a relative abundance of more than 1% in soil bacteria and fungi were screened (Figure S5). RFM results indicated that Dadabacteria and S0134_terrestrial_group were the most important phylum and genus for differences in bacterial community composition along soil Ca gradients, while the most important species for differences in fungal community composition were Basidiomycota and Solicoccozyma.
The relative abundance of bacteria phylum-level marker differential species was greater than 1% for Firmicutes (1.50–10.22%), Gemmatimonadetes (3.35–6.41%), and Planctomycetes (0.4–3.35%), with Firmicutes being enriched in the G1 site (p < 0.05). No species exhibited a relative abundance greater than 1% among those that differed in markers at the bacterial genus level. At the fungal phylum level, differential species were all dominant. The major fungal phyla were Ascomycota (61.29–86.11%), Basidiomycota (0.45–27.51%), Mortierellomycota (1.53–9.08%), and Olpidiomycota (0.04–12.71%). Ascomycota were found to be absolutely dominant in the samples [43,44]. Significant differences were observed between groups at the Ascomycota, Basidiomycota, and Olpidiomycota levels (p < 0.05). Tausonia (0.03–23.38%) was identified as the dominant genus-level marker species, exhibiting a significantly higher relative abundance in the G1 site compared to the G2 and G3 sites (p < 0.05).

3.6. Effects on Soil Bacterial and Fungal Community Networks of Ca Gradients

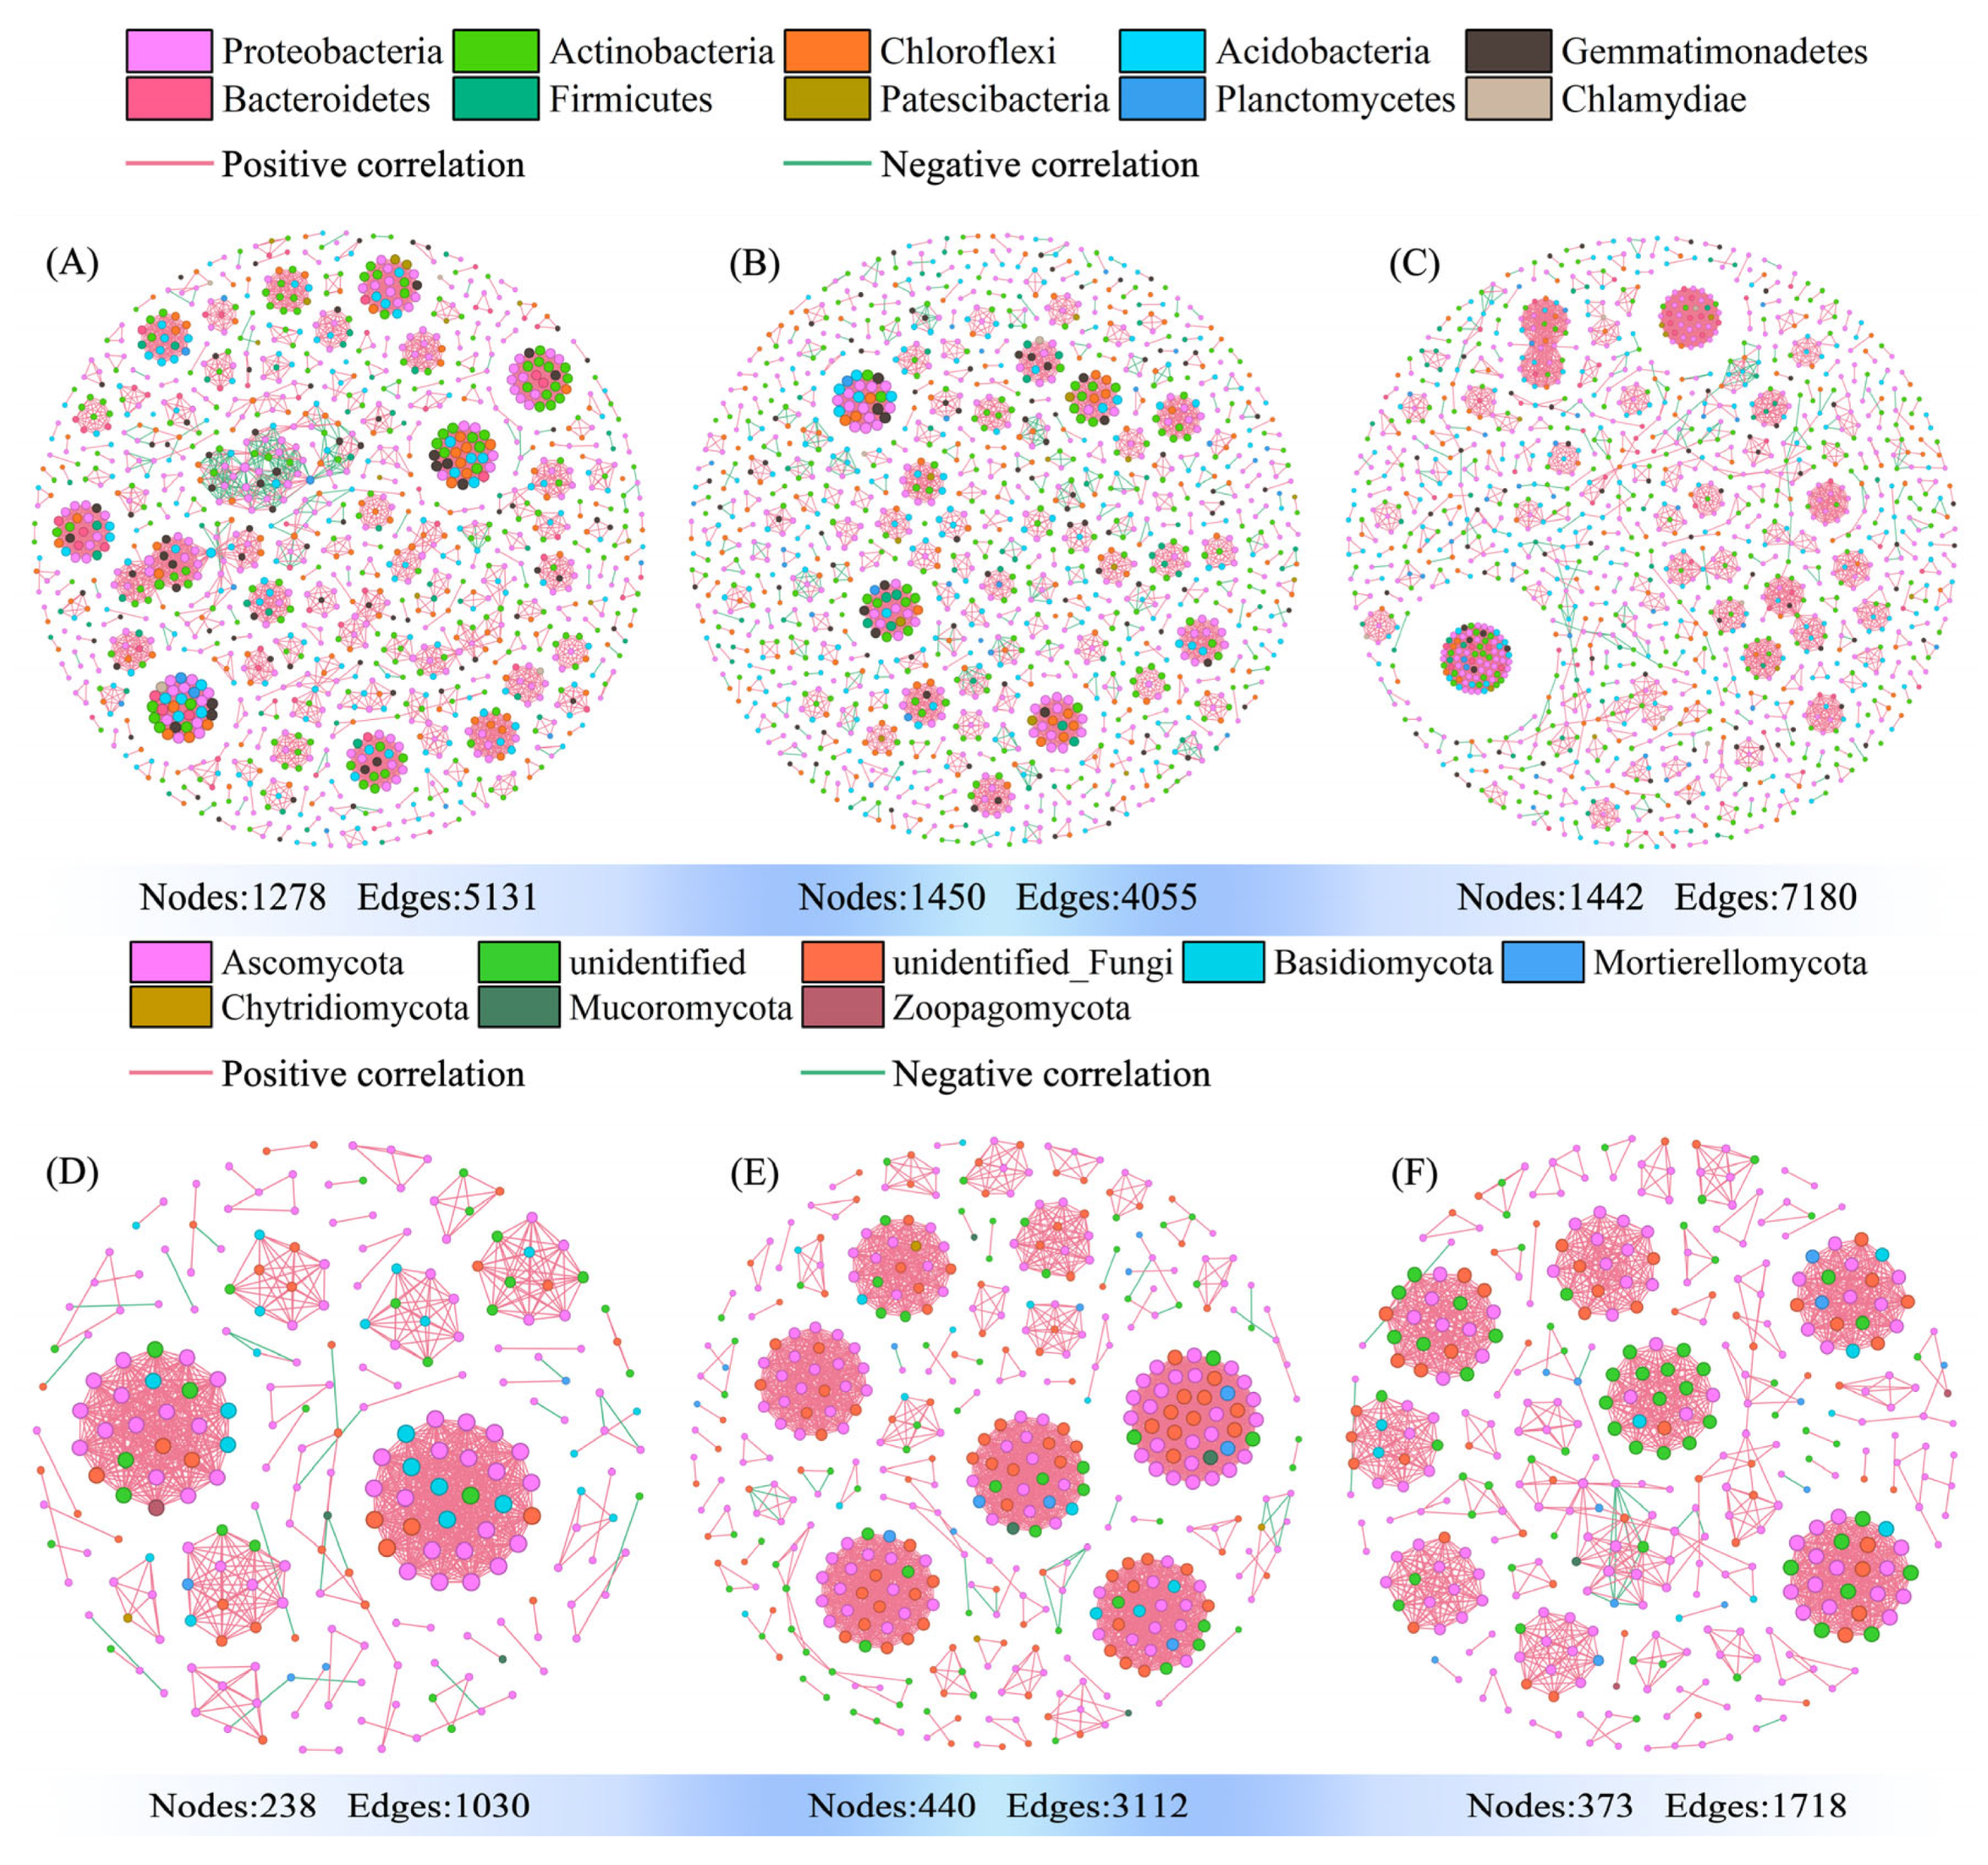
Co-occurrence network analysis reveals unique topological patterns (Figure 6) and environmental–ASV associations (Figure 7, Figures S6 and S7) within soil bacterial and fungal communities under Ca gradients. Bacterial and fungal networks of significant positive co-occurrences showed marked differences in average degree and modularity between groups (Table S13). Mechanisms driving the process of bacterial and fungal community building in soil environments with different Ca gradients were analyzed based on environment–ASV associations (Table S14).
The G1 bacterial network, with high modularity (0.954), may represent a stable state, and is mainly sensitive to environmental factors such as EC (Figure 7A). In contrast, the G2 bacterial network, despite having a lower average degree (5.593), showed the highest modularity (0.962), implying strong functional segregation, possibly shaped by the filtering of environmental factors such as Zn and Ca (Figure 7B). The G3 bacterial network had the highest interaction complexity, with the highest average degree (9.958), indicating a densely connected community. However, its degree of modularity (0.711) was significantly lower than that of G1 (0.954) and G2 (0.962), suggesting that the bacterial community in G3 was less stable. In the process of G3 bacterial community formation, Proteobacteria were most affected by environmental factors (Figure 7C). Notably, far fewer fungal species were influenced by environmental factors compared to bacterial species, with Ascomycota identified as the main fungal phylum affected by these factors (Figure 7D–F).
Environment–ASV association patterns revealed Ca and TP as key drivers shaping both bacterial and fungal community structures (Figures S6 and S7) [45]. Strikingly, specific bacterial phyla showed multivariate environmental coupling through simultaneous positive correlations with Ca, TP, and EC, whereas distinct groups showed exclusive negative associations with individual parameters (Figure S6). In particular, the bacterial network has significantly more nodes and edges (bacteria, nodes: 1100, edges: 1612; fungi, nodes: 82, edges: 89) but shows lower modularity (0.431 vs. 0.534) and higher average degree (2.931 vs. 2.171), reflecting the different environmental sensitivities of the bacterial and fungal communities and the presence of key environmental factors driving changes in community structure. This topology on Ca and TP formed specialized central nodes (Figures S6 and S7).

3.7. Annotating and Analyzing KEGG in Soil Bacterial Communities and FUNGuild Function in Fungal Communities Along Ca Gradients

Significant divergences in bacterial metabolic potentials were observed across sampling sites (G1, G2, G3) through hierarchical analysis of KEGG pathways at levels 2 and 3 (Figure 8). Significance testing revealed the distinct functions of bacterial communities, with six pathways at level 2 showing statistically significant variations (Figure S8).
Notably, membrane transport displayed marked differences (G1 > G2/G3, p < 0.01), driven by its sub-pathway ABC transporters (G1 > G2/G3, p < 0.01) and bacterial secretion system (G1 < G2/G3, p < 0.01). Signal transduction variations (G1 < G2, p < 0.01) primarily stemmed from two-component-system regulation (G1 < G2, p < 0.01). Similarly, Xenobiotic biodegradation and metabolism exhibited group-specific patterns (G1 vs. G2/G3), with 80% of its level-3 sub-pathways (n = 15) exhibiting G2- and G3-specific depletion, mainly including Benzoate (G1 vs. G2) and Aminobenzoate degradation (G1 vs. G2/G3). Metabolism of other amino acid variations (G1 vs. G2) primarily stemmed from Glutathione metabolism regulation (G1 vs. G2/G3). Replication and repair differences (G1 vs. G2/G3) were attributed to five DNA maintenance mechanisms with essentially the same relative abundance. Translation disparities involved Ribosome (G1 vs. G2/G3) and Aminoacyl-tRNA biosynthesis pathways (G1 vs. G2), perhaps suggesting differential translational efficiency across sites.
Level 2 (n = 16) screening identified broad functional categories, and Level 3 (n = 30) analysis identified 23 specific biochemical mechanisms with significant differences that drive metabolic differences at the ecosystem level.
Trophic mode and functional groupings of fungal communities along the Ca gradient were predicted using FUNGuild (Figure 9). The results showed that seven trophic modes could be classified, dominated by saprotrophs, pathotrophs–saprotrophs–symbiotrophs, and pathotrophs–saprotrophs, the three major functional categories with an average relative abundance of more than 10% between groups (Figure 9A). The functional groups were dominated by undefined saprotrophs and wood saprotrophs, the two major functional categories with mean relative abundances of 50–65% and 28–37%, respectively (Figure 9B). Although G2 appeared to differ from G1 and G3 in terms of trophic and functional categories, this difference was not significant (Figure S9). The predicted growth morphology heatmap from FUNGuild showed that all fungi along the Ca gradient existed predominantly as microfungal growth forms (Figure S10).

4. Discussion

4.1. Changes in the Structural Composition of Microbial Communities Along Ca Gradients and Their Drivers

Soil Ca element was widely recognized as a key determinant of soil microbial community structure, primarily through its impact on environmental factors such as pH, EC, and SOC [46,47,48]. Ca was frequently utilized to neutralize soil acidity, thereby enhancing soil microbial community structure [49,50]. Furthermore, the vast majority of microorganisms were highly sensitive to changes in EC, as evidenced by significant differences in microbial communities between salt-rich and salt-poor soils [46]. Therefore, along the soil Ca gradients, the neutralizing capacity and ion concentration of the soil solution increase, leading to an increase in pH and EC, which in turn changes the microbial community structure [47]. Additionally, Ca also influences SOC dynamics by reducing SOC availability and promoting its storage through mechanisms such as co-precipitation, encapsulation, adsorption, and complexation [48]. These processes have been linked to changes in microbial community diversity and network complexity [51]. However, this study found that there was no significant difference in SOC under soil Ca gradients. This could be attributed to the enrichment of fungal taxa such as Ascomycota, Mortierellomycota, and Mucoromycota in G2 and G3 sites (Figure 5C), which were known to promote SOC mineralization [52,53,54]. The extracellular enzymes secreted by these fungi play a key role in SOC mineralization and decomposition [55]. The contradictory results may be due to the fact that the mineralization efficiency of SOC by soil fungi may be greater than the sequestration rate of SOC by bacteria, thus offsetting the potential for increased SOC storage under high Ca conditions [56].
This study elucidates an extremely significant positive correlation between Ca and bacterial diversity and evenness (Figure S3). Specifically, Ca increased bacterial alpha-diversity (Figure 2B,C). However, Ca had no significant effect on fungal alpha-diversity (Figure 2D–F), and Mn had a significant positive correlation on fungal abundance (Figure S4), although this did not alter the alpha-diversity of fungal communities. Fe and Mn showed antagonistic spatial trends with Ca, suggesting that these two elements exerted selection pressures opposite to those of Ca in the ecosystems studied (Figure 3). This pattern might be explained by the formation of Fe-Mn oxides, which accumulate, mineralize, and selectively adsorb elements such as TP, AP, and Mg. For example, Fe-Mn plaques were known to adsorb phosphates [57,58,59]. These behaviors can produce changes in the composition of microbial communities. For instance, Fe and Mn in the soil were found to promote the aggregation of microbial groups, including Gemmatimonadetes, Bacilli, Subgroup-6, and Chytridiomycetes (Figure S5) [60]. Meanwhile, Fe also has the ability to modulate the structure of microbial communities, for example, by increasing the enrichment of Verrucomicrobia (Figure 5A), thereby altering the structure of the bacterial community [61,62].

4.2. Driving Mechanisms for Changes in Microbial Network Stability and Complexity and Metabolic Pathway Dynamics Along Ca Gradients

The stability of microbial communities appears to be more complex than their compositional structure [63]. Analysis of topological parameters (including average degree and modularity) in bacterial and fungal co-occurrence networks revealed divergent trends in stability and complexity along the Ca gradient, though ultimately the network complexity remained unaffected (Tables S13 and S14) [64,65,66]. This pattern suggests that fungal communities may exhibit progressively enhanced stability under Ca stress, while bacterial communities show the opposite response, potentially resulting in greater stability in fungal versus bacterial networks; however, these observations are derived solely from the current dataset and lack broad validation, and thus may not be universally applicable.
Notably, a significant decrease in ABC transporters and a marked increase in two-component systems within KEGG pathways were observed as calcium concentrations increased sharply (Figure S9). The downregulation of ABC transporters, which participate in calcification processes, may represent an adaptive response to Ca stress [67]. This trend was accompanied by a decline in the relative abundance of Firmicutes, a bacterial phylum closely associated with transmembrane transport and serving as a biomarker for bacterial communities (Figure 5A) [68]. Guo et al. showed that the two-component-system pathway emerged as particularly influential in maintaining community stability [69]. However, this mechanism did not extend to bacterial networks under Ca stress, highlighting a fundamental functional divergence between fungal and bacterial responses to Ca stress. These findings underscore the distinct stabilization strategies employed by different microbial taxa under environmental pressure.
The KEGG pathway is a “map” for decoding microbial functional genes and systematically predicting microbial metabolic capacity, ecological roles, and potential applications [70]. Future assessment and management of soil health can promote sustainable soil management to facilitate the greening of agriculture [71]. This study provides novel mechanistic insights into how calcium gradients differentially modulate bacterial and fungal community stability, metabolic functions, and network interactions in Chinese cabbage soils.

5. Conclusions

This study elucidates the patterns, driving factors, and metabolic pathway mechanisms underlying the changes in soil bacterial and fungal community structure along a Ca gradient in Chinese cabbage fields. The findings demonstrate that Ca plays a dual role in shaping soil microbial communities by modulating pH, EC, and SOC dynamics. While Ca enrichment was associated with increased bacterial diversity and enhanced fungal network stability, it did not significantly affect fungal alpha diversity. This lack of response may be attributed to counteracting effects resulting from fungal-driven SOC mineralization. The antagonistic spatial trends between Ca and Fe-Mn further highlight contrasting selection pressures, with Fe-Mn oxides influencing microbial compositions through selective adsorption of key nutrients. These results underscore the distinct responses of bacterial and fungal communities to Ca-mediated environmental changes, emphasizing the importance of element interactions in regulating microbial community structure and function.
Contrasting stability patterns were exhibited between bacterial and fungal communities along a Ca gradient, with fungal networks exhibiting enhanced stability under Ca stress while bacterial networks showed reduced stability. These divergent responses were perhaps associated with significant metabolic shifts, including downregulation of ABC transporters (linked to Ca adaptation) and upregulation of two-component systems in bacteria.
These discoveries not only refine theoretical models of Ca-driven microbial community dynamics, but also identify Ca and TP as the key factors shaping microbial community structures under different soil Ca gradients. However, due to data limitations, the observed correlations indicate potential causative relationships. Further investigations were necessary to establish causal links between environmental factors and microbial community structures under soil Ca gradients.

Supplementary Materials

The following supporting information can be downloaded at https://www.mdpi.com/article/10.3390/agronomy15092212/s1: Figure S1. Soil classification according to the soil texture (source: World Reference Base for Soil Resources); Table S1. Soil sample texture data: fractions of sand, silt, and clay; Note: SL, L, SCL, and SIL, stand for Sandy Loam, Loam, Sandy Clay Loam, and Silt Loam, respectively; Figure S2. Dendrogram from cluster based on Bray–Curtis distances; Table S2. Analysis of differences between groups of soil bacteria and fungi; Table S3. Results of the multivariate regression analysis (envfit) for bacterial communities, showing the correlation of environmental factors with the non-constrained axes of the CCA. Note: Arrows indicate environmental variables, significant to “*” indicates p < 0.05, “**” indicates p < 0.01, and “***” indicates p < 0.001; Table S4. Multivariate regression (envfit) of environmental factors fitted to the non-constrained axes of the CCA for fungal communities. Note: Arrows indicate environmental variables, significant to “*” indicates p < 0.05, “**” indicates p < 0.01, and “***” indicates p < 0.001; Figure S3. Mantel analysis of soil physicochemical properties and bacteria community Chao1, Shannon–Wiener, and Pielou in different calcium gradients; Figure S4. Mantel analysis of soil physicochemical properties and fungi community Chao1, Shannon–Wiener, and Pielou in different calcium gradients; Table S5. Mantel analysis results of soil physicochemical properties and bacterial community Chao1, Shannon–Wiener, and Pielou in the G1 site; Table S6. Mantel analysis results of soil physicochemical properties and fungi community Chao1, Shannon–Wiener, and Pielou in the G1 site; Table S7. Mantel analysis results of soil physicochemical properties and bacterial community Chao1, Shannon–Wiener, and Pielou in the G2 site; Table S8. Mantel analysis results of soil physicochemical properties and fungi community Chao1, Shannon–Wiener, and Pielou in the G2 site; Table S9. Mantel analysis results of soil physicochemical properties and bacterial community Chao1, Shannon–Wiener, and Pielou in the G3 site; Table S10. Mantel analysis results of soil physicochemical properties and fungi community Chao1, Shannon–Wiener, and Pielou in the G3 site; Table S11. Mantel analysis results of soil physicochemical properties and bacterial community Chao1, Shannon–Wiener, and Pielou under different calcium gradients; Table S12. Mantel analysis results of soil physicochemical properties and fungi community Chao1, Shannon–Wiener, and Pielou under different calcium gradients; Figure S5. The relative abundances of species with more than 1% abundance at the phylum and genus levels in the rhizosphere bacteria and fungi of cabbage across the groups are shown. (A) Bacterial distribution at the phylum level; (B) bacterial distribution at the genus level; (C) fungal distribution at the phylum level; (D) fungal distribution at the genus level; Figure S6. Co-occurrence network of bacterial communities and environmental factors along a calcium gradient. Here, colored dots indicate bacterial phylum and gray dots indicate environmental factors. Red and green lines indicate positive and negative interactions, respectively; Figure S7. Co-occurrence network of fungal communities and environmental factors along a calcium gradient. Here, colored dots indicate fungal phylum and gray dots indicate environmental factors. Red and green lines indicate positive and negative interactions, respectively; Table S13. Topological parameters of co-occurring networks of soil bacterial and fungal communities along a calcium gradient; Table S14. Topological parameters of co-occurring networks of soil bacterial and fungal communities along a calcium gradient based on the environment-ASV; Figure S8. Relative abundance of dominant KEGG level 3 pathways (>0.1%) in soil samples with different calcium gradients. Different lowercase letters represent significant differences among sampling sites (p < 0.01). Alternating white and green faceting are KEGG level 2 pathways corresponding to KEGG level 3 pathways; Figure S9. The relative abundance of trophic modes (A) and guilds (B) assigned by FUNGuild for fungal communities. Different lowercase letters represent significant differences among sampling sites (p < 0.01); Figure S10. Heatmap of growth morphology of soil fungal communities along a calcium gradient.

Author Contributions

Conceptualization, Z.J. and L.W.; methodology, Z.J.; software, J.L., Y.L. and L.J.; validation, R.L., L.W. and J.S.; formal analysis, J.L. and L.J.; investigation, R.L., Y.L. and L.G.; resources, L.W.; data curation, R.L.; writing—original draft preparation, J.L.; writing—review and editing, Z.J.; visualization, J.L. and L.G.; supervision, J.S.; project administration, L.W.; funding acquisition, R.L. All authors have read and agreed to the published version of the manuscript.

Funding

The research was funded by National Key R&D Program of China (2022YFD1901300), the S&T Program of Hebei (22326901D), and the HAAFS Agriculture Science and Technology Innovation Project (2022KJCXZX-ZHS-1).

Data Availability Statement

The original contributions presented in this study are included in the article and Supplementary Materials. Further inquiries can be directed to the corresponding authors.

Acknowledgments

We extend our sincere gratitude to all external reviewers for their invaluable guidance and constructive feedback during the revision process.

Conflicts of Interest

The authors declare that we have no conflicts of interest.

References

  1. De Lima, D.P.; Junior, E.D.S.P.; de Menezes, A.V.; de Souza, D.A.; de Sao Jose, V.P.B.; da Silva, B.P.; de Almeida, A.Q.; de Carvalho, I.M.M. Chemical composition, minerals concentration, total phenolic compounds, flavonoids content and antioxidant capacity in organic and conventional vegetables. Food Res. Int. 2024, 175, 113684. [Google Scholar] [CrossRef] [PubMed]
  2. Wang, D.; Guo, L.; Zheng, L.; Zhang, Y.; Yang, R.; Li, M.; Ma, F.; Zhang, X.; Li, Y. Effects of nitrogen fertilizer and water management practices on nitrogen leaching from a typical open field used for vegetable planting in northern China. Agric. Water Manag. 2019, 213, 913–921. [Google Scholar] [CrossRef]
  3. Wang, Y.; Li, L.; Zhang, X.; Ji, M. Pesticide residues in greenhouse leafy vegetables in cold seasons and dietary exposure assessment for consumers in Liaoning Province, Northeast China. Agronomy 2024, 14, 322. [Google Scholar] [CrossRef]
  4. Shanmugavel, D.; Rusyn, I.; Solorza-Feria, O.; Kamaraj, S.K. Sustainable SMART fertilizers in agriculture systems: A review on fundamentals to in-field applications. Sci. Total Environ. 2023, 904, 166729. [Google Scholar] [CrossRef]
  5. Khan, F.; Siddique, A.B.; Shabala, S.; Zhou, M.; Zhao, C. Phosphorus plays key roles in regulating plants’ physiological responses to abiotic stresses. Plants 2023, 12, 2861. [Google Scholar] [CrossRef]
  6. Kuronuma, T.; Watanabe, H. Identification of the causative genes of calcium deficiency disorders in horticulture crops: A systematic review. Agriculture 2021, 11, 906. [Google Scholar] [CrossRef]
  7. Saure, M.C. Causes of the tipburn disorder in leaves of vegetables. Sci. Hortic. 1998, 76, 131–147. [Google Scholar] [CrossRef]
  8. Nadarajah, K.; Abdul Rahman, N.S.N. Plant-Microbe Interaction: Aboveground to Belowground, from the Good to the Bad. Int. J. Mol. Sci. 2021, 22, 10388. [Google Scholar] [CrossRef]
  9. Huang, M.; Lan, J.; Wang, S.; Wang, J.; Qi, X.; Liu, L.; Yue, K. Effects of soil exchangeable calcium in promoting the accumulation of soil organic carbon by karst vegetation restoration. J. Soil Sci. Plant Nutr. 2023, 24, 843–854. [Google Scholar] [CrossRef]
  10. Shabtai, I.A.; Wilhelm, R.C.; Schweizer, S.A.; Hoschen, C.; Buckley, D.H.; Lehmann, J. Calcium promotes persistent soil organic matter by altering microbial transformation of plant litter. Nat. Commun. 2023, 14, 6609. [Google Scholar] [CrossRef]
  11. Jing, T.; Li, J.; He, Y.; Shankar, A.; Saxena, A.; Tiwari, A.; Maturi, K.C.; Solanki, M.K.; Singh, V.; Eissa, M.A.; et al. Role of calcium nutrition in plant Physiology: Advances in research and insights into acidic soil conditions—A comprehensive review. Plant Physiol. Biochem. 2024, 210, 108602. [Google Scholar] [CrossRef]
  12. Walton, C.R.; Ewens, S.; Coates, J.D.; Blake, R.E.; Planavsky, N.J.; Reinhard, C.; Ju, P.C.; Hao, J.H.; Pasek, M.A. Phosphorus availability on the early Earth and the impacts of life. Nat. Geosci. 2023, 16, 399–409. [Google Scholar] [CrossRef]
  13. Zhang, J.; Zhou, X.; Zhang, Y.; Dai, Z.; He, Z.; Qiu, Y.; Alharbi, S.A.; Wei, F.; Wei, L.; Ahmed, W.; et al. Pre-soil fumigation with ammonium bicarbonate and lime modulates the rhizosphere microbiome to mitigate clubroot disease in Chinese cabbage. Front. Microbiol. 2024, 15, 1376579. [Google Scholar] [CrossRef]
  14. Li, C.L.; Xu, J.; Xu, H.M.; Liu, J.; Zhang, L.X.; Wang, Z.K. Analysis of growth resistance mechanisms and causes in tea plants (Camellia sinensis) in high-pH regions of Northern China. Front. Nutr. 2023, 10, 1131380. [Google Scholar] [CrossRef] [PubMed]
  15. Huang, S.-W.; Jin, J.-Y.; Yang, L.-P.; Bai, Y.-L. Spatial variability of soil nutrients and influencing factors in a vegetable production area of Hebei Province in China. Nutr. Cycl. Agroecosyst. 2006, 75, 201–212. [Google Scholar] [CrossRef]
  16. Bontpart, T.; Weiss, A.; Vile, D.; Gerard, F.; Lacombe, B.; Reichheld, J.P.; Mari, S. Growing on calcareous soils and facing climate change. Trends Plant Sci. 2024, 29, 1319–1330. [Google Scholar] [CrossRef] [PubMed]
  17. Olle, M.; Bender, I. Causes and control of calcium deficiency disorders in vegetables: A review. J. Hortic. Sci. Biotechnol. 2009, 84, 577–584. [Google Scholar] [CrossRef]
  18. Prasad, R.; Shivay, Y.S. Agronomic biofortification of plant foods with minerals, vitamins and metabolites with chemical fertilizers and liming. J. Plant Nutr. 2020, 43, 1534–1554. [Google Scholar] [CrossRef]
  19. Ritonga, F.N.; Gong, Z.; Zhang, Y.; Wang, F.; Gao, J.; Li, C.; Li, J. Exploiting Brassica rapa L. subsp. pekinensis genome research. Plants 2024, 13, 2823. [Google Scholar] [CrossRef]
  20. Wang, L.; Zhou, Y.; Sun, X.; Wu, S.; Xia, L.; Sun, J.; Zha, Y.; Yang, P. Retrieval of chromium and mercury concentrations in agricultural soils: Using spectral information, environmental covariates, or a fusion of both? Ecol. Indic. 2024, 167, 112594. [Google Scholar] [CrossRef]
  21. Meersmans, J.; Van Wesemael, B.; Van Molle, M. Determining soil organic carbon for agricultural soils: A comparison between the Walkley & Black and the dry combustion methods (north Belgium). Soil Use Manag. 2009, 25, 346–353. [Google Scholar] [CrossRef]
  22. Goidts, E.; van Wesemael, B.; Crucifix, M. Magnitude and sources of uncertainties in soil organic carbon (SOC) stock assessments at various scales. Eur. J. Soil Sci. 2009, 60, 723–739. [Google Scholar] [CrossRef]
  23. Adhikari, B.K.; Barrington, S.; Martinez, J.; King, S. Characterization of food waste and bulking agents for composting. Waste Manag. 2008, 28, 795–804. [Google Scholar] [CrossRef] [PubMed]
  24. Worsfold, P.J.; Gimbert, L.J.; Mankasingh, U.; Omaka, O.N.; Hanrahan, G.; Gardolinski, P.C.; Haygarth, P.M.; Turner, B.L.; Keith-Roach, M.J.; McKelvie, I.D. Sampling, sample treatment and quality assurance issues for the determination of phosphorus species in natural waters and soils. Talanta 2005, 66, 273–293. [Google Scholar] [CrossRef] [PubMed]
  25. Rao, B.K.R.; Bailey, J.; Wingwafi, R.W. Comparison of three digestion methods for total soil potassium estimation in soils of papua new guinea derived from varying parent materials. Commun. Soil Sci. Plant Anal. 2011, 42, 1259–1265. [Google Scholar] [CrossRef]
  26. Kachurina, O.M.; Zhang, H.; Raun, W.R.; Krenzer, E.G. Simultaneous determination of soil aluminum, ammonium- and nitrate-nitrogen using 1 M potassium chloride extraction. Commun. Soil Sci. Plant Anal. 2008, 31, 893–903. [Google Scholar] [CrossRef]
  27. Rayment, G.E.; Lyons, D.J. New, Comprehensive Soil Chemical Methods Book for Australasia. Commun. Soil Sci. Plant Anal. 2012, 43, 412–418. [Google Scholar] [CrossRef]
  28. Hart, M.R.; Cornish, P.S. Comparison of bicarbonate-extractable soil phosphorus measured by ICP-AES and colourimetry in soils of south-eastern New South Wales. Aust. J. Soil Res. 2009, 47, 742–746. [Google Scholar] [CrossRef]
  29. Rees, G.L.; Pettygrove, G.S.; Southard, R.J. Estimating Plant-Available Potassium in Potassium-Fixing Soils. Commun. Soil Sci. Plant Anal. 2013, 44, 741–748. [Google Scholar] [CrossRef]
  30. Vázquez, S.; Moreno, E.; Carpena, R.O. Bioavailability of metals and As from acidified multicontaminated soils: Use of white lupin to validate several extraction methods. Environ. Geochem. Health 2008, 30, 193–198. [Google Scholar] [CrossRef]
  31. Zhang, Y.G.; Xiao, M.; Dong, Y.H.; Jiang, Y. Determination of Soil Exchangeable Base Cations by Using Atomic Absorption Spectrophotometer and Extraction with Ammonium Acetate. Spectrosc. Spectr. Anal. 2012, 32, 2242–2245. [Google Scholar]
  32. Fabregat-Santiago, F.; Ferriols, N.S.; Garcia-Belmonte, G.; Bisquert, J. Determination of the humidity of soil by monitoring the conductivity with indium tin oxide glass electrodes. Appl. Phys. Lett. 2002, 80, 2785–2787. [Google Scholar] [CrossRef]
  33. Zeng, Q.; An, S. Identifying the biogeographic patterns of rare and abundant bacterial communities using different primer sets on the Loess Plateau. Microorganisms 2021, 9, 139. [Google Scholar] [CrossRef] [PubMed]
  34. Coyer, J.A.; Hoarau, G.; Kuo, J.; Tronholm, A.; Veldsink, J.; Olsen, J.L. Phylogeny and temporal divergence of the seagrass family Zosteraceae using one nuclear and three chloroplast loci. Syst. Biodivers. 2013, 11, 271–284. [Google Scholar] [CrossRef]
  35. Lepš, J.; Šmilauer, P. Multivariate Analysis of Ecological Data Using CANOCO; Cambridge University Press: Cambridge, UK, 2003. [Google Scholar]
  36. Oksanen, J.; Blanchet, F.G.; Kindt, R.; Legendre, P.; Minchin, P.R.; O’hara, R.; Simpson, G.L.; Solymos, P.; Stevens, M.H.H.; Wagner, H. Package ‘vegan’. Community Ecol. Package Version 2013, 2, 1–295. [Google Scholar]
  37. Breiman, L. Random Forests. Mach. Learn. 2001, 45, 5–32. [Google Scholar] [CrossRef]
  38. Langfelder, P.; Horvath, S. WGCNA: An R package for weighted correlation network analysis. BMC Bioinform. 2008, 9, 559. [Google Scholar] [CrossRef]
  39. Wemheuer, F.; Taylor, J.A.; Daniel, R.; Johnston, E.; Meinicke, P.; Thomas, T.; Wemheuer, B. Tax4Fun2: Prediction of habitat-specific functional profiles and functional redundancy based on 16S rRNA gene sequences. Environ. Microbiome 2020, 15, 11. [Google Scholar] [CrossRef]
  40. Feng, G.; Xie, T.; Wang, X.; Bai, J.; Tang, L.; Zhao, H.; Wei, W.; Wang, M.; Zhao, Y. Metagenomic analysis of microbial community and function involved in cd-contaminated soil. BMC Microbiol. 2018, 18, 11. [Google Scholar] [CrossRef]
  41. Nguyen, N.H.; Song, Z.; Bates, S.T.; Branco, S.; Tedersoo, L.; Menke, J.; Schilling, J.S.; Kennedy, P.G. FUNGuild: An open annotation tool for parsing fungal community datasets by ecological guild. Fungal Ecol. 2016, 20, 241–248. [Google Scholar] [CrossRef]
  42. Lu, Y.; Dai, H.C.; Zamanian, K.; Sun, Q.Q.; Wang, C.B.; Wu, Z.F.; Zheng, Y.M.; Li, L.; Wan, S.B.; Yu, T.Y. Liming shifts the chemical properties and microbial community structures of peanut soils with different initial pH values. Appl. Soil Ecol. 2023, 181, 104665. [Google Scholar] [CrossRef]
  43. Liu, C.M.; Yang, Z.F.; He, P.F.; Munir, S.; He, P.B.; Wu, Y.X.; Ho, H.H.; He, Y.Q. Fluazinam positively affected the microbial communities in clubroot cabbage rhizosphere. Sci. Hortic. 2019, 256, 108519. [Google Scholar] [CrossRef]
  44. Wei, X.L.; Fu, T.L.; He, G.; Zhong, Z.Y.; Yang, M.F.; Lou, F.; He, T.B. Characteristics of rhizosphere and bulk soil microbial community of Chinese cabbage (Brassica campestris) grown in Karst area. Front. Microbiol. 2023, 14, 1241436. [Google Scholar] [CrossRef] [PubMed]
  45. Goberna, M.; Verdú, M. Cautionary notes on the use of co-occurrence networks in soil ecology. Soil Biol. Biochem. 2022, 166, 108534. [Google Scholar] [CrossRef]
  46. Lang, Y.; Ma, Y.; Wang, G.; Qian, X.; Wang, J. Optimized fertilization shifted soil microbial properties and improved vegetable growth in facility soils with obstacles. Horticulturae 2023, 9, 1303. [Google Scholar] [CrossRef]
  47. Stimmler, P.; Prieme, A.; Elberling, B.; Goeckede, M.; Schaller, J. Arctic soil respiration and microbial community structure driven by silicon and calcium. Sci. Total Environ. 2022, 838, 156152. [Google Scholar] [CrossRef]
  48. Dhaliwal, S.S.; Dubey, S.K.; Kumar, D.; Toor, A.S.; Walia, S.S.; Randhawa, M.K.; Kaur, G.; Brar, S.K.; Khambalkar, P.A.; Shivey, Y.S. Enhanced organic carbon triggers transformations of macronutrients, micronutrients, and secondary plant nutrients and their dynamics in the soil under different cropping systems—A review. J. Soil Sci. Plant Nutr. 2024, 24, 5272–5292. [Google Scholar] [CrossRef]
  49. Yu, X.; Keitel, C.; Dijkstra, F.A. Ameliorating soil acidity with calcium carbonate and calcium hydroxide: Effects on carbon, nitrogen, and phosphorus dynamics. J. Soil Sci. Plant Nutr. 2023, 23, 5270–5278. [Google Scholar] [CrossRef]
  50. Lee, C.H.; Lee, D.K.; Ali, M.A.; Kim, P.J. Effects of oyster shell on soil chemical and biological properties and cabbage productivity as a liming materials. Waste Manag. 2008, 28, 2702–2708. [Google Scholar] [CrossRef]
  51. Wang, C.; Wang, X.; Zhang, Y.; Morrissey, E.; Liu, Y.; Sun, L.; Qu, L.; Sang, C.; Zhang, H.; Li, G.; et al. Integrating microbial community properties, biomass and necromass to predict cropland soil organic carbon. ISME Commun. 2023, 3, 86. [Google Scholar] [CrossRef]
  52. Liu, X.; Zhang, Y.; Li, P.; Xiao, L. Siltation of check dams alters microbial communities and thus limits organic carbon mineralization. Soil Tillage Res. 2024, 236, 105949. [Google Scholar] [CrossRef]
  53. Xiao, S.J.; Gao, J.; Wang, Q.Y.; Huang, Z.X.; Zhuang, G.Q. SOC bioavailability significantly correlated with the microbial activity mediated by size fractionation and soil morphology in agricultural ecosystems. Environ. Int. 2024, 186, 108588. [Google Scholar] [CrossRef]
  54. Zhang, Y.; Liu, X.; Li, P.; Wang, X.; Xiao, L.; Zhou, S. Surface soil microbiome changes in Grain for Green Project accelerates organic carbon mineralization on the Loess Plateau in China. Earth Surf. Process. Landf. 2024, 49, 1621–1631. [Google Scholar] [CrossRef]
  55. Dou, X.; Zhang, C.; Chen, L.; Wu, Q.; Zhou, G.; Ma, D.; Zhao, Z.; Zhang, J. Calcium forms influence soil organic carbon by mediating labile organic carbon fractions, carbon pool management indices and microbial communities in calcareous alkaline soils. Plant Soil 2024, 512, 801–817. [Google Scholar] [CrossRef]
  56. Zhang, L.; Wang, Y.; Chen, J.; Zhang, C.; Cao, Y.; Cai, G.; Yu, L. Exogenous carbon addition reduces soil organic carbon: The effects of fungi on soil carbon priming exceed those of bacteria on soil carbon sequestration. Forests 2023, 14, 1268. [Google Scholar] [CrossRef]
  57. Xu, F.; Li, P. Biogeochemical mechanisms of iron (Fe) and manganese (Mn) in groundwater and soil profiles in the Zhongning section of the Weining Plain (northwest China). Sci. Total Environ. 2024, 939, 173506. [Google Scholar] [CrossRef] [PubMed]
  58. Zhu, Y.; Du, X.; Gao, C.; Yu, Z. Adsorption behavior of inorganic and organic phosphate by iron manganese plaques on reed roots in wetlands. Sustainability 2018, 10, 4578. [Google Scholar] [CrossRef]
  59. Tan, W.-F.; Liu, F.; Li, Y.-H.; Hu, H.-Q.; Huang, Q.-Y. Elemental composition and geochemical characteristics of iron-manganese nodules in main soils of China. Pedosphere 2006, 16, 72–81. [Google Scholar] [CrossRef]
  60. Kumar, U.; Saqib, H.S.A.; Islam, W.; Prashant, P.; Patel, N.; Chen, W.; Yang, F.Y.; You, M.S.; He, W.Y. Landscape composition and soil physical-chemical properties drive the assemblages of bacteria and fungi in conventional vegetable fields. Microorganisms 2022, 10, 1202. [Google Scholar] [CrossRef]
  61. Nguyen, N.H.A.; Špánek, R.; Kasalický, V.; Ribas, D.; Vlková, D.; Řeháková, H.; Kejzlar, P.; Ševců, A. Different effects of nano-scale and micro-scale zero-valent iron particles on planktonic microorganisms from natural reservoir water. Environ. Sci. Nano 2018, 5, 1117–1129. [Google Scholar] [CrossRef]
  62. Pijuan, J.; Moreno, D.F.; Yahya, G.; Moisa, M.; Ul Haq, I.; Krukiewicz, K.; Mosbah, R.; Metwally, K.; Cavalu, S. Regulatory and pathogenic mechanisms in response to iron deficiency and excess in fungi. Microb. Biotechnol. 2023, 16, 2053–2071. [Google Scholar] [CrossRef]
  63. Gao, C.; Xu, L.; Montoya, L.; Madera, M.; Hollingsworth, J.; Chen, L.; Purdom, E.; Singan, V.; Vogel, J.; Hutmacher, R.B.; et al. Co-occurrence networks reveal more complexity than community composition in resistance and resilience of microbial communities. Nat. Commun. 2022, 13, 3867. [Google Scholar] [CrossRef] [PubMed]
  64. de Vries, F.T.; Griffiths, R.I.; Bailey, M.; Craig, H.; Girlanda, M.; Gweon, H.S.; Hallin, S.; Kaisermann, A.; Keith, A.M.; Kretzschmar, M.; et al. Soil bacterial networks are less stable under drought than fungal networks. Nat. Commun. 2018, 9, 3033. [Google Scholar] [CrossRef] [PubMed]
  65. Montoya, J.M.; Pimm, S.L.; Sole, R.V. Ecological networks and their fragility. Nature 2006, 442, 259–264. [Google Scholar] [CrossRef] [PubMed]
  66. Hernandez, D.J.; David, A.S.; Menges, E.S.; Searcy, C.A.; Afkhami, M.E. Environmental stress destabilizes microbial networks. ISME J. 2021, 15, 1722–1734. [Google Scholar] [CrossRef]
  67. Nam, O.; Park, J.M.; Lee, H.; Jin, E. De novo transcriptome profile of coccolithophorid alga Emiliania huxleyi CCMP371 at different calcium concentrations with proteome analysis. PLoS ONE 2019, 14, e0221938. [Google Scholar] [CrossRef]
  68. Li, W.; Zhang, Y.; Mao, W.; Wang, C.; Yin, S. Functional potential differences between Firmicutes and Proteobacteria in response to manure amendment in a reclaimed soil. Can. J. Microbiol. 2020, 66, 689–697. [Google Scholar] [CrossRef]
  69. Guo, Y.; Yin, Z.; Kang, J.; Tu, X.; Ao, G.; Ge, J.; Ping, W. Influence of community complexity and regulation by two-component system on community stability in aerobic composting in the presence of penicillin residues. J. Clean. Prod. 2024, 465, 142836. [Google Scholar] [CrossRef]
  70. Jin, Y.; Lu, L.; Tu, W.; Luo, T.; Fu, Z. Impacts of polystyrene microplastic on the gut barrier, microbiota and metabolism of mice. Sci. Total Environ. 2019, 649, 308–317. [Google Scholar] [CrossRef]
  71. Jia, J.; de Goede, R.; Li, Y.; Zhang, J.; Wang, G.; Zhang, J.; Creamer, R. Unlocking soil health: Are microbial functional genes effective indicators? Soil Biol. Biochem. 2025, 204, 109768. [Google Scholar] [CrossRef]
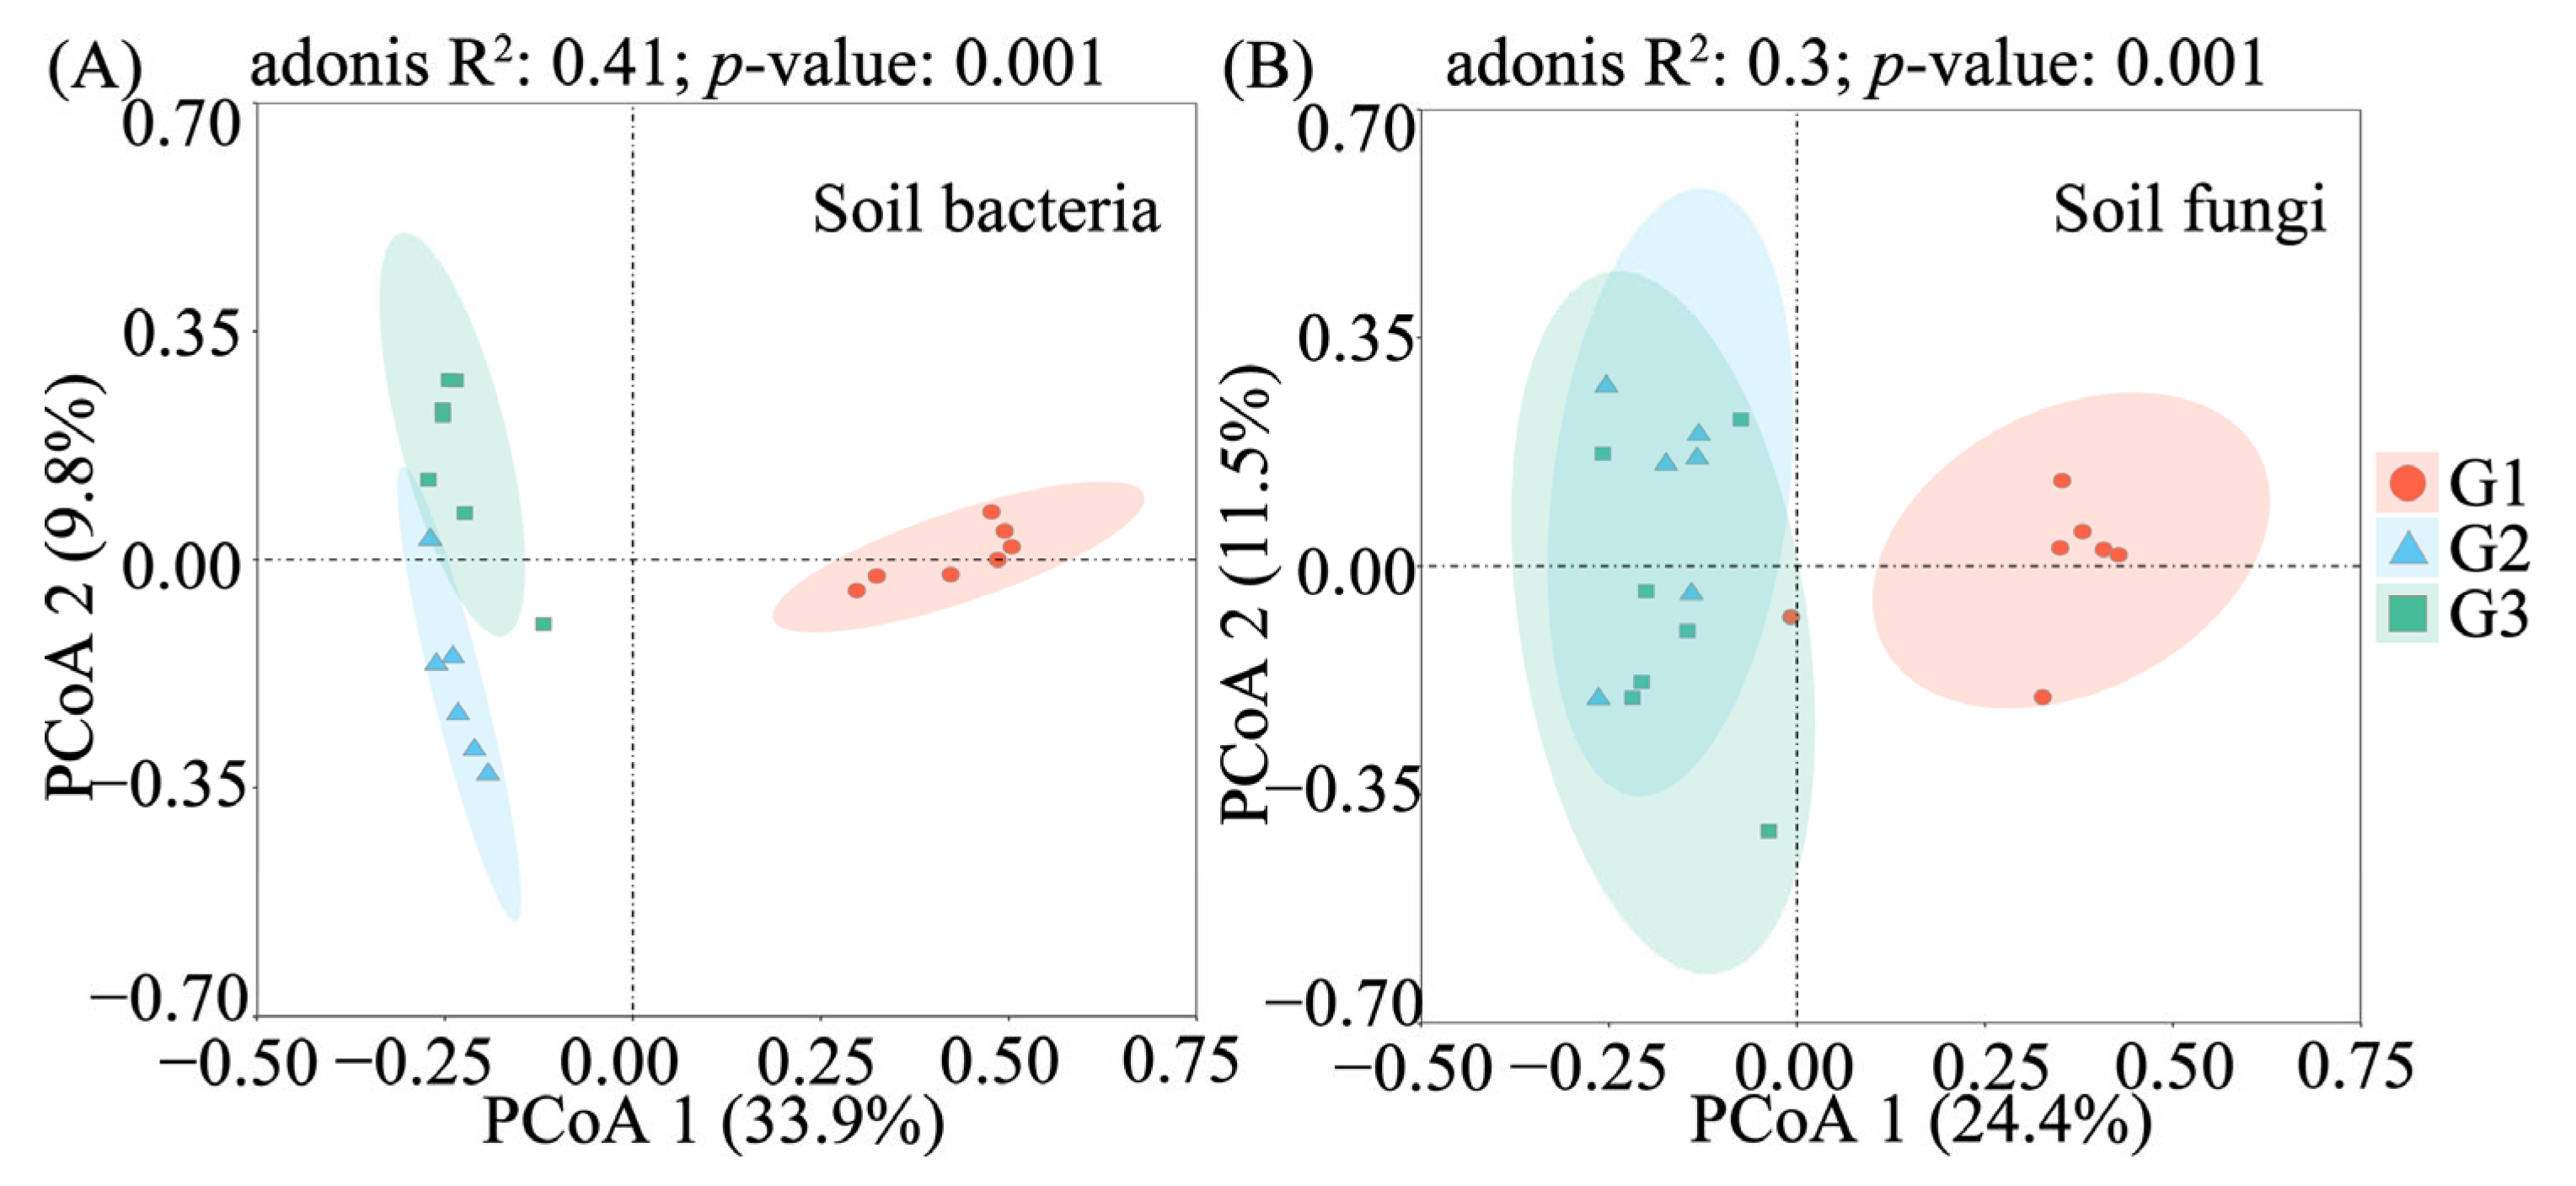
Figure 1. PCoA of the composition of bacterial (A) and fungal communities (B) among sampling sites.
Agronomy 15 02212 g001
Figure 2. Different lowercase letters on the same row represent significant d. Variations in the alpha diversity of bacterial (AC) and fungal (DF) communities among sampling sites along the Ca gradient. Different lowercase letters represent significant differences among sampling sites (p < 0.05).
Agronomy 15 02212 g002
Figure 3. CCA plots of relationships between bacterial (A) and fungal (B) communities and environmental variables. Each point represents a sampling site whose position was determined by the score on CCA 1 and CCA 2. The length and direction of the lines represent the importance and direction of the effect of each variable on species composition.
Agronomy 15 02212 g003
Figure 4. Mantel analysis of soil physicochemical properties and microorganism community Chao1, Shannon–Wiener, and Pielou in different Ca gradients. Mantel test results in bacterial communities (A,C,E) versus fungal communities (B,D,F) reveal distinct correlation patterns between microbial community structures and key soil parameters, following rigorous multicollinearity screening (VIF < 10).
Agronomy 15 02212 g004
Figure 5. The RFM identifies the marker species for bacterial and fungal communities in G1, G2, and G3 at both the phylum and genus levels, along with the relative abundance of these marker species across the groups. The relative importance of species was quantified, and it was observed that those of greater importance contributed more significantly to differences in community composition. (A) Bacterial marker species at the phylum level; (B) bacterial marker species at the genus level; (C) fungal marker species at the phylum level; (D) fungal marker species at the genus level.
Agronomy 15 02212 g005
Figure 6. Co-occurrence network of bacterial (AC) and fungal (DF) communities and environmental factors along an ascending Ca gradient. Colored dots indicate bacterial and fungal phylum and gray dots indicate environmental factors. Red and green lines indicate positive and negative interactions, respectively.
Agronomy 15 02212 g006
Figure 7. Co-occurrence network of bacterial (AC) and fungal (DF) communities along an ascending Ca gradient. Colored dots indicate bacterial and fungal phylum. Red and green lines indicate positive and negative interactions, respectively.
Agronomy 15 02212 g007
Figure 8. Relative abundance of dominant KEGG level 2 pathways (>1%) in soil samples with different Ca gradients. Different lowercase letters represent significant differences among sampling sites (p < 0.01).
Agronomy 15 02212 g008
Figure 9. Percentage accumulation plots of trophic modes (A) and functional taxa (B) of soil fungal communities along an ascending Ca gradient.
Agronomy 15 02212 g009
Table 1. Soil physical and chemical properties among sampling sites in the study area.
VariablesG1G2G3
BD (g/cm3)1.3 ± 0.04 A1.4 ± 0.03 A1.32 ± 0.04 A
SOC (g/kg)11.85 ± 0.99 A9.65 ± 0.64 A11.02 ± 0.55 A
EC (μs/cm)86.33 ± 8.58 B125.55 ± 9.17 A100.17 ± 2.18 AB
TN (g/kg)1.41 ± 0.09 A1.21 ± 0.07 A1.44 ± 0.07 A
TP (g/kg)1.06 ± 0.08 B1.96 ± 0.19 A1.33 ± 0.09 AB
TK (g/kg)19.44 ± 0.3 A17.45 ± 0.17 B18.35 ± 0.49 AB
Ca (mg/kg)2056.54 ± 146.94 C6800.64 ± 191.61 B7804.32 ± 219 A
pH6.68 ± 0.17 B8.01 ± 0.06 A8.15 ± 0.05 A
AN (mg/kg)124.7 ± 7 A100.1 ± 7.16 A133.3 ± 12.17 A
AP (mg/kg)104.2 ± 14.01 A54.23 ± 8.7 B41.57 ± 7.81 B
AK (mg/kg)96.71 ± 11.93 A114.33 ± 15.33 A117.5 ± 7.41 A
NO3-N (mg/kg)11.86 ± 1.86 A17.56 ± 4.13 A3.15 ± 0.65 B
Fe (mg/kg)48.64 ± 5.16 A10.67 ± 0.99 B9.29 ± 0.75 B
Mn (mg/kg)13.47 ± 2.48 A5.81 ± 0.34 A6.6 ± 0.65 A
Cu (mg/kg)3.33 ± 0.42 A2.18 ± 0.46 A2 ± 0.49 A
Zn (mg/kg)6.83 ± 1.44 A5.74 ± 1.34 A7.01 ± 2.1 A
Mg (mg/kg)256.95 ± 21.39 AB200.73 ± 11.96 B289.98 ± 30 A
Notes: Values represent means ± SE. BD, SOC, EC, TN, TP, TK, Ca, AN, AP, AK, NO3-N, Fe, Mn, Cu, Zn, and Mg, stand for bulk density, soil organic carbon, electrical conductivity, total nitrogen, total phosphorus, total potassium, exchangeable Ca, alkaline nitrogen, available phosphorus, available potassium, nitrate nitrogen, available iron, available manganese, available copper, available zinc, and exchangeable magnesium, respectively. Different capital letters on the same row represent significant differences among sampling sites (p ≤ 0.05).
Disclaimer/Publisher’s Note: The statements, opinions and data contained in all publications are solely those of the individual author(s) and contributor(s) and not of MDPI and/or the editor(s). MDPI and/or the editor(s) disclaim responsibility for any injury to people or property resulting from any ideas, methods, instructions or products referred to in the content.