Article

Maize Yield Prediction via Multi-Branch Feature Extraction and Cross-Attention Enhanced Multimodal Data Fusion

1
Inner Mongolia Autonomous Region Key Laboratory of Intelligent Control for New Energy Power Systems, Inner Mongolia University of Technology, Hohhot 010080, China
2
Inner Mongolia Autonomous Region Higher Education Engineering Research Center for Intelligent Energy Technology and Equipment, Inner Mongolia University of Technology, Hohhot 010080, China
*
Author to whom correspondence should be addressed.
Current address: School of Electricity, Inner Mongolia University of Technology, Hohhot 010080, China.
Agronomy 2025, 15(9), 2199; https://doi.org/10.3390/agronomy15092199
Submission received: 10 August 2025 / Revised: 9 September 2025 / Accepted: 13 September 2025 / Published: 16 September 2025
(This article belongs to the Section Precision and Digital Agriculture)

Abstract

This study conducted field experiments in 2024 in Meidaizhao Town, Tumed Right Banner, Baotou City, Inner Mongolia Autonomous Region, adopting a plant-level sampling design with 10 maize plots selected as sampling areas (20 plants per plot). At four critical growth stages—jointing, heading, filling, and maturity—multimodal data, including that covering leaf spectra, root-zone soil spectra, and leaf chlorophyll and nitrogen content, were synchronously collected from each plant. In response to the prevalent limitations of the existing yield prediction methods, such as insufficient accuracy and limited generalization ability due to reliance on single-modal data, this study takes the acquired multimodal maize data as the research object and innovatively proposes a multimodal fusion prediction network. First, to handle the heterogeneous nature of multimodal data, a parallel feature extraction architecture is designed, utilizing independent feature extraction branches—leaf spectral branch, soil spectral branch, and biochemical parameter branch—to preserve the distinct characteristics of each modality. Subsequently, a dual-path feature fusion method, enhanced by a cross-attention mechanism, is introduced to enable dynamic interaction and adaptive weight allocation between cross-modal features, specifically between leaf spectra–soil spectra and leaf spectra–biochemical parameters, thereby significantly improving maize yield prediction accuracy. The experimental results demonstrate that the proposed model outperforms single-modal approaches by effectively leveraging complementary information from multimodal data, achieving an R2 of 0.951, an RMSE of 8.68, an RPD of 4.50, and an MAE of 5.28. Furthermore, the study reveals that deep fusion between soil spectra, leaf biochemical parameters, and leaf spectral data substantially enhances prediction accuracy. This work not only validates the effectiveness of multimodal data fusion in maize yield prediction but also provides valuable insights for accurate and non-destructive yield prediction.

1. Introduction

Food security serves as a crucial foundation for national security, with yield being a core evaluation metric in agricultural research that directly impacts the stable and high-yield production of grain in China [1,2]. As one of the world’s most important crops, maize functions not only as a staple food source but also finds extensive applications in feed processing, industrial production, and biofuel manufacturing [3]. With expanding maize cultivation and its growing economic significance, the demand for maize continues to rise, making timely and accurate monitoring of maize growth status and yield variations imperative [4].
Conventional maize yield prediction methods typically rely on destructive field sampling and post-harvest surveys [5]. These approaches suffer from poor timeliness, high costs, and compromised reliability due to sampling errors and environmental variability [5]. Consequently, developing high-precision yield prediction models holds substantial practical significance.
In recent years, hyperspectral remote sensing technology has emerged as a promising solution for accurate crop yield prediction [6]. This technique enables the simultaneous acquisition of spatial information and continuous spectral data, capturing subtle characteristic changes during crop growth [6,7]. As the primary site of photosynthesis, maize leaves exhibit spectral features that directly reflect plant physiological status [8]. Analysis of maize leaf hyperspectral data facilitates early detection and diagnosis of growth anomalies, thereby safeguarding yield and quality [9].
Additionally, biochemical parameters such as chlorophyll and nitrogen content in maize leaves serve as direct indicators of crop growth status and yield potential [10]. Leaf chlorophyll content (LCC) represents a vital biological parameter for evaluating growth conditions, photosynthetic efficiency, and productivity [11,12,13]. As an essential macronutrient for amino acid, protein, and enzyme synthesis, leaf nitrogen content (LNC) serves as a critical indicator of plant nitrogen status and nutritional health, profoundly influencing plant growth, yield, and quality [14]. Meanwhile, the root-zone soil environment reciprocally affects leaf physiological functions through water and nutrient supply, with its key physicochemical parameters directly reflecting crop nutrient status and potential yield levels [15,16].
However, the current research predominantly relies on single-modal data, focusing solely on leaf spectral characteristics while neglecting the synergistic effects of soil conditions and internal physiological status on yield formation, resulting in compromised model robustness [17,18]. Such single-modal analytical approaches fail to comprehensively characterize the complex mechanisms underlying yield formation. In contrast, multimodal data fusion methods have demonstrated remarkable advantages in crop yield prediction. Liu et al. developed a deep-learning-based grain yield estimation model using composite remote sensing data incorporating MODIS imagery with vegetation indices and thermal bands [19]. Shamsuddin et al. employed RGB images, phenotypic traits, and weather data to construct a multimodal deep learning model for predicting maize yield potential during pre-flowering and silking stages [20]. Aviles Toledo et al. achieved high-precision maize yield prediction by fusing hyperspectral imagery, LiDAR point clouds, and environmental data [21]. Ma et al. further improved leaf area index prediction performance by integrating UAV-based multispectral and RGB images [22]. These studies collectively provide novel insights and references for effective maize yield prediction.
With the rapid development of precision agriculture, multimodal fusion techniques have achieved significant progress in the field of crop yield prediction. Methods such as Feature-wise Linear Modulation (FiLM), gated multimodal units, and multimodal transformers have attracted widespread attention. To effectively integrate multimodal data, Mena et al. proposed a multimodal gated fusion model capable of achieving accurate yield prediction across different crops and regions, outperforming traditional prediction models [23]. Meanwhile, Jacome Galarza et al. developed a transformer-based multimodal fusion framework that dynamically combines tabular agricultural environmental features with vegetation indices derived from satellite multispectral imagery through cross-modal attention, significantly improving yield prediction accuracy with a coefficient of determination (R2) reaching 0.919 [24]. However, these methods still exhibit certain limitations; while FiLM enables flexible modality fusion through feature-wise affine transformations, it struggles to capture complex spatial dependencies across modalities effectively. Transformer-based fusion approaches excel at modeling global contextual information but entail substantial computational costs, hindering their practical deployment in resource-constrained scenarios. Although gating mechanisms perform well in filtering multimodal information, they remain inadequate in adaptively calibrating and integrating multi-scale features.
To address the aforementioned challenges, this study proposes a multimodal data fusion approach for maize yield prediction. By integrating leaf spectral data, soil spectral data, and leaf biochemical parameters (LCC and LNC), we constructed a Cross-Attention-based Multimodal Feature Fusion Network (CA-MFFNet). This network combines Discrete Wavelet Transform (DWT) with multiple attention mechanisms to enable parallel extraction of multimodal features, effectively preserving the unique characteristic representations of each data modality. Through the incorporation of a cross-attention mechanism, the model explicitly captures semantic dependencies among different modalities, facilitating dynamic interaction and adaptive fusion of multimodal features—including leaf spectra, soil spectra, and biochemical parameters; while maintaining relatively low computational complexity, the proposed method fully leverages complementary information across multimodal data sources, significantly enhancing the accuracy of maize yield prediction.

2. Materials and Methods

2.1. Data Acquisition

2.1.1. Sample Collection

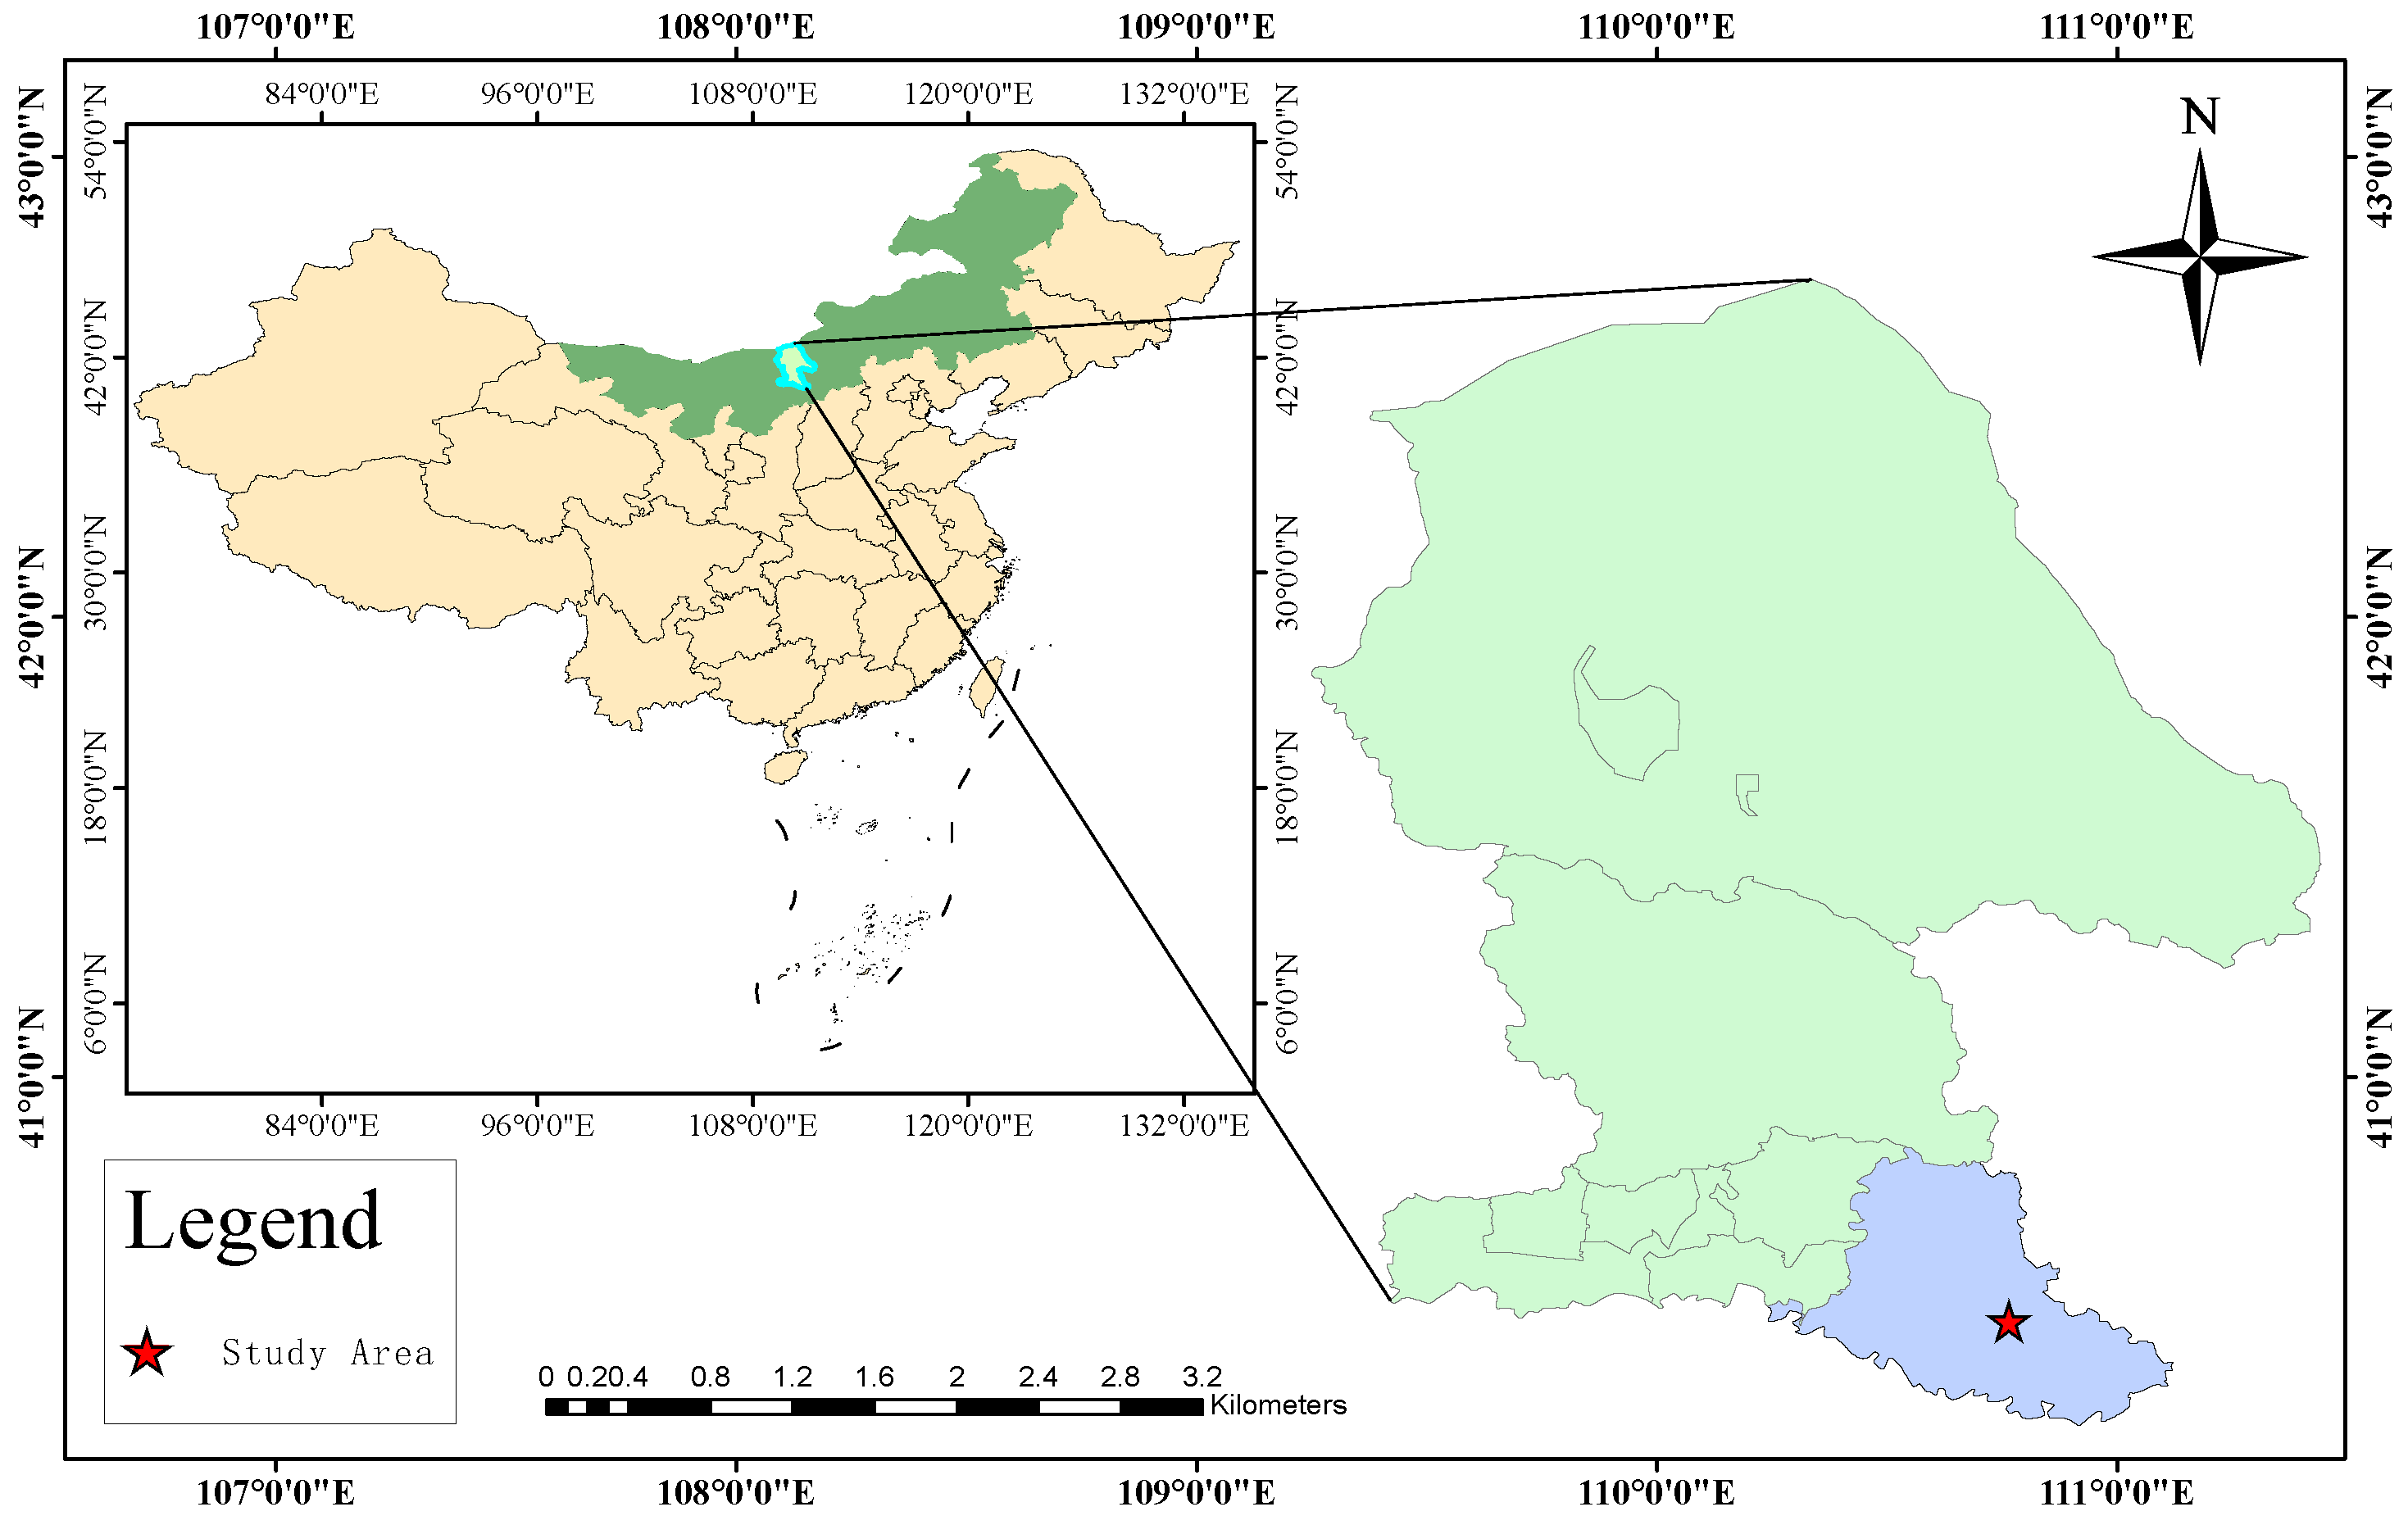
Field sampling was conducted from early June to late September 2024 in Meidaizhao Town, Tumote Right Banner, Baotou City, Inner Mongolia Autonomous Region ( 40 28 18 N , 110 45 52 E ). This field-scale study more accurately represents real-world agricultural conditions and provides greater practical guidance value for farmers’ production practices [25]. Figure 1 shows the specific geographical locations of sample collection. The region features a temperate continental climate with abundant sunlight and significant diurnal temperature variation, which promotes maize photosynthesis and nutrient accumulation, creating favorable growth conditions for maize development [26].
This study employed a plant-level sampling design, selecting 10 maize plots as sampling areas. Each plot covered an area of approximately 600 m2 (60 m × 10 m), with a planting density of about 60,000 plants per hectare, row spacing of 60 cm, and plant spacing of 25 cm. Using a grid-based distribution method, 20 sampling points were systematically established in each plot, with corresponding plants tagged, resulting in a total of 200 sampled plants. Synchronous collection of leaf samples and root-zone soil samples from each tagged plant was conducted at four critical growth stages of maize: jointing (V6, BBCH 30–39), tasseling (VT, BBCH 51–59), grain filling (R3, BBCH 71–79), and physiological maturity (R6, BBCH 89) [25]. The widely cultivated maize variety ‘Zhengdan 958’ was used in the experiment. Nitrogen fertilizer was applied at a total rate of 225 kg/ha, with 40% applied as basal fertilizer and the remaining portion split equally into two topdressings at the jointing and tasseling stages. Phosphorus and potassium fertilizers were applied at rates of 120 kg/ha and 90 kg/ha, respectively, both administered as a one-time basal application. Throughout the growing season, traditional border irrigation was employed for water management, and unified pest, disease, and weed control measures were implemented.

2.1.2. Hyperspectral Data Acquisition

Hyperspectral data of maize leaves and root-zone soil were acquired using a portable Specim IQ hyperspectral camera. Detailed specifications and configuration of the imaging system are provided in Table A1.
To minimize interference from ambient light, all image acquisitions were conducted indoors in a sealed, dark environment. Two halogen lamps were used to illuminate the samples uniformly, with fixed angles and a consistent sensor-to-sample distance of 20 cm maintained during vertical imaging. The halogen lamps were preheated for 20 min to stabilize the light source prior to data collection. White and dark reference calibrations were performed to reduce background noise and correct for uneven illumination. Further image quality enhancement was achieved by applying a reflectance threshold method to suppress specular reflection and morphological opening operations to remove shadow-affected regions.
This study systematically collected leaf and soil samples across multiple maize growth stages. Leaf samples were obtained from the adaxial surface of fully expanded ear leaves. Following the vertical structure of the canopy, one healthy leaf was selected from each of the upper, middle, and lower layers per plant. A fixed-size rectangular region of interest (ROI) was delineated in the central portion of each leaf, avoiding the midrib and any visible mottled areas. A total of 1024 pixels were uniformly extracted from each ROI for spectral reflectance measurement. Soil samples were collected from three different locations around each plant at a depth of 0–10 cm to account for field heterogeneity. To mitigate the influence of moisture variation on spectral readings, all data collection was conducted 72 h after irrigation. Soil moisture was maintained within 10–20% across all growth stages except for the R6 stage, where naturally occurring precipitation resulted in abnormally high soil moisture levels. Ultimately, 600 leaf samples and 600 soil samples were obtained per growth stage from 200 maize plants, resulting in a comprehensive multimodal dataset comprising 2400 samples covering four critical growth stages. Figure 2 and Figure 3 shows the hyperspectral false-color images of leaves and corresponding root-zone soils at different growth stages.

2.1.3. Biochemical Parameter Measurement

Upon collection in the field, all leaf and soil samples were immediately sealed, labeled, and stored in a portable 4 °C refrigeration unit for rapid transport to the laboratory. In the lab, hyperspectral imaging of the leaves was prioritized. Subsequently, a handheld plant parameter analyzer was used to measure LCC and LNC within the same predefined ROI on each leaf. Six measurements were taken per leaf and averaged to represent the parameter values for that sample.
The entire process—from sample excision to the completion of all measurements—was strictly completed within a two-hour window. This protocol maximized sample freshness, effectively prevented pigment degradation and water loss, and ensured temporal synchronization between spectral data and biochemical parameters. As a result, potential interference in model construction due to physiological changes over time was minimized. Figure 4 displays the distribution histograms of LCC and LNC in leaves across four key growth stages of maize.

2.1.4. Yield Measurement

At the R6 growth stage, the pre-marked 200 maize ears were completely harvested, placed in numbered sealed bags, and transported to the laboratory. After manual threshing, the grains were sun-dried to approximately 14% moisture content. The dry weight of the maize grains was measured using an electronic balance with 0.1 g precision. Each sample was weighed three times, and the average value was taken as the final grain yield.

2.1.5. Dataset Partitioning

This study systematically collected hyperspectral data and agronomic parameters from maize at different growth stages. Data from each stage were treated as independent samples, resulting in a total of 2400 sets of leaf and soil hyperspectral data with corresponding biochemical parameter values, along with 200 sets of final ear yield data. Multiple data samples from different growth stages of the same plant were all associated with the same final yield value.
To strictly prevent data leakage and ensure the most robust evaluation of model generalizability, a Leave-One-Plot-Out cross-validation strategy was adopted. In each iteration, all multi-growth-stage data from one entire plot were held out as the test set, while data from the remaining nine plots were used for training. This process was repeated until each plot had been used exactly once as the test set. As an example, the data distribution and yield statistics of the training and test sets in one particular split are presented in Table 1.

2.2. Hyperspectral Data Preprocessing

The raw hyperspectral data of maize leaves and soil contained substantial background interference, necessitating precise target extraction to obtain valid spectral information. In this study, the “LabelMe” annotation tool was used to delineate leaf and soil sample contours, manually selecting ROIs. The resulting masks were multiplied with the original hyperspectral data to isolate sample spectra from the background. To enhance data representativeness, spatial averaging was performed across all pixels within each ROI to generate representative spectral curves for each sample [27]. The corresponding spectral curves for leaves and soil are shown in Figure 5 and Figure 6, respectively.
To ensure data quality, this study implemented a rigorous preprocessing pipeline for both leaf and soil hyperspectral data. First, spectral bands with low signal-to-noise ratios at both ends of the range (400–410 nm and 990–1000 nm) were removed, retaining effective wavelengths in the 411–989 nm region. Subsequently, Z-Score normalization was applied to the valid bands to eliminate scale discrepancies between different spectral channels while preserving the original data distribution characteristics. The calculation is shown in Equation (1) [28]. The normalized data exhibited a more uniform and smooth distribution, effectively suppressing high-frequency noise interference. This process not only improved the signal-to-noise ratio but also facilitated faster convergence of gradient-based optimization algorithms, enabling deep learning models to achieve better fitting performance [29].
Z i j = X i j 1 n i = 1 n X i j 1 n i = 1 n ( X i j 1 n i = 1 n X i j ) 2 ,
where X i j represents the value of the i sample at the j band in the original data, Z i j denotes the standardized data, and n is the total number of samples.

2.3. Overall Network Architecture

This study proposes the CA-MFFNet model for accurate maize yield prediction. As shown in Figure 7, the network consists of three core modules: a multimodal feature extraction module, a cross-attention feature fusion module, and a yield prediction module. First, the multimodal feature extraction module employs three independent branches to extract maize leaf spectral features, root-zone soil spectral features, and leaf biochemical parameter features, respectively. Then, the cross-attention feature fusion module establishes attention relationships across modalities to achieve deep interaction and fusion of heterogeneous features from the same source. Finally, the yield prediction module based on 1D convolutional neural network (1D-CNN) maps the fused features to the final yield prediction values. Through this hierarchical feature processing pipeline, the network implements end-to-end modeling from raw data to yield prediction.

2.4. Multimodal Feature Extraction Module

This study designed a multimodal feature extraction module that integrates feature information from three parallel branches: maize leaf spectra, soil spectra, and leaf biochemical parameters. As shown in Figure 7, the module operates in a primary–auxiliary collaborative branching mode, where leaf spectra serve as the primary branch, while soil spectra and biochemical parameters form the auxiliary branch. This design enables the extraction of features from different modal data, providing more discriminative inputs for subsequent multimodal feature fusion. The leaf spectra are designated as the primary branch due to their ability to directly reflect crop physiological states closely related to yield formation—such as chlorophyll content and photosynthetic capacity—offering more direct and dominant predictive significance. In contrast, the soil spectra and biochemical parameters function as the auxiliary branch, supplying critical contextual information on the crop’s growing environment and intrinsic drivers. By integrating external soil conditions and internal nutrient status, the auxiliary branch actively regulates and optimizes the feature extraction process of the primary branch, thereby enabling more accurate interpretation of leaf spectral characteristics.

2.4.1. Leaf Spectral Branch

The leaf spectral branch employs a feature extraction strategy combining multi-scale analysis with attention mechanisms. To enhance feature representation capability, DWT was applied to decompose preprocessed leaf spectral data into high-frequency features (capturing local details) and low-frequency features (representing global trends), as illustrated in Figure 8.
Figure 9 illustrates the detailed architecture of the leaf spectral branch. To address the issue of information redundancy in raw spectral data, an SAM was incorporated to enhance feature representation of key spectral bands. The processed data then undergo deep feature extraction through a specifically designed spectral feature extraction network (SFE), which independently processes three data streams: high-frequency features, low-frequency features, and SAM-enhanced original spectral data. Finally, a CAM performs channel-wise recalibration on the fused multi-scale features to further improve feature discriminability.
Compared to direct feature extraction from raw leaf spectral data, the DWT-based approach simultaneously captures both global and local characteristics, providing more comprehensive and discriminative input features for subsequent yield prediction modeling. The incorporated SAM adaptively learns importance weights for spectral bands, effectively amplifying features critical for yield prediction while suppressing redundant or noise-corrupted bands. Furthermore, by applying CAM to the fused leaf spectral features obtained through multi-feature concatenation, the weight allocation of feature channels is further optimized, dynamically strengthening highly discriminative feature channels in the fused leaf spectral features while weakening the less contributive channels. This multi-level feature optimization strategy significantly enhances the model’s ability to extract leaf spectral features, providing more representative feature representations for maize yield prediction.
The SFE in this branch is improved based on the hyperspectral image classification model (1DCNN-HSI) proposed by Hu et al. [30]. The model includes an input layer, convolutional layer C1, pooling layer M2, fully connected layer F3, and an output layer. The kernel size and number of kernels in the C1 layer are set to k 1 × 1 (where k 1 = n 1 / 9 , and n 1 is the number of input features) and 20, respectively. The M2 layer uses max pooling with a kernel size of k 2 × 1 (where k 2 = k 1 / 5 ). After pooling, the multidimensional data are flattened to achieve a smooth transition from the C1 layer to the F3 layer, and the hyperbolic tangent function Tanh is used as the activation function for both the C1 and F3 layers [30]. The SFE retains the C1, M2, and F3 layers from the 1DCNN-HSI model for leaf feature extraction. The structure of the SFE is shown in Figure 10. The network structure and specific parameters of SFE can be found in Table A3.

2.4.2. Soil Spectral Branch

The soil spectral branch incorporates SE blocks to perform preliminary feature extraction on preprocessed soil spectral data, dynamically adjusting the weights of each channel to enhance inter-channel dependencies. Subsequently, MLP is employed for deep feature extraction, leveraging its powerful nonlinear mapping capability to further mine deep-level features related to maize yield from the SE-filtered spectral features. The specific structure is illustrated in Figure 11.
Since the soil spectra and the leaf spectra exhibit different sensitive bands and representation dimensions when reflecting crop growth status, the introduction of SE not only avoids potential noise interference issues that may arise from direct feature extraction of raw soil spectra, but also effectively enhances the complementarity between soil features and leaf features. This enables the model to extract important features from soil information that make unique contributions to yield prediction, thereby forming informational complementarity with leaf spectral features and jointly improving prediction accuracy. Table A4 presents the network structure and specific parameters of the soil spectral branch.

2.4.3. Biochemical Parameter Branch

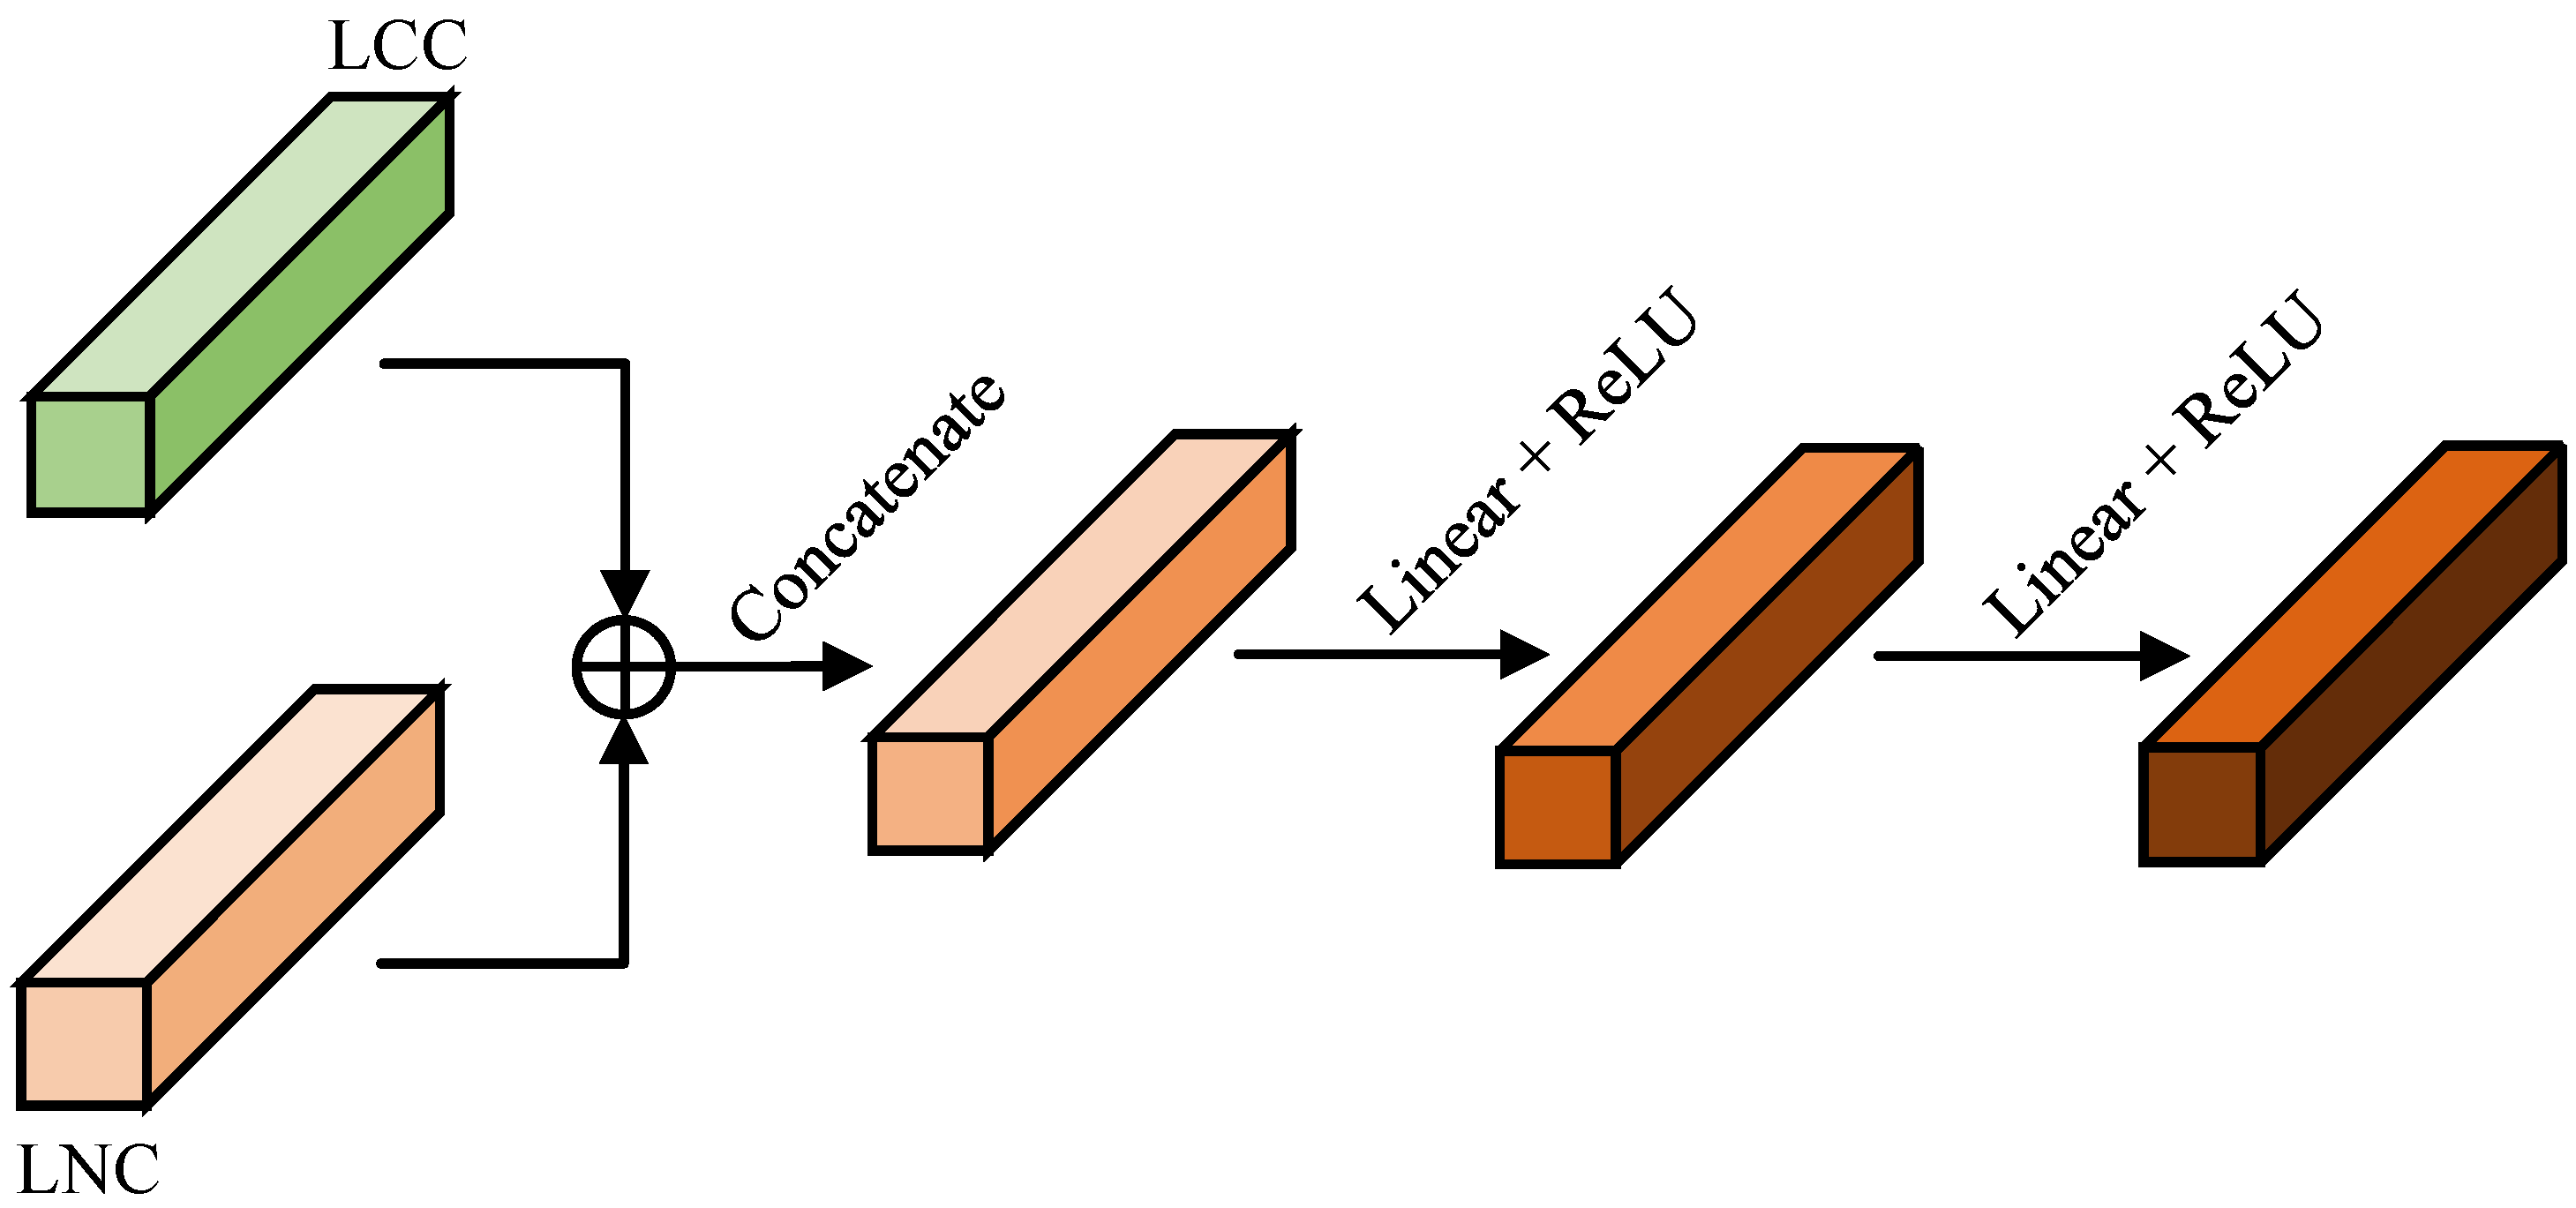
The biochemical parameter branch first applies Z-Score normalization to the input LCC and LNC to eliminate dimensional differences. An MLP is then used for feature extraction, mapping the normalized biochemical parameters to a feature space compatible with leaf spectral features, thereby extracting latent features related to leaf spectra from the biochemical parameters. The structure is shown in Figure 12. Table A5 presents the network structure and specific parameters of the MLP.
The three branches complement each other: leaf spectra provide information on chlorophyll content and photosynthetic efficiency, soil spectra reflect root-zone environmental conditions, and biochemical parameters characterize plant physiological status. Through synergistic fusion of multimodal data, the limitations of single-modal data can be overcome, significantly improving yield prediction accuracy.

2.5. Cross-Attention Feature Fusion Module

To deeply explore and effectively integrate complementary information from homogeneous and heterogeneous features, this study designed a dual-path feature fusion method based on a cross-attention mechanism. By establishing two feature interaction channels—leaf spectra–soil spectra and leaf spectra–biochemical parameters—the correlation and complementarity between different modal features were systematically investigated.
In the leaf spectra–soil spectra feature fusion path, soil spectral features were used as the query vector (Query), while leaf spectral features served as the key vector (Key) and value vector (Value), forming the core elements of the cross-attention mechanism. The calculation is shown in Equation (2). This design enables the extraction of leaf spectral features most relevant to soil conditions, dynamically capturing the leaf–soil response relationships closely tied to yield components such as photosynthetic efficiency and nutrient accumulation. Similarly, in the leaf spectra–biochemical parameter fusion path, biochemical parameters were used as the Query, and the leaf spectral features were used as the Key and the Value. By analyzing the correlation between biochemical indicators and spectral features, the contribution of plant physiological status to yield formation was quantified. To optimize feature fusion, residual connections were introduced to effectively preserve the feature information obtained from the multimodal feature extraction module. According to Table A6, the network structure and specific parameters of the cross-attention mechanism can be obtained.
CrossAttenton ( Q , K , V ) = Softmax Q K d k V ,
where Q denotes the Query vector, K denotes the Key vector, V denotes the Value vector, and d k denotes the dimensionality of the Key vector.
The subplot in Figure 13 illustrates the cross-attention-based feature fusion mechanism [31,32]. In this mechanism, the Query, Key, and Value vectors are all derived by applying independent linear transformations to the input features. Specifically, the input dimensions of the leaf spectral branch and the soil spectral branch are both 204, while the biochemical parameter branch has an input dimension of 2. Each of these inputs is projected into a 128-dimensional feature space via separate linear layers. The Key and Value vectors are generated from the leaf spectral features, while the Query vectors for the two fusion paths are derived from the soil spectral features and the biochemical parameter features, respectively. The dimensionalities of the Query, Key, and Value are, uniformly, 128. Here, d k is conventionally defined as the ratio of the model’s feature dimension to the number of attention heads. Given the characteristics of our multimodal fusion task—limited modality count and strong global inter-modal dependencies—we employ a single-head attention mechanism (number of heads = 1). This approach maintains model expressiveness while mitigating overfitting risks and simplifying the architecture. Therefore, the value of d k remains consistent with the feature dimension, also being 128.
Finally, multi-feature concatenation was employed to fuse the CAM-weighted leaf spectral features with the derived leaf spectra–soil spectra features and leaf spectra–biochemical parameter features, generating two fusion features that are rich in complementary information. Figure 13 shows the detailed structure of the cross-attention feature fusion module. This module uses the cross-attention mechanism to dynamically calculate the weight relationships between soil features and leaf features, as well as between biochemical parameters and leaf features, revealing the synergistic effects of soil–plant–physiology on final yield and providing new insights for yield prediction.

2.6. Yield Prediction Module

This study constructed a maize yield prediction module based on a 1D-CNN model and MLP, with its structure shown in Figure 14. First, the two fused features obtained from the cross-attention feature fusion module were input into the 1D-CNN model for feature extraction. Then, the output features from the two branches were concatenated along the channel dimension and fed into the subsequent MLP for deep feature extraction, further enhancing the discriminative representation of the features. The last fully connected layer in the MLP was configured with a single-neuron output, directly mapping to the predicted value of maize yield.
The 1D-CNN model in this module drew on the core concept of the Multi-task 1DCNN architecture proposed by Hu et al. [33]. This architecture consists of an input layer, three convolutional layers, two max-pooling layers, one fully connected layer, and an output layer. The kernel size of the convolutional layers was configured as 3 × 1 , containing 64, 32, and 32 kernels, respectively. The detailed structure is illustrated in Figure 15. Table A7 presents the network structure and specific parameters of the 1D-CNN model.

2.7. Evaluation Metrics

This study used the coefficient of determination (R2), root mean square error (RMSE), relative percentage deviation (RPD), and mean absolute error (MAE) to evaluate the performance of the yield prediction model.
R2 describes the linear correlation between predicted and actual values. The closer R2 is to 1, the better the model fit; the closer to 0, the worse the fit. The calculation is shown in Equaation (3) [34].
R 2 = 1 i = 1 n ( y ^ i y i ) 2 i = 1 n ( y ^ i y ¯ ) 2 ,
where y i is the true value of the i sample, y ^ i is the predicted value of the i sample, y ¯ is the average of all predicted values, and n is the total number of samples.
RMSE describes the difference between predicted and actual values. The closer RMSE is to 0, the better the model fit; the larger RMSE, the worse the fit. The calculation is shown in Equation (4) [35].
RMSE = i = 1 n ( y ^ i y i ) 2 n ,
RPD compares the consistency between actual and predicted values. The larger RPD, the better the predictive ability. If 1.4 R P D < 1.8 , the model can make approximate predictions; 1.8 R P D < 2.0 indicates good predictive ability; R P D 2.0 indicates excellent predictive ability. The calculation is shown in Equation (5) [36].
RPD = 1 n 1 i = 1 n ( y i y ¯ ) 1 n i = 1 n ( y i y ^ i ) ,
MAE measures the average absolute deviation between predicted and actual values. The closer MAE is to 0, the better the model fit; the larger MAE, the worse the fit. The calculation is shown in Equation (6) [37].
MAE = 1 n i = 1 n y i y ^ i ,

2.8. Technical Roadmap

The technical roadmap of this study is illustrated in Figure 16. Using maize leaf spectral data, soil spectral data, and leaf biochemical parameters as the research subjects, a hyperspectral-imaging-based maize yield prediction model was constructed. First, LCC and LNC in maize leaves were measured using a plant parameter analyzer, while a hyperspectral camera calibrated with white–black panel calibration was employed to acquire hyperspectral data of maize leaves and root-zone soil. The average spectral curves of ROIs were extracted and standardized. Concurrently, threshed maize grains were weighed using an electronic balance with 0.1 g precision. The obtained multimodal data and actual maize grain yields were then partitioned into training, validation, and test sets. For the multimodal data, distinct feature extraction branches were developed to separately process leaf spectral data, soil spectral data, and leaf biochemical parameters, generating multimodal features. These features were subsequently fused using a cross-attention mechanism to fully exploit complementary information among different features. Finally, a prediction module based on 1D-CNN was implemented for maize yield prediction. The model was evaluated using R2, RMSE, RPD, and MAE metrics, with the optimized model being applied to predict maize yields in the test set.

3. Results

3.1. Experimental Environment and Parameter Settings

CA-MFFNet was trained on a Windows Server 2022 Datacenter operating system. The hardware configuration of the system is provided in Table A2. The model was optimized using the Adam optimizer and trained with the MSE loss function. During hyperparameter tuning, the initial parameter ranges were first established based on the relevant literature. A systematic manual search was then conducted to comprehensively compare the MSE performance of different parameter combinations on the validation set. The final parameter set was selected for achieving optimal predictive accuracy and training stability. To visually demonstrate the influence of hyperparameter settings on model performance, Table 2 presents a comparative overview of results under different configurations. The key training hyperparameters are summarized in Table 3.
Table 3 presents the training and inference efficiency as well as the model complexity of the proposed approach. As shown in the table, the proposed model not only maintains high predictive accuracy but also demonstrates favorable characteristics of low latency and a lightweight architecture. With a moderate model size and millisecond-level inference speed, it exhibits efficient processing capability for multimodal data. Although the current experiments were conducted on a high-performance workstation, its strong performance metrics indicate significant potential for deployment on edge computing devices—such as embedded Jetson platforms or high-performance agricultural drones—laying a technical foundation for real-time hyperspectral analysis in field applications.

3.2. Training Results

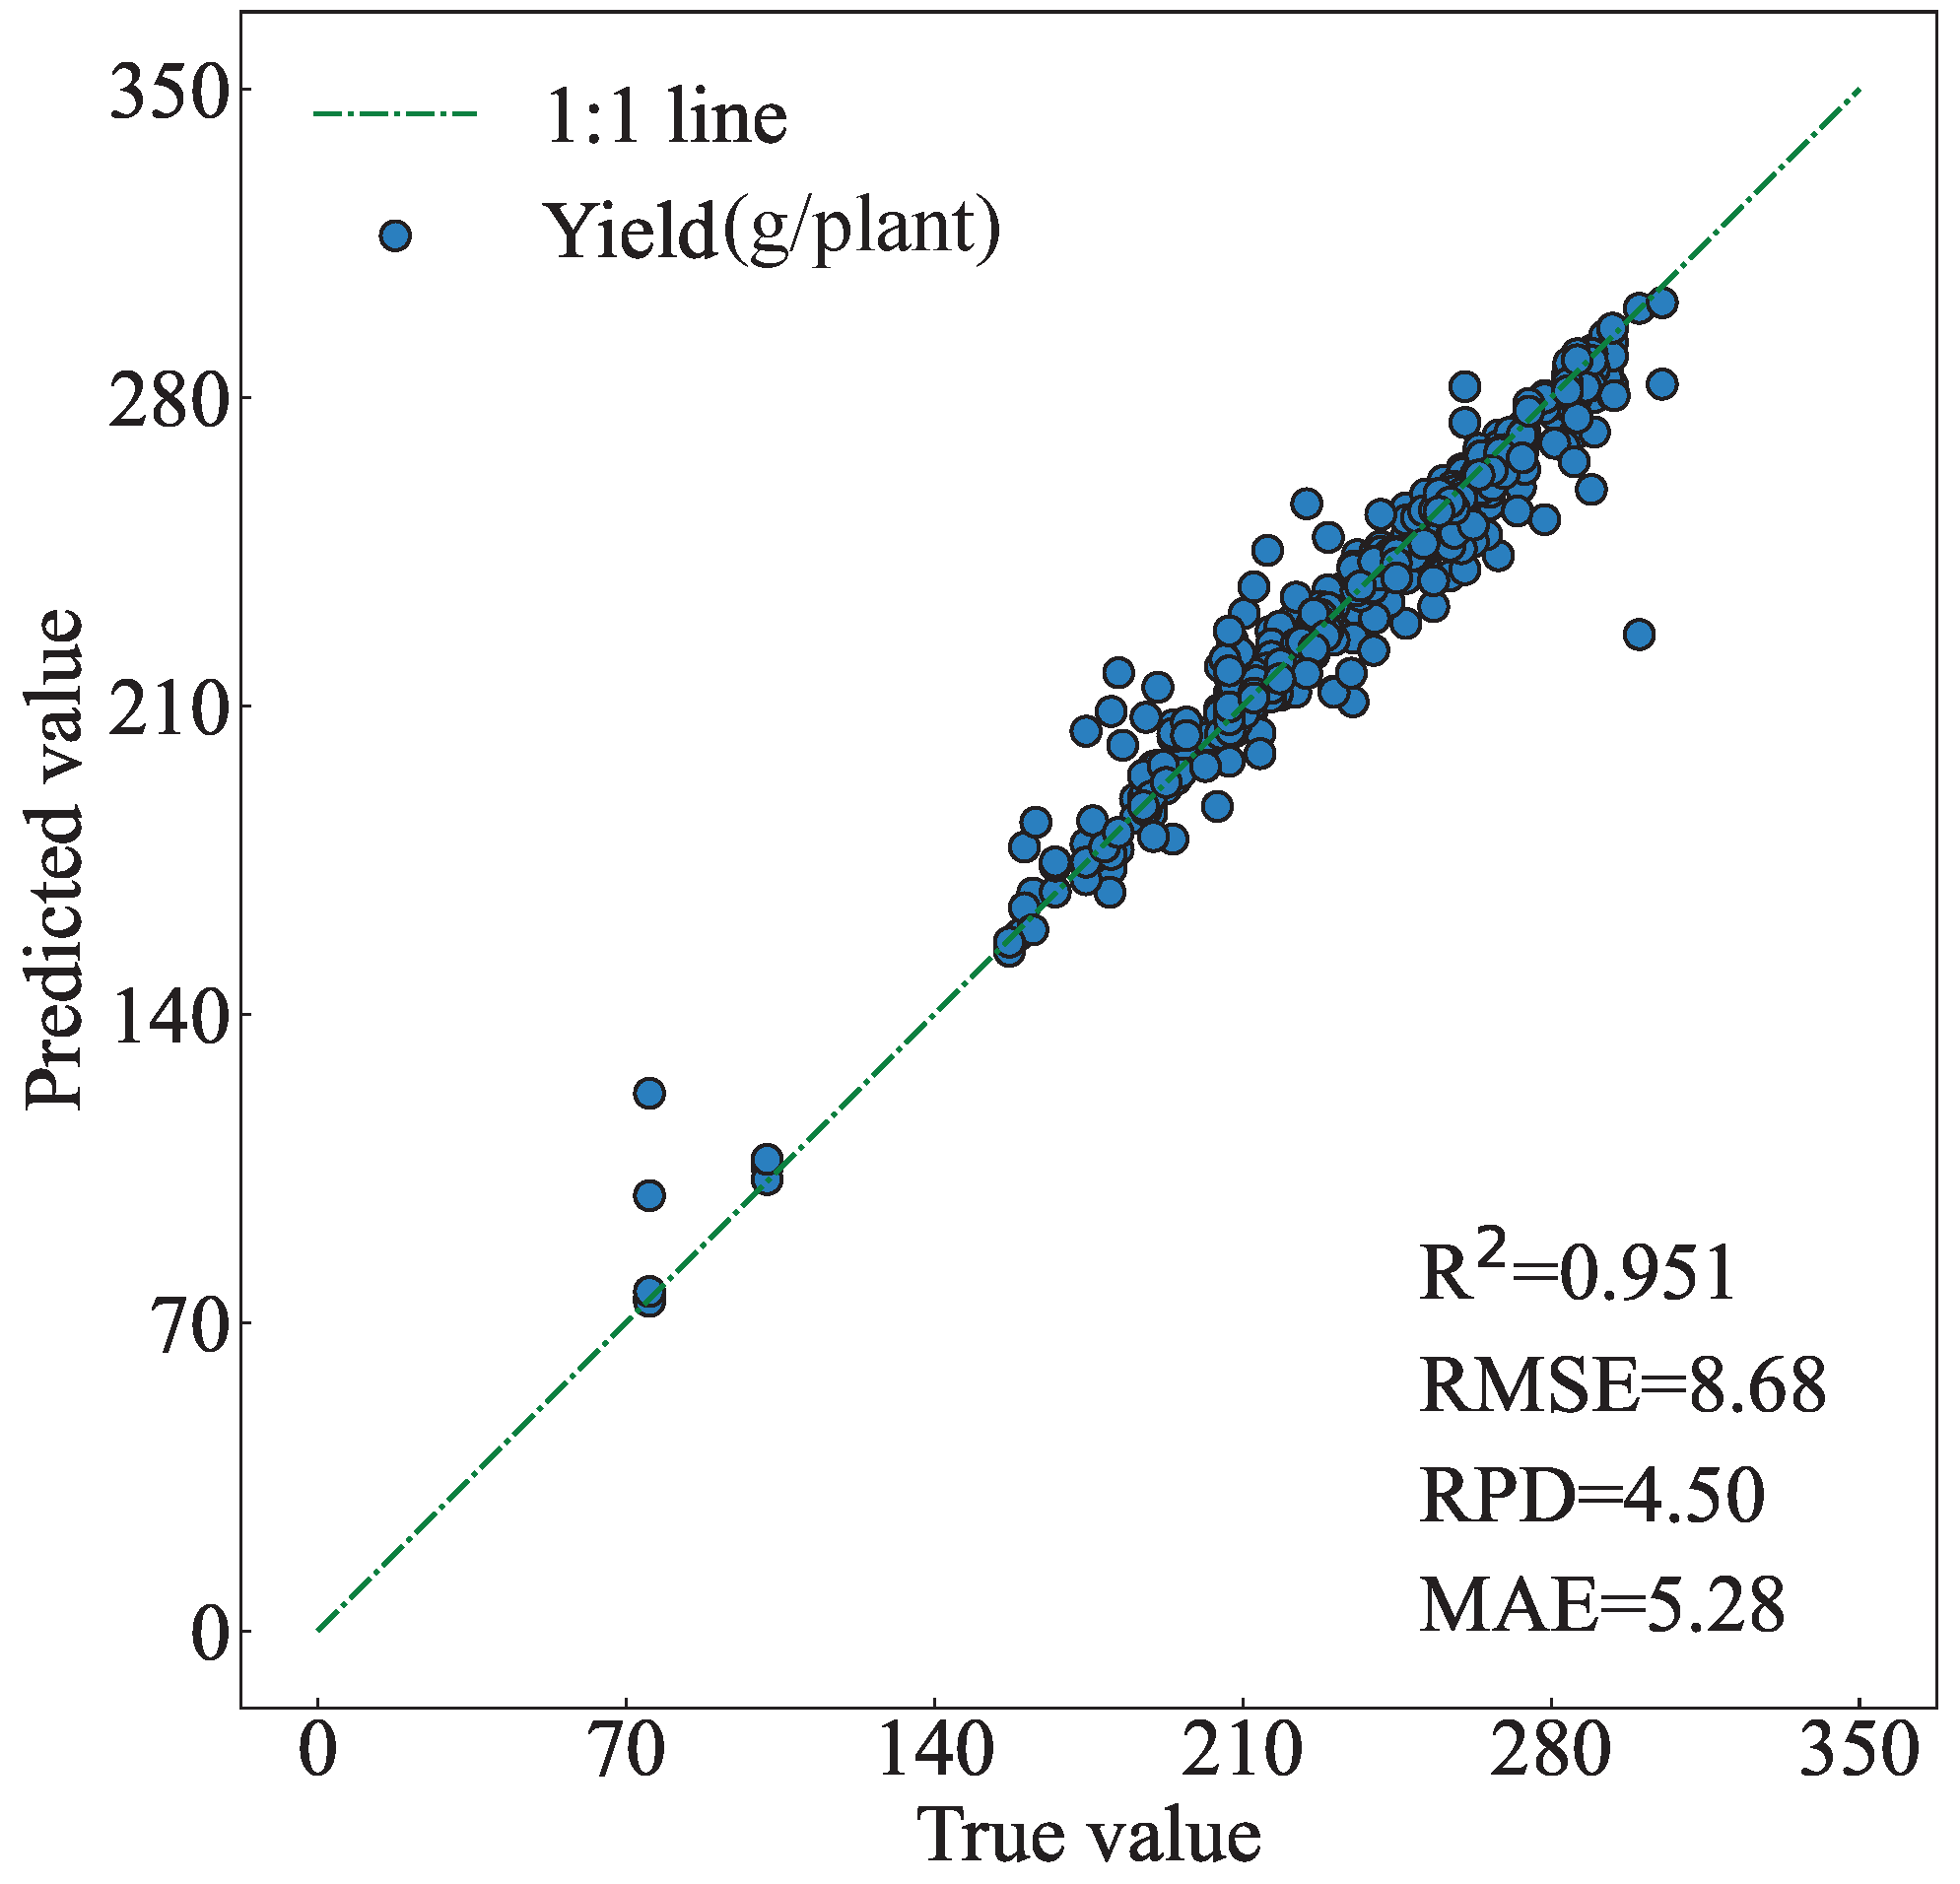
Figure 17 shows the scatter plot of maize yield results obtained using the test set data, achieving an R2 of 0.951, an RMSE of 8.68, an RPD of 4.50, and an MAE of 5.28. The data points are tightly distributed around the 1:1 reference line, demonstrating a high consistency between predicted and actual values, which confirms the superior predictive performance of the CA-MFFNet model.
Further analysis of the data distribution reveals that, while most yield values in the test set fall within the normal range of 140–350 g/plant, there are a few abnormal low-yield samples with yield values below 140 g/plant. Field investigation records indicate that these outliers primarily result from special growth conditions, such as pest and disease damage or improper water and fertilizer management, leading to significantly reduced yields. Notably, despite these abnormal samples deviating from the main distribution, the model maintains stable prediction accuracy, highlighting the robustness and practical value of CA-MFFNet.
Figure 18 compares the predicted and actual maize yields for selected samples in the test set. The results show that the predicted values closely match the actual values, indicating that the model accurately captures maize yield variations and exhibits strong predictive capability.
To ensure statistical rigor and robustness in model performance evaluation, this study employed the Bootstrap resampling method to compute confidence intervals for performance metrics and conducted stratified analysis of prediction errors based on yield quantiles. This approach allows for a comprehensive assessment of model performance across different yield levels.
The results in Table 4 demonstrate that the model achieves high predictive accuracy and reliability overall. The Bootstrap confidence intervals indicate that all performance metrics remain at high levels with narrow intervals, reflecting robust estimation and strong generalization capability. Specifically, the coefficient of determination R2 reaches 0.951 (95% CI: 0.929–0.967), RMSE is 8.75 (95% CI: 7.00–10.15), MAE is 5.25 (95% CI: 4.55–5.95), and RPD reaches 4.56—significantly exceeding the threshold of 3.0. These results confirm the model’s high predictive precision and reliability.
As shown in Table 5, the distribution of prediction errors across different yield groups indicates that the model performs best for the medium-yield group, with an MAE of 4.31 and an RMSE of 6.53. In contrast, relatively higher errors are observed in the low-yield and high-yield groups, with MAE values of 5.93 and 5.60, respectively, and RMSE values exceeding 9.5 in both cases. These results suggest that the model offers more robust predictions for medium yield levels, while its ability to capture extremely high or low yield scenarios is slightly weaker. This limitation may stem from sample distribution bias or the complex agronomic and environmental factors associated with extreme yields that are not fully captured by the features. Nevertheless, the error rates across all yield groups remain within acceptable limits, demonstrating that the CA-MFFNet model maintains strong applicability and stability under varying yield conditions.
Additionally, this study conducted yield prediction using multimodal data from four key growth stages (V6, VT, R3, and R6) to investigate their correlation with maize yield. As shown in Table 6, the prediction results based on single growth stage data showed significant limitations, with R2 values all below 0.9 for models built using individual stages. This may be attributed to the limited sample size from single growth stages, making it difficult for the model to fully learn the complex patterns of yield formation, resulting in insufficient generalization ability and reduced prediction accuracy.
In contrast, integrating data from all four key growth stages significantly increased the sample size, effectively avoided the complexity associated with cross-stage feature fusion. Improving the model’s 2 to 0.951, representing a 0.052 increase compared to the best single growth stage model. Figure 19 visually compares the yield prediction results from different growth stages. Notably, when using single stage data for yield prediction, the R6 growth stage data showed abnormal performance, with significantly increased RMSE and a 0.05 decrease in R2 compared to the R3 stage. This suggests that R6 stage data may have weak correlation with maize yield, which contradicts conclusions from previous studies [38,39]. Based on our analysis, no abnormal precipitation occurred during the early growth stages such as V6, VT, and R3. However, prior to data collection at the R6 stage (from mid-August to late September), the experimental area experienced sustained heavy rainfall combined with excessive irrigation, leading to a significant increase in soil volumetric water content. This resulted in localized soil supersaturation and root zone hypoxia, which adversely affected crop physiology. Consequently, both leaf physiological indicators and spectral features exhibited a negative correlation with final yield, making it difficult to accurately predict maize yield during the R6 stage under these conditions.

3.3. Comparative Experiments

To validate the effectiveness of multimodal data fusion and demonstrate the performance advantages of the CA-MFFNet model in maize yield prediction, this study designed multiple comparative experiments.
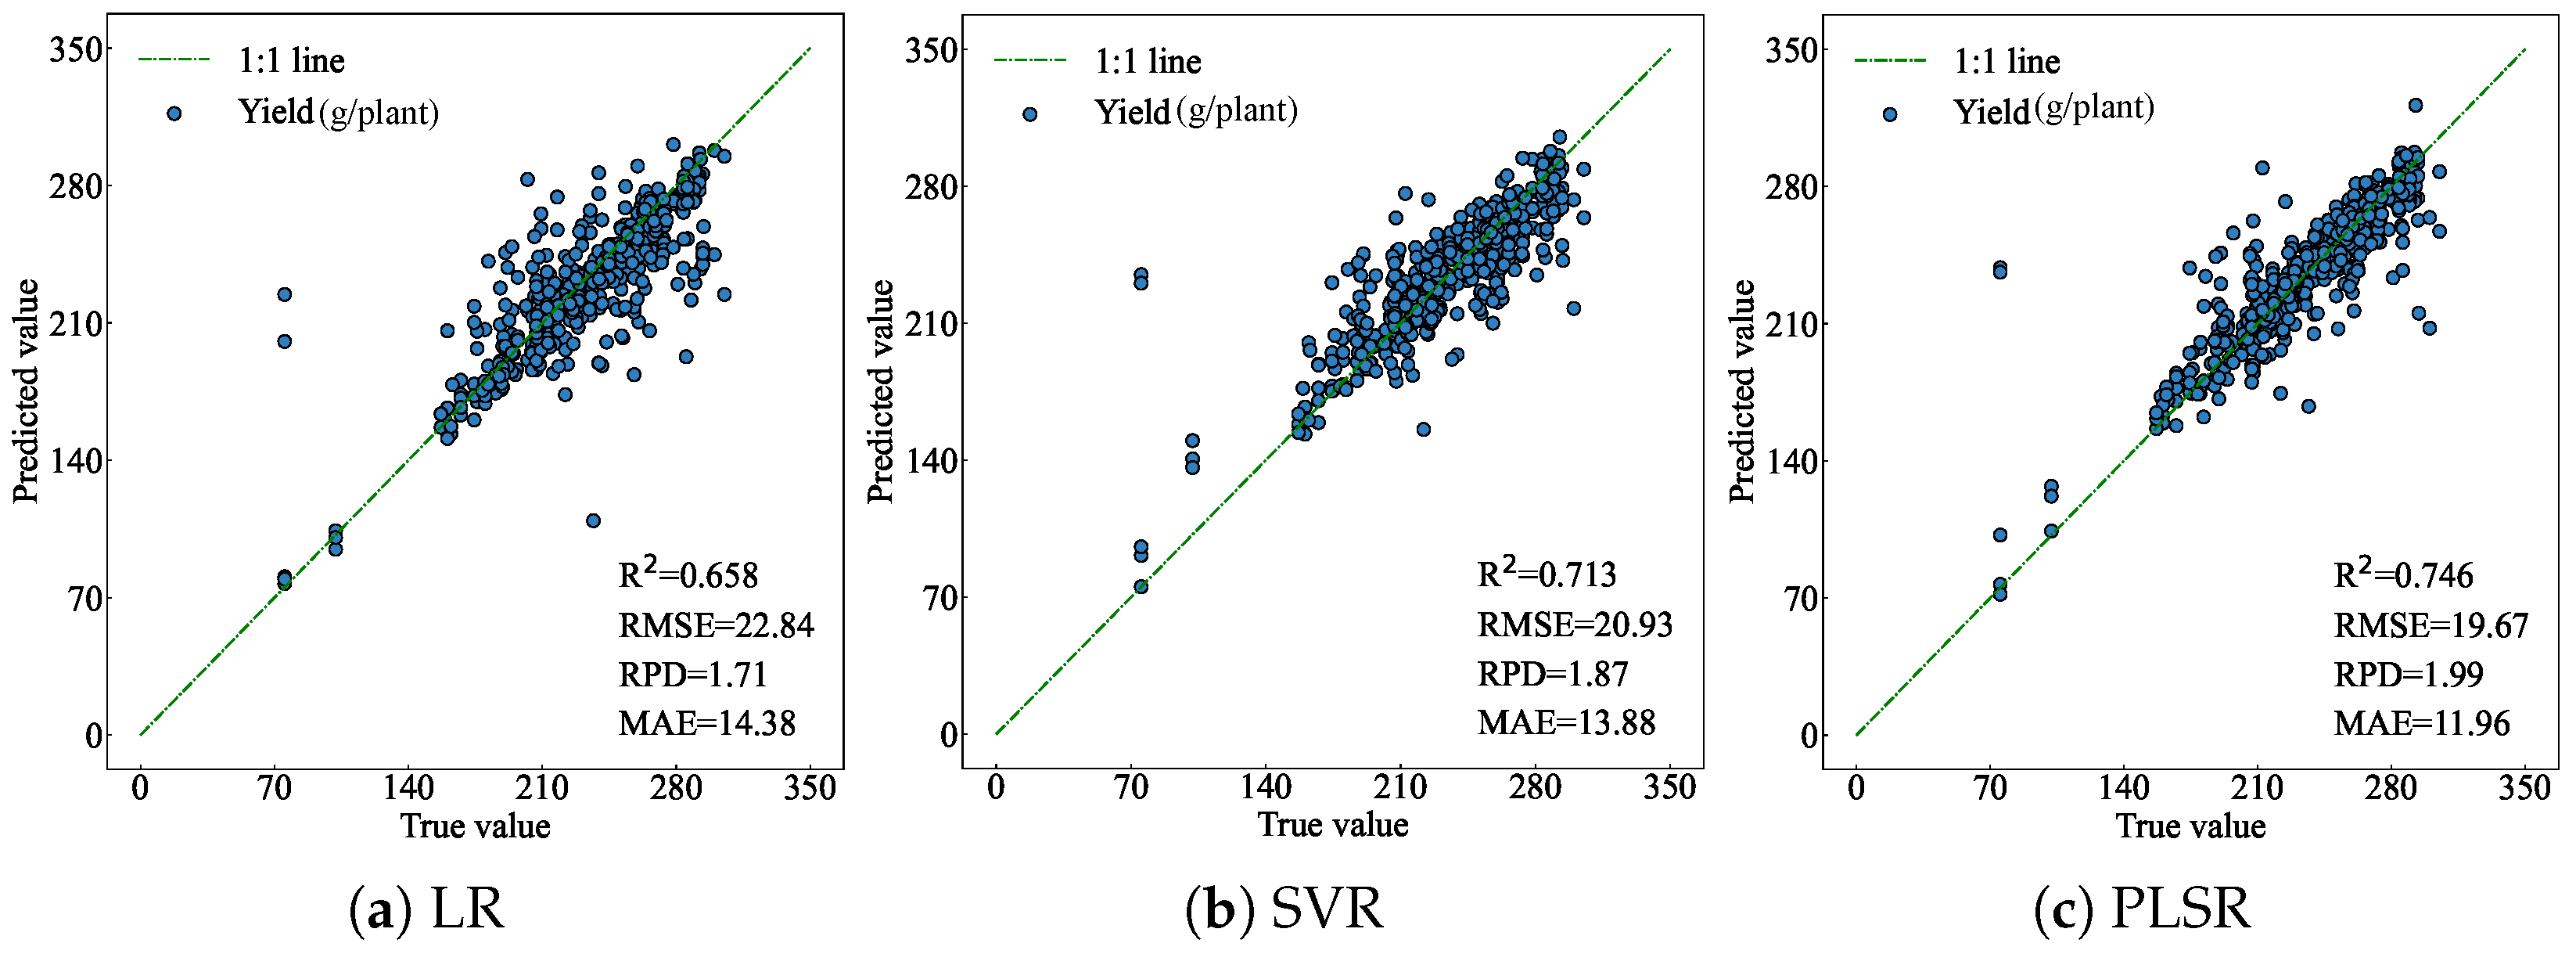
To systematically evaluate the predictive performance of the CA-MFFNet model, it was compared with traditional machine learning methods, including logistic regression (LR), partial least squares regression (PLSR), and support vector regression (SVR). As shown in Figure 20, the prediction results obtained using traditional models exhibited significant dispersion, with R2 values not exceeding 0.75. The scatter points deviated markedly from the 1:1 reference line compared to those of the CA-MFFNet model. These results indicate that traditional machine learning models, constrained by their shallow architectures, struggle to effectively capture the complex nonlinear features in hyperspectral data. In contrast, the CA-MFFNet model, leveraging its deep learning framework, excels at extracting and utilizing deep feature information from high-dimensional spectral data, thereby significantly improving yield prediction accuracy.
To comprehensively evaluate the superior performance of the CA-MFFNet model, it was compared against traditional baseline methods including Random Forest, XGBoost, and Elastic Net. As illustrated in the Figure 21, the prediction results obtained by these conventional models exhibit notably scattered distributions, with R2 values none exceeding 0.85. Their deviation from the 1:1 reference line is significantly greater than that of CA-MFFNet, which may be attributed to the limited capacity of traditional models to adaptively learn complex, nonlinear interactions among multimodal data. These results demonstrate that, compared to conventional baseline models, CA-MFFNet shows remarkable advantages in yield prediction tasks. By leveraging an end-to-end deep learning framework, it achieves direct mapping from raw input data to prediction targets. The integration of multiple attention mechanisms allows the model to automatically weigh the importance of different modal information and uncover deep-level relationships between spectral features and yield formation, ultimately leading to more accurate and reliable yield predictions.
To further validate the superiority of the CA-MFFNet model, it was compared with two recently proposed one-dimensional models: TCNA [40] and Multi-task 1DCNN [33]. As shown in Figure 22, the CA-MFFNet model demonstrates the best agreement between predicted and actual values, with its scatter points showing the closest distribution to the 1:1 reference line, achieving R2 of 0.951 and RPD of 4.50, indicating the highest prediction accuracy. In comparison, the TCNA model has the weakest performance, with R2 not exceeding 0.8, only suitable for rough yield prediction of maize. Although the Multi-task 1DCNN model outperforms TCNA, its prediction accuracy remains significantly lower than the model proposed in this study. These comparative results fully demonstrate the advancement and reliability of the CA-MFFNet model in using multimodal data for maize yield prediction.
To systematically demonstrate the superior performance of attention mechanisms in feature extraction, three control experiments were designed: removing both SAM and CAM, removing only SAM, and removing only CAM. As shown in Figure 23, the results showed that the complete CA-MFFNet model achieved the best alignment with the 1:1 reference line, outperforming all the variant models. Specifically, removing both SAM and CAM caused the most significant performance degradation, RMSE increased by 2.76, while removing SAM or CAM alone reduced R2 by 0.025 and 0.019, respectively. These results indicate that SAM and CAM effectively enhance feature extraction by capturing correlation features in leaf spectra and optimizing channel-wise feature representations. Their synergistic effect maximizes the extraction of yield-related spectral features, significantly improving prediction accuracy.
Control experiments using only leaf spectral data, fused soil and leaf spectral data, and fused biochemical parameters and leaf spectral data were designed to validate the effectiveness of different multimodal data fusions for yield prediction. As shown in Figure 24, different input combinations produced significantly different prediction results. The experimental results demonstrate that the model incorporating the multimodal data fusion achieves optimal predictive performance, showing significantly better agreement between the predicted and actual values compared to using single leaf spectral data or other control experimental schemes, with predictions more closely aligned to the 1:1 reference line. This indicates that multimodal data fusion can fully leverage complementary information from different data sources, effectively enhancing both the prediction accuracy and the generalization capability of the model.
Further analysis reveals that incorporating either biochemical parameters or soil spectral data provides auxiliary benefits for maize yield prediction based on leaf spectral data. Notably, the enhancement effect of leaf biochemical parameters on yield prediction performance is markedly superior to that of soil spectral features. This difference may be attributed to the more direct correlation between leaf biochemical parameters and crop physiological processes related to yield formation. Chlorophyll concentration determines light energy capture efficiency and photosynthetic potential; meanwhile, nitrogen, as a key component of proteins and enzymes, directly regulates photosynthetic function and grain development during yield formation. These biochemical parameters thus serve as quantitative representations of the crop’s physiological state, providing biologically interpretable and direct explanatory variables for yield prediction. In contrast, the influence of soil on yield is indirect, primarily mediated through its regulation of root development, water availability, and nutrient supply, which collectively shape the physiological status of the crop. Furthermore, soil spectral data constitute a high-dimensional dataset containing numerous bands, many of which exhibit weak correlations with yield and may introduce noise or redundant information, thereby complicating feature extraction and model generalization.
To evaluate the effectiveness of different preprocessing methods for hyperspectral data, a comparative analysis was conducted between the Z-Score normalization used in this study, Savitzky–Golay (SG) smoothing, and Standard Normal Variate Transformation (SNV). As shown in the Figure 25, the prediction results of the CA-MFFNet model using Z-Score normalization exhibited strong agreement with the measured values, with scatter points distributed most closely to the 1:1 reference line. In contrast, the scatter plots obtained using SG and SNV showed greater dispersion, with SG in particular achieving an R2 of only 0.823, suggesting that the SG method may have introduced waveform distortion or derivative noise. The Z-Score method, meanwhile, effectively eliminated scale differences and mitigated the influence of outliers while preserving the original spectral morphology to the greatest extent. As a result, it provided more stable and interpretable input variables, ultimately enhancing the accuracy of the yield prediction model.
Figure 26 presents the prediction results from ablation experiments conducted on the leaf spectral branch of the CA-MFFNet model. As shown in Figure 26a,b, comparison with data processing approaches that exclude DWT and preprocessing reveals that the scatter plots obtained without DWT and preprocessing exhibit greater dispersion compared to the CA-MFFNet model. Particularly, the prediction results from raw data without preprocessing show the poorest performance, with R2 reaching only 0.733. This highlights the critical role of preprocessing in enhancing hyperspectral data quality. The absence of DWT reduced the model’s ability to capture spectral detail features, decreasing R2 by 0.028, demonstrating that its multi-scale decomposition effectively extracts both high-frequency details and low-frequency features from the spectra, thereby enriching feature representation and providing more comprehensive feature information for yield prediction.
The scatter plot of prediction results obtained by removing SFE is shown in Figure 26c. The results indicate that, compared to the complete CA-MFFNet model, eliminating SFE significantly reduced prediction accuracy, producing more scattered data points relative to the 1:1 reference line, with R2 reaching 0.921. This confirms that SFE, as a feature extraction method, effectively isolates yield-related spectral information from leaf spectral characteristics while suppressing interference from background noise and redundant data, substantially improving the accuracy of maize yield predictions.
The SE module significantly improves soil spectral feature extraction. Figure 27a shows the prediction results after removing SE from the model. Compared with predictions without SE, the CA-MFFNet model demonstrates a tighter distribution of predicted versus actual values along the 1:1 reference line, with R2 increasing by 0.017 and RMSE decreasing by 1.35. These results indicate that SE effectively enhances key yield-related features in soil spectra while suppressing noise interference in raw data, thereby improving maize yield prediction performance.
To validate the superiority of the cross-attention mechanism in multimodal data fusion, we compared it with direct feature concatenation of leaf features with soil and biochemical parameter features from the multimodal feature extraction module. As shown in Figure 27b, predictions without cross-attention exhibit more scattered data points, with R2 decreasing by 0.02 and RMSE increasing by 1.57. In contrast, the CA-MFFNet model with cross-attention demonstrates superior prediction performance, showing tighter clustering of data points around the 1:1 reference line. This comparison proves the advantage of cross-attention in multimodal data fusion, as it effectively integrates multimodal data by establishing dynamic weight relationships between modalities, significantly improving yield prediction reliability.
4. Discussion

Maize yield prediction holds significant practical value for agricultural production management, food security assurance, and agricultural policy formulation [41,42,43,44]. Current research based on hyperspectral technology typically uses only leaf spectral data as input, neglecting the influence of soil environment on maize leaf growth and development, and failing to fully utilize complementary information from multimodal data fusion, resulting in limited prediction accuracy [45,46,47]. The CA-MFFNet model proposed in this study integrates maize leaf hyperspectral data, soil hyperspectral data, and leaf biochemical parameter data, thoroughly exploring synergistic characteristics among different data sources, and successfully achieves high-precision yield prediction. The experimental results show that the model achieves an R2 value of 0.951, an RMSE no higher than 8.7, an RPD greater than 4, and an MAE of 5.28, with a prediction performance superior to traditional single-modal methods; these results validate the effectiveness of the multimodal fusion strategy in enhancing yield prediction models.
The red-edge region (720–750 nm) in leaf spectra is highly sensitive to chlorophyll content, and its redshift phenomenon directly reflects increased chlorophyll concentration and enhanced photosynthetic capacity. The absorption valleys in the blue–violet (∼450 nm) and red (∼680 nm) regions of the visible spectrum are closely associated with chlorophyll a/b content, characterizing light capture efficiency. As a key component of chloroplasts and proteins, nitrogen influences spectral responses through reflectance peaks around 550 nm and spectral slope features near 700 nm, thereby directly modulating nitrogen metabolism and plant growth. Soil spectra, on the other hand, indirectly reflect nitrogen and moisture availability in the root zone through organic-matter-related features and moisture absorption characteristics (e.g., ∼970 nm) across the visible and near-infrared regions. However, current studies relying solely on maize leaf spectral data for yield prediction suffer from limited model generalizability and unstable predictive accuracy [48,49,50,51]. Integrating multimodal data for collaborative prediction can effectively overcome the limitations of single-modal approaches in crop yield forecasting [52,53,54,55], thereby enhancing the capture of yield-sensitive information across diverse data modalities.
This study compares the performance differences between single-modal and multimodal data in yield prediction and finds that fused multimodal data significantly outperform single leaf spectral data in prediction accuracy. Compared to the limitations of single-modal data in comprehensively capturing effective spectral information, the combined use of multimodal data can extract different feature information from the data, fully leveraging the complementarity between features to improve model prediction accuracy [56,57,58,59,60]. As shown in Table 7, after introducing soil spectral features, the model’s prediction performance significantly improves compared to single leaf spectral data, with R2 increasing by 0.19. This result demonstrates that the synergistic effect between soil and leaves can effectively enhance yield prediction performance. Notably, the fusion of leaf spectra, soil spectra, and leaf biochemical parameters achieves an R2 value exceeding 0.95, which not only verifies the superiority of the multimodal fusion strategy but also reveals significant complementary effects among different data modalities, providing a new technical pathway for constructing high-precision maize yield prediction models.
The high-precision prediction performance of the CA-MFFNet model is primarily attributed to feature enhancement and information complementarity achieved through multimodal data fusion. At the data input stage, a multimodal parallel network architecture is adopted to perform deep feature extraction on leaf spectral data, soil spectral data, and leaf biochemical parameters separately, effectively preserving the unique features of each modal dataset. Then, cross-attention mechanisms are introduced to achieve dynamic interaction and fusion between different modal features, fully exploring the complementary information of multimodal features. This design, compared to traditional serial or parallel feature fusion methods (such as PCA or simple CNN stacking), better aligns with the complex mechanism of multi-factor synergistic effects during maize growth and metabolism, enabling a more comprehensive description of crop growth conditions [61], and thereby significantly improving the accuracy of maize yield prediction.
Table 6 compares the impact of data from four maize growth stages on yield prediction. Further analysis reveals that using multimodal data from individual growth stages for yield prediction yields suboptimal results. This may be attributed to the rapid crop growth during early stages, making it difficult to accurately capture key factors affecting final yield formation, thereby introducing significant uncertainty to the prediction task [5,62,63,64]. As growth progresses, prediction results based on the first three stages gradually improve, consistent with findings from existing studies [38,65,66]. However, the R6 stage shows a significant decline in prediction accuracy. Field observations indicate this anomaly stems from excessive rainfall during the experimental year combined with over-irrigation, leading to root hypoxia during R6 that caused premature leaf yellowing and accelerated withering [67], thereby reducing the correlation between leaf spectral information and final yield. These results indirectly demonstrate that, under abnormal climatic conditions, environmental factors require special consideration when using spectral data for yield prediction, presenting new scientific questions for future research.
To evaluate the generalizability of the CA-MFFNet model, an independent external validation dataset comprising 320 samples was collected from experimental fields in Dalad Banner, Ordos City, Inner Mongolia. Compared to the original training region, this area experiences approximately 15% lower annual precipitation, and the maize cultivar planted was “Jingke 968”. Despite these environmental and genetic differences, the model demonstrated strong predictive performance on the external validation set without any retraining, achieving an R2 of 0.892, an RMSE of 10.47, and an RPD of 3.12. Although a slight decrease in accuracy was observed compared to the main experiment, these results indicate that the CA-MFFNet model exhibits robust generalization capability and potential for regional adaptation across diverse ecological conditions and crop varieties.
This study innovatively integrated maize leaf and soil hyperspectral data with leaf biochemical parameters to construct a deep-learning-based CA-MFFNet yield prediction model, achieving high-precision yield prediction. However, the current model treats data from different growth stages as independent samples and has not yet explored the potential temporal dependencies between these stages. This limitation may prevent the model from capturing key physiological processes underlying yield formation. Future research could incorporate temporal modeling methods, such as Long Short-Term Memory networks, to fully exploit the dynamic correlations and synergistic mechanisms among crop information across growth stages. Such an approach would enable a more comprehensive representation of the yield formation process, thereby enhancing both the predictive performance and mechanistic interpretability of the model [39,66,68,69].

5. Conclusions

This study developed a deep learning prediction network (CA-MFFNet) based on multimodal data fusion to address the limitations of traditional maize yield prediction methods that rely solely on single-modal data. Based on the synergistic mechanism of multimodal data, the CA-MFFNet model achieved accurate maize yield prediction by utilizing leaf spectral data, soil spectral data, and leaf biochemical parameters. To solve the redundancy and collinearity issues in raw spectral data, differentiated feature optimization strategies were designed. For leaf spectra, SAM and CAM were combined to enhance key feature extraction, and DWT was used for multi-scale decomposition to enrich feature representation. For soil spectra, SE was employed to optimize feature channel weights. The experimental results showed that the incorporation of attention mechanisms effectively enhanced the model’s feature extraction capability, while multimodal data fusion significantly improved the accuracy of maize yield prediction.
In terms of feature fusion, this study proposed a multimodal feature interaction strategy improved by a cross-attention mechanism. By establishing dual-path feature fusion methods for leaf spectra–soil spectra and leaf spectra–biochemical parameters, high-precision prediction of maize yield was achieved. The model prediction results demonstrated that root-zone soil spectral features and leaf biochemical parameters significantly improved yield prediction performance based on leaf spectral data. The model achieved an R2 of 0.951, an RMSE of 8.68, an RPD of 4.50, and an MAE of 5.28, exhibiting excellent predictive performance. These research findings provide new approaches and foundations for the application of hyperspectral technology in non-destructive crop yield monitoring.
Moreover, by deploying the CA-MFFNet model on a cloud-based analysis platform and integrating it with portable spectral devices and in-field sensors, a smart yield prediction system can be established for field-scale agricultural management. This system can rapidly process acquired spectral and sensor data to generate maize yield prediction maps, providing farmers and agricultural technicians with quantitative support for fertilization and irrigation planning, harvest decision making, and profitability assessment. The implementation of this technology is expected to facilitate a shift from traditional experience-driven practices to data-intelligent decision making in corn production. It offers core technical support for non-destructive crop monitoring, precision cultivation management, and optimized allocation of agricultural resources, thereby demonstrating significant practical value for enhancing intelligent agricultural production.

Author Contributions

Conceptualization, Z.X. and Y.Z.; methodology, S.S.; software, S.S. and Y.Z.; validation, S.S., Z.X., and Y.Z.; formal analysis, S.S. and Y.Z.; investigation, Z.X.; resources, Z.X.; data curation, S.S. and Y.Z.; writing—original draft preparation, S.S.; writing—review and editing, S.S., Z.X., and Y.Z.; visualization, S.S. and Z.X.; supervision, Z.X.; project administration, Z.X.; funding acquisition, Z.X. All authors have read and agreed to the published version of the manuscript.

Funding

This research was funded by the Inner Mongolia Autonomous Region Science and Technology Program grant number 2021GG0345, the Natural Science Foundation of Inner Mongolia Autonomous Region grant number 2021MS06020 and the Inner Mongolia Natural Science Foundation grant number 2024QN04013.

Data Availability Statement

The dataset supporting the conclusions of this article is available in the github repository, https://github.com/SSNssn123/Maize/blob/00698378e1451c1338cbbbc99f4e555-45d5eb39d/README.md (accessed on 12 August 2025). The code supporting the conclusions of this article is available in the github repository, https://github.com/SSNssn123/Maize.git (accessed on 12 August 2025).

Conflicts of Interest

The authors declare no conflicts of interest.

Abbreviations

The following abbreviations are used in this manuscript:
V6jointing stage
VTtasseling stage
R3grain filling stage
R6maturity stage
LCCleaf chlorophyll content
LNCleaf nitrogen content
DWTdiscrete wavelet transform
SEsqueeze-and-excitation network
SAMspectral attention mechanism
CAMchannel attention mechanism
LRlogistic regression
SVRsupport vector regression
PLSRpartial least squares regression
SFEspectral feature extraction network
FCfully connected layer
MLPmultilayer perception
CA-MFFNetmaize yield prediction network, which enhances features based on different attention mechanisms and employs cross-attention for multimodal data fusion.

Appendix A. Hardware Specifications

Appendix A.1. Specification of the Hyperspectral Camera

Table A1 presents the technical specifications of the Specim IQ hyperspectral camera. The spectral acquisition range spans from 400 to 1000 nm, covering visible–near-infrared wavelengths, with a sampling interval of 3 nm and a total of 204 spectral bands.
Table A1. Characterization of the Specim IQ.
ParameterSpecification
Detector specificationCMOS
Spectral region400–1000 nm
Sample interval3 nm
Channels204
Integral time10 ms
FWHM5.5 nm
Image resolution512 × 512 pix
Data output bit depth12 bit

Appendix A.2. Hardware Configuration of the System

Table A2 list the hardware configurations of the system.
Table A2. Hardware configuration of the system.
Hardware ComponentSpecification
Central Processing UnitAMD Ryzen Threadripper PRO 3945WX
Graphics Processing UnitNVIDIA RTX A4000
Video Random Access Memory16 G
Random Access Memory128 G

Appendix B. Network Structure and Specific Parameters

Appendix B.1. The Leaf Spectral Branch

Table A3 presents the network structure and specific parameters of the leaf spectral branch.
Table A3. The network structure and specific parameters of the leaf spectral branch.
ModuleLayer (Type)Output ShapeNumber of Parameters
InputInput Layer(−1, 204, 1)0
SAMConv1d(−1, 204, 1)41,820
ReLU(−1, 204, 1)0
Conv1d(−1, 204, 1)41,820
Softmax(−1, 204, 1)0
SFEConv1d(−1, 20, 182)480
Tanh(−1, 20, 182)0
MaxPool1d(−1, 20, 36)0
Flatten(−1, 720)0
Concatenate(−1, 300)0
Linear(−1, 128)38,528
CAMAdaptiveAvgPool1d(−1, 128, 1)0
Conv1d(−1, 16, 1)2064
ReLU(−1, 16, 1)0
Conv1d(−1, 128, 1)2176
Sigmoid(−1, 128, 1)0

Appendix B.2. The Soil Spectral Branch

Table A4 presents the network structure and specific parameters of the soil spectral branch.
Table A4. The network structure and specific parameters of the soil spectral branch.
ModuleLayer (Type)Output ShapeNumber of Parameters
InputInput Layer(−1, 204, 1)0
SELinear(−1, 12)2448
ReLU(−1, 12)0
Linear(−1, 204)2448
Sigmoid(−1, 204)0
MLPLinear(−1, 256)52,480
ReLU(−1, 256)0
Linear(−1, 128)32,896
ReLU(−1, 128)0

Appendix B.3. The Biochemical Parameter Branch

Table A5 presents the network structure and specific parameters of the biochemical parameter branch.
Table A5. The network structure and specific parameters of the biochemical parameter branch.
ModuleLayer (Type)Output ShapeNumber of Parameters
InputInput Layer(−1, 2, 1)0
MLPLinear(−1, 256)768
ReLU(−1, 256)0
Linear(−1, 128)32,896
ReLU(−1, 128)0

Appendix B.4. The Cross-Attention Mechanism

Table A6 presents the network structure and specific parameters of the cross-attention mechanism.
Table A6. The network structure and specific parameters of the cross-attention mechanism.
ModuleLayer (Type)Output ShapeNumber of Parameters
InputInput Layer(−1, 204, 128)0
Cross-AttentionLinear(−1, 128, 128)16,512
Linear(−1, 300, 128)16,512
Dropout(−1, 1, 128, 300)0
Linear(−1, 128, 128)16,512

Appendix B.5. The 1D-CNN Model

Table A7 presents the network structure and specific parameters of the 1D-CNN model.
Table A7. The network structure and specific parameters of the 1D-CNN.
ModuleLayer (Type)Output ShapeNumber of Parameters
InputInput Layer(−1, 1, 384)0
1D-CNNConv1d(−1, 64, 384)256
ReLU(−1, 64, 384)0
MaxPool1d(−1, 64, 192)0
Conv1d(−1, 32, 192)6176
ReLU(−1, 32, 192)0
MaxPool1d(−1, 32, 96)0
Conv1d(−1, 32, 96)3104
ReLU(−1, 32, 96)0
Flatten(−1, 3072)0
Linear(−1, 400)1,229,200
ReLU(−1, 400)0

References

  1. Shen, Y.; Yan, Z.; Yang, Y.; Tang, W.; Sun, J.; Zhang, Y. Application of UAV-Borne Visible-Infared Pushbroom Imaging Hyperspectral for Rice Yield Estimation Using Feature Selection Regression Methods. Sustainability 2024, 16, 632. [Google Scholar] [CrossRef]
  2. Yu, Y.; Jiang, Z.; Wang, G.; Kattel, G.R.; Chuai, X.; Shang, Y.; Zou, Y.; Miao, L. Disintegrating the impact of climate change on maize yield from human management practices in China. Agric. For. Meteorol. 2022, 327, 109235. [Google Scholar] [CrossRef]
  3. Yin, Y.; Chen, C.; Wang, Z.; Chang, J.; Guo, S.; Li, W.; Han, H.; Cai, Y.; Feng, Z. Research on Remote Sensing Monitoring of Key Indicators of Corn Growth Based on Double Red Edges. Agronomy 2025, 15, 447. [Google Scholar] [CrossRef]
  4. Guo, Y.; Xiao, Y.; Hao, F.; Zhang, X.; Chen, J.; de Beurs, K.; He, Y.; Fu, Y.H. Comparison of different machine learning algorithms for predicting maize grain yield using UAV-based hyperspectral images. Int. J. Appl. Earth Obs. Geoinf. 2023, 124, 103528. [Google Scholar] [CrossRef]
  5. Zhou, W.; Song, C.; Liu, C.; Fu, Q.; An, T.; Wang, Y.; Sun, X.; Wen, N.; Tang, H.; Wang, Q. A Prediction Model of Maize Field Yield Based on the Fusion of Multitemporal and Multimodal UAV Data: A Case Study in Northeast China. Remote Sens. 2023, 15, 3483. [Google Scholar] [CrossRef]
  6. Riefolo, C.; D’Andrea, L. A non-destructive approach in proximal sensing to assess the performance distribution of SPAD prediction models using hyperspectral analysis in apricot trees. Exp. Agric. 2024, 60, e25. [Google Scholar] [CrossRef]
  7. Li, J.; Xie, Y.; Liu, L.; Song, K.; Zhu, B. Long Short-Term Memory Neural Network with Attention Mechanism for Rice Yield Early Estimation in Qian Gorlos County, Northeast China. Agriculture 2025, 15, 231. [Google Scholar] [CrossRef]
  8. Pan, W.; Cheng, X.; Du, R.; Zhu, X.; Guo, W. Detection of chlorophyll content based on optical properties of maize leaves. Spectrochim. Acta Part A Mol. Biomol. Spectrosc. 2024, 309, 123843. [Google Scholar]
  9. Liu, Q.; Hu, X.; Zhang, Y.; Shi, L.; Yang, W.; Yang, Y.; Zhang, R.; Zhang, D.; Miao, Z.; Wang, Y.; et al. Improving maize water stress diagnosis accuracy by integrating multimodal UAVs data and leaf area index inversion model. Agric. Water Manag. 2025, 312, 109407. [Google Scholar] [CrossRef]
  10. Huang, X.; Lin, D.; Mao, X.; Zhao, Y. Multi-source data fusion for estimating maize leaf area index over the whole growing season under different mulching and irrigation conditions. Field Crop. Res. 2023, 303, 109111. [Google Scholar] [CrossRef]
  11. Huang, X.; Guan, H.; Bo, L.; Xu, Z.; Mao, X. Hyperspectral proximal sensing of leaf chlorophyll content of spring maize based on a hybrid of physically based modelling and ensemble stacking. Comput. Electron. Agric. 2023, 208, 107745. [Google Scholar] [CrossRef]
  12. Li, W.; Pan, K.; Liu, W.; Xiao, W.; Ni, S.; Shi, P.; Chen, X.; Li, T. Monitoring maize canopy chlorophyll content throughout the growth stages based on UAV MS and RGB feature fusion. Agriculture 2024, 14, 1265. [Google Scholar] [CrossRef]
  13. Feng, Z.; Guan, H.; Yang, T.; He, L.; Duan, J.; Song, L.; Wang, C.; Feng, W. Estimating the canopy chlorophyll content of winter wheat under nitrogen deficiency and powdery mildew stress using machine learning. Comput. Electron. Agric. 2023, 211, 107989. [Google Scholar] [CrossRef]
  14. Zhang, J.; Wei, X.; Song, Z.; Chen, Z.; Jin, J. A high-precision spatial and spectral imaging solution for accurate corn nitrogen content level prediction at early vegetative growth stages. Comput. Electron. Agric. 2025, 230, 109940. [Google Scholar] [CrossRef]
  15. Trenz, J.; Memic, E.; Batchelor, W.D.; Graeff-Hönninger, S. Generic optimization approach of soil hydraulic parameters for site-specific model applications. Precis. Agric. 2024, 25, 654–680. [Google Scholar] [CrossRef]
  16. Dhaliwal, D.S.; Williams, M.M. Sweet corn yield prediction using machine learning models and field-level data. Precis. Agric. 2024, 25, 51–64. [Google Scholar] [CrossRef]
  17. Mia, M.S.; Tanabe, R.; Habibi, L.N.; Hashimoto, N.; Homma, K.; Maki, M.; Matsui, T.; Tanaka, T.S. Multimodal deep learning for rice yield prediction using UAV-based multispectral imagery and weather data. Remote Sens. 2023, 15, 2511. [Google Scholar] [CrossRef]
  18. Zhao, J.; Pan, F.; Xiao, X.; Hu, L.; Wang, X.; Yan, Y.; Zhang, S.; Tian, B.; Yu, H.; Lan, Y. Summer maize growth estimation based on near-surface multi-source data. Agronomy 2023, 13, 532. [Google Scholar] [CrossRef]
  19. Liu, F.; Jiang, X.; Wu, Z. Attention mechanism-combined LSTM for grain yield prediction in China using multi-source satellite imagery. Sustainability 2023, 15, 9210. [Google Scholar] [CrossRef]
  20. Shamsuddin, D.; Danilevicz, M.F.; Al-Mamun, H.A.; Bennamoun, M.; Edwards, D. Multimodal Deep Learning Integration of Image, Weather, and Phenotypic Data Under Temporal Effects for Early Prediction of Maize Yield. Remote Sens. 2024, 16, 4043. [Google Scholar] [CrossRef]
  21. Aviles Toledo, C.; Crawford, M.M.; Tuinstra, M.R. Integrating multi-modal remote sensing, deep learning, and attention mechanisms for yield prediction in plant breeding experiments. Front. Plant Sci. 2024, 15, 1408047. [Google Scholar] [CrossRef]
  22. Ma, J.; Chen, P.; Wang, L. A comparison of different data fusion strategies’ effects on maize leaf area index prediction using multisource data from unmanned aerial vehicles (UAVs). Drones 2023, 7, 605. [Google Scholar] [CrossRef]
  23. Mena, F.; Pathak, D.; Najjar, H.; Sanchez, C.; Helber, P.; Bischke, B.; Habelitz, P.; Miranda, M.; Siddamsetty, J.; Nuske, M.; et al. Adaptive fusion of multi-modal remote sensing data for optimal sub-field crop yield prediction. Remote Sens. Environ. 2025, 318, 114547. [Google Scholar]
  24. Jácome Galarza, L.; Realpe, M.; Vi nán-Lude na, M.S.; Calderón, M.F.; Jaramillo, S. AgriTransformer: A Transformer-Based Model with Attention Mechanisms for Enhanced Multimodal Crop Yield Prediction. Electronics 2025, 14, 2466. [Google Scholar] [CrossRef]
  25. Sarkar, S.; Leyton, J.M.O.; Noa-Yarasca, E.; Adhikari, K.; Hajda, C.B.; Smith, D.R. Integrating Remote Sensing and Soil Features for Enhanced Machine Learning-Based Corn Yield Prediction in the Southern US. Sensors 2025, 25, 543. [Google Scholar] [CrossRef]
  26. Ma, W.; Han, W.; Zhang, H.; Cui, X.; Zhai, X.; Zhang, L.; Shao, G.; Niu, Y.; Huang, S. UAV multispectral remote sensing for the estimation of SPAD values at various growth stages of maize under different irrigation levels. Comput. Electron. Agric. 2024, 227, 109566. [Google Scholar] [CrossRef]
  27. Al Siam, A.; Salehin, M.M.; Alam, M.S.; Ahamed, S.; Islam, M.H.; Rahman, A. Paddy seed viability prediction based on feature fusion of color and hyperspectral image with multivariate analysis. Heliyon 2024, 10. [Google Scholar] [CrossRef] [PubMed]
  28. Jiang, Y.; Zhang, D.; Yang, L.; Cui, T.; He, X.; Wu, D.; Dong, J.; Li, C.; Xing, S. Design and experiment of non-destructive testing system for moisture content of in situ maize ear kernels based on VIS-NIR. J. Food Compos. Anal. 2024, 133, 106369. [Google Scholar] [CrossRef]
  29. Wang, P.; Xiong, Y.; Zhang, H. Maize leaf disease recognition based on improved MSRCR and OSCRNet. Crop Prot. 2024, 183, 106757. [Google Scholar] [CrossRef]
  30. Hu, W.; Huang, Y.; Wei, L.; Zhang, F.; Li, H. Deep convolutional neural networks for hyperspectral image classification. J. Sensors 2015, 2015, 258619. [Google Scholar] [CrossRef]
  31. Chen, C.F.R.; Fan, Q.; Panda, R. Crossvit: Cross-attention multi-scale vision transformer for image classification. In Proceedings of the IEEE/CVF International Conference on Computer Vision, Montreal, QC, Canada, 10–17 October 2021; pp. 357–366. [Google Scholar]
  32. Shen, J.; Chen, Y.; Liu, Y.; Zuo, X.; Fan, H.; Yang, W. ICAFusion: Iterative cross-attention guided feature fusion for multispectral object detection. Pattern Recognit. 2024, 145, 109913. [Google Scholar] [CrossRef]
  33. Hu, H.; Mei, Y.; Wei, Y.; Xu, Z.; Zhao, Y.; Xu, H.; Mao, X.; Huang, L. Chemical composition prediction in goji (Lycium barbarum) using hyperspectral imaging and multi-task 1DCNN with attention mechanism. LWT 2024, 204, 116436. [Google Scholar] [CrossRef]
  34. Han, Y.; Wang, K.; Yang, F.; Pan, S.; Liu, Z.; Zhang, Q.; Zhang, Q. Prediction of maize cultivar yield based on machine learning algorithms for precise promotion and planting. Agric. For. Meteorol. 2024, 355, 110123. [Google Scholar] [CrossRef]
  35. Bao, J.; Yu, M.; Li, J.; Wang, G.; Tang, Z.; Zhi, J. Determination of leaf nitrogen content in apple and jujube by near-infrared spectroscopy. Sci. Rep. 2024, 14, 20884. [Google Scholar] [CrossRef]
  36. Yang, Y.; Sun, R.; Li, H.; Qin, Y.; Zhang, Q.; Lv, P.; Pan, Q. Lightweight deep learning algorithm for real-time wheat flour quality detection via NIR spectroscopy. Spectrochim. Acta Part A Mol. Biomol. Spectrosc. 2025, 330, 125653. [Google Scholar] [CrossRef]
  37. Chen, Z.; Wang, X.; Qiao, S.; Liu, H.; Shi, M.; Chen, X.; Jiang, H.; Zou, H. A Leaf Chlorophyll Content Estimation Method for Populus deltoides (Populus deltoides Marshall) Using Ensembled Feature Selection Framework and Unmanned Aerial Vehicle Hyperspectral Data. Forests 2024, 15, 1971. [Google Scholar] [CrossRef]
  38. Ren, Y.; Li, Q.; Du, X.; Zhang, Y.; Wang, H.; Shi, G.; Wei, M. Analysis of corn yield prediction potential at various growth phases using a process-based model and deep learning. Plants 2023, 12, 446. [Google Scholar] [CrossRef]
  39. Yang, B.; Zhu, W.; Rezaei, E.E.; Li, J.; Sun, Z.; Zhang, J. The optimal phenological phase of maize for yield prediction with high-frequency UAV remote sensing. Remote Sens. 2022, 14, 1559. [Google Scholar] [CrossRef]
  40. Wang, Y.; Wang, S.; Yuan, Y.; Li, X.; Bai, R.; Wan, X.; Nan, T.; Yang, J.; Huang, L. Fast prediction of diverse rare ginsenoside contents in Panax ginseng through hyperspectral imaging assisted with the temporal convolutional network-attention mechanism (TCNA) deep learning. Food Control 2024, 162, 110455. [Google Scholar] [CrossRef]
  41. Priyatikanto, R.; Lu, Y.; Dash, J.; Sheffield, J. Improving generalisability and transferability of machine-learning-based maize yield prediction model through domain adaptation. Agric. For. Meteorol. 2023, 341, 109652. [Google Scholar] [CrossRef]
  42. Baghdasaryan, L.; Melikbekyan, R.; Dolmajain, A.; Hobbs, J. Deep density estimation based on multi-spectral remote sensing data for in-field crop yield forecasting. In Proceedings of the IEEE/CVF Conference on Computer Vision and Pattern Recognition, New Orleans, LA, USA, 18–24 June 2022; pp. 2014–2023. [Google Scholar]
  43. Vong, C.N.; Conway, L.S.; Zhou, J.; Kitchen, N.R.; Sudduth, K.A. Corn Emergence Uniformity at Different Planting Depths and Yield Estimation Using UAV Imagery. In Proceedings of the 2022 ASABE Annual International Meeting. American Society of Agricultural and Biological Engineers, Houston, TX, USA, 17–20 July 2022; p. 1. [Google Scholar]
  44. Huangfu, Y.; Chen, H.; Huang, Z.; Li, W.; Shi, J.; Yang, L. Research on a Panoramic Image Stitching Method for Images of Corn Ears, Based on Video Streaming. Agronomy 2024, 14, 2884. [Google Scholar] [CrossRef]
  45. Zhang, Y.; Han, W.; Zhang, H.; Niu, X.; Shao, G. Evaluating soil moisture content under maize coverage using UAV multimodal data by machine learning algorithms. J. Hydrol. 2023, 617, 129086. [Google Scholar] [CrossRef]
  46. Pan, Y.; Wu, N.; Jin, W. Multimodal Feature Disentangle–Fusion Network for Hyperspectral and LiDAR Data Classification. IEEE Geosci. Remote Sens. Lett. 2024, 21, 5510905. [Google Scholar] [CrossRef]
  47. Sun, G.; Zhang, Y.; Chen, H.; Wang, L.; Li, M.; Sun, X.; Fei, S.; Xiao, S.; Yan, L.; Li, Y.; et al. Improving soybean yield prediction by integrating UAV nadir and cross-circling oblique imaging. Eur. J. Agron. 2024, 155, 127134. [Google Scholar] [CrossRef]
  48. Xu, K.; Wang, B.; Zhu, Z.; Jia, Z.; Fan, C. A Contrastive Learning Enhanced Adaptive Multimodal Fusion Network for Hyperspectral and LiDAR Data Classification. IEEE Trans. Geosci. Remote Sens. 2024, 63, 4700319. [Google Scholar]
  49. Gao, W.; Zhang, Y.; Akoudad, Y.; Chen, J. MSSF-Net: A Multimodal Spectral-Spatial Feature Fusion Network for Hyperspectral Unmixing. IEEE Trans. Geosci. Remote Sens. 2025, 63, 5511515. [Google Scholar]
  50. Wei, L.; Yang, H.; Niu, Y.; Zhang, Y.; Xu, L.; Chai, X. Wheat biomass, yield, and straw-grain ratio estimation from multi-temporal UAV-based RGB and multispectral images. Biosyst. Eng. 2023, 234, 187–205. [Google Scholar] [CrossRef]
  51. Zhou, L.; Zhang, Y.; Chen, H.; Sun, G.; Wang, L.; Li, M.; Sun, X.; Feng, P.; Yan, L.; Qiu, L.; et al. Soybean yield estimation and lodging classification based on UAV multi-source data and self-supervised contrastive learning. Comput. Electron. Agric. 2025, 230, 109822. [Google Scholar] [CrossRef]
  52. Fan, Y.; Qian, Y.; Gong, W.; Chu, Z.; Qin, Y.; Muhetaer, P. Multi-level interactive fusion network based on adversarial learning for fusion classification of hyperspectral and LiDAR data. Expert Syst. Appl. 2024, 257, 125132. [Google Scholar] [CrossRef]
  53. Zhu, F.; Shi, C.; Shi, K.; Wang, L. Joint Classification of Hyperspectral and LiDAR Data Using Hierarchical Multi-Modal Feature Aggregation Based Multi-Head Axial Attention Transformer. IEEE Trans. Geosci. Remote Sens. 2025, 63, 5503817. [Google Scholar]
  54. Zhang, L.; Sun, B.; Zhao, D.; Shan, C.; Wang, B.; Wang, G.; Song, C.; Chen, P.; Lan, Y. Improved estimation of cotton (Gossypium hirsutum L.) LAI from multispectral data using UAV point cloud data. Ind. Crop. Prod. 2024, 217, 118851. [Google Scholar] [CrossRef]
  55. Fei, S.; Hassan, M.A.; Xiao, Y.; Su, X.; Chen, Z.; Cheng, Q.; Duan, F.; Chen, R.; Ma, Y. UAV-based multi-sensor data fusion and machine learning algorithm for yield prediction in wheat. Precis. Agric. 2023, 24, 187–212. [Google Scholar] [CrossRef]
  56. Weilandt, F.; Behling, R.; Goncalves, R.; Madadi, A.; Richter, L.; Sanona, T.; Spengler, D.; Welsch, J. Early crop classification via multi-modal satellite data fusion and temporal attention. Remote Sens. 2023, 15, 799. [Google Scholar] [CrossRef]
  57. Li, L.; Liu, L.; Peng, Y.; Su, Y.; Hu, Y.; Zou, R. Integration of multimodal data for large-scale rapid agricultural land evaluation using machine learning and deep learning approaches. Geoderma 2023, 439, 116696. [Google Scholar] [CrossRef]
  58. Wang, H.; Cheng, Y.; Liu, X.; Wang, X. Reinforcement learning based Markov edge decoupled fusion network for fusion classification of hyperspectral and LiDAR. IEEE Trans. Multimed. 2024, 26, 7174–7187. [Google Scholar] [CrossRef]
  59. Ma, J.; Liu, B.; Ji, L.; Zhu, Z.; Wu, Y.; Jiao, W. Field-scale yield prediction of winter wheat under different irrigation regimes based on dynamic fusion of multimodal UAV imagery. Int. J. Appl. Earth Obs. Geoinf. 2023, 118, 103292. [Google Scholar] [CrossRef]
  60. Zhang, Y.; Yang, Y.; Zhang, Q.; Duan, R.; Liu, J.; Qin, Y.; Wang, X. Toward multi-stage phenotyping of soybean with multimodal UAV sensor data: A comparison of machine learning approaches for leaf area index estimation. Remote Sens. 2022, 15, 7. [Google Scholar] [CrossRef]
  61. Bheemanahalli, R.; Vennam, R.R.; Ramamoorthy, P.; Reddy, K.R. Effects of post-flowering heat and drought stresses on physiology, yield, and quality in maize (Zea mays L.). Plant Stress 2022, 6, 100106. [Google Scholar] [CrossRef]
  62. Guo, Y.; Zhang, X.; Chen, S.; Wang, H.; Jayavelu, S.; Cammarano, D.; Fu, Y. Integrated UAV-based multi-source data for predicting maize grain yield using machine learning approaches. Remote Sens. 2022, 14, 6290. [Google Scholar] [CrossRef]
  63. Kumar, C.; Mubvumba, P.; Huang, Y.; Dhillon, J.; Reddy, K. Multi-stage corn yield prediction using high-resolution UAV multispectral data and machine learning models. Agronomy 2023, 13, 1277. [Google Scholar] [CrossRef]
  64. Nile, W.; Rina, S.; Mula, N.; Ersi, C.; Bao, Y.; Zhang, J.; Tong, Z.; Liu, X.; Zhao, C. Inversion of Leaf Chlorophyll Content in Different Growth Periods of Maize Based on Multi-Source Data from “Sky–Space–Ground”. Remote Sens. 2025, 17, 572. [Google Scholar] [CrossRef]
  65. Sunoj, S.; Cho, J.; Guinness, J.; van Aardt, J.; Czymmek, K.J.; Ketterings, Q.M. Corn grain yield prediction and mapping from Unmanned Aerial System (UAS) multispectral imagery. Remote Sens. 2021, 13, 3948. [Google Scholar] [CrossRef]
  66. Fan, J.; Zhou, J.; Wang, B.; de Leon, N.; Kaeppler, S.M.; Lima, D.C.; Zhang, Z. Estimation of maize yield and flowering time using multi-temporal UAV-based hyperspectral data. Remote Sens. 2022, 14, 3052. [Google Scholar] [CrossRef]
  67. Yan, Z.; Yang, S.; Lin, C.; Yan, J.; Liu, M.; Tang, S.; Jia, W.; Liu, J.; Huanhuan, L. Advances in plant oxygen sensing: Endogenous and exogenous mechanisms. J. Genet. Genom. 2024, 52, 615–627. [Google Scholar] [CrossRef] [PubMed]
  68. Barzin, R.; Pathak, R.; Lotfi, H.; Varco, J.; Bora, G.C. Use of UAS multispectral imagery at different physiological stages for yield prediction and input resource optimization in corn. Remote Sens. 2020, 12, 2392. [Google Scholar] [CrossRef]
  69. Danilevicz, M.F.; Bayer, P.E.; Boussaid, F.; Bennamoun, M.; Edwards, D. Maize yield prediction at an early developmental stage using multispectral images and genotype data for preliminary hybrid selection. Remote Sens. 2021, 13, 3976. [Google Scholar] [CrossRef]
Figure 1. Geographic distribution of maize sampling areas.
Agronomy 15 02199 g001
Figure 2. Hyperspectral images of maize leaves at different growth stages. (a) V6 stage. (b) VT stage. (c) R3 stage. (d) R6 stage.
Agronomy 15 02199 g002
Figure 3. Hyperspectral images of corresponding root-zone soils at different growth stages. (a) V6 stage. (b) VT stage. (c) R3 stage. (d) R6 stage.
Agronomy 15 02199 g003
Figure 4. Distribution histograms of LCC and LNC in maize leaf samples. (a) LCC distribution histogram. (b) LNC distribution histogram.
Agronomy 15 02199 g004
Figure 5. Comparison of raw and Z-Score-normalized spectral reflectance of leaf samples. (a) Raw leaf spectral curves. (b) Z-Score-normalized leaf spectral curves.
Agronomy 15 02199 g005
Figure 6. Comparison of raw and Z-Score-normalized spectral reflectance of soil samples. (a) Raw soil spectral curves. (b) Z-Score-normalized soil spectral curves.
Agronomy 15 02199 g006
Figure 7. Overall architecture of the CA-MFFNet model.
Agronomy 15 02199 g007
Figure 8. DWT-based decomposition of maize leaf spectral features. (a) Leaf low-frequency features. (b) Leaf high-frequency features.
Agronomy 15 02199 g008
Figure 9. Leaf spectral branch.
Agronomy 15 02199 g009
Figure 10. SFE architecture diagram.
Agronomy 15 02199 g010
Figure 11. Soil spectral branch.
Agronomy 15 02199 g011
Figure 12. Biochemical parameter branch.
Agronomy 15 02199 g012
Figure 13. Cross-attention feature fusion module.
Agronomy 15 02199 g013
Figure 14. Yield prediction module.
Agronomy 15 02199 g014
Figure 15. Detailed structure of the 1D-CNN model.
Agronomy 15 02199 g015
Figure 16. Technical roadmap of the yield prediction model based on CA-MFFNet.
Agronomy 15 02199 g016
Figure 17. Scatter plot of maize yield predicted by the CA-MFFNet model.
Agronomy 15 02199 g017
Figure 18. Comparison between predicted and actual maize yields.
Agronomy 15 02199 g018
Figure 19. Comparison of yield prediction results from different growth stages.
Agronomy 15 02199 g019
Figure 20. Comparative analysis of traditional prediction model performance. (a) Maize yield prediction results based on the LR model. (b) Maize yield prediction results based on the SVR model. (c) Maize yield prediction results based on the PLSR model.
Agronomy 15 02199 g020
Figure 21. Comparative analysis of baseline model performance. (a) Maize yield prediction results based on the RF model. (b) Maize yield prediction results based on the XGBoost model. (c) Maize yield prediction results based on the Elastic Net model.
Agronomy 15 02199 g021
Figure 22. Comparative analysis of performance of latest prediction models. (a) Maize yield prediction results based on TCNA model. (b) Maize yield prediction results based on Multi-task 1DCNN model. (c) Maize yield prediction results based on CA-MFFNet model.
Agronomy 15 02199 g022
Figure 23. Attention mechanism ablation experiments in CA-MFFNet model. (a) Maize yield prediction results after removing both SAM and CAM. (b) Maize yield prediction results after removing only SAM. (c) Maize yield prediction results after removing only CAM.
Agronomy 15 02199 g023
Figure 24. Prediction performance comparison under different input strategies. (a) Yield prediction results using only leaf spectral data as input. (b) Yield prediction results using leaf and soil spectral data as input. (c) Yield prediction results using leaf spectral data and biochemical parameters as input.
Agronomy 15 02199 g024
Figure 25. Comparison of prediction performance using different preprocessing methods. (a) Yield prediction results processed with SG smoothing. (b) Yield prediction results processed with SNV. (c) Yield prediction results processed with Z-Score normalization.
Agronomy 15 02199 g025
Figure 26. Ablation experiment analysis of the leaf spectral branch in CA-MFFNet model. (a) Yield prediction results without standardized preprocessing. (b) Yield prediction results with DWT removed. (c) Yield prediction results with SFE removed.
Agronomy 15 02199 g026
Figure 27. Ablation experiment analysis of key modules in CA-MFFNet model. (a) Yield prediction results with SE removed from the soil spectral branch. (b) Yield prediction results with the cross-attention mechanism removed.
Agronomy 15 02199 g027
Table 1. Dataset partitioning and yield data statistics.
DatasetSample SizeMaximum
(g/plant)
Minimum
(g/plant)
Mean
(g/plant)
Standard
Deviation
Training2160305.275.3234.636.2
Test240305.275.3236.738.0
Table 2. Comparison of maize yield prediction results under different parameter conditions.
Learning RateBatch SizeEpochEvaluation Metrics
R2RMSERPDMAE
0.0001322000.86614.312.739.05
0.001322000.9518.684.505.28
0.01322000.60724.481.5918.12
0.001162000.93210.193.834.83
0.001322000.9518.684.505.28
0.001642000.92710.563.706.27
0.001321000.90811.823.307.66
0.001322000.9518.684.505.28
0.001323000.9439.304.204.76
Table 3. Model efficiency evaluation.
Evaluation CategoryParameter MetricParameter Value
Training EfficiencyTraining Epochs200 Epochs
OptimizerAdam
Learning Rate0.001
Batch Size32
Scheduler StrategyCosineAnnealingLR
Early Stopping Strategy30 Epochs (no improvement)
L2 Regularization Factor1 × 10 5
Total Training Time448.61 s
Average Time per Epoch2.25 s
Inference EfficiencyInference Time (per sample)1.4 milliseconds
Model ComplexityTotal Parameters2,998,469
Trainable Parameters2,998,469
Input Data Size1651.66 MB
Table 4. Model performance metrics and 95% confidence intervals based on Bootstrap resampling (n = 1000).
MetricMeanLower Limit of 95% CIUpper Limit of 95% CI
R20.9510.9290.967
RMSE8.757.0010.15
MAE5.254.555.95
RPD4.563.765.47
Table 5. Analysis of error metrics by yield quantile group.
Yield GroupMAERMSE
Low-Yield Group5.939.52
Medium-Yield Group4.316.53
High-Yield Group5.609.50
Table 6. Ablation experiment results analysis based on different growth stages.
PeriodEvaluation Metrics
R2RMSERPDMAE
V60.86612.482.738.56
VT0.88111.772.907.31
R30.89911.373.157.17
R60.84914.182.579.81
V6 + VT + R3 + R60.9518.684.505.28
Table 7. The quantitative results from these ablation experiments across different model variants.
MethodEvaluation Metrics
R2RMSERPDMAE
CA-MFFNet0.9518.684.505.28
LR0.65822.841.7114.38
SVR0.71320.931.8713.88
PLSR0.74619.671.9911.96
RF0.82416.37l2.398.85
XGBoost0.84015.642.5010.31
Elastic Net0.77018.752.0812.17
TCNA0.75319.422.0113.22
Multi-task 1DCNN0.82216.462.3710.32
Without SAM and CAM0.91411.443.427.17
Without SAM0.92610.663.675.78
Without CAM0.93210.193.835.71
Leaf as input0.67222.381.7513.71
Leaf and soil as input0.86214.512.699.15
Leaf and biochemical parameters as input0.91811.213.496.02
SG0.82316.442.3810.65
SNV0.90012.343.178.75
Z-Score (CA-MFFNet)0.9518.684.505.28
Without preprocessing0.73320.191.9410.83
Without DWT0.92310.813.616.78
Without SFE0.92111.013.555.74
Without SE0.93410.033.906.09
Without cross-attention0.93110.253.815.89
Disclaimer/Publisher’s Note: The statements, opinions and data contained in all publications are solely those of the individual author(s) and contributor(s) and not of MDPI and/or the editor(s). MDPI and/or the editor(s) disclaim responsibility for any injury to people or property resulting from any ideas, methods, instructions or products referred to in the content.