Article

Effects of Droughting Stress on Leaf Physiological Characteristics of Machilus thunbergii Seedlings

1
College of Forestry and Grassland, Nanjing Forestry University, Collaborative Innovation Centre of Sustainable Forestry in Southern China, 159 Longpan Road, Xuanwu District, Nanjing 210037, China
2
Shanghai Forestry General Station, No. 7, Lane 1053, Hutai Road, Jing’an District, Shanghai 200072, China
3
Shandong Provincial Center of Forest and Grass Germplasm Resources, No. 2011 Gangjiu Road, Licheng District, Jinan 250102, China
*
Authors to whom correspondence should be addressed.
These authors contributed equally to this work.
Agronomy 2025, 15(9), 2154; https://doi.org/10.3390/agronomy15092154
Submission received: 15 August 2025 / Revised: 5 September 2025 / Accepted: 5 September 2025 / Published: 9 September 2025
(This article belongs to the Section Plant-Crop Biology and Biochemistry)

Abstract

Machilus thunbergii Siebold & Zucc. is recognized as an excellent tree species for landscaping and shelter forest. Excessive drought can affect the changes of physiological and biochemical substances in plants. However, little is known at present regarding the drought stress of M. thunbergii seedlings. In this paper, matrix water content, the anatomical structure of leaves, relative water content of leaves, and physiological characteristics index of leaves under droughting stress were dynamically observed. Droughting stress led to the wilting of M. thunbergii leaves, gradual closure of stomata on leaf epidermis, increases in stomatal density, gradual loosening of leaf cell structure arrangement, a thickening in leaf palisade tissue, and reductions in spongy tissue. Droughting stress caused the relative water content of the cultivation substrate to decline, the cultivation substrate reached the moderate drought level, and the seedlings began to die. Droughting stress led to the destruction of activity and balance of the leaf protective enzyme system, excessive accumulation of free radicals, the destruction of enzyme structure and function, and the production of lipid peroxidation product MDA. Droughting stress reduced the relative water content of leaves as a whole, the content of osmotic adjustment substances proline and soluble protein continued to decline, and a large number of electrolyte leakage in cells, causing serious damage to seedlings.

1. Introduction

Drought refers to the phenomenon that there is less rainfall for a long time, resulting in excessive dry air and soil water deficit. It is also the main environmental factor limiting agricultural and forestry production in various abiotic stresses [1]. Plants exhibit optimal growth only within a suitable water supply range; when water availability falls below this threshold, growth is inhibited. But in the face of drought stress, plants will also adapt to the stress environment through their own regulation mechanism. The damage from drought stress to plants is multifaceted, including plant morphological damage, physiological metabolism disorder, cell structure disintegration, and so on [2]. Mild drought inhibited plant growth, while severe drought caused plant water loss and death. After drought stress, physiological and biochemical substances in plants also change dynamically [3]. Plant drought resistance refers to the adaptability of plants to drought stress and the recovery ability of plants after drought stress. Plant drought resistance can be divided into endurance drought and escape drought. Woody perennials generally possess greater drought resistance compared to herbaceous species. Therefore, it is of great significance to explore the drought resistance mechanism of different plants to resist drought stress [3].
Machilus thunbergii Siebold & Zucc. is an evergreen, medium-sized tree. It has the advantages of beautiful tree shape, strong wind resistance, and high ornamental value. It is an ideal tree species for landscaping and forest protection [4]. At present, research on M. thunbergii mainly focuses on population distribution [5], propagation and cultivation [6], and utilization of medicinal value [7,8]. M. thunbergii is the main constructive species or companion species of evergreen broad-leaved forest in subtropical and warm temperate regions. It is a top forest tree species in the region. It thrives in a warm and humid climate, can tolerate −10 °C short-term low temperature, and grows best in fertile and moist neutral or slightly acidic soil [9]. Seedlings are typically collected in summer, with seeds prepared by removing the skin and stratified in moist sand for germination. When the seed germination rate exceeds 50%, it can be sown in the nursery, covered with black film, and the emergence rate can reach more than 70% [9]. The root system of M. thunbergii seedlings cultivated in root control container grew faster, the root system’s ability to absorb water and nutrients increased, and the survival rate of seedlings increased [6]. However, there are few literature reports on drought stress of M. thunbergii seedlings. In this study, 2-year-old M. thunbergii seedlings were used as the research materials. M. Thunbergii is affected by soil drought and resists drought through self-regulation, making physiological research on its drought resistance important. The physiological response changes of seedlings during drought treatment were compared and analyzed by simulating the drought stress treatment on the cultivation substrate. At the same time, the effects of drought stress on the leaf structure of seedlings were observed, and the drought resistance mechanism of M. thunbergii seedlings was explored, in order to provide basic information for water management and tree species promotion and application in the cultivation process of M. thunbergii seedlings.

2. Materials and Methods

2.1. Plant Materials

The seedlings used in the experiment were 2-year-old container seedlings of M. thunbergii which were collected from the wild population of M. thunbergii in Sheshan Island, Shanghai. On 21 March 2021, 210 seedlings with good growth and relatively consistent growth were selected and transplanted into plastic containers (container specification: height 20.5 cm, upper diameter 24.5 cm, lower diameter 18 cm). The cultivation substrate produced by Zhenjiang Xingnong organic fertilizer Co., Ltd., Zhenjiang, China, was selected as the cultivation substrate (the substrate was a mixture of organic carbon soil, perlite, vermiculite, etc.; the content of nitrogen, phosphorus, and potassium in the substrate was 5.36 mg·kg−1; the content of organic matter was 463 g·kg−1; and the content of humic acid was 130 μg·kg−1). One seedling was planted in each container and placed in Baima Town, Lishui District, Nanjing-Baima base of Nanjing Forestry University. Seedlings were established outdoors, and water management was according to conventional seedling cultivation. On 1 July 2021, the test seedlings were transferred to the greenhouse of Baima base to continue their growth and maintain suitable substrate moisture.

2.2. Experimental Design

A randomized block design simulated continuous natural drought. On 16 August 2021, the substrates of all test seedlings were watered, and the substrates were dried after natural water loss. Treatments at 5 days, 10 days, 15 days, 20 days, 25 days, and 30 days after watering were set, respectively. The day of watering (0 days) was used as the blank control (CK), and 30 seedlings were treated for each treatment. After the watering was stopped, the morphological changes of seedlings were regularly observed, the survival of seedlings was counted, and the matrix samples and leaf samples were collected at 2:00–3:00 p.m. every time. Matrix samples were collected to determine the relative water content of the matrix. The complete mature leaves of the upper 2–3 layers of the seedlings were collected and immediately packaged in an ice box. Then, the samples were taken back to the laboratory and frozen in a −80 °C refrigerator for the determination of various physiological indexes.

2.3. Determination of Relative Moisture Content of Matrix

Determined by drying method. A 10 cm deep substrate was drilled with soil in the cultivation container, which was placed into an aluminum box. The wet weight of the substrate (m1) was quickly weighed and then put into a 105 °C oven to dry to a constant weight (m2). Each treatment was repeated three times.
Relative   moisture   content   of   matrix   ( % ) = m 1 m 2 m 1 × 100 %

2.4. Observation on Anatomical Structure of Leaves of M. thunbergii Seedlings

In the process of drought treatment, mature leaves with similar size were selected from the middle and upper parts of seedlings in each treatment with a cycle of 5 days. Leaf samples with a size of 5 mm × 3 mm were cut near the center of the leaves. The samples were stored in a 4 °C refrigerator with 70% formalin acetic acid and alcohol (FAA). The samples were dehydrated, made transparent, waxed, embedded, sectioned, attached to the slide, dewaxed, stained, and sealed to form a permanent slide. The sections were observed and photographed by Olympus BX53 optical microscope (Tokyo, Japan), and the leaf thickness, upper and lower epidermis thickness, palisade tissue thickness, and spongey tissue thickness were measured by Image Pro Plus 6.0 image analysis software. Three leaves were observed for each treatment, and five visual fields were observed for each leaf section. The index values were measured, and the average value was calculated.

2.5. Determination of Physiological Indexes

The relative water content of leaves was determined with reference to the dry weight method, the relative conductivity of leaves was determined with reference to the immersion method, the content of malondialdehyde (MDA) was determined by thiobarbituric acid method, the content of soluble protein was determined with the Coomassie brilliant blue method, the content of proline(Pro) was determined by acid ninhydrin method, the content of abscisic acid (ABA) was determined with an enzyme-linked immunosorbent assay, the activity of superoxide dismutase (SOD) was determined with nitrogen blue tetrazole photochemical reduction method, and the activity of peroxidase (POD) was determined with guaiacol colorimetry. The above index determination methods refer to the experimental guidance of plant physiology [10].

2.5.1. Relative Water Content of Leaves

The relative moisture content of seedling leaves was measured using freshly collected leaves. First, the fresh weight m1 of the leaves was measured. The weighed leaf sample was soaked in distilled water for 24 h. Then, the leaves were removed, the water was absorbed, and the leaves were immediately weighed. The leaves were then soaked in distilled water for a certain period of time to absorb the water and weighed until the two weights were the same to determine the saturated fresh weight m2 of the leaves. The sample was placed in an oven and heated to 105 °C for 30 min; the oven temperature was lowered to 80 °C, with drying continuing until reaching constant weight; and the dry weight m3 of the leaves was recorded. Each treatment was repeated three times.
Relative   water   content   ( % ) = m 1 m 3 m 2 m 3 × 100 %

2.5.2. Relative Electrical Conductivity

Each treated leaf was washed, cut it into pieces, and mixed evenly. A 0.3 g leaf sample was placed in a centrifuge tube. The leaf sample was fully immersed in 20 mL of deionized water, sealed, and left to stand for 48 h. The conductivity E1 of the extraction solution was measured using a conductivity meter. After all measurements were completed, it was placed in a boiling water bath for 20 min, cooled to room temperature, and measured for conductivity E2 using a conductivity meter. This process was repeated three times for each sample.
Relative   electrical   conductivity   ( % ) = E 1 E 2 × 100 %

2.5.3. MDA Content

We took 0.3 g (W) of cut and mixed leaves, added 6 mL (S) of 0.05 mol·L−1 pH 7.8 phosphate buffer, ground and poured it into a centrifuge tube, and centrifuged it for 20 min. The supernatant produced was a crude extract of MDA. A 2 mL quantity of the supernatant was placed in a test tube; 0.5% thiobarbituric acid (TBA) solution was added. The tube was mixed well; the stopper was applied, and the tube was immersed in boiling water for 20 min in a water bath. It was taken out and cooled in an ice water bath, then poured into a centrifuge tube and centrifuged for 15 min. A 2 mL of the supernatant (A) was taken. The optical density values of the supernatant were measured at wavelengths of 450 nm (A450), 532 nm (A532), and 600 nm (A600) using a spectrophotometer. As control, we added 2 mL of phosphate buffer solution and 2 mL of TBA solution without extraction solution, which were placed in a boiling water bath with the sample and centrifuged.
MDA   content   ( μ m o l · g 1 ) = [ 6.45 ( A 532 A 600 ) 0.56 A 450 ] × S × V A × W

2.5.4. Soluble Protein Content

A 0.1 g sample was homogenized with 5 mL distilled water (Vt), and the supernatant was collected after centrifugation. A 1 mL of supernatant (Vs) was mixed with 5 mL Coomassie Brilliant Blue G-250 reagent, and after complete reaction, the absorbance was measured at a wavelength of 595 nm. A standard curve was constructed using bovine serum albumin (BSA) as the standard, and the protein concentration (C) of the samples was calculated according to the standard curve.
Soluble   Protein   Content   ( m g · g 1 ) = C   ×   V T m   ×   V S   ×   1000

2.5.5. Pro Content

A series of standard Pro solutions with concentrations of 0–10 μg·mL−1 were prepared to construct a standard curve. A 0.3 g (W) sample was extracted with 6 mL extraction solution (V). A 2 mL quantity of standard solution or sample extract (A) was placed in a 20 mL centrifuge tube, and the following were added sequentially: 2 mL ice acetic acid, 4 mL 2.5% acidic ninhydrin reagent, and 2 mL 3% salicylaldehyde solution. The tubes were placed in a boiling water bath for color development and naturally cooled to room temperature, and then 4 mL toluene was added. After thorough shaking and extraction, the upper colored solution was taken for absorbance measurement at 520 nm. Pro content (C) was determined according to the standard curve.
Pro   content   ( μ g · g 1 ) = C × V A × W

2.5.6. ABA Content

Hormone extraction: 1 g of fresh leaves was weighed, 2 mL of 80% methanol was added for grinding, the mixture was centrifuged for 10 min, and 0.5 mL of methanol was added to the residue, which was centrifuged again; it was then combined with the supernatant, and the volume was recorded.
Hormone purification: 300 μL of supernatant was placed in a 5 mL centrifuge tube, dried with nitrogen, dissolved in 200 μL of 0.1 mol L−1 Na2HPO4 solution, added with equal volumes of ethyl acetate, vortexed, and extracted 3 times. The ethyl acetate phase was removed and the pH of the aqueous phase adjusted to 2.5, followed by extraction 3 times with 200 μL of ethyl acetate, merger with the ethyl acetate phase, and drying with nitrogen.
Methylation of hormones: We dissolved the dried sample in 200 μL of methanol solution, added excess diazomethane until the sample turned yellow, and after 10 min, added half a drop of 0.2 mol L−1 acetic acid methanol to destroy the excess diazomethane. The yellow color disappeared, nitrogen drying was continued, and 300 μL of 0.01 mol L−1 phosphate buffer (pH 7.4) was added to dissolve the sample. An enzyme-linked immunosorbent assay (ELISA) was used to measure the content of abscisic acid (ABA) in the sample.

2.5.7. The Activity of SOD

We took 0.3 g (W) of leaf sample and added 6 mL (V) of 0.05 mol L−1 phosphate-buffered saline (PBS) in three portions. It was then ground in an ice bath, poured into a 10 mL centrifuge tube, and centrifuged for 20 min. The resulting supernatant was the crude extract of SOD. We added 1.5 mL of 0.05 mol L−1 PBS, 0.3 mL of 130 mol L−1 Met, 0.3 mL of 750 µmol L−1 NBT solution, 0.3 mL of 100 µmol L−1 EDTA-Na2, 0.3 mL of 20 µmol L−1 riboflavin, 0.05 mL of enzyme solution (Vt), and 0.25 mL of distilled water in order. The control was a test tube replaced with no enzymes and phosphate-buffered solution, divided into dark control and light control. After adding the solution to the dark control tube, it was immediately covered with tin foil and stored in the dark. Both the dark control tube and the light control tube were set to 3 replicates. The light control tube was mixed with the enzyme solution measuring tube after adding the reagent and exposed to light in a 4000 Lux, 25 °C light incubator. After 20 min, the light tube was quickly wrapped with aluminum foil and the light reaction was terminated. The optical density value (AE) was measured at 560 nm wavelength using a spectrophotometer, with the dark control tube as the blank control. The optical density value (ACK) of the light control tube was also measured.
The   activity   of   SOD   ( U · g 1 ) = ( A C K A E ) × V 0.5 A C K × W × V t

2.5.8. The Activity of POD

We weighed 1 g (W) of leaf sample, placed it in a mortar, ground it into powder, then added 6 mL (Vt) PBS and ground it into a homogenate. After centrifuging for 15 min, the supernatant was transferred to a 100 mL volumetric flask, and the residue was extracted again with 5 mL PBS. The supernatant was transferred to the volumetric flask, made up to volume, and stored in a cool place for future use. We added 3.8 mL of 50 mmol·L−1 guaiacol solution, 0.1 mL of 3% hydrogen peroxide solution, and 0.1 mL of (Vs) supernatant to the centrifuge tube in sequence. Their optical density values were measured at 470 nm wavelength using a spectrophotometer, with readings taken every 10 s for three consecutive readings. The enzyme activity is expressed as one peroxidase activity unit (U) with a 0.01 change in A470 per minute.
The   activity   of   POD   ( U · g 1 · min 1 ) = A 470 × V t 0.01 W × V S × t

2.6. Data Analysis

Analysis of variance (ANOVA) and correlation analyses were performed using SPSS 26.0, and data visualization was made with Origin 2022.

3. Results and Analysis

3.1. Changes in Relative Water Content in Seedling Culture Substrate During Drought Treatment

The relative water content of substrate reflects the water supply of substrate to seedlings. It can be seen from Table 1 that the relative water content of the cultivation substrate showed a gradual downward trend during the whole drought treatment process, and the relative water content of the cultivation substrate was 71.13%, 65.42%, 56.87%, 50.66%, 33.85%, 17.64%, and 14.33%, respectively, on 0, 5, 10, 15, 20, 25, and 30 days after the substrate watering treatment was stopped. The relative water content difference in the substrate reached a very significant level during drought treatment (p < 0.01). The relative water content in the cultivation substrate was at a normal level within 10 days before the substrate stopped watering. From the 10th day to the 15th day after the substrate stopped watering, the relative water content of the cultivation substrate reached a mild drought level. On the 20th day after the substrate stopped watering, the relative water content of the cultivation substrate reached the moderate drought level. On the 25th day after the substrate stopped watering, the cultivation substrate was at a severe drought level.

3.2. Changes in Seedling Morphology and Mortality During Drought Treatment

As depicted in Figure 1, seedling leaves remained bright green and erect at day 5; by day 10, a few seedlings’ top leaves drooped; at day 15, most seedlings’ top leaves drooped, and a few seedlings’ leaves drooped from top to bottom, which began to show water shortage; by day 20, the cultivation substrate reached moderate drought, most seedlings’ leaves and tender stems wilted, the edges of leaves and tender stems began to shrink, and seedlings began to die; at day 25, the substrate had reached the level of severe drought, the seedling leaves had withered and fallen off, the leaves changed from green to brown, showing obvious symptoms of chlorosis, and the tender stems further shrunk; by day 30, most of the seedlings’ leaves fell off obviously, and some seedlings died completely. The mortality rate of seedlings reached 23.33%.

3.3. Changes in Leaf Structure of M. thunbergii Seedlings During Drought Treatment

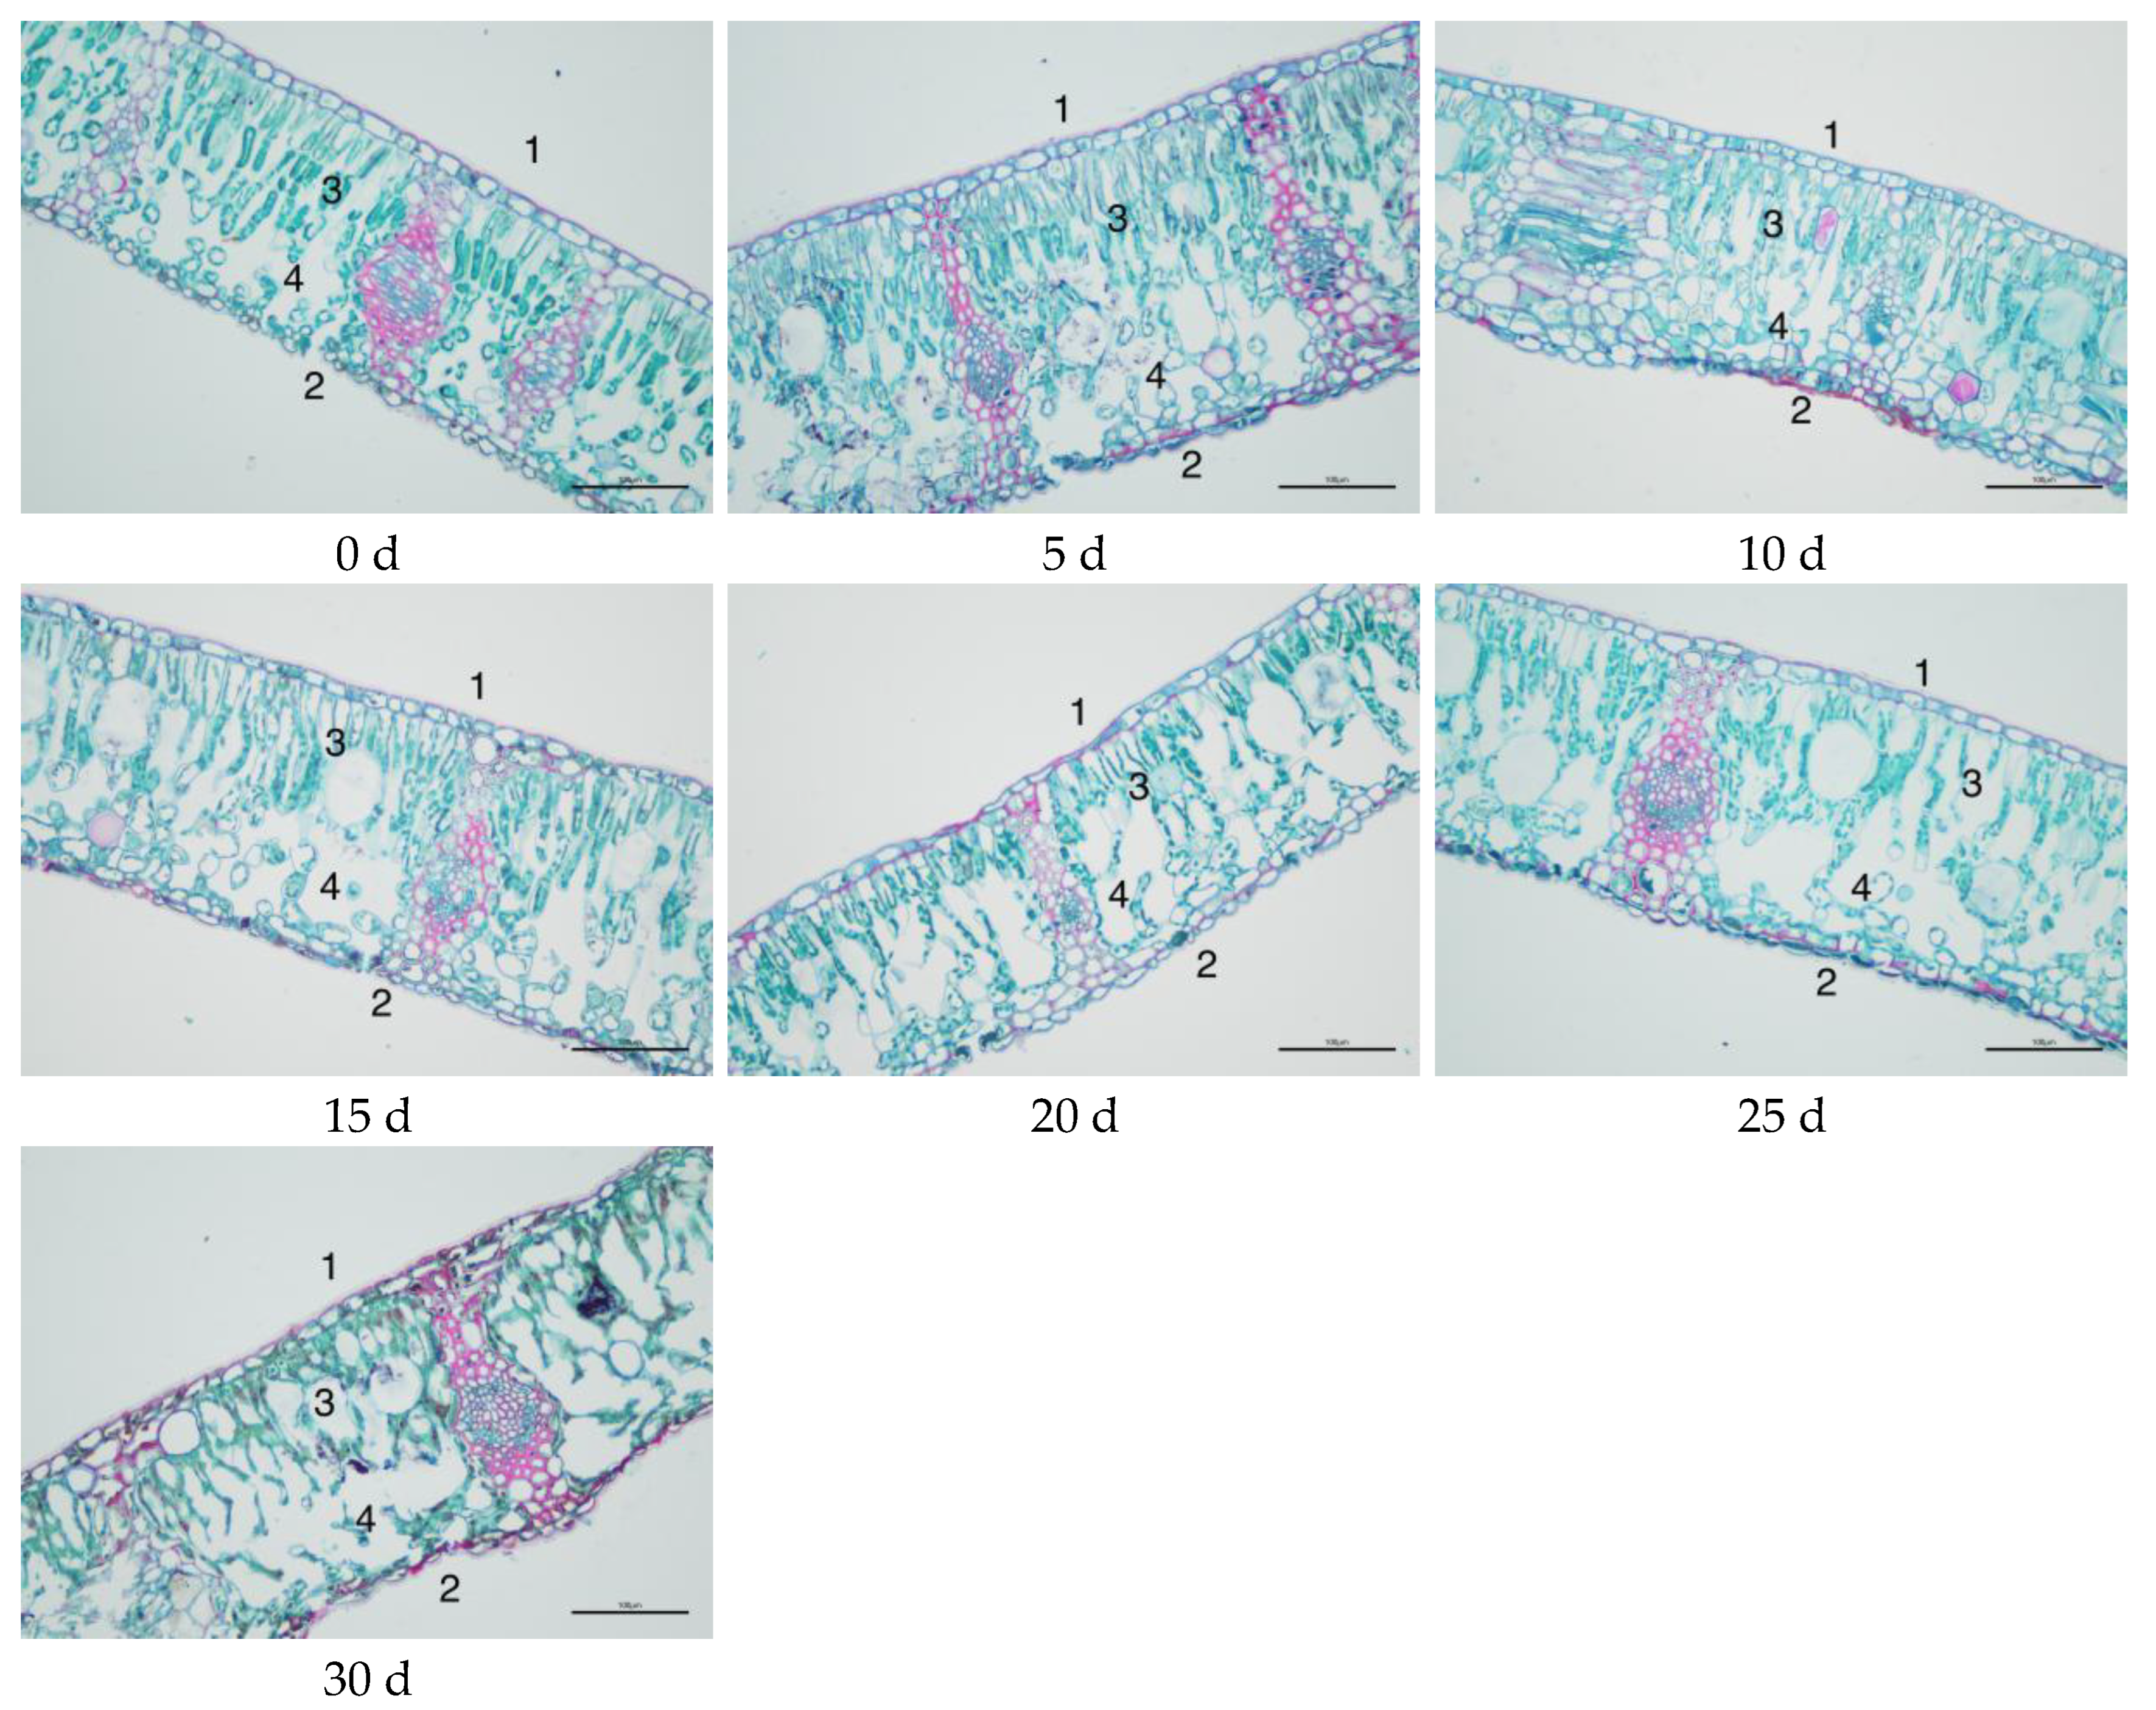
The leaf is the organ most exposed to drought stress, and also the most sensitive organ to stress. Leaf transpiration is the main way in which plants lose water, and its anatomical structure changes can reflect the adaptability of plants to drought stress [12,13]. The anatomical structure of plant leaves is generally composed of upper epidermis, palisade tissue, spongy tissue, lower epidermis, stomata, and veins. It can be seen from Figure 2 that the anatomical structure of the normal leaves of M. thunbergii seedlings is similar to that of most plants. The upper and lower epidermis of the leaves is each composed of one layer of cells, arranged neatly and tightly in a linear arrangement, and the cell volume of the upper epidermis is slightly larger than that of the lower epidermis. Palisade tissue is closely situated near the upper epidermis and consists of two or more layers of long columnar cells that are closely arranged in a palisade arrangement. Spongey tissue occurs near the lower epidermis, and its multi-layer cells are irregular, loosely scattered, and with many gaps. Stomata, located in the lower epidermis, consist of a pair of dumbbell-shaped guard cells, which are evenly distributed.
It can be seen from Table 2 that with the extension of drought stress time, the thickness of seedling leaves and upper and lower epidermis gradually decreased, the thickness of palisade tissue gradually increased, the thickness of sponge tissue gradually decreased, and the ratio of palisade to sponge tissue gradually increased. It can be seen from Table 3 that with the extension of drought treatment time, the difference between the thickness of epidermal cells on the leaves of M. thunbergii seedlings reached a significant level (0.01 < p < 0.05). It can be seen from Figure 2 that the upper epidermal cells of M. thunbergii seedlings showed a relatively full state from the 0th day to the 25th day of drought treatment. On the 30th day of drought treatment, the upper epidermis of leaves of M. thunbergii seedlings appeared inward bending due to excessive water deficit. The difference in thickness of the lower epidermis cells between different drought treatment times reached a very significant level (p < 0.01); the arrangement of the lower epidermis cells gradually changed from a regular state to a disordered state, and there were sunken folds. The overall structure and morphology were significantly affected by drought stress, and the stomata also began to close and blur gradually. At the end of drought treatment, the thickness of the lower epidermis cells of M. thunbergii decreased by 26.36% compared with the control value.
The difference in palisade tissue cell thickness among different drought treatment times reached a very significant level (p < 0.01), and its value increased rapidly from day 0 to day 30 of drought treatment. At day 30 of drought treatment, the palisade tissue thickness of leaves of M. thunbergii seedlings increased by 19.79% compared with that at the beginning of drought treatment. The difference in thickness of leaf sponge tissue cells among different treatments reached a very significant level (p < 0.01); from the 20th to 30th day of drought treatment, spongy tissue thickness decreased rapidly. At the end of drought treatment, the thickness of spongy tissue in leaves decreased by 28.66% compared with that at the beginning of drought treatment.
The difference in the ratio of palisade tissue to spongy tissue among the treatments reached a very significant level (p < 0.01). Palisade tissue provided mechanical support for the leaves, and spongy tissue stored a large amount of water. With the aggravation of drought, the leaves began to lose water gradually, the ratio of palisade tissue to spongy tissue in the leaves continued to decrease, and the water holding capacity of spongy tissue in the leaves also gradually decreased. It can be seen from the anatomical structure diagram of M. thunbergii leaves at the 30th day of drought treatment that the palisade tissue cells in the leaves were significantly reduced and damaged, which was consistent with the phenomenon that some seedlings of M. thunbergii died at the 30th day of drought treatment. The difference in leaf thickness of M. thunbergii seedlings among different treatments reached a very significant level (p < 0.01). With the extension of drought treatment time, the leaf thickness value gradually decreased. At 30 days of drought treatment, the leaf thickness of seedlings decreased by 12.56% compared with that at the beginning of the treatment.

3.4. Changes in Relative Water Content in Leaves of M. thunbergii Seedlings During Drought Treatment

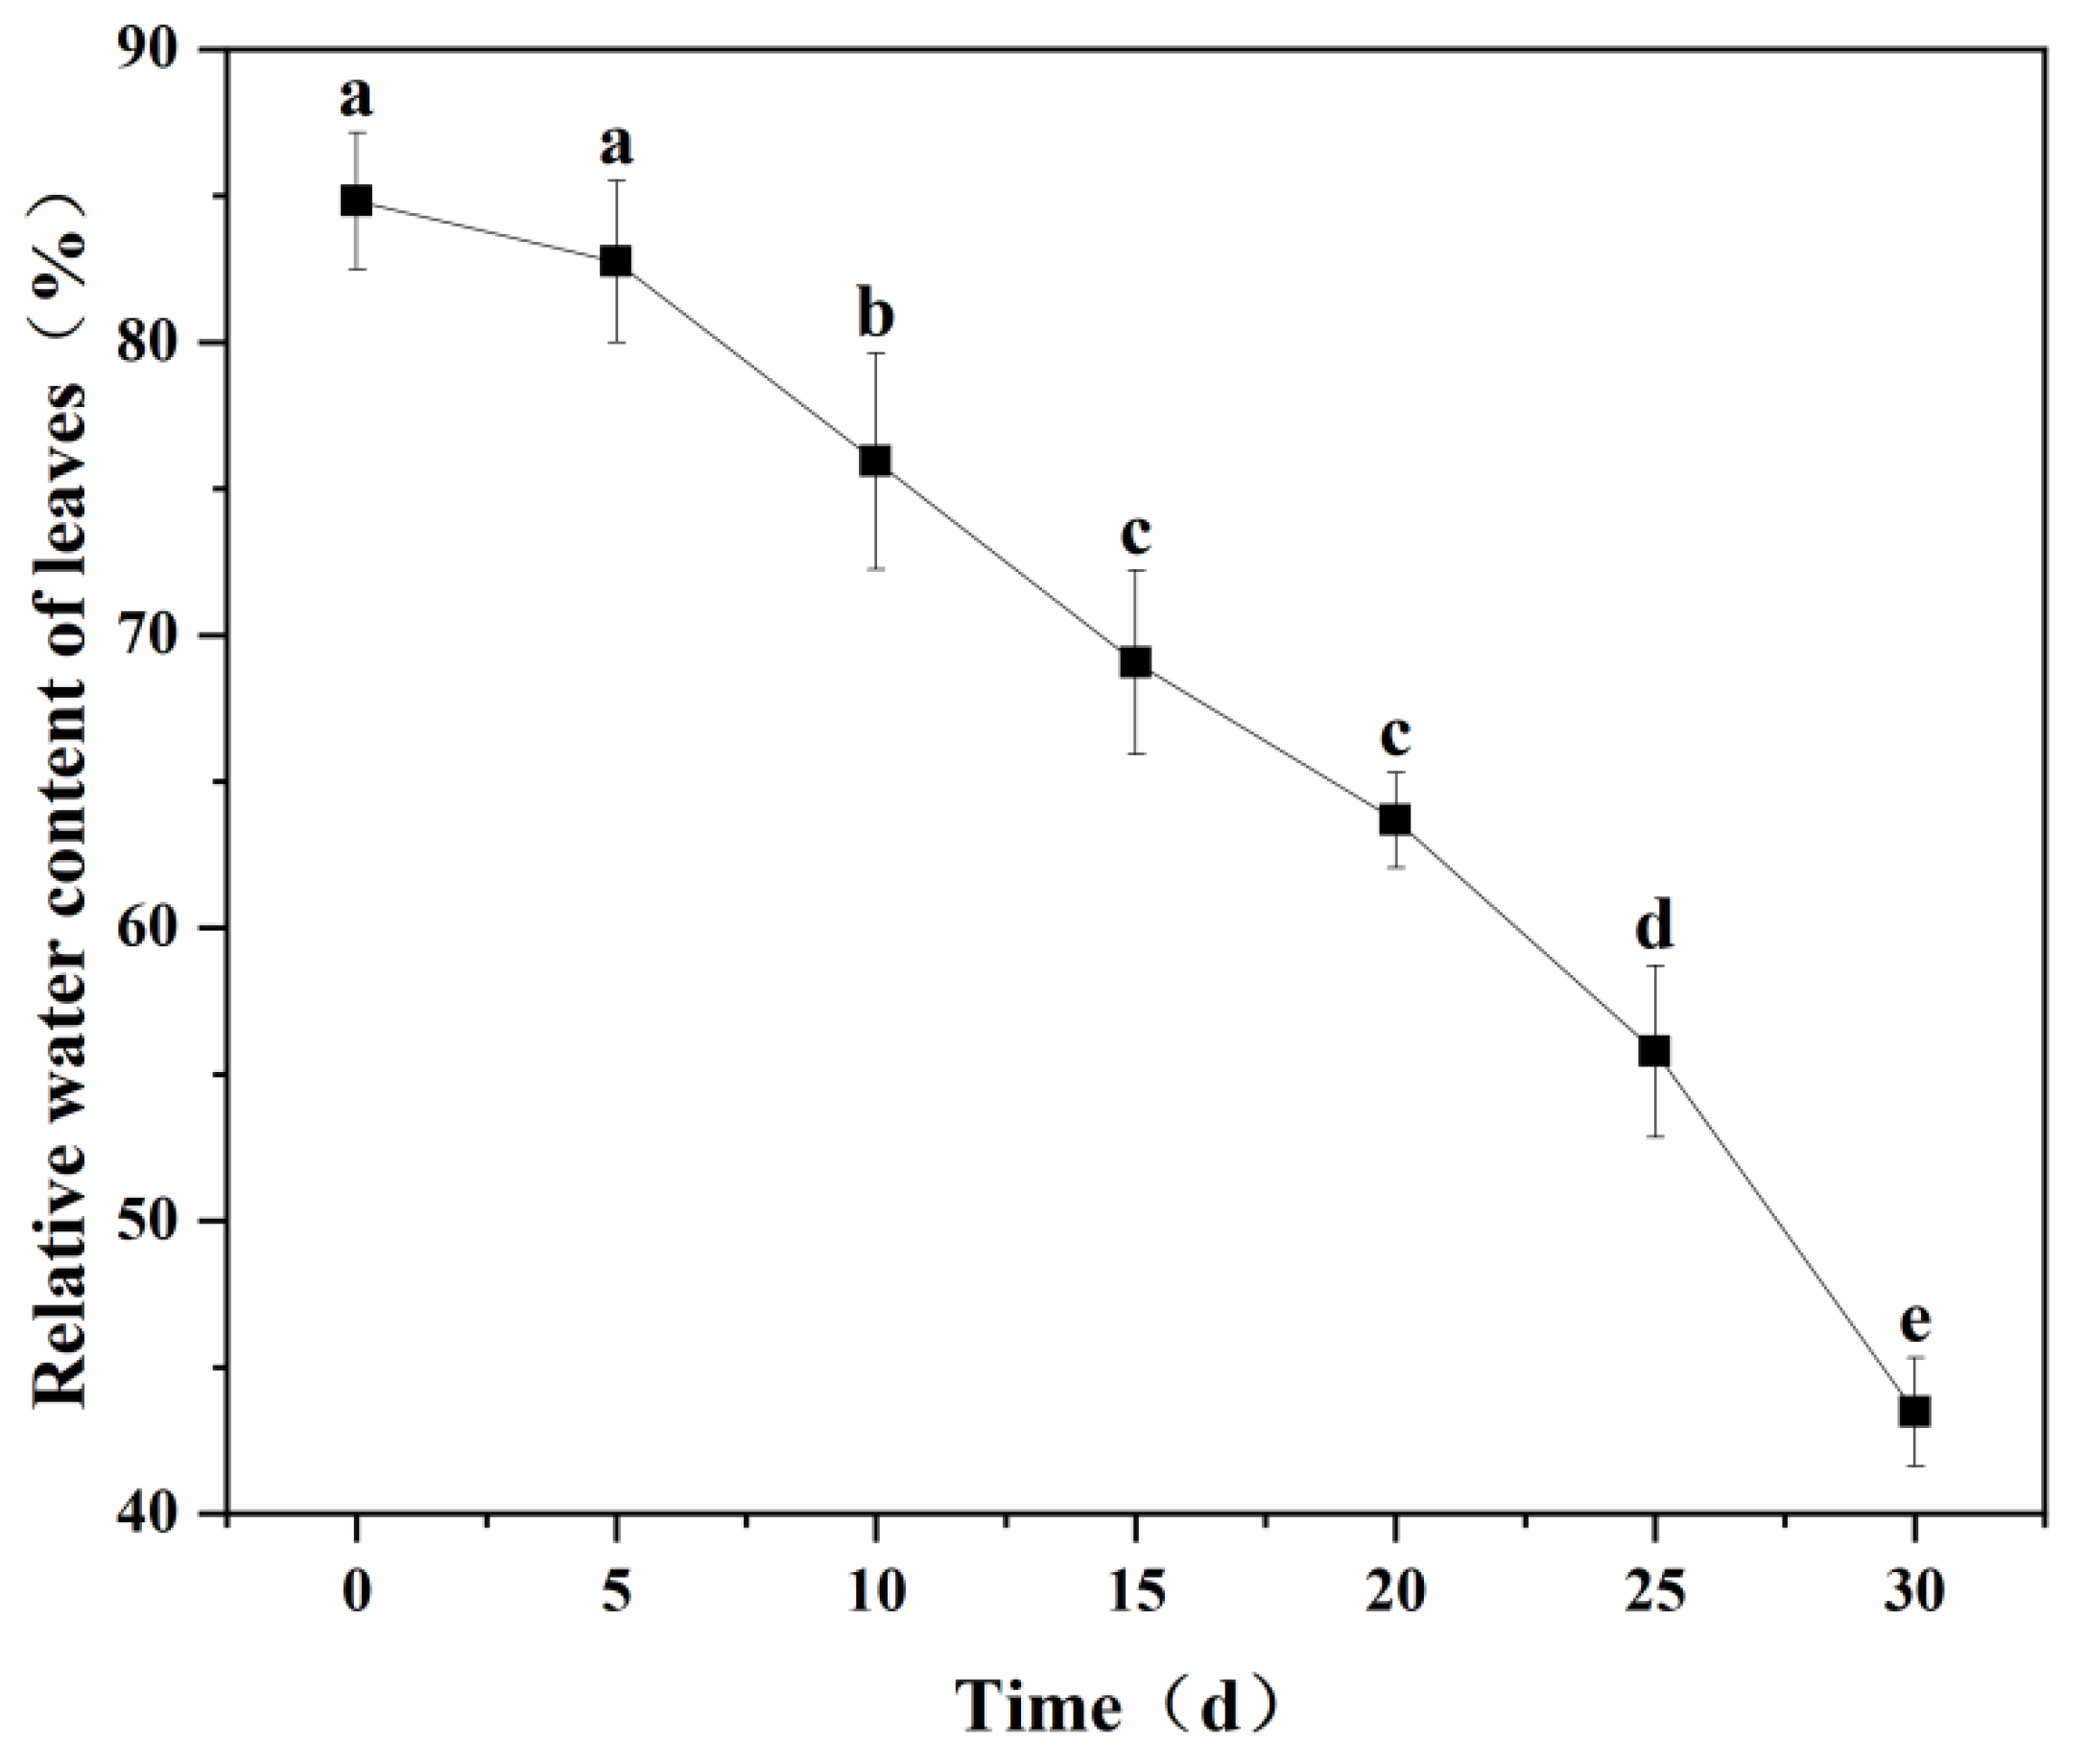
Leaf relative water content is a direct indicator of tissue hydration status [14,15]. It can be seen from Table 3 that the effect of drought treatment on the relative water content of leaves of M. thunbergii seedlings reached a very significant level (p < 0.01). It can be seen from Figure 3 that with the extension of drought treatment time, the relative water content of seedling leaves showed a continuous downward trend. At the end of drought treatment (30 days), the relative water content of leaves reached the lowest value, which was 48.75% lower than that at the beginning of drought treatment. In the early stage of drought treatment, the relative water content of leaves of M. thunbergii seedlings decreased slowly, and the leaves maintained a good hydrated state. In the late stage of drought treatment, due to the relatively low water content of the substrate, it was difficult to supply water to the aboveground part of seedlings, and the water holding capacity of leaves was also greatly reduced. At the end of drought treatment, some M. thunbergii seedlings even died due to severe water shortage.
Table 3. ANOVA results of physiological indexes of M. thunbergii seedlings.
IndexSum of SquaresDegree of FreedomMean SquareF Valuep Value
Relative water content of leaves4001.8556666.97691.022 **0.00
Relative conductivity3137.47220434.62911.487 **0.00
MDA content8.02520202.846202.846 **0.00
Soluble protein content102.8192016.66181.841 **0.00
PRO content121,422.8912020021.026216.154 **0.00
ABA content8984.4706225.02078.335 **0.00
SOD activity7156.00361192.66753.426 **0.00
POD activity4384.37866730.73084.696 **0.00
Note: ** indicates p < 0.01 a highly significant correlation.

3.5. Changes in Cell Membrane Stability in Leaves of M. thunbergii Seedlings During Drought Treatment

3.5.1. Changes in Relative Conductivity of Seedling Leaves

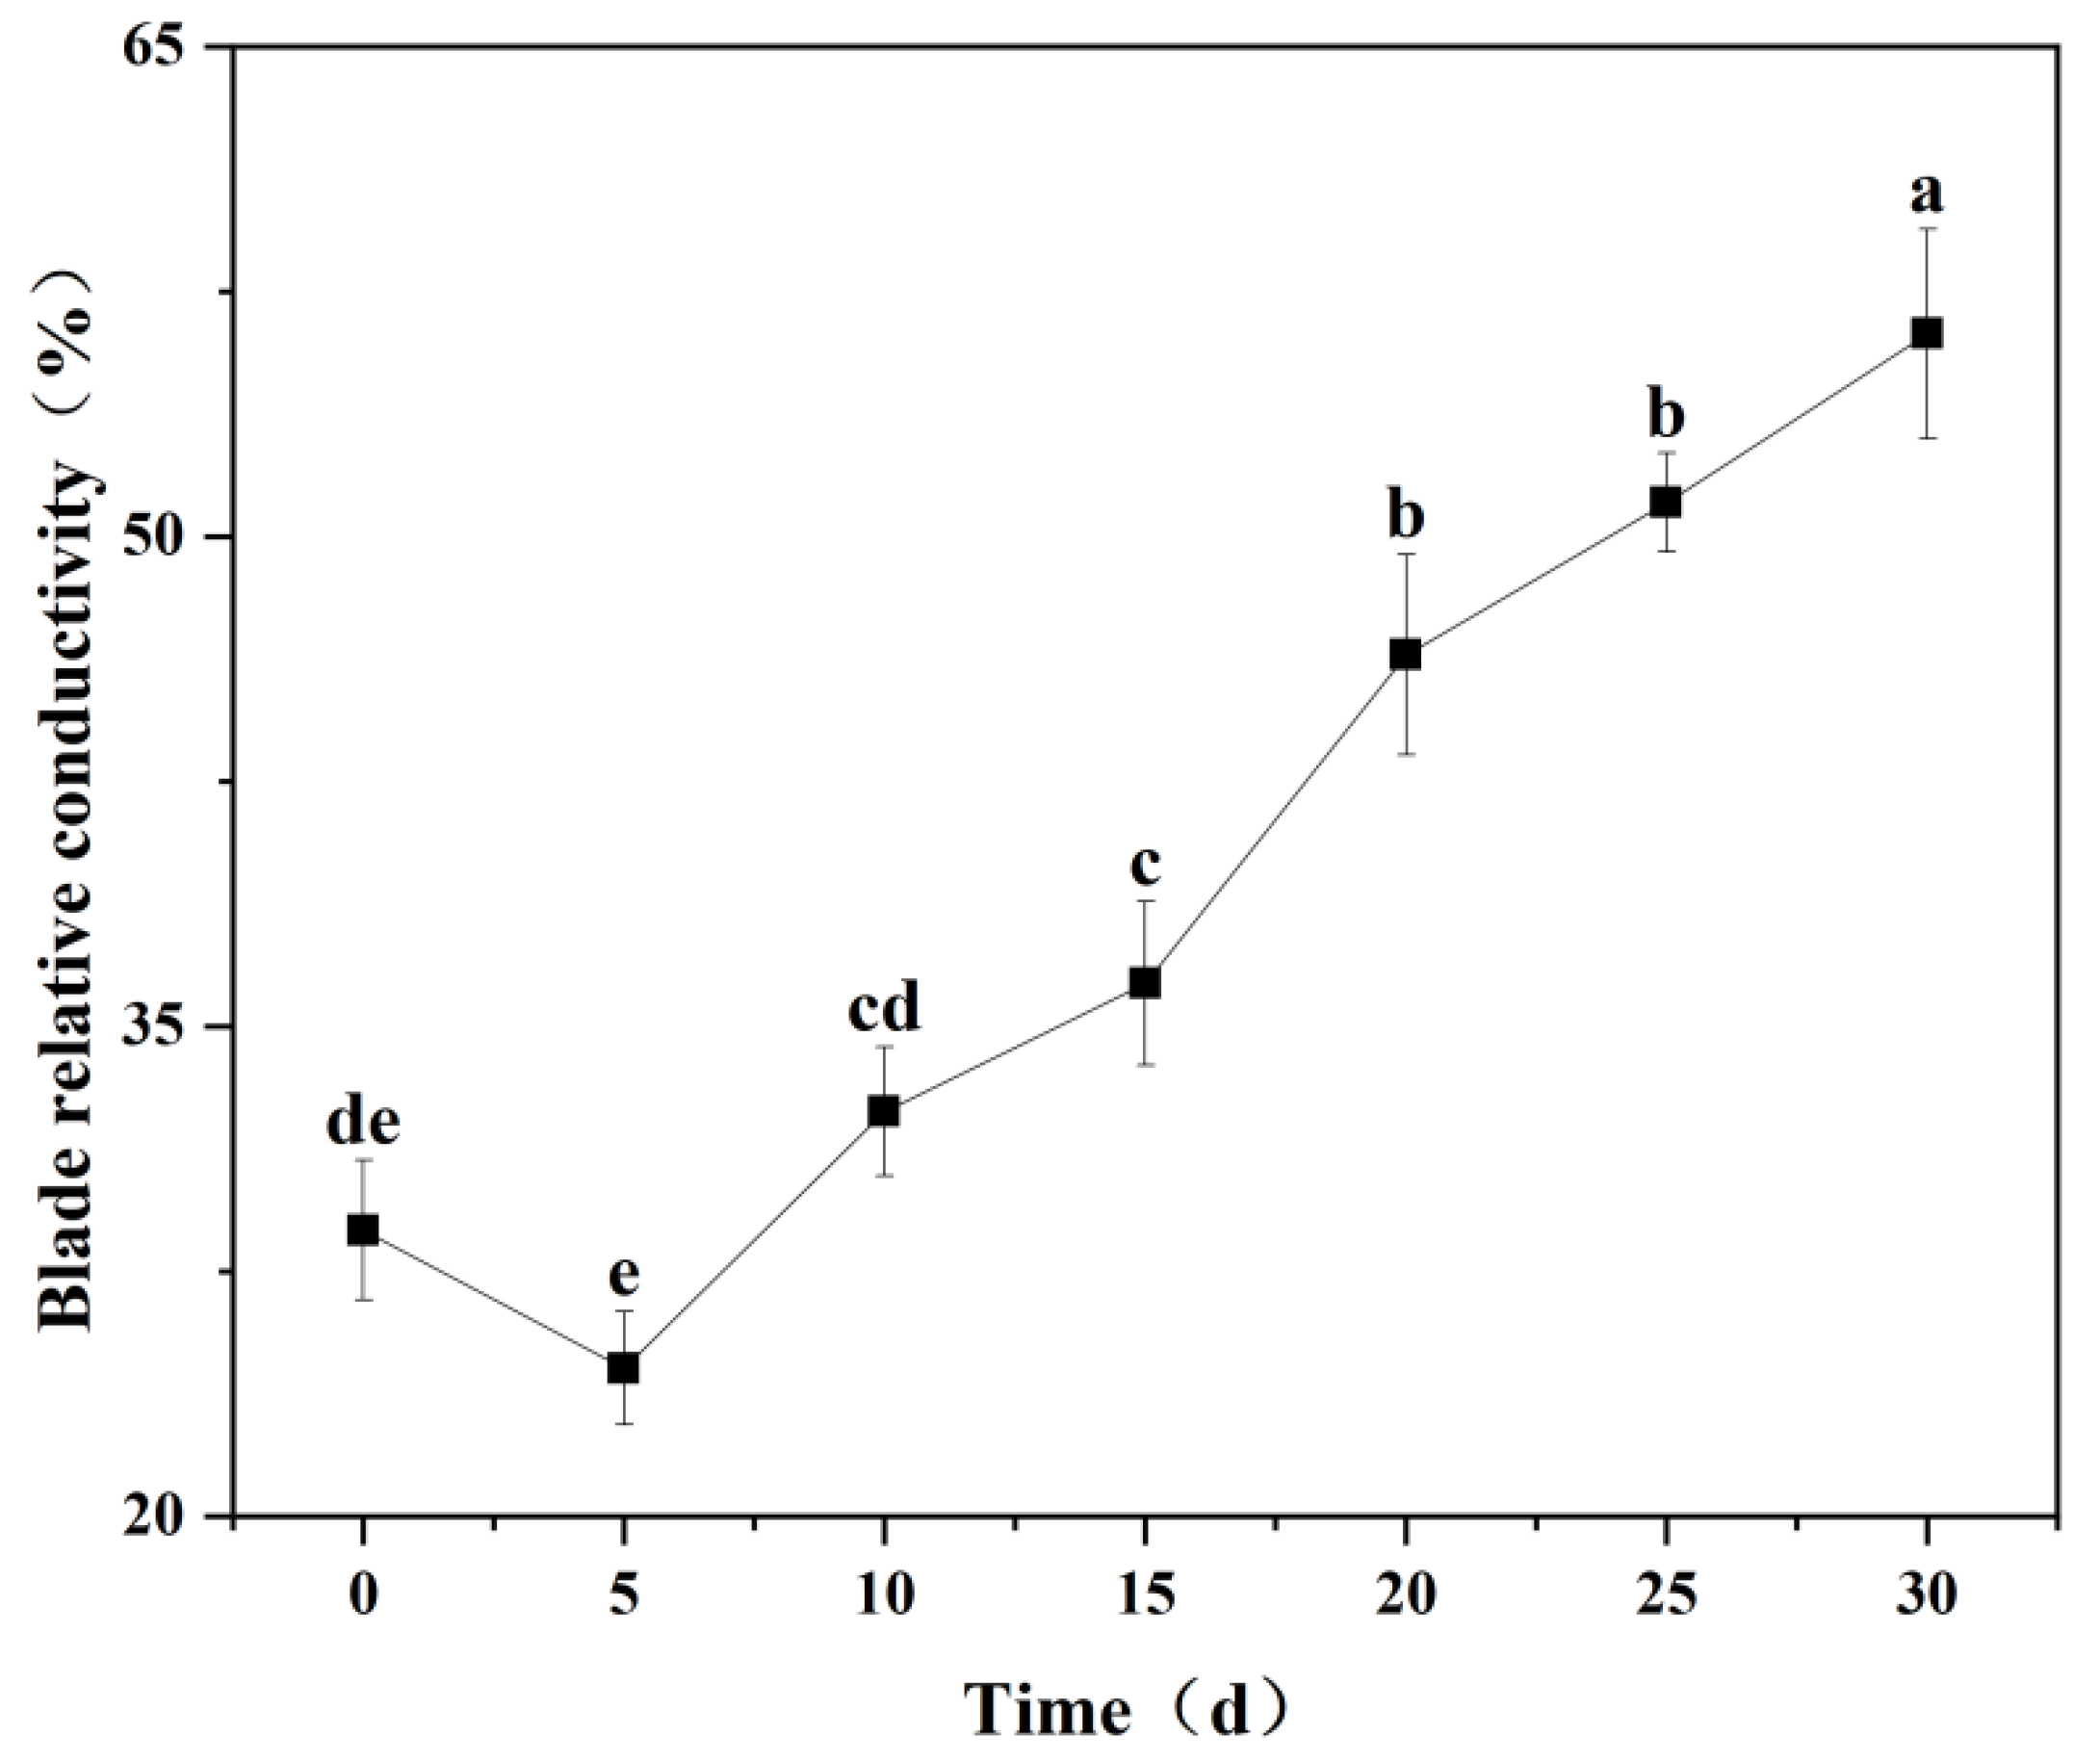
Relative electrical conductivity (REC) is a key stress indicator, reflecting the extent of plant cell membrane damage [14,16]. Table 3 shows that drought stress significantly affected leaf REC in M. thunbergii seedlings (p < 0.01). It can be seen from Figure 4 that the relative conductivity of leaves of M. thunbergii seedlings decreased slightly within 5 days after drought treatment, but the difference between them was not significant (p > 0.05). With the extension of drought treatment time, the relative conductivity of seedling leaves continued to increase, and the increase in relative seedling leaf conductivity was largest from 15 days to 20 days of drought treatment. Then, the relative conductivity of leaves increased further from the 20th to 30th day of drought treatment and reached the maximum at the 30th day of drought treatment, which was 1.95 times higher than that at the beginning of drought treatment. In the late stage of drought treatment, the cell membrane permeability of M. thunbergii seedling leaves increased continuously, and the electrolytes in the cells were seriously extravasated.

3.5.2. Changes in MDA Content in Seedling Leaves

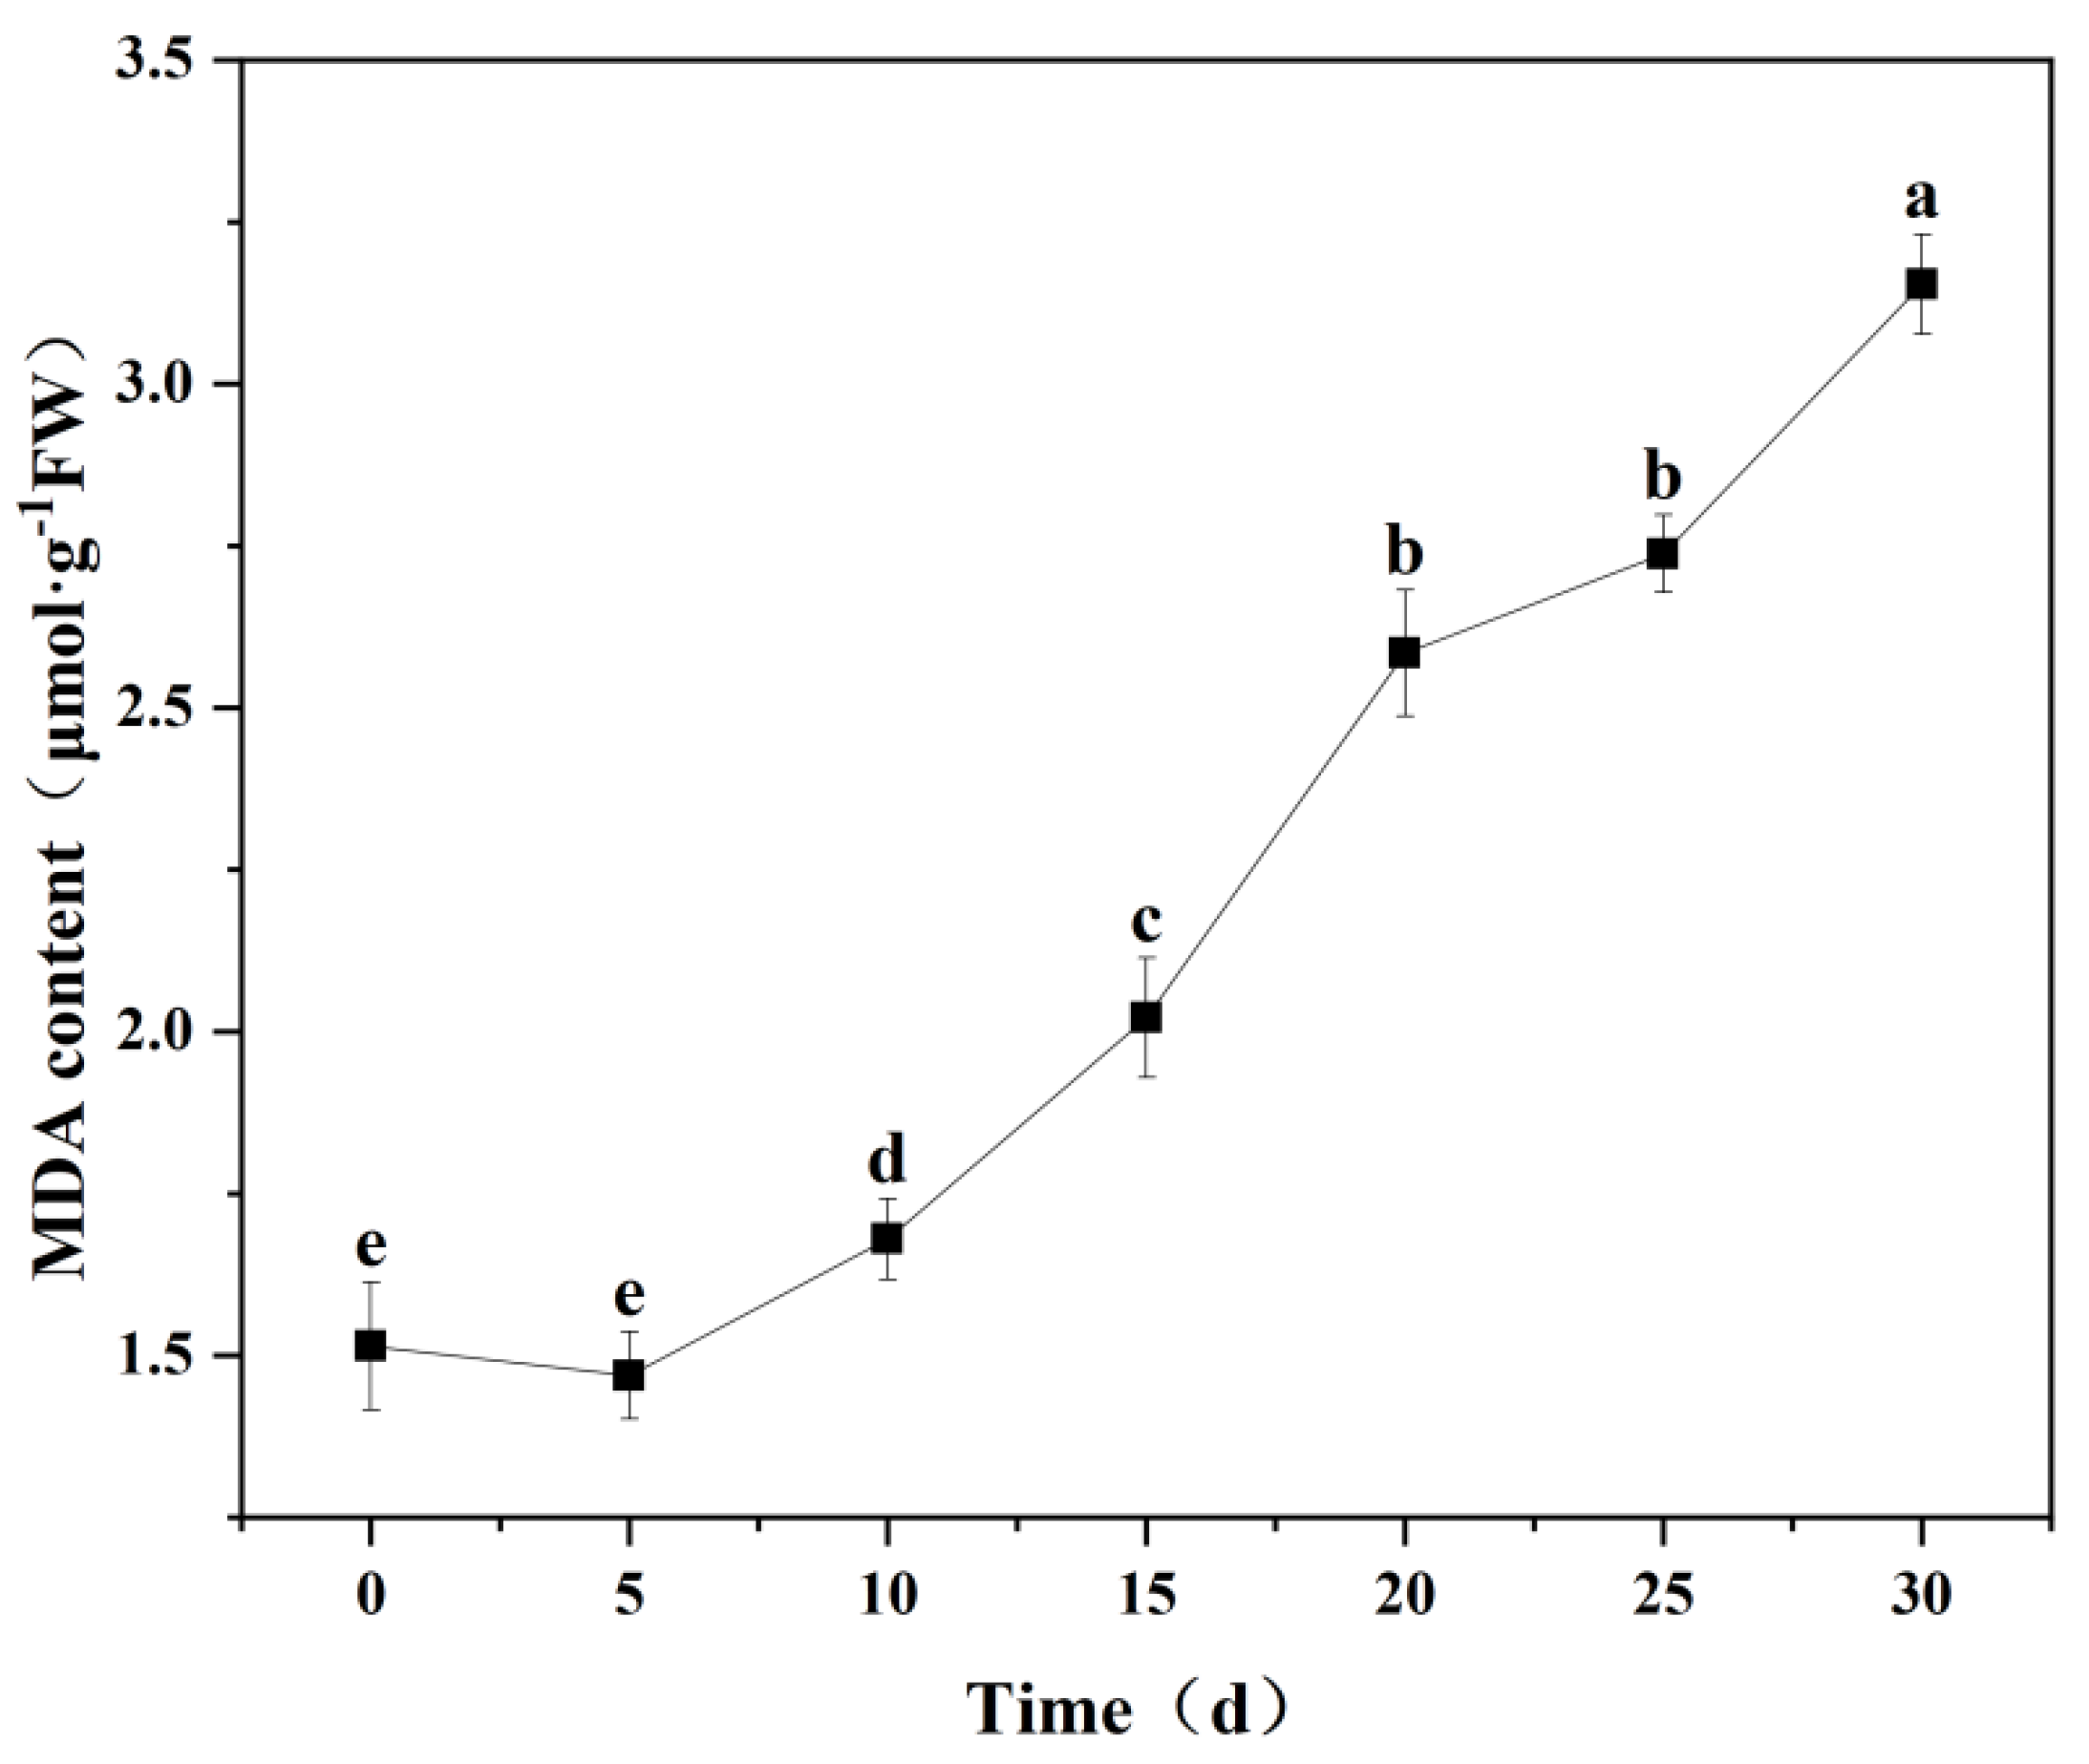
As a terminal product of lipid peroxidation, MDA content directly indicates cell membrane damage [17,18]. It can be seen from Table 3 that the effect of drought treatment on MDA content of M. thunbergii seedlings reached a very significant level (p < 0.01). It can be seen from Figure 5 that with the extension of drought treatment time, MDA content in leaves of M. thunbergii seedlings showed a trend of first decreasing and then increasing, reaching the minimum value at the fifth day of drought treatment, but the decline was not significant (p > 0.05). During the subsequent drought treatment, the MDA content in the leaves of M. thunbergii seedlings continued to increase, with the largest increase from the 15th day to the 20th day. At the 30th day of drought treatment, the MDA content in the leaves reached the peak, which was 2.08 times higher than that at the beginning of drought treatment, and the state of cell membrane damage was relatively serious.

3.6. Changes in Osmotic Adjustment Substance Content in Seedling Leaves During Drought Treatment

3.6.1. Changes in Soluble Protein Content in Seedling Leaves

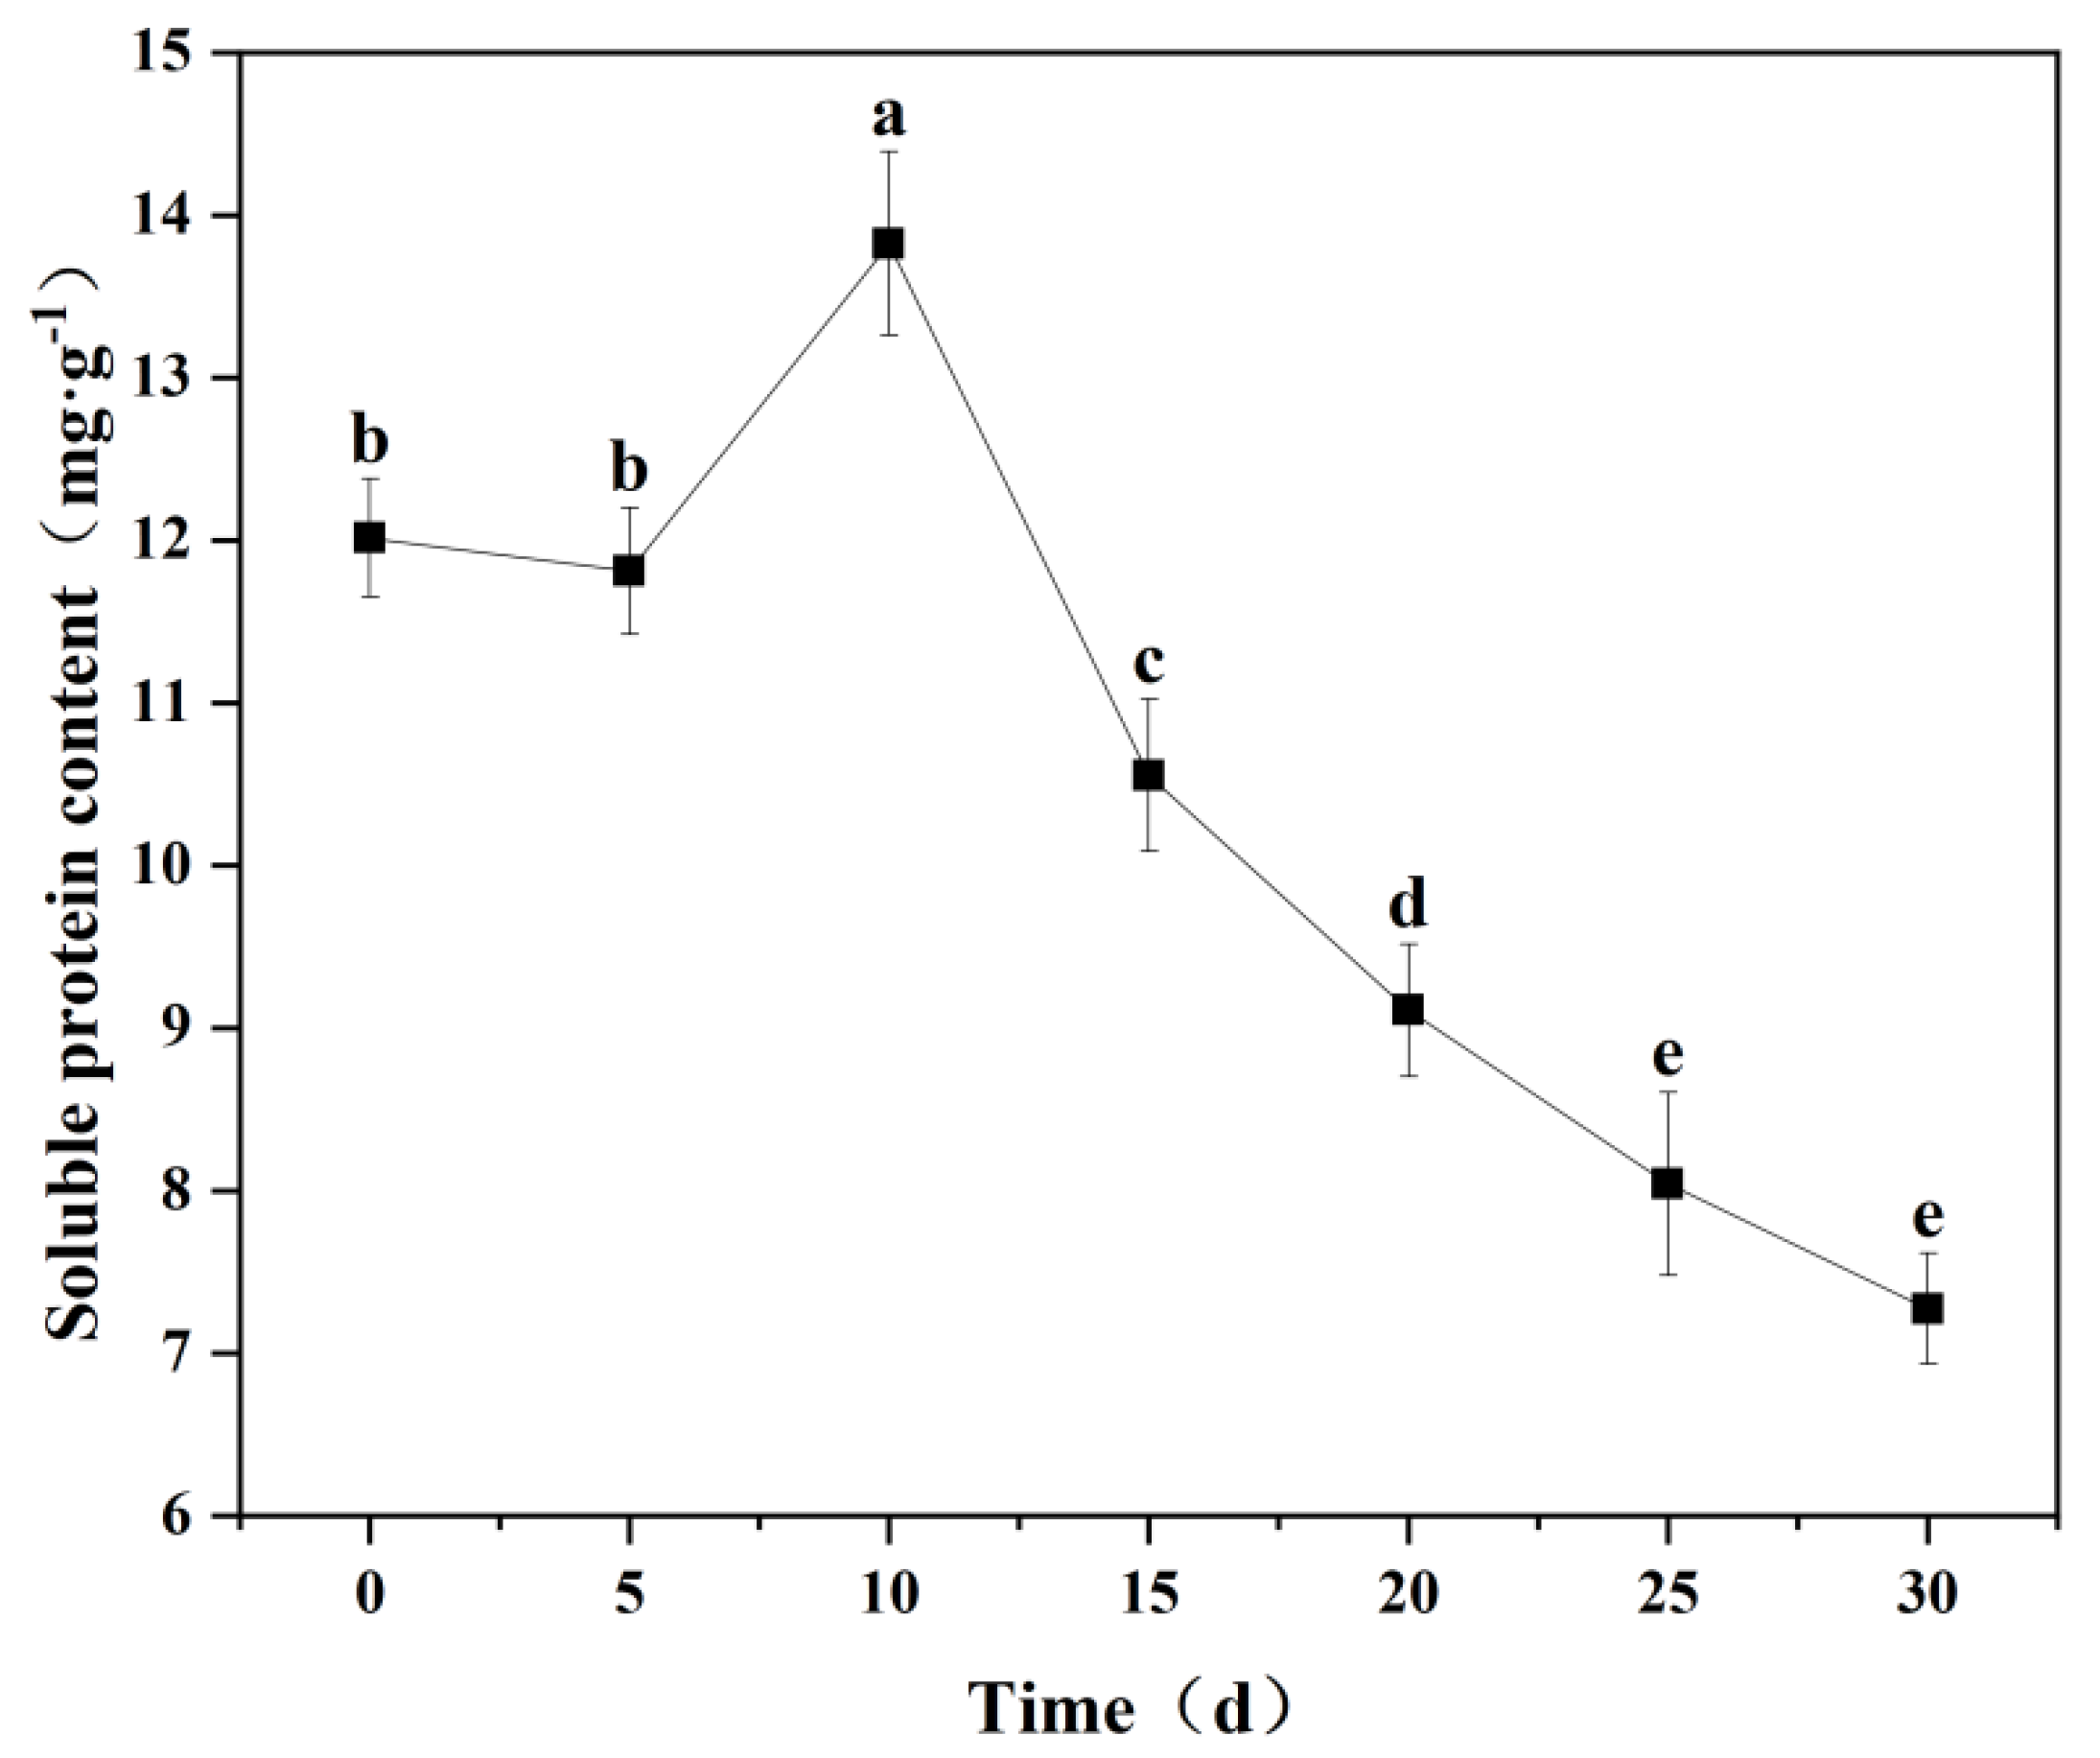
Soluble proteins serve as crucial osmoregulators and nutrients in plants. Their accumulation improves cellular water retention and maintains membrane integrity [19]. It can be seen from Table 3 that the difference in soluble protein content in leaves of M. thunbergii seedlings at different drought treatment times reached a very significant level (p < 0.01). It can be seen from Figure 6 that since the relative water content of the cultivation substrate was at a normal level within 10 days before the substrate stopped watering, there was no significant change in the soluble protein content of the leaves. On the 10th day of drought treatment, soluble protein accumulation in leaves reached the maximum, which increased by 15.08% compared with that at the beginning of drought treatment. From the 10th day to the 15th day of drought treatment, the soluble protein content in the leaves of seedlings decreased rapidly, indicating that M. thunbergii seedlings were under severe drought stress. After 30 days of drought treatment, its content reached the lowest value, which was 39.47% lower than that at the beginning of drought treatment. With the extension of drought treatment time, the content of soluble protein in leaves decreased continuously, the self-regulation ability of seedlings decreased, and seedlings sustained damage to varying degrees.

3.6.2. Changes in Proline Content in Seedling Leaves

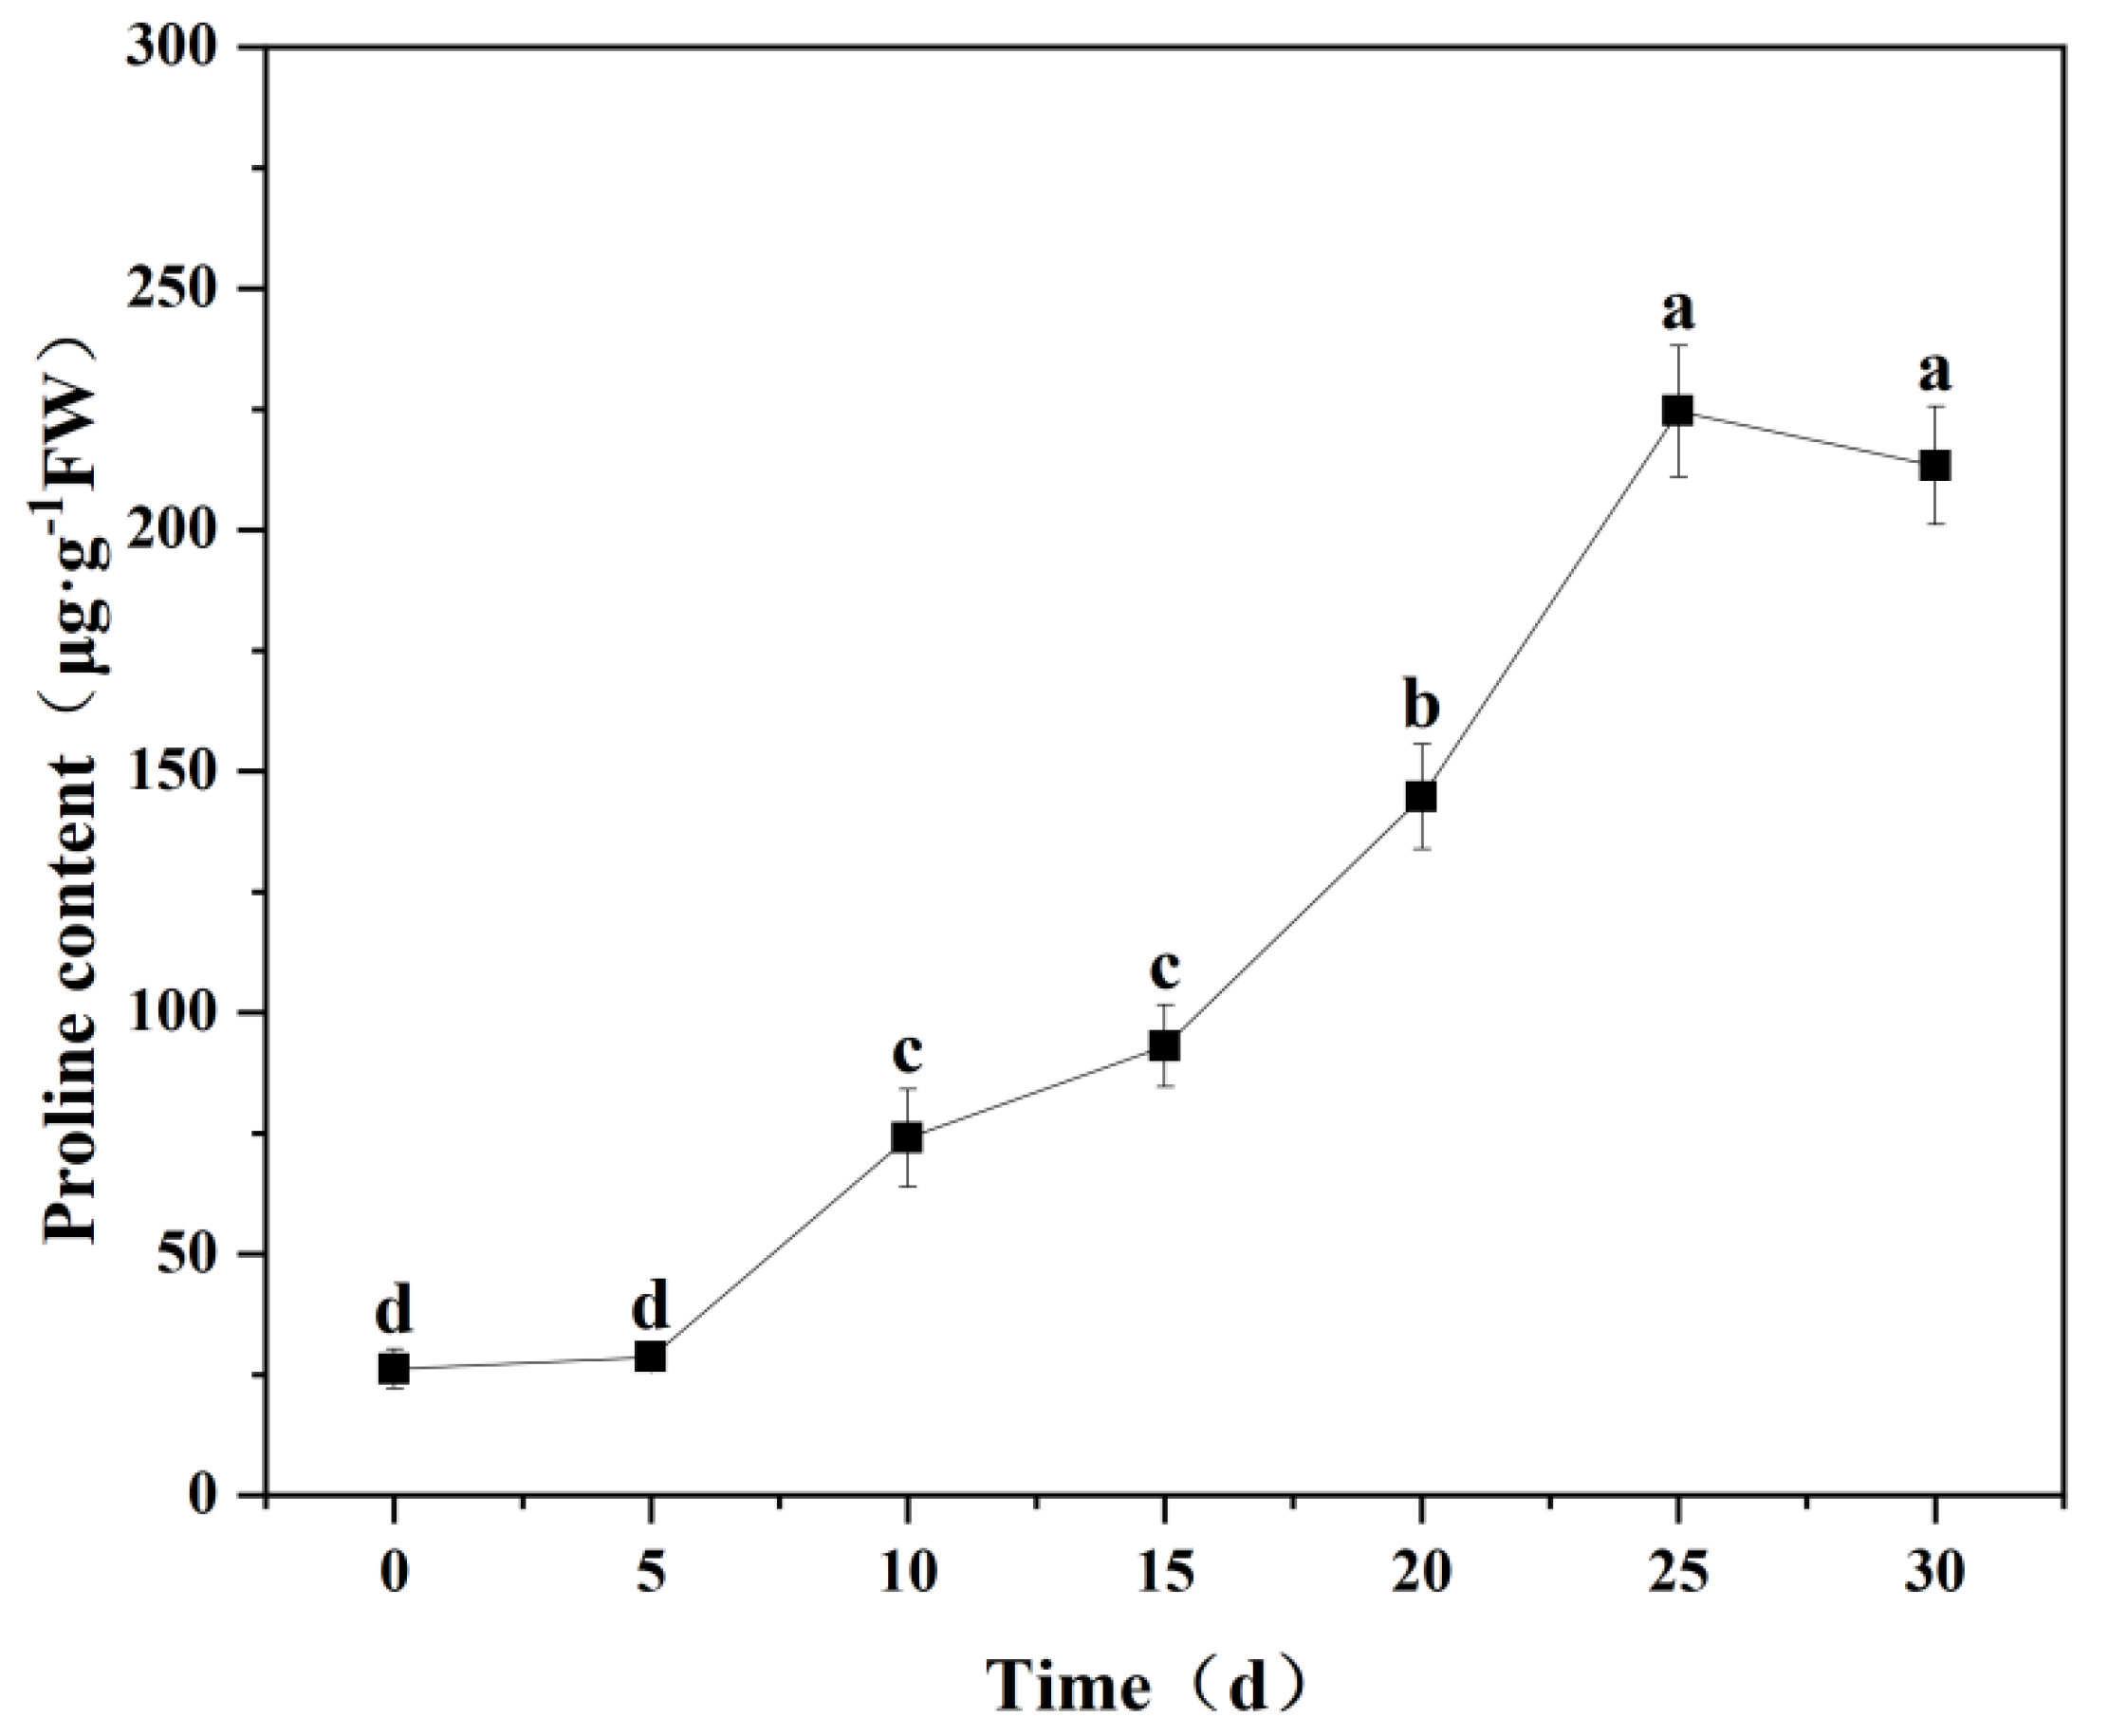
As an important osmotic regulator in plants, proline plays an important role in maintaining cell turgor and protecting the cell membrane system from damage [20]. It can be seen from Table 3 that the difference in proline content in leaves of M. thunbergii seedlings treated with different drought times reached a very significant level (p < 0.01). It can be seen from Figure 7 that the proline content in the leaves of M. thunbergii seedlings showed a trend of gradual increase in the whole process of drought treatment. The proline content in leaves increased rapidly from the 15th day to the 25th day of drought treatment, especially from the 20th day to the 25th day. By the 25th day of drought treatment, its content reached the peak, which was 8.58 times of the value at the beginning of drought treatment. From the 25th day to the 30th day of drought treatment, the proline content in the leaves decreased, and the osmotic adjustment of seedling leaves was unbalanced, as they could not resist drought stress by accumulating proline.

3.7. Changes in ABA Content in Leaves of M. thunbergii Seedlings During Drought Treatment

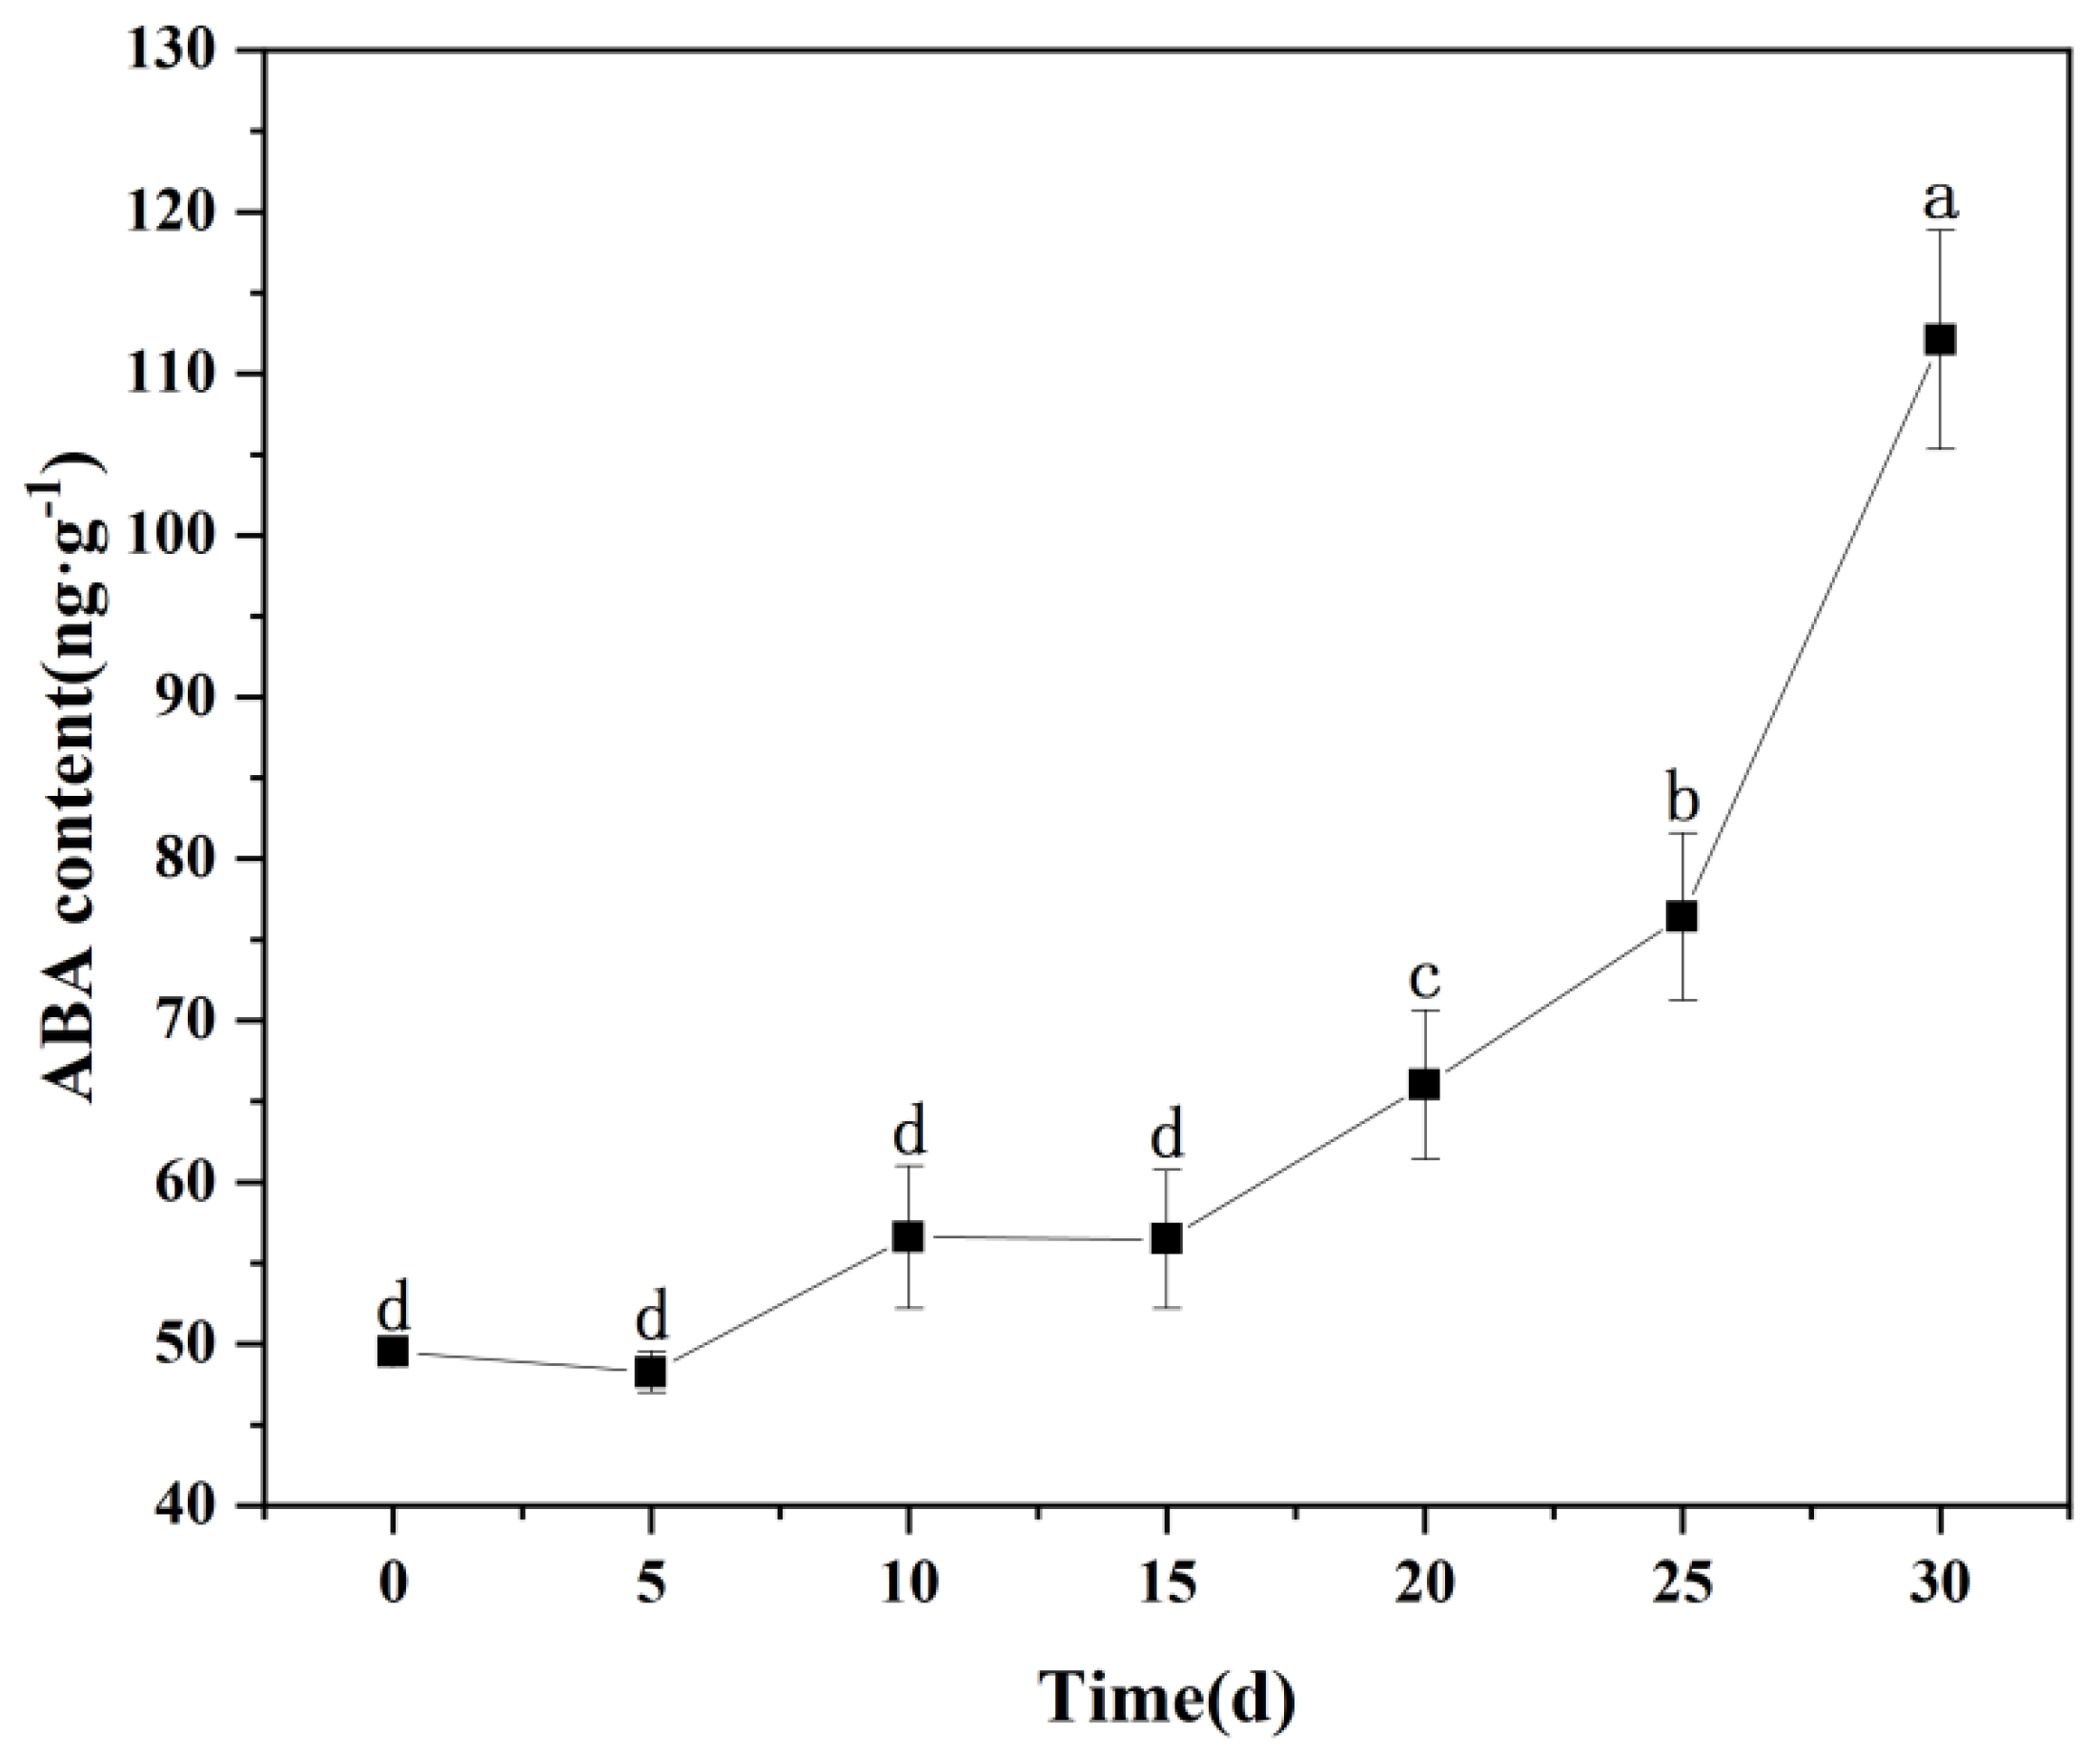
Endogenous hormones are regulators of plant growth activities. When plants are stressed by adversity, plants will adjust their hormone content to adapt to the damage caused by adversity [21]. ABA is an important hormone in response to drought stress in plants. Drought stress can promote ABA accumulation, force leaf stomata to close, and reduce leaf water loss [22]. It can be seen from Table 3 that the effect of drought treatment on ABA content in leaves of M. thunbergii seedlings reached a very significant level (p < 0.01). It can be seen from Figure 8 that ABA content in seedling leaves increased continuously from the 20th to 30th day of drought treatment, and the fastest increase occurred from the 25th to 30th day of drought treatment, peaking at the 30th day of drought treatment. Compared with the beginning of drought treatment, the ABA content of seedling leaves at the end of drought treatment increased by 2.23 times. In the late stage of drought stress, the leaves of M. thunbergii seedlings increased the survival ability of plants by accumulating a large amount of ABA.

3.8. Changes in Protective Enzyme System in Seedling Leaves During Drought Treatment

3.8.1. Changes in SOD Activity in Seedling Leaves

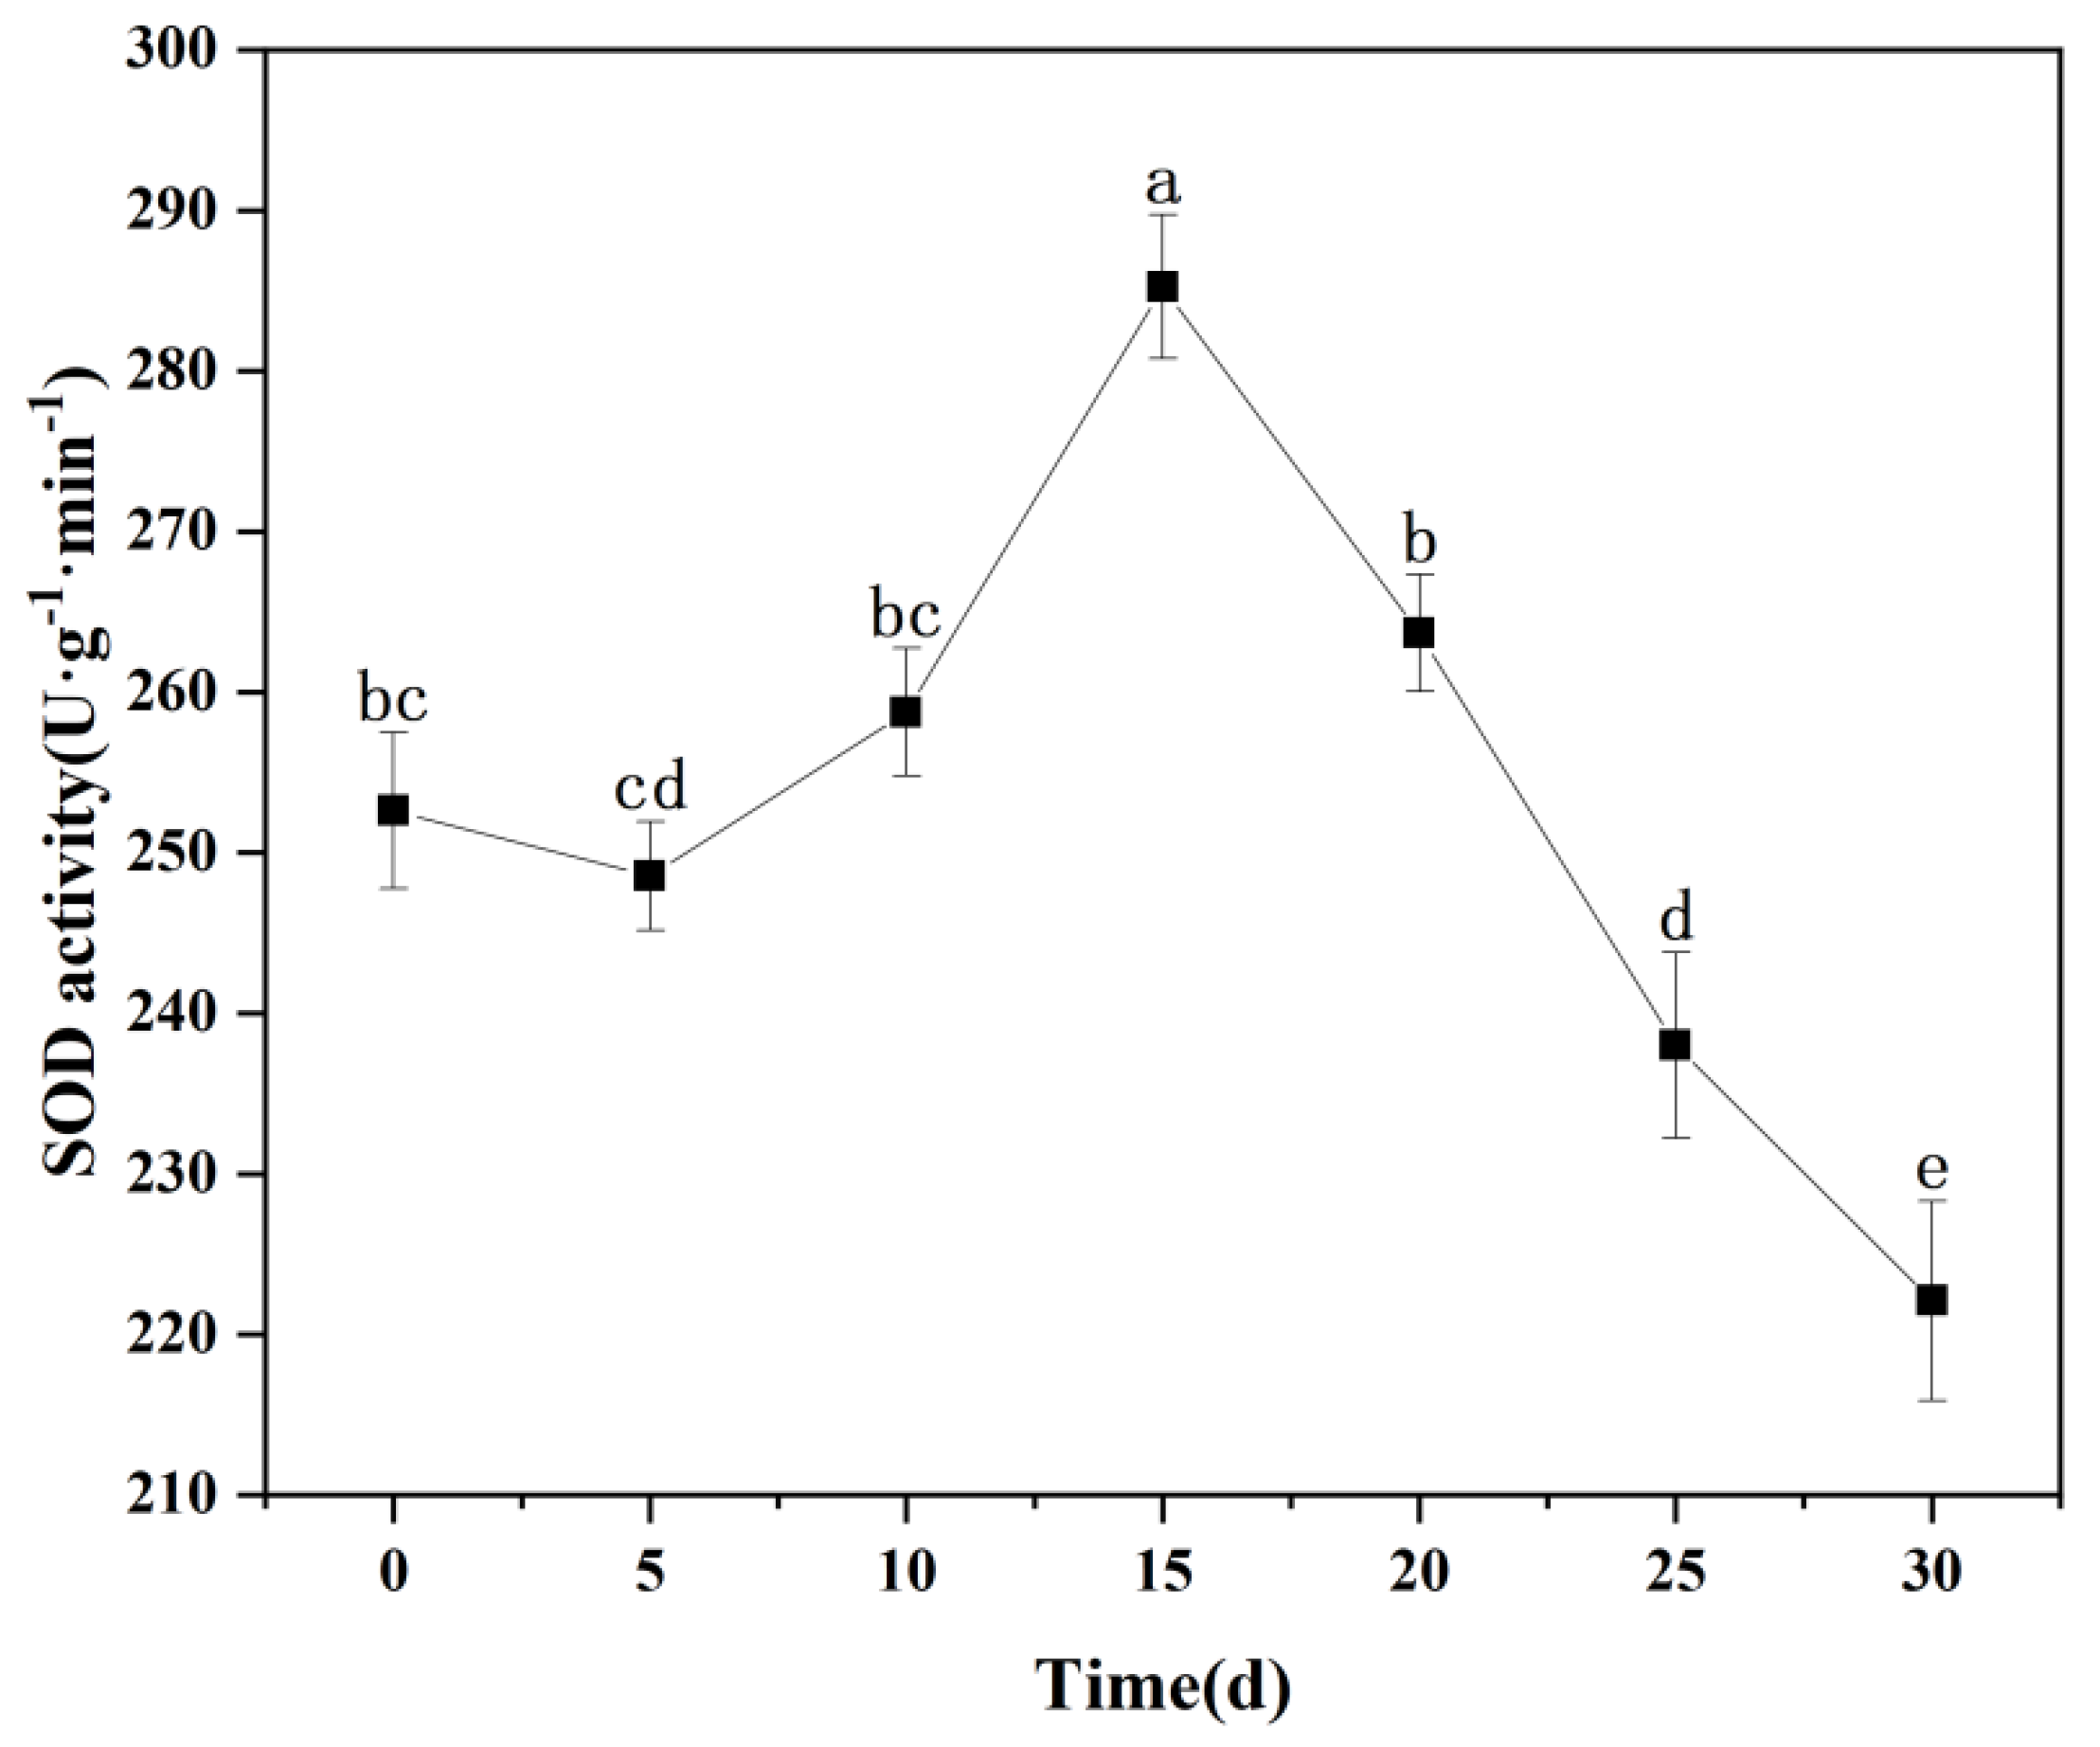
Superoxide dismutase (SOD) is the first line of defense of the seed antioxidant enzyme system, which is mainly responsible for removing and maintaining normal metabolic activities in plants. The activity of SOD can reflect the ability of cells to clear ROS [23,24]. It can be seen from Table 3 that the effect of drought treatment on SOD activity in leaves of M. thunbergii seedlings reached a very significant level (p < 0.01). It can be seen from Figure 9 that during the whole drought treatment process, the SOD activity in the leaves of M. thunbergii seedlings increased first and then decreased. During the first 10 days of drought treatment, due to the normal water content in the substrate, a good water transport state was maintained between the leaves and roots of M. thunbergii seedlings, and the SOD activity in the leaves of seedlings changed slightly. From the 10th to 15th day of drought treatment, the SOD activity of seedling leaves increased the most, and reached the peak at the 15th day. With the aggravation of drought stress, SOD activity in seedling leaves continued to decline, and reached the lowest value at the 30th day, which was 12.08% lower than that at the beginning of drought treatment (day 0).

3.8.2. Changes in POD Activity in Seedling Leaves

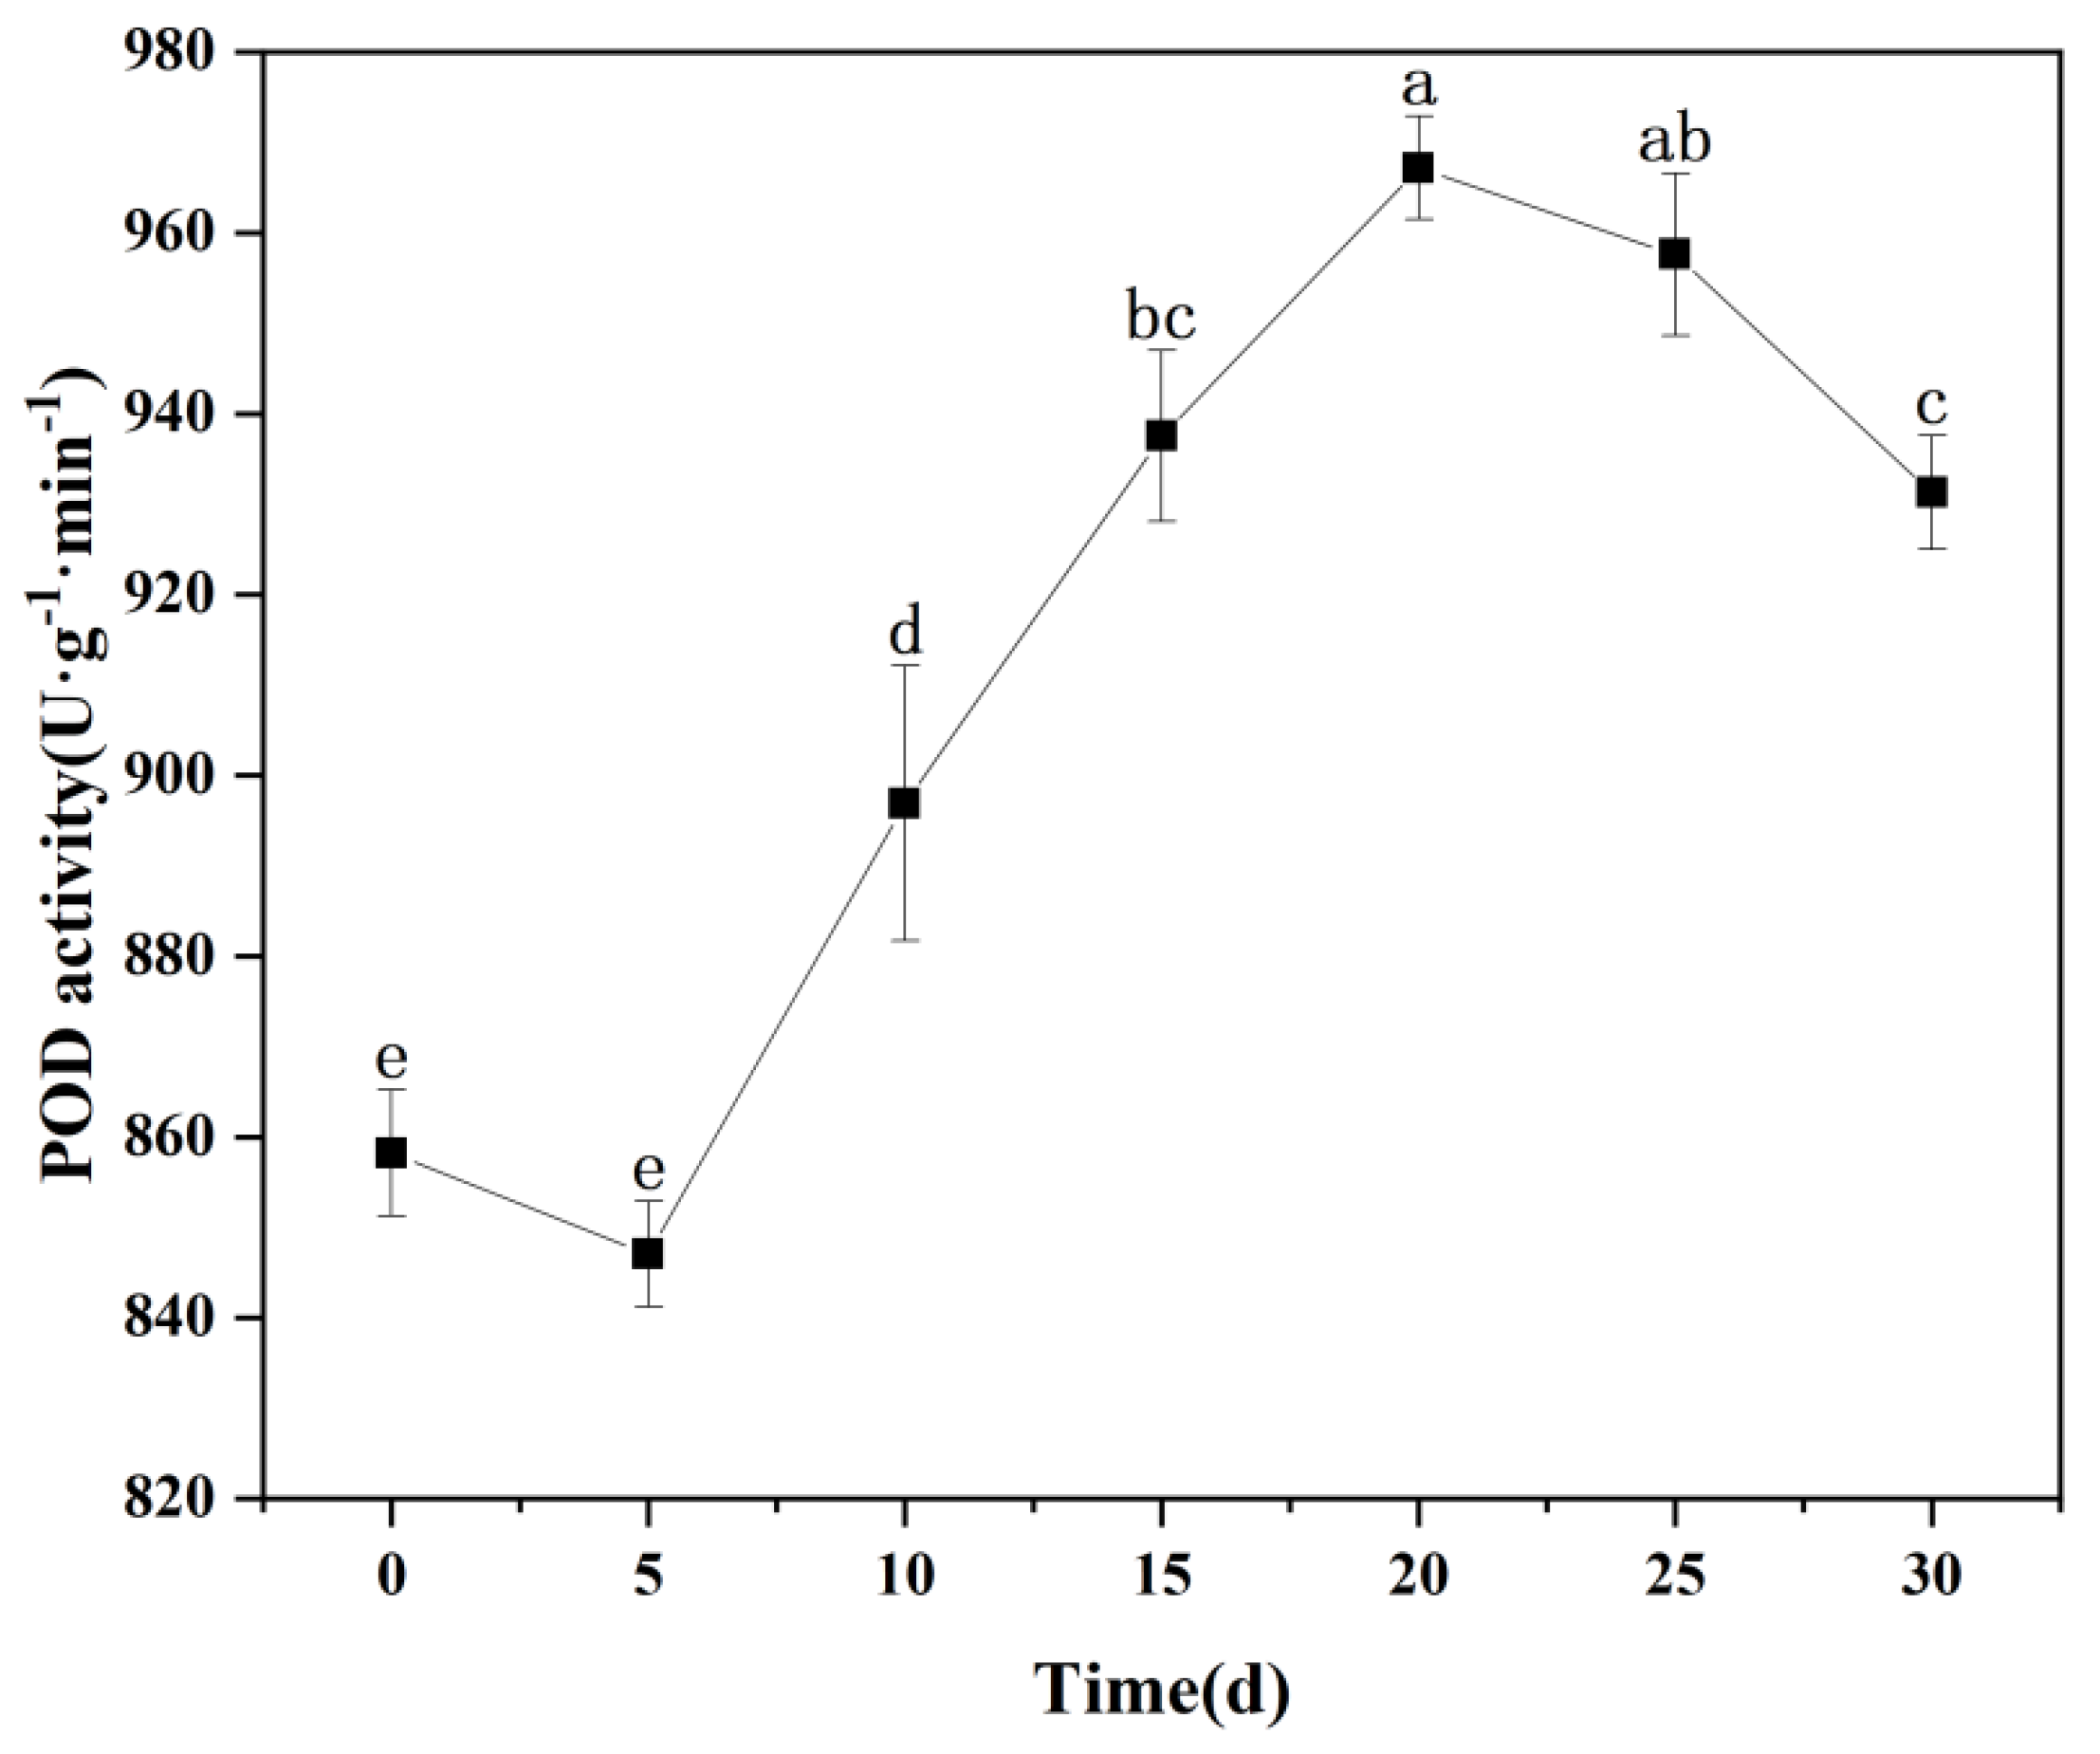
Peroxidase (POD) is an oxidase widely existing in plants. It works in synergy with enzymes such as SOD and cat. POD mainly removes excessive H2O2 in seedlings and reduces the toxicity of ROS to seedlings [24,25]. It can be seen from Table 3 that the effect of drought treatment on POD activity in leaves of M. thunbergii seedlings reached a very significant level (p < 0.01). It can be seen from Figure 10 that during the whole drought treatment process, POD activity in leaves of M. thunbergii seedlings showed a trend of first increasing and then decreasing. From the 5th day to the 20th day of drought treatment, the POD activity of seedling leaves increased continuously, indicating that M. thunbergii seedlings can resist drought stress by improving their own POD activity at the beginning of drought stress, and the POD activity reached the maximum at the 20th day of drought treatment. At the later stage of drought stress, POD activity of seedling leaves continued to decline, and at the 30th day of drought treatment, its activity was still increased by 8.51% compared with that at the beginning of drought treatment. In the middle stage of drought treatment, M. thunbergii seedlings resisted drought stress by improving their own POD activity, but with the aggravation of drought stress, POD activity decreased, and the seedlings gradually lost the ability to self-scavenge ROS.

3.9. Correlation Analysis of Drought Tolerance of M. thunbergii Seedlings

Drought resistance of seedlings is a comprehensive performance of multiple factors. Under drought stress, the growth and physiological indexes of M. thunbergii seedlings changed significantly. Correlation analysis was conducted on the relative water content of cultivation substrate, leaf thickness, relative water content, relative conductivity, MDA content, proline content, soluble protein content, ABA content, SOD activity, POD activity, and other indicators (Table 4). The results of correlation analysis showed that with the aggravation of drought stress, the water content of cultivation substrate decreased continuously, and the water content of the cultivation substrate was significantly positively correlated with leaf thickness and relative water content (p < 0.01), while the water content of the cultivation substrate was significantly negatively correlated with proline content, soluble protein content, and POD activity (p < 0.01). There was a significant positive correlation between POD activity and relative conductivity, MDA content, and proline content (0.01 < p < 0.05), and a very significant negative correlation between POD activity and leaf thickness (p < 0.01), while there was no significant correlation between POD activity and ABA content. There was a significant positive correlation between ABA content and relative conductivity and MDA content (p < 0.01), and a significant negative correlation between ABA content and relative water content (p < 0.01). That is, under drought conditions, the higher the ABA content in the plant, the stronger the drought resistance of M. thunbergii seedlings. Therefore, leaf relative conductivity, MDA content, proline content, soluble protein content, ABA content, and POD activity are important indicators for drought resistance evaluation of M. thunbergii seedlings.

4. Discussion

4.1. Effects of Drought Stress on Leaf Anatomical Structure of M. thunbergii Seedlings

Greater leaf and epidermal thicknesses enhance water storage and reduce transpiration, conferring drought resistance [26]. The differentiation degree of palisade tissue and spongy tissue can reflect the water state of plants in the growth environment, which is an important index to evaluate the drought tolerance of plants [27]. With the extension of drought treatment time, the leaf thickness, upper and lower epidermal thickness, and spongy tissue thickness of M. thunbergii seedlings gradually decreased, and the palisade tissue thickness and palisade-to-spongey layer ratio increased, indicating that the leaf compactness of M. thunbergii seedlings was better in drought stress, and the dense palisade tissue was its adaptive adjustment to drought stress. With the increase in drought stress, the leaf thickness, epidermal thickness, palisade tissue thickness, and spongey tissue thickness of Glehnia littoralis decreased, and leaf sponge tissue thickness was always greater than that of palisade tissue. Due to the large intercellular space in sponge tissue, it can store water to adapt to drought stress [28], which is consistent with the results of this study. In this study, with the extension of drought treatment time, the sponge tissue thickness in leaves of M. thunbergii seedlings gradually became less than that of palisade tissue, and the leaf structure was seriously damaged, resulting in a decline in sponge tissue water storage capacity.

4.2. Effects of Drought Stress on Leaf Water Content of M. thunbergii Seedlings

The relative water content of seedling leaves can directly reflect the water deficit in plants, and it is also one of the important indicators of plant drought resistance. When the relative water content of leaves is large, it shows that plant physiological metabolism is strong under drought conditions, which can be used as a comparison of physiological indicators such as water holding capacity and resistance of different plants [14]. In this study, with the extension of drought treatment time, the relative water content of substrate decreased continuously, and the relative water content in leaves of M. thunbergii seedlings showed a continuous downward trend. After 30 days of drought treatment, the cultivation substrate was at a level of severe drought, and the relative water content of the leaves reached its lowest point. With the increase in drought degree, the relative water content of Xanthoceras sorbifolia seedling leaves continues to decline, which is consistent with the results of this study [29].

4.3. Effects of Drought Stress on the Stability of the Cell Membrane in Leaves of M. thunbergii Seedlings

Changes in relative conductivity can be used as an important indicator to judge the degree of damage to plants under drought stress [14]. MDA is one of the final decomposition products of membrane peroxidation, which reflects the attack degree of plant cell membrane to a certain extent [30,31]. With the increase in the permeability of the plasma membrane, the damage degree of the plasma membrane was also aggravated, and the relative conductivity increased rapidly. With the aggravation of drought stress, the relative conductivity and MDA content of Rosa rugosa leaves gradually increased [32], which is consistent with the results of this study. The reason is that drought stress leads to the destruction of leaf cell membrane integrity, causing membrane lipid peroxidation, and the accumulation of reactive oxygen species such as O2 and H2O2 in seedlings. In this study, after 15 days of drought treatment, the relative conductivity of leaves of M. thunbergii seedlings increased significantly and the activity of protective enzymes decreased, resulting in a large amount of accumulation of membrane MDA products, indicating that when the cell membrane was seriously damaged, the permeability of cell membrane increased, resulting in a significant increase in the relative conductivity of leaves.

4.4. Response of Osmotic Adjustment Substances in Leaves of M. thunbergii Seedlings to Drought Treatment

Proline, soluble sugar, and soluble protein are important osmotic adjustment substances in plants. Under drought stress conditions, plant cells accumulate various osmotic adjustment substances through physiological metabolic activities to maintain plant cell turgor, strengthen the capacity of cells to absorb and retain water, thus ensuring normal plant growth [33]. Changes in soluble protein content can be used as an important index to evaluate the stress resistance of plants [34]. The soluble protein content in plants increases under environmental stress, thus enhancing the water holding capacity of cells. In the early stage of drought stress treatment, Hordeum vulgare seedlings were not sensitive to drought stress, and the content of soluble protein in leaves first decreased and then increased, but with the extension of drought treatment time, it showed a downward trend [35], which is consistent with the results of this study. With the increase in drought stress, the proline content in the leaves of Pinus massoniana seedlings is sensitive to drought stress and generally shows a continuous increasing trend [36]. In this study, in the early stage of drought treatment, the soluble protein content of M. thunbergii seedlings showed a small increase. The reason was that in the initial stage of drought stress, the seedlings accumulated a small amount of soluble protein to resist the damage caused by drought stress. However, with the aggravation of drought stress, it is difficult to synthesize soluble proteins related to drought resistance in seedlings. At the same time, soluble proteins in seedlings begin to decompose, resulting in the overall reduction of soluble protein content, which is consistent with the research results of caixiangjun [37] and others.

4.5. Response of ABA in Leaves of M. thunbergii Seedlings to Drought Treatment

Under drought stress, plants adapt to stress by regulating the changes in endogenous hormone content [21]. During stress, ABA content changes most obviously, as ABA is a stress hormone. As an important index to judge the drought resistance of plants, ABA mainly improves the adaptability of plants to adverse stress by inhibiting plant growth [38]. Under drought conditions, the ABA content of leaves of Triticum aestivum showed an overall upward trend [39], which is consistent with the results of this study. With the aggravation of drought stress, the ABA content of M. thunbergii seedlings continued to increase. By regulating their own physiological metabolism, they adapted to the drought stress environment. ABA, as a signal component, induced leaf stomatal closure and reduced leaf water transpiration, thereby improving the water retention and water absorption of M. thunbergii seedlings, indicating that the accumulation of ABA in seedlings was conducive to adapting to drought stress.

4.6. Response of Enzyme Protection System of M. thunbergii Seedlings to Drought Treatment

Under stress conditions, the plant enzyme protection system will fully play its role to remove excessive reactive oxygen species and free radicals in plants. SOD is an important enzyme in the plant enzyme protection system that can catalyze the conversion of superoxide anion free radicals to H2O2 and O2 and reduce membrane lipid peroxidation in plants [25]. With the deepening of drought stress, the activities of SOD and POD in Sorghum bicolor leaves increased first and then decreased [40], which is consistent with the results of this study. The reason is that M. thunbergii seedlings can scavenge reactive oxygen species and reduce membrane lipid peroxidation by enhancing the activities of two protective enzymes under drought stress. After the 15th day of drought treatment, the activities of SOD and POD enzymes in seedling leaves decreased significantly. The analysis showed that the reason was that the activity and balance of protective enzyme system were seriously diminished, leading to the excessive accumulation of free radicals and the destruction of enzyme structure and function, resulting in a decline in enzyme activity and accumulation of the lipid peroxidation product MDA. Therefore, the content of MDA in leaves increased significantly after the 15th day of drought treatment. There is a strong correlation between the activity of protective enzymes and MDA, the product of lipid peroxidation. When drought stress is mild, the synergistic effect of protective enzymes in plants makes the degree of lipid peroxidation at a low level. Once drought stress intensifies, the balance in plants is broken, and the activity of protective enzymes is inhibited, resulting in a large amount of MDA, which is consistent with the research results of Bu et al. [41].

5. Conclusions

By simulating the drought stress treatment of M. thunbergii on the substrate, the physiological response changes in seedlings during drought treatment were compared and analyzed. The seedlings of M. thunbergii were treated with drought for 30 days. On the 25th day of drought treatment, the cultivation substrate was already at the level of severe drought, and one seedling died. The seedling mortality increased to 23.33% after 30 days of drought treatment, indicating that when the cultivation substrate was at the severe drought level, it was not conducive to the survival of M. thunbergii seedlings.
In the process of drought treatment, the anatomical structure indexes of leaves of M. thunbergii seedlings changed in varying degrees. The thickness of leaves and spongy tissue showed a downward trend, while the thickness of palisade tissue and the ratio of palisade to sponge increased as a whole. The water holding capacity of leaves decreased with the increase in drought stress. Under drought stress, the relative water content, relative conductivity, MDA content, soluble protein content, SOD activity, and POD activity of M. thunbergii seedlings were affected to a certain extent. With the extension of drought treatment time, the relative water content of the substrate decreased, and the relative water content in leaves of M. thunbergii seedlings also showed a downward trend; at the end of drought treatment, the cultivation substrate was at a level of severe drought, and the relative water content in leaves of M. thunbergii seedlings reached its lowest. Throughout the process of drought treatment, the relative conductivity and MDA content of leaves showed a gradual upward trend; when the drought degree was gradually aggravated, the relative conductivity of leaves of M. thunbergii seedlings increased, the cell membrane was damaged, and the membrane permeability increased; the soluble protein content in leaves of M. thunbergii seedlings increased first and then decreased; the proline content increased as a whole; ABA content in seedling leaves increased to cope with drought stress; the activities of SOD and pod increased first and then decreased. The deficiency of this experiment is that the time of drought treatment for M. thunbergii seedlings was only set from August to September in summer, and the measurement indexes are limited to physiological and biochemical indexes.

Author Contributions

Conceptualization, F.S., Y.B., and Y.Z.; methodology, F.S., K.Y., and A.Z.; software, B.T. and Y.L.; validation, K.Y. and A.Z.; formal analysis, K.Y. and A.Z.; investigation, F.S. and K.Y.; resources, Y.Z. and Y.B.; data curation, K.Y. and A.Z.; writing—original draft preparation, K.Y.; writing—review and editing, F.S., B.T., and Y.L.; project administration, F.S. and Y.B.; funding acquisition, F.S. and Y.Z. All authors have read and agreed to the published version of the manuscript.

Funding

This research was funded by Science and Technology Project of Shanghai Greening and City Appearance Management Bureau (G241209) and Key R&D Program of Shandong Province (2024LZGC003).

Data Availability Statement

The original contributions presented in this study are included in the article. Further inquiries can be directed to the corresponding authors.

Acknowledgments

During the preparation of this work, the authors used ChatGPT4.0 in order to improve language. After using this tool, the authors reviewed and edited the content as needed and take full responsibility for the content of the publication.

Conflicts of Interest

The authors declare no conflicts of interest.

References

  1. Zhang, J.; Liu, W.Q.; Gao, Y.; Tang, Z.H.; Zhang, J.Y.; Li, Z.Y.; Liu, J.R. Effect of soil drought stress on photosynthrsis and yield of sweetpotato. J. Jiangsu Norm. Univ. Nat. Sci. Ed. 2019, 37, 21–25. [Google Scholar]
  2. Sun, M.; Shang, Z.H.; Shen, Z.G.; Ding, X. Research progress in palnt response mechanism to drought stress. J. Henan For. Sci. Tech. 2019, 39, 1–3. [Google Scholar]
  3. Ma, F.L.; Ma, Y.H. Effect of drought stress on plants and their response mechanism. J. Ningxia Univ. (Nat. Sci. Ed.) 2022, 43, 391–399. [Google Scholar]
  4. Mang, L.Y.; Huang, J.J. Research progress and development prospect of indigenous species Machilus thunbergii. Protec. For. Sci. Tech. 2019, 06, 66–68. [Google Scholar]
  5. Xu, D. The Population Structure of Machilus thunbergii and Effect of Animals on Its Seed Dispersal. Master’s Thesis, Nanjing Forestry University, Nanjing, China, 2014. [Google Scholar]
  6. He, W.Z.; Li, T.T.; Chen, B.; Gao, D.H.; Yuan, W.H. Influences of root-controlling containers on root architecture and survival rate of seedling for 2 speciesin Lauraceae in Zhoushan. J. For. Eng. 2015, 29, 56–59. [Google Scholar]
  7. Lee, J.S.; Kim, J.W.; Yu, Y.U.; Kim, Y.C. Inhibition of phospholipase Cgamma1 and cancer cell proliferation by lignans and flavans from Machilus thunbergill. Arch. Phar. Res. 2004, 27, 25–38. [Google Scholar]
  8. Oktavia, D.; Jin, G. Variations in leaf morphological and chemical traits in response to life stages, plant functional types, and habitat types in an old-growth temperate forest. Basic Appl. Ecol. 2020, 49, 22–33. [Google Scholar] [CrossRef]
  9. Park, C.M. Investigation on the inhabitation environments and growth conditions of Machilus thunbergii community in Pyonsanbando. Kor. J. Env. Eco. 1998, 12, 242–252. [Google Scholar]
  10. Zhang, S.J.; Cang, J. Guide of Plant Physiological Experiments; China Agricultural Press: Beijing, China, 2015. [Google Scholar]
  11. GB/T 32136-2015; Agrometeorology (SAC/TC 539). Grade of Agricultural Drought. Standard Press of China: Beijing, China, 2015.
  12. Cui, Y.T. The Effection of Drought Stress on Structure and Physiology of four Potentilla Olants. Master’s Thesis, Nanjing Forestry University, Nanjing, China, 2013. [Google Scholar]
  13. Liu, M.; Zhang, Q.; Bai, H.R.; Bian, F.H.; Pang, Y.J.; Li, L.X. Effects of drought stress on anatomical structure and physiological characteristics of leaves of cultivated and wild Glehnia littoralis. J. Yantai Univ. Nat. Sci. Ed. 2023, 36, 28–33. [Google Scholar]
  14. Lou, K.Y. Research on Drought Resistance and Waterlogging Resistance of Koelreuteria bipinnata var. integrifoliola Seedlings; Zhejiang A&F University: Hangzhou, China, 2015. [Google Scholar]
  15. Xu, S.R. Effects of Soil Environment Regulation on Water Absorptionand Utlilzation of Lycium barbarum L. in Arid Regions; Gansu Agricultural University: Lanzhou, China, 2020. [Google Scholar]
  16. Jian, L.C.; Wang, H. Plant Cell Biology of Stress; Science Press: Beijing, China, 2009. [Google Scholar]
  17. Parkhey, S.; Naithani, S.C.; Keshavkant, S. ROS production and lipid catabolism in desiccating Shorea robusta seeds during aging. Plant Physiol. Biochem. 2012, 57, 261–267. [Google Scholar] [CrossRef] [PubMed]
  18. Blum, A. Osmotic adjustment is a prime drought stress adaptive engine in support of plant production. Plant Cell Environ. 2017, 40, 4–10. [Google Scholar] [CrossRef] [PubMed]
  19. Li, X.M.; Li, C.N.; Liu, X.L.; Bu, Z.Y.; Huang, Z.W. Effect of shading on leaf growth and primary metabolism of Camellia azalea seedlings. Acta Bot. Boreal. Occident. Sin. 2019, 39, 294–301. [Google Scholar]
  20. Lu, Z.J.; Zhang, Y.Q.; Zhang, C. The seedling growth and root physiological traits of Fagopyrum tataricum cultivars under drought stress. Acta Bot. Boreal. Occident. Sin. 2018, 38, 112–120. [Google Scholar]
  21. Liao, J.M.; Huang, X.L.; Liang, Z.F.; Li, C.D.; Lan, J.X.; Li, B.C.; Liang, W.H. Content changes of endogenous hormones under drought stress of Carya illinoensis seedlings. Guangxi For. Sci. 2020, 49, 511–517. [Google Scholar]
  22. Krishnan, S.; Merewitz, E.B. Drought stress and trinexapac-ethyl modify phytohormone content within Kentucky Bluegrass leaves. J. Plant Growth Regul. 2015, 34, 1–12. [Google Scholar] [CrossRef]
  23. Moller, I.M.; Jensen, P.M.; Hansson, A. Oxidative modification to cellular components in plants. Annu. Rev. Plant Biol. 2007, 58, 459–481. [Google Scholar] [CrossRef] [PubMed]
  24. Pei, D.L.; Zhang, H.Y.; Zhang, H.; Chen, R.; Li, C.W. Effects of drought stress on SOD, POD and PAL activity in tomato seedling leaves. J. Jilin Agric. Sci. 2015, 40, 83–86. [Google Scholar]
  25. Hannachi, S.; Signore, A.; Adnan, M.; Mechi, L. Single and associated effects of drought and heat stresses on physiological, biochemical and antioxidant machinery of four eggplant cultivars. Plants 2022, 11, 2404. [Google Scholar] [CrossRef]
  26. Li, Y.; Wang, X.X.; Zhang, B.; Jia, J.Q.; Feng, M.C.; Zhang, M.J.; Yang, W.D. Effects of drought and rewatering on root growth and anatomical structure of Oat in early growth stage. J. Shanxi Agric. Sci. 2021, 49, 1262–1268. [Google Scholar]
  27. Yu, Q.H.; Mubareke, A.Y.P.; Xu, P.Y.; Gong, P.; Dilixiati, H.S.M. Drought tolerance evaluation of almond cultivars and comparison on stem xylem natural embolism degree and anatomical structure under drought stress. J. Plant Resour. Environ. 2022, 31, 15–24. [Google Scholar]
  28. Zhang, W.J.; Yuan, H.M.; Chen, D.S.; Wang, X.L.; Kang, L.; He, J.S. Advances in studies on physiological and biochemical indexes and QTL for drought resistance in wheat. Agric. Res. Arid. Areas 2015, 33, 139–148. [Google Scholar]
  29. Zhao, X.; Zhang, X.Z.; Mu, H.X.; Sun, X.; He, H.Y.; Yang, K.W.; Dan, Y.Y.; Li, C.Y. Effect of drought stress on the water physiological characteristics and the osmotic regulation substances of Xanthoceras sorbifolia seedings from different provenances. J. Northeast. For. Univ. 2017, 45, 17–21. [Google Scholar]
  30. Priyanandhini, L.; Kalarani, M.K.; Senthil, A.; Senthil, N.; Pazhanivelan, S.; Karthikeyan, R.; Umapathi, M.; Vanitha, G. Effect of gas exchange, antioxidative enzyme activities and yield characteristics of maize inbred lines under drought stress. Russ. J. Plant Physiol. 2024, 71, 202. [Google Scholar] [CrossRef]
  31. Nawaz, F.; Naeem, M.; Zulfiqar, B. Understanding brassinosteroid-regulated mechanisms to improve stress tolerance in plants: A critical review. Enviro. Sci. Pol. 2017, 24, 15959–15975. [Google Scholar] [CrossRef]
  32. Gong, Z.T.; Yao, A.B.; Li, J.X.; Zhou, L.P.; Wei, L.; Zhang, J.X. Water stress tolerance of four roses varieties. Northern Hortic. 2021, 14, 73–79. [Google Scholar]
  33. Guo, H.J. Research progress on osmotic adjustment material under water stress. J. Anhui Agri. Sci. 2010, 38, 7750–7753, 7760. [Google Scholar]
  34. Mahoney, J.M. Response of a hybrid poplar to water Table decline in different substrates. For. Ecol. Manage 1992, 54, 141–156. [Google Scholar] [CrossRef]
  35. Li, J. Effects of drought stress on soluble protein of Hordeum vulgare seedlings. Jiangsu Agric. Sci. 2015, 43, 124–126. [Google Scholar]
  36. Hu, X.J.; Yang, C.X.; Tan, S.C.; Gu, Z.J.; Tang, S.; Yu, F.Y. Effects of drought stress on proline and endogenous hormones contentin Pinus massoniana seedlings from different provenances. South China For. Sci. 2020, 48, 24–28, 53. [Google Scholar]
  37. Cai, Y.M.; Guan, S.Y.; Guo, X.M. Effects of NaCl stress on antioxidant enzymes activities and soluble protein content in 3 kinds of sweet potatoes (Dioscorea esculenta). J. Anhui Agri. Sci. 2012, 40, 9228–9229. [Google Scholar]
  38. Wang, C.; Yang, A.; Yin, H. Influence of water stress on endogenous hormone contents and cell damage of maize seedlings. J. Integr. Plant Biol. 2008, 50, 427–434. [Google Scholar] [CrossRef] [PubMed]
  39. Xue, H. Study on the Relationship Between Endogenous Hormone Changes and Green Holding and Drought Resistance in Green-Holding Wheat. Master’s Thesis, Northwest A&F University, Xianyang, China, 2010. [Google Scholar]
  40. Chen, M.J.; Meng, Y.; Meng, X.Z. Effects of drought stress on photosynthetic pigments, protective enzyme activities and active oxygen metabolism of Sweet Sorghum Seedlings. Tianjin Agric. Sci. 2021, 27, 1–4. [Google Scholar]
  41. Bu, L.D.; Zhang, R.h.; Han, M.M.; Xue, J.Q.; Chang, Y. The physiological mechanism of compensation effect in maize leaf by re-watering after draught Stress. Acta Agric. Bor.-Occid. Sin. 2009, 18, 88–92. [Google Scholar]
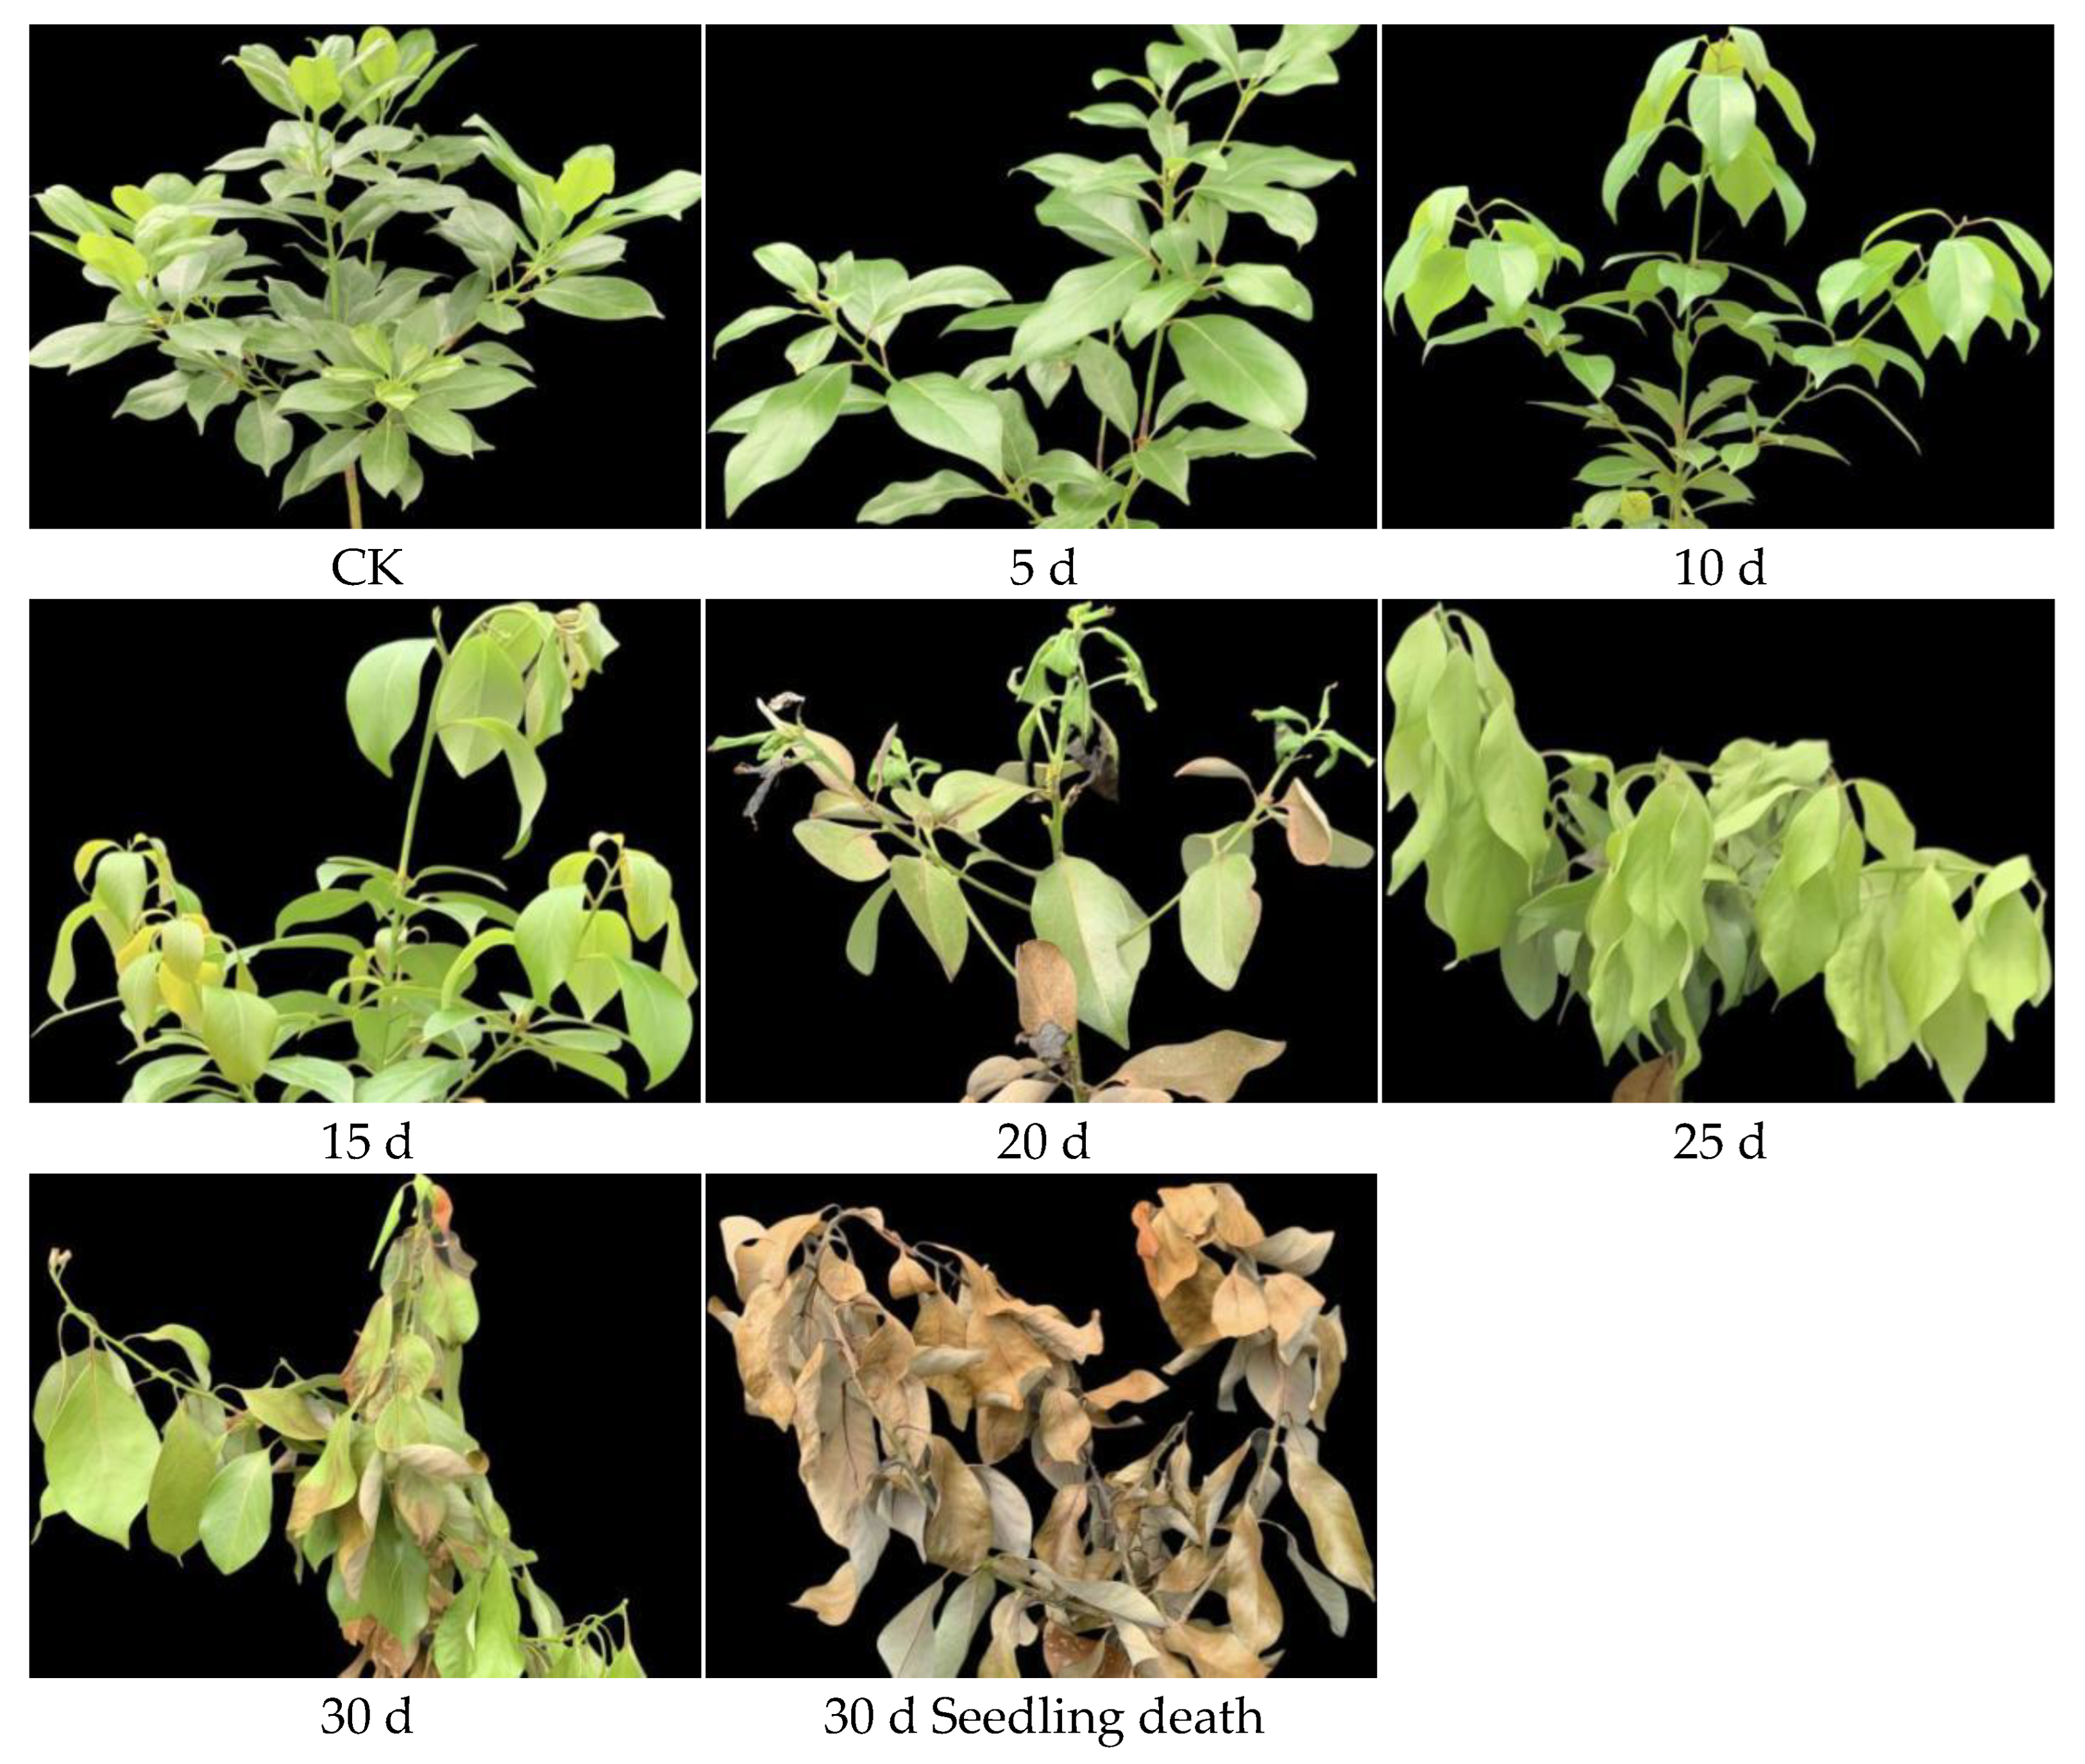
Figure 1. Morphological changes of M. thunbergii seedlings.
Agronomy 15 02154 g001
Figure 2. Anatomical structure of leaves of M. thunbergii seedlings during a 30-day course of water shortage. 1: Upper epidermal cells; 2: lower epidermal cells; 3: palisade tissue; 4: spongy tissue.
Agronomy 15 02154 g002
Figure 3. Measurement results of relative water content in leaves of M. thunbergii seedlings. Note: Different lowercase letters indicated significant differences between treatments (p < 0.05).
Agronomy 15 02154 g003
Figure 4. Measurement results of relative conductivity of leaves of M. thunbergii seedlings. Note: Different lowercase letters indicated significant differences between treatments (p < 0.05).
Agronomy 15 02154 g004
Figure 5. Measurement results of MDA content in leaves of M. thunbergii seedlings. Note: Different lowercase letters indicated significant differences between treatments (p < 0.05).
Agronomy 15 02154 g005
Figure 6. Determination of soluble protein content in leaves of M. thunbergii seedlings. Note: Different lowercase letters indicated significant differences between treatments (p < 0.05).
Agronomy 15 02154 g006
Figure 7. Determination of proline content in leaves of M. thunbergii seedlings. Note: Different lowercase letters indicated significant differences between treatments (p < 0.05).
Agronomy 15 02154 g007
Figure 8. Determination of ABA content in leaves of M. thunbergii seedlings. Note: Different lowercase letters indicated significant differences between treatments (p < 0.05).
Agronomy 15 02154 g008
Figure 9. Determination of SOD activity in leaves of M. thunbergii seedlings. Note: Different lowercase letters indicated significant differences between treatments (p < 0.05).
Agronomy 15 02154 g009
Figure 10. Determination of POD activity in leaves of M. thunbergii seedlings. Note: Different lowercase letters indicated significant differences between treatments (p < 0.05).
Agronomy 15 02154 g010
Table 1. The relative water content and corresponding drought degree of cultivation substrate.
Treatment Time
(d)
Matrix Moisture
Content (%)
Drought Degree
071.13 AaNormal level
565.42 AaNormal level
1056.87 BbMild drought
1550.66 CcMild drought
2033.85 DdModerate drought
2517.64 EeSevere drought
3014.33 EeSevere drought
Note: 1. Capital letters indicate significant difference in 0.01 test level, and small letters indicate significant difference in 0.05 test level, the same below. 2. The classification standard of substrate drought degree refers to the agricultural drought level [11].
Table 2. Measurement results of anatomical structure of leaves of M. thunbergii seedlings.
Treatment Time (d)Blade Thickness (μm)Upper Epidermal Cells (μm)Lower Epidermal Cells Thickness (μm)Palisade Tissue
Thickness (μm)
Spongy Tissue Thickness (μm)Palisade Tissue Thickness/Spongy Tissue Thickness
0232.81 ± 5.78 A16.05 ± 2.09 A10.16 ± 0.45 A88.62 ± 4.64 D105.70 ± 8.72 A0.84 ± 0.93 C
5230.05 ± 6.62 AB15.19 ± 0.17 AB9.94 ± 1.15 A95.86 ± 2.28 BCD103.49 ± 7.31 A0.92 ± 0.68 C
10219.71 ± 3.95 BC14.64 ± 0.69 ABC9.21 ± 0.56 AB93.97 ± 4.40 CD95.30 ± 3.23 AB0.98 ± 0.66 BC
15214.92 ± 1.42 CD14.18 ± 0.79 ABC8.83 ± 0.66 ABC97.53 ± 1.49 BC88.59 ± 1.59 BC1.10 ± 0.33 B
20204.93 ± 8.09 D13.45 ± 1.26 BC8.21 ± 0.81 BC97.20 ± 2.16 BC76.70 ± 6.87 D1.27 ± 0.11 A
25207.11 ± 5.40 D13.15 ± 0.55 C7.96 ± 0.35 BC102.44 ± 5.40 AB79.76 ± 1.39 CD1.28 ± 0.09 A
30203.58 ± 6.33 D12.58 ± 0.60 C7.48 ± 0.41 C106.16 ± 4.65 A75.40 ± 3.62 D1.40 ± 0.07 A
Note: Different capital letters indicate extremely significant differences between treatments (p < 0.01). The same applies to the results below.
Table 4. Correlation analysis results of various measured indexes after drought treatment.
IndexRelative Moisture Content of MatrixBlade ThicknessRelative Water ContentRelative ConductivityMDA ContentProline ContentSoluble Protein ContentABA ContentSOD ActivityPOD Activity
Relative moisture content of matrix1.000
Blade thickness0.934 **1.000
Relative water content0.974 **0.919 **1.000
Relative conductivity−0.979 **−0.936 **−0.973 **1.000
MDA content−0.980 **−0.936 **−0.981 **0.992 **1.000
Proline content−0.993 **−0.918 **−0.957 **0.975 **0.963 **1.000
Soluble protein content−0.896 **0.793 *0.884 **−0.896 **−0.926 **−0.876 **1.000
ABA content−0.837 **−0.762 *−0.941 **0.891 **0.905 **0.845 *−0.803 *1.000
SOD activity0.5120.2230.506 **−0.481−0.408−0.5000.482−0.6941.000
POD activity−0.809 **−0.933 **−0.760 *0.824 **0.806 *0.817*−0.6940.5190.0631.000
Note: * indicates 0.01 < p < 0.05, significant correlation; ** indicates p < 0.01 a highly significant correlation.
Disclaimer/Publisher’s Note: The statements, opinions and data contained in all publications are solely those of the individual author(s) and contributor(s) and not of MDPI and/or the editor(s). MDPI and/or the editor(s) disclaim responsibility for any injury to people or property resulting from any ideas, methods, instructions or products referred to in the content.