Article

The Effects of Different Crop Rotations on the Quality of Saline Soils in the Yinbei Plain

1
College of Agriculture, Ningxia University, Yinchuan 750021, China
2
College of Forestry and Grassland, Ningxia University, Yinchuan 750021, China
*
Author to whom correspondence should be addressed.
Agronomy 2025, 15(9), 2131; https://doi.org/10.3390/agronomy15092131
Submission received: 5 August 2025 / Revised: 28 August 2025 / Accepted: 1 September 2025 / Published: 5 September 2025
(This article belongs to the Section Innovative Cropping Systems)

Abstract

Rice cultivation has the ability to ameliorate saline soils, but this monoculture pattern can lead to negative plant–soil feedback. In a previous study, we investigated the effects of long-term rice cultivation on saline soil chemistry, salt ions, root characteristics, and agglomerate formation, and concluded that the optimal rice planting period is 5 years. However, we do not know which crop rotation is most effective in improving this negative soil feedback and enhancing soil quality. In this study, we carried out an experiment on saline land planted with rice over 5 years and set up four different rotations, including rice–Hunan Jizi, rice–maize, rice–sweet sorghum, and rice–soybean, with perennial rice planting as CK, to analyze soil texture under different treatments. Physicochemical properties and enzyme activities were also analyzed under different treatments, and the soil quality index (SQI) was constructed using principal component analysis and correlation analysis for comprehensive evaluation of each treatment. The results showed that (1) the saline-alkali soil texture of perennial rice planting in the Yinbei Plain was silty soil, and different rice drought rotation methods changed the soil texture from silty to silty loam, which improved the fractal dimension of the soil. The fractal dimension of saline-alkali soil was significantly positively correlated with the clay volume content, negatively correlated with silt volume content, and negatively correlated with sand volume content. (2) There was no risk of structural degradation (SI > 9%) in saline-alkali soil planted in perennial rice, and it appeared that RS (rice–soybean) could improve the stability coefficient of soil structure in the 0~40 cm soil layer. (3) Different rice and drought rotation methods could significantly affect the physical and chemical properties and enzyme activities of soil, and the quality of soil in the 0~40 cm soil layer was evaluated; RS (rice–soybean) and RC (rice–maize) were suitable for rice drought rotation in the Yinbei area. The structural equation model showed that salinity and soil nutrients were the key factors restricting the improvement of saline-alkali soil quality in Yinbei. These results will deepen the current understanding of bio-modified saline soils.

1. Introduction

Saline soil is a collective term for various types of soil formed by natural or man-made causes that adversely affect their physical and chemical properties [1]. The accumulation of excessive soluble salts in saline soils causes the degradation of soil structure and reduced fertility, which adversely affects the normal growth and development of crops [2]. The global area of arable land is approximately 1.5 × 10⁹ hectares, with salinized soil accounting for about 23%, totaling approximately 0.34 × 10⁹ hectares [3]. In China, the total area of saline-alkali land is about 3.67 × 10⁷ hectares, of which 13 million hectares have agricultural potential. These saline-alkali lands are widely distributed in northeast and northwest China, the Hetao Plain in the middle and upper reaches of the Yellow River, and northern and coastal areas of the country [4]. The area of saline-alkali cultivated land in the Yinchuan Plain of Ningxia has reached 100,000 hectares, accounting for about 58% of the total saline-alkali land area in Ningxia. Due to its location in a temperate semi-arid and arid region, the evaporation in the Yinchuan Plain is far greater than the precipitation. Moreover, factors such as long-term flood irrigation have resulted in widespread salinization in the Yellow River irrigation area, leading to weaker soil fertility and lower agricultural productivity [5].
Production practice and scientific research show that planting rice is one of the most effective biological improvement measures for improving and utilizing saline-alkali land [6]. However, the water consumption of rice during the planting season is high, which can easily cause local water shortages, and this single planting mode leads to negative plant–soil feedback, creating a series of problems such as soil compaction, soil ecological imbalance, and deterioration of agricultural product quality [7]. Conversely, rotating dryland crops such as corn, sorghum, cotton, and forage can significantly reduce water consumption, break down barriers to continuous cropping, improve soil structure, and increase crop yields [8].
Rice drought rotation is a common planting method in China and internationally, and there have been many studies on the physical and chemical impacts of rice drought rotation on soil, microbial community, and crop growth and development [9,10,11,12]. Therefore, this study investigated the changes in saline-alkali soil texture composition and soil physical and chemical properties under different rice and drought rotation methods, and calculated the fractal dimension of soil particles and the stability coefficient of soil structure to quantify and evaluate dynamic changes in soil particles and soil erosion resistance [13,14]. The soil quality index (SQI) is widely used to assess the effects of anthropogenic and natural factors on soil quality due to its quantitative and flexible nature, and the introduction of the SQI in this study can incorporate the above indexes to comprehensively and effectively evaluate the changes in saline soil quality by different crop rotation practices [15,16]. The objectives of this study were (1) to investigate the effects of different crop rotations on saline soil texture, physical and chemical properties, and enzyme activities; (2) to understand the intrinsic relationship between saline soil texture, physicochemical properties, and enzyme activities; and (3) to elucidate the key limiting factors affecting saline soil quality through soil quality index, Mantel correlation analysis, and structural equation modeling. Overall, these results will deepen the current understanding of biologically ameliorated saline soils.

2. Materials and Methods

2.1. Site Description

The experiment was carried out at the Greencomb Family Farm in Pingluo County (mean elevation 1060.5 m, 38°46′14″ N, 106°33′11″ E). The study area has a typical semi-arid continental climate, with average annual temperatures ranging from −20.5 to 35.8 °C, an average temperature of 9.8 °C, and average annual precipitation of 186.5 mm, evaporation of 1708.7 mm, annual humidity of 51%, frost period of 194.6 days, and frost-free period of 171, with 3008.6 h annual sunshine hours on average. The soil types at the study sites are all secondary saline-alkali soils formed after irrigation by the Yellow River. The properties of the 0–40 cm soil layer are shown in Table 1 below.

2.2. Experimental Design and Management

The core idea of biological improvement saline-alkali land technology is to break the cycle of rising salinity and promote salt leaching. Combined with the adjustment of local agricultural structure, we selected 4 rotation crops with strong salt and alkali tolerance, different crops have their own emphasis on the mechanism of reducing soil salinity, soybean and corn root growth can effectively improve soil structure, sweet sorghum can reduce groundwater level and reduce water evaporation through deep root absorption, Hunan millet mainly reduces soil bulk density, improves soil porosity, and promotes salt leaching [17,18]. The experiment employed a single-factor randomized block design, with rice cultivation throughout the year used as the control (CK). Four crop rotation treatments were established: rice–Hunan millet (RHMD), rice–corn (RC), rice–sweet sorghum (RSS), and rice–soybean (RS), totaling five treatments, each with three replicates. Among them, the control treatment was a large-area trial, and the other four treatments were small-area trials, with each small area covering 35 m2 (5 m × 7 m), around which protective rows were set up. The rice cultivation method used was dry direct seeding, with a seeding rate of 337.5 kg·hm−2. Before sowing, we applied sufficient base fertilizer, including compound fertilizer (N:P:K = 15:15:15) at 225 kg·hm−2, diammonium phosphate at 300 kg·hm−2, and calcium superphosphate at 375 kg·hm−2 during the seedling stage. The community trial was conducted the following year after the current rice harvest season. The subsequent crops—Hunan millet, corn, sweet sorghum, and soybeans—were all locally bred or selected through years of trials as salt-alkali-tolerant varieties suitable for local cultivation (the rice variety was Ningjing 48; Hunan millet, Haizi No. 1; maize, Xianyu 1225; sweet sorghum, Green Giant; and soybean, Chengdou 6). Seeding was carried out in mid-to-late May of 2024, with 450 kg·hm−2 of compound fertilizer (N:P:K = 15:15:15) applied during the seeding period. During the trial period, weeds were regularly removed from paddy fields and dry fields. After the previous crop was harvested, approximately 5 cm of crop residue was retained for return to the field. Other field management measures (cultivation methods, water management) were consistent with local practices.

2.3. Collection of Soil Sample and Preparation

Soil samples were collected in late September 2024 after the harvest of the stubble crop. Five 1 m × 1 m sample squares were randomly set up in each treatment plot, and soil samples of 0–20 cm and 20–40 cm were collected with soil augers in the sample squares in an “S” shape, mixed in layers and then air-dried and sieved. The 0–20 cm and 20–40 cm soils were also collected with a ring knife for the determination of bulk density (BD) and porosity. In this article, we characterized the particle size distribution and soil quality of the 0–40 cm soil layer using arithmetic means for the 0–20 cm and 20–40 cm soil horizons. Soil particle composition was determined using a Mastersizer 3000 laser particle sizer(model: WINNER 2009, China Jinan Micro-Nano Technology Co., Ltd., Jinan, China) from Malvern, UK, and soil particles were classified using the USDA classification system. A water–soil ratio of 1:5 was mixed and rested before the reference soil pH was acquired directly using a pH meter; a conductivity meter (Model DDS-11 Shanghai Leimagnet, Shanghai, China) was used to determine conductivity; organic matter (OM) content was determined by a volumetric method with potassium dichromate; alkaline nitrogen (AN) content was determined by an alkaline diffusion method; available phosphorus (AP) content was determined by a 0.5 mol·L−1 sodium bicarbonate immersion–molybdenum antimony colorimetric method; available potassium (AK) content was determined using a 1 mol·L−1 ammonium acetate solution immersion–flame photometer method; soil urease (urease, Ure) activity was determined by way of sodium phenol–sodium hypochlorite colorimetric assay; soil catalase (Cat) activity was determined by KMnO4 titrimetric assay; and soil alkaline phosphatase (alkaline phosphatase, ALP) activity was determined by colorimetric assay with 3,5-dinitrosalicylic acid.

2.4. Soil Particle Fractal Dimension (D), Soil Structural Stability Coefficient (SI), and Soil Quality Index (SQI)

The fractal dimension of soil particles was calculated according to the equation [19].
log V r < R i V T = ( 3 D ) log R i R m a x
where r is the particle size; R i is the class i particle size in the particle size partition; V r < R i is the cumulative volume of soil particles with a particle size less than t; V T is the total volume of all particles in the soil; and R m a x is the largest particle size in the soil particles, and R m a x = 2000 μm in this study. The soil fractal dimension can be obtained by taking the logarithm on both sides of the formula at the same time, the fitting slope of the logarithmic curve can obtain the soil fractal dimension, the fitting straight line slope is (3 − D), and the soil particle volume fractal dimension is D.
The soil structural stability index (SI, %) is calculated according to the equation [20].
S I = O M ( S i l t + C l a y ) × 100 ;   0 S I <
where OM is the soil organic matter content and (Silt + Clay) is the total content (%) of clay and fine particles in the soil. SI > 9% indicates structural stability, 7% < SI ≤ 9% indicates low risk of structural degradation, 5% < SI ≤ 7% indicates high risk of structural degradation, and SI ≤ 5% indicates structurally degraded soils.
We calculated the soil quality index (SQI) using the following steps [21]:
(1)
The principal component analysis (PCA) was used to analyze the 16 soil indicators, extract the common factor variance of each indicator, and calculate the ratio of the common factor variance of the indicators to the sum of the common factor variance to obtain the weight value of each indicator.
(2)
A linear computational model was used to convert the soil indicator data into dimensionless scores from 0 to 1. In this study, the “more the better” (3) and the “less the better” type indicator scoring functions (4) were used.
S i = X i X m i n X m a x X m i n
S i = X m a x X i X m a x X m i n
where S i represents the linear index score (0~1), X i represents the measured value of the index, Xmax represents the maximum value of the index, and Xmin represents the minimum value of the index.
(3)
The soil quality index (SQI) was calculated using Equation (5), with higher SQI values indicating better soil quality.
S Q I = i = 1 n W i S i
where SQI is the soil quality index, W i is the weight value of the i index, and S i is the score of the i th index.

2.5. Statistical Analysis

One-way ANOVA, principal component analysis, and Duncan’s multiple range test were performed using SPSS 24.0, while Spearman’s correlation analysis was used to examine the correlation between soil indicators. Origin 2023 and R (version 4.3.0) software were used for graphing, and the data in the charts are expressed as the mean ± standard error.

3. Results

3.1. Effect of Different Crop Rotations on Soil Particle Composition

Soil particles are categorized into three groups according to the USDA classification system: clay particles (<2 μm), meal particles (2–50 μm), and sand particles (>50 μm). As can be seen from Figure 1, the soil particle composition of the 0~40 cm soil layer of perennial rice (CK) had the highest volume content of powder particles (about 90.35%), and the volume content of clay particles and sand particles was lower, compared with CK, the different rotational treatments could significantly change the distribution of soil particles in the 0~40 cm layer of the soil (p < 0.05), and there was no significant difference between the different rotational methods. The law of change in soil particle composition in the 0~40 cm soil layer under different crop rotations was as follows: the volume content of clay particles increased by about (16~18%), the volume content of sand particles decreased, but the overall volume content of powder particles was still the highest (about 81%), and the soil texture was gradually transformed from chalky soil to chalky loam.

3.2. Effect of Different Crop Rotations on Fractal Dimension and Structural Stability Indices

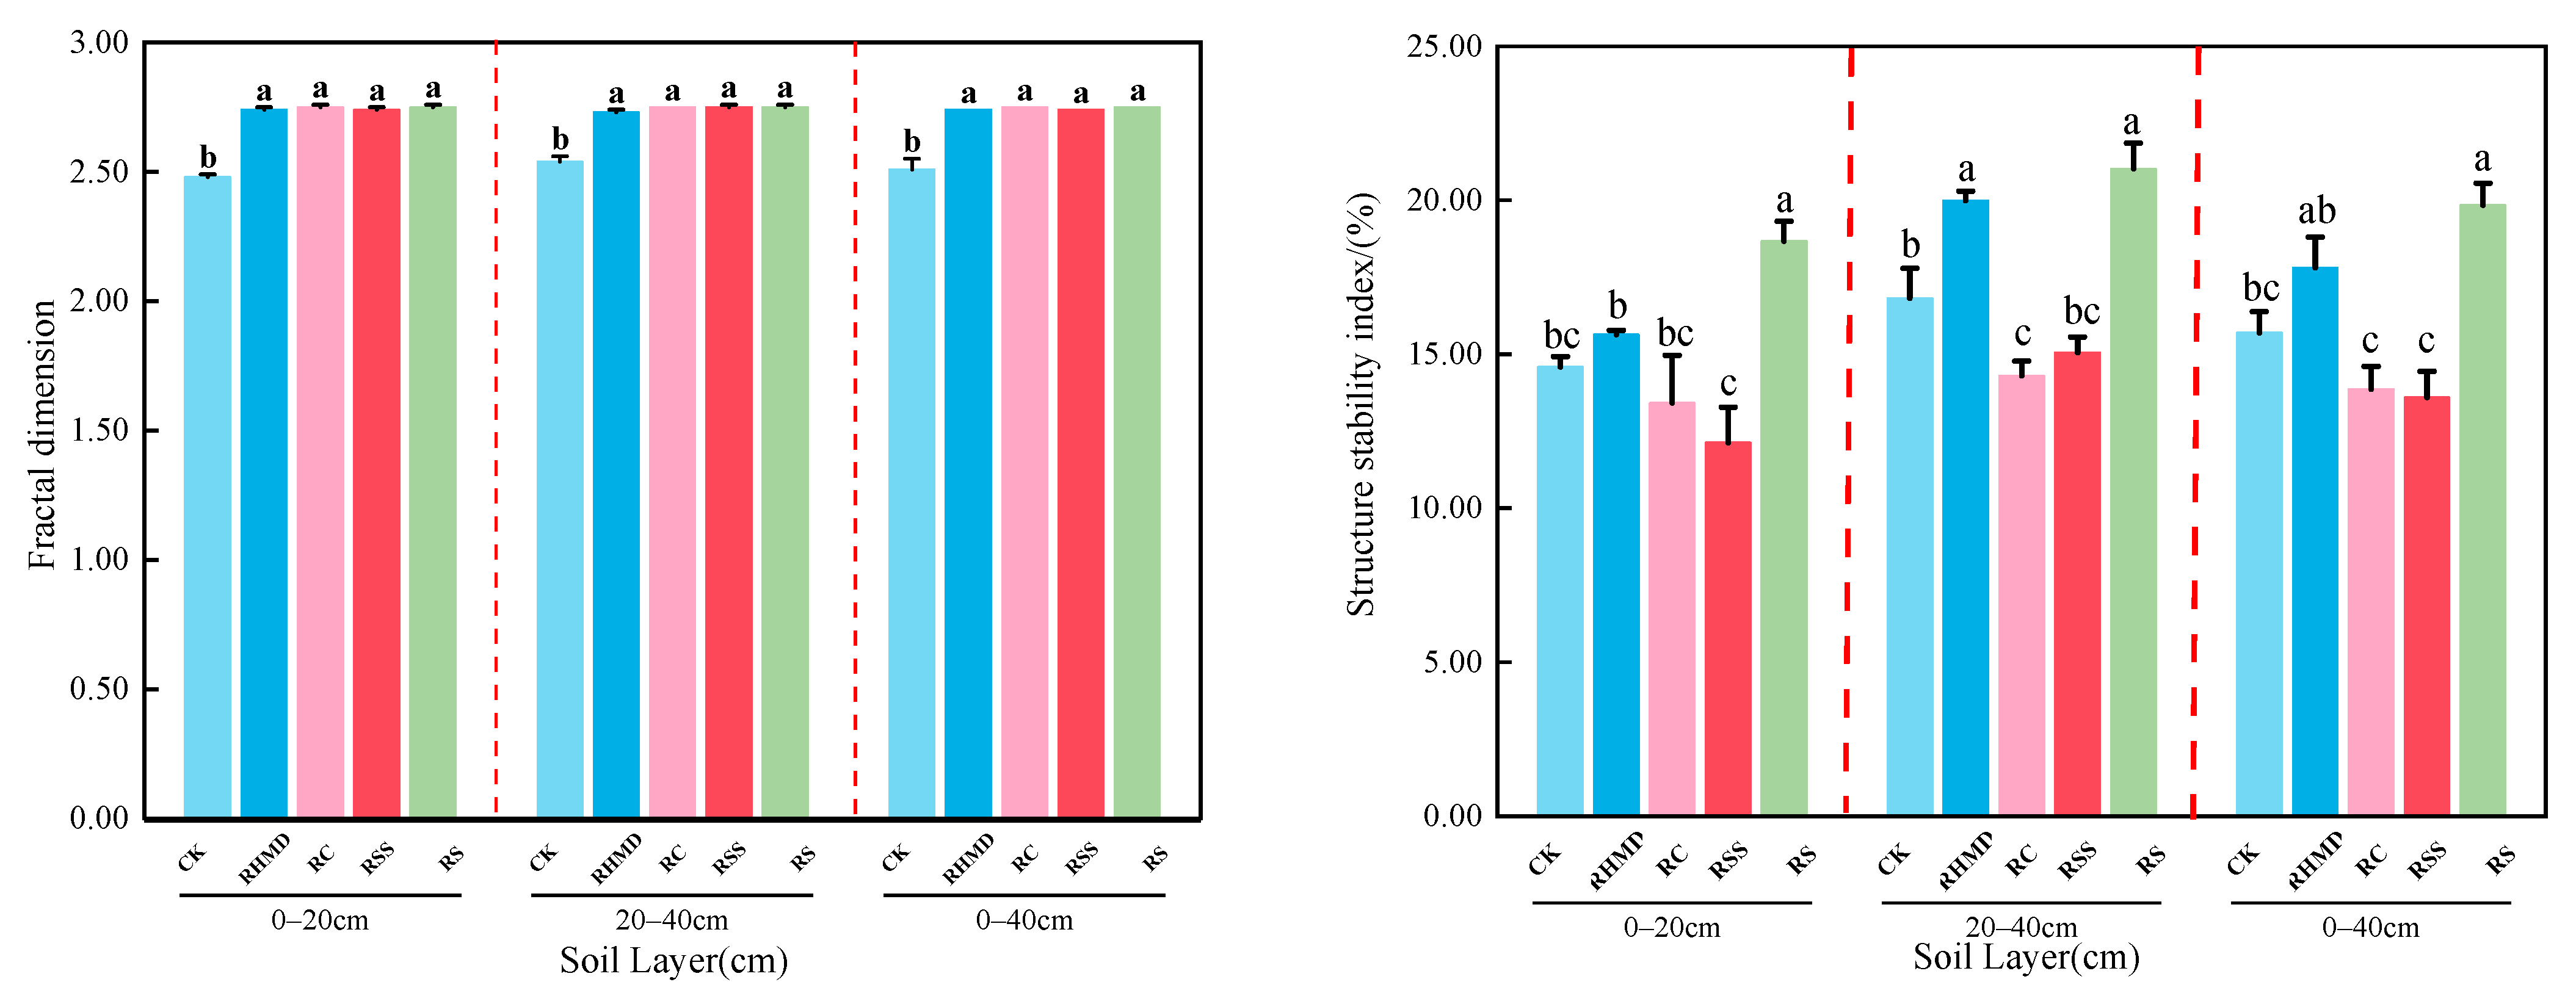
As can be seen from Figure 2, different crop rotation treatments significantly increased the fractal dimension of soil 0–20 cm soil layer and 20–40 cm soil layer compared with CK, and there was no significant difference among the crop rotation treatments. Compared with CK, RS treatment significantly increased the SI value of 0–20 cm soil layer by 27.96%, while RHMD treatment and RS treatment significantly increased the SI value of 20–40 cm soil layer by 18.85% and 24.97%, respectively. Overall, RS treatment significantly (p < 0.05) increased the SI value of 0–40 cm soil layer by 26.37% compared to CK.

3.3. Influence of Different Crop Rotations on Soil Physicochemical Properties

As shown in Table 2, different crop rotation treatments significantly altered soil physicochemical properties in the 0~40 cm soil layer (p < 0.05). In the 0~20 cm soil layer, RHMD, RC, and RS treatments significantly (p < 0.05) reduced soil pH compared with CK by 1.28%, 1.39%, and 0.93%, respectively; different crop rotation treatments significantly (p < 0.05) reduced the soil total salt content by 37.50%, 44.38%, 40.63%, 40.63%, and 36.56%, and RS treatment significantly increased soil organic matter and alkali-dissolved organic matter, 36.56%; RS treatment significantly increased soil organic matter, alkaline-dissolved nitrogen, and quick-acting potassium content (p < 0.05) by 35.28%, 24.31%, and 34.12%, respectively, compared with CK.
In the 20–40 cm soil layer, different crop rotation treatments significantly reduced soil total salt (p < 0.05) compared with CK by 33.09%, 26.62%, 35.61%, and 22.66%, respectively; RHMD and RS treatments significantly increased soil organic matter content (p < 0.05) by 21.71% and 28.04% compared with CK, and there was a significant difference compared with other rotations; the soil alkaline nitrogen content under RS treatment was the highest (74.20 mg/kg), having increased by 23.01% compared with CK, and there was a significant difference compared with other rotations; further, RSS treatment increased soil alkaline nitrogen content by 23.01% compared with CK. There were significant differences across crop rotation treatments; soil alkaline-dissolved nitrogen content was the highest under RS treatment (74.20 mg/kg), at 23.01% higher than that of CK, and was significantly different from other crop rotation treatments; RSS treatment significantly increased quick-acting phosphorus and quick-acting potassium content by 107.67% and 26.74%, respectively, compared with that of CK, and again there were significant differences between this other crop rotation treatments.
Multivariate ANOVA comparing the effects of treatments, soil horizons, and their interactions on soil physicochemical properties (Table 2) showed that treatments had highly significant effects on soil pH, total salts, organic matter, alkaline-dissolved nitrogen, quick-acting phosphorus, and quick-acting potassium (p < 0.01), while soil horizons had highly significant effects (p < 0.01) on soil bulkiness, porosity, organic matter, alkaline-dissolved nitrogen, quick-acting phosphorus, and quick-acting potassium, and highly significant effects (p < 0.05) on bulkiness and porosity (p < 0.05). Moreover, the interaction of treatment and soil layer had highly significant (p < 0.01) effects on soil quick-acting phosphorus and quick-acting potassium.

3.4. Effect of Different Crop Rotations on Soil Enzyme Activities

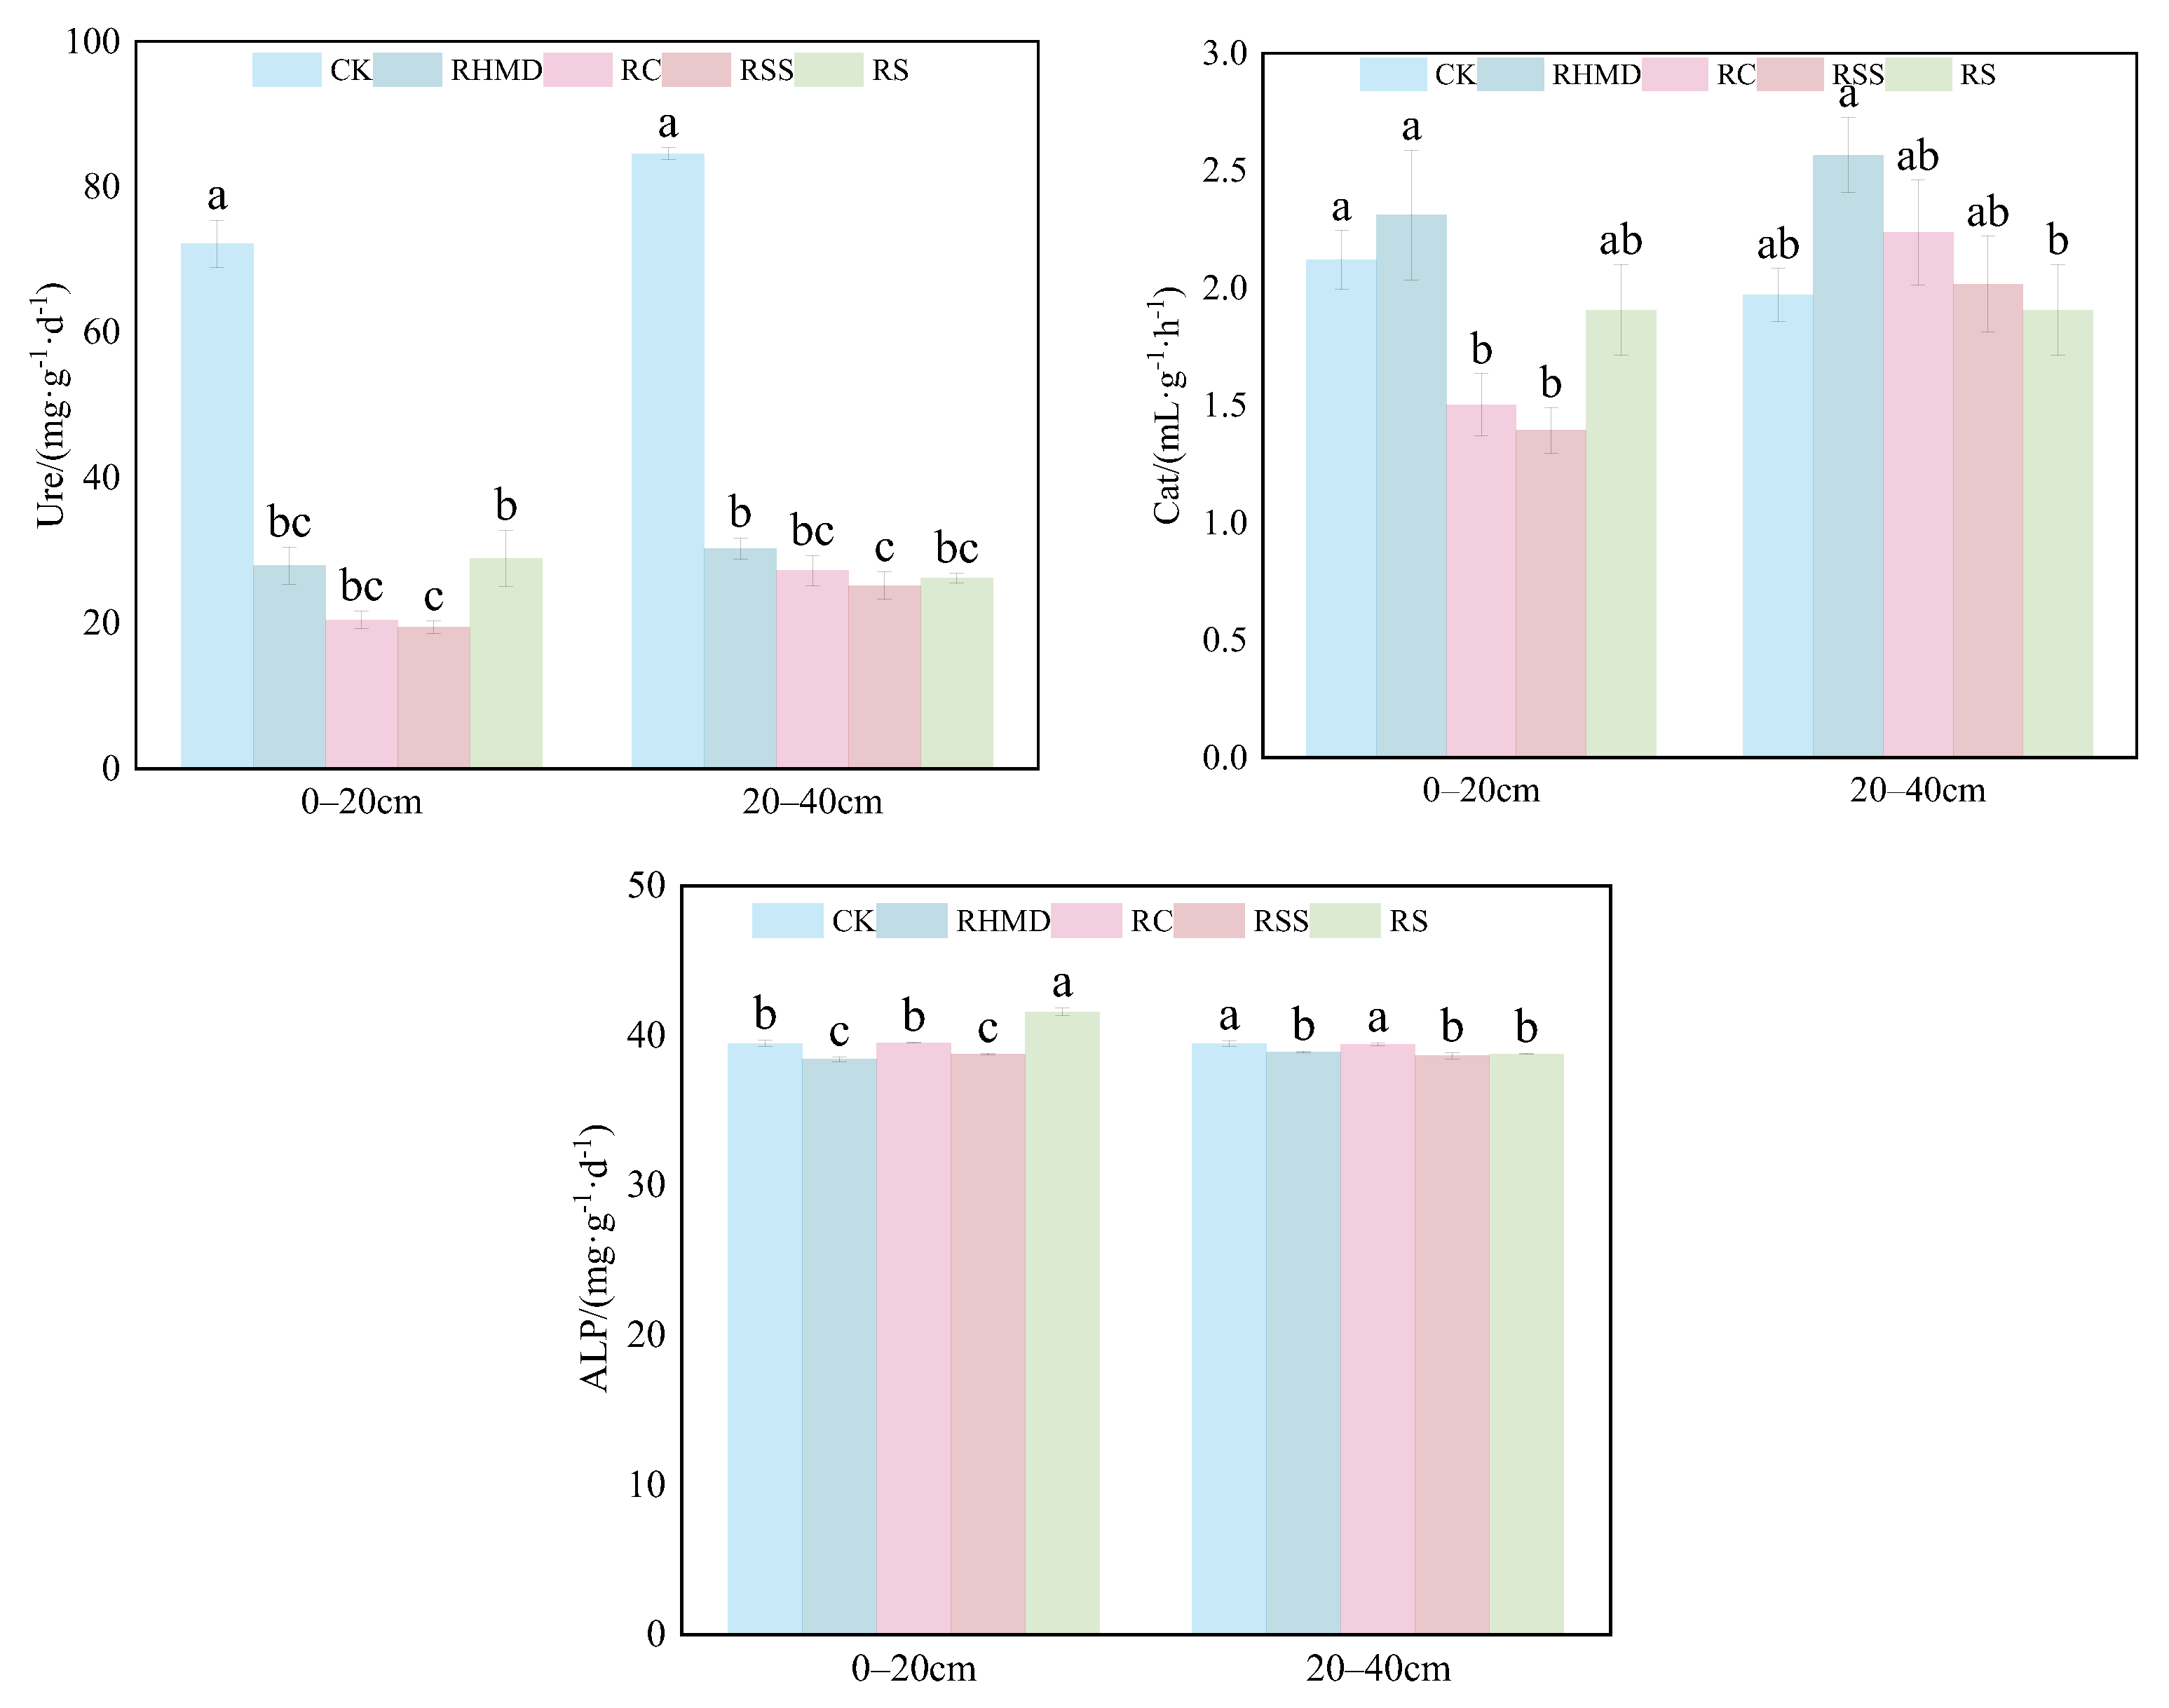
As can be seen from Figure 3, in the 0–20 cm soil layer, different crop rotation treatments significantly decreased soil urease activity (p < 0.05) compared to CK by 61.33%, 71.65%, 73.05, and 59.93%, respectively. RC and RSS treatments significantly decreased soil catalase activity compared to CK by 29.25% and 34.43%, respectively, and RHMD and RSS treatments significantly decreased soil alkaline phosphatase activity by 2.74% and 1.80%, respectively. Further, RS treatment significantly increased soil alkaline phosphatase activity by 5.34% compared to CK. In the 20–40 cm soil layer, different crop rotation treatments significantly reduced soil urease activity compared to CK by 64.22%, 67.83%, 70.19, and 69.03%, respectively, while RHMD, RSS, and RS treatments significantly reduced soil alkaline phosphatase activity compared to CK by 1.42%, 2.05%, and 1.75%, respectively.

3.5. Effect of Different Crop Rotations on Soil Quality

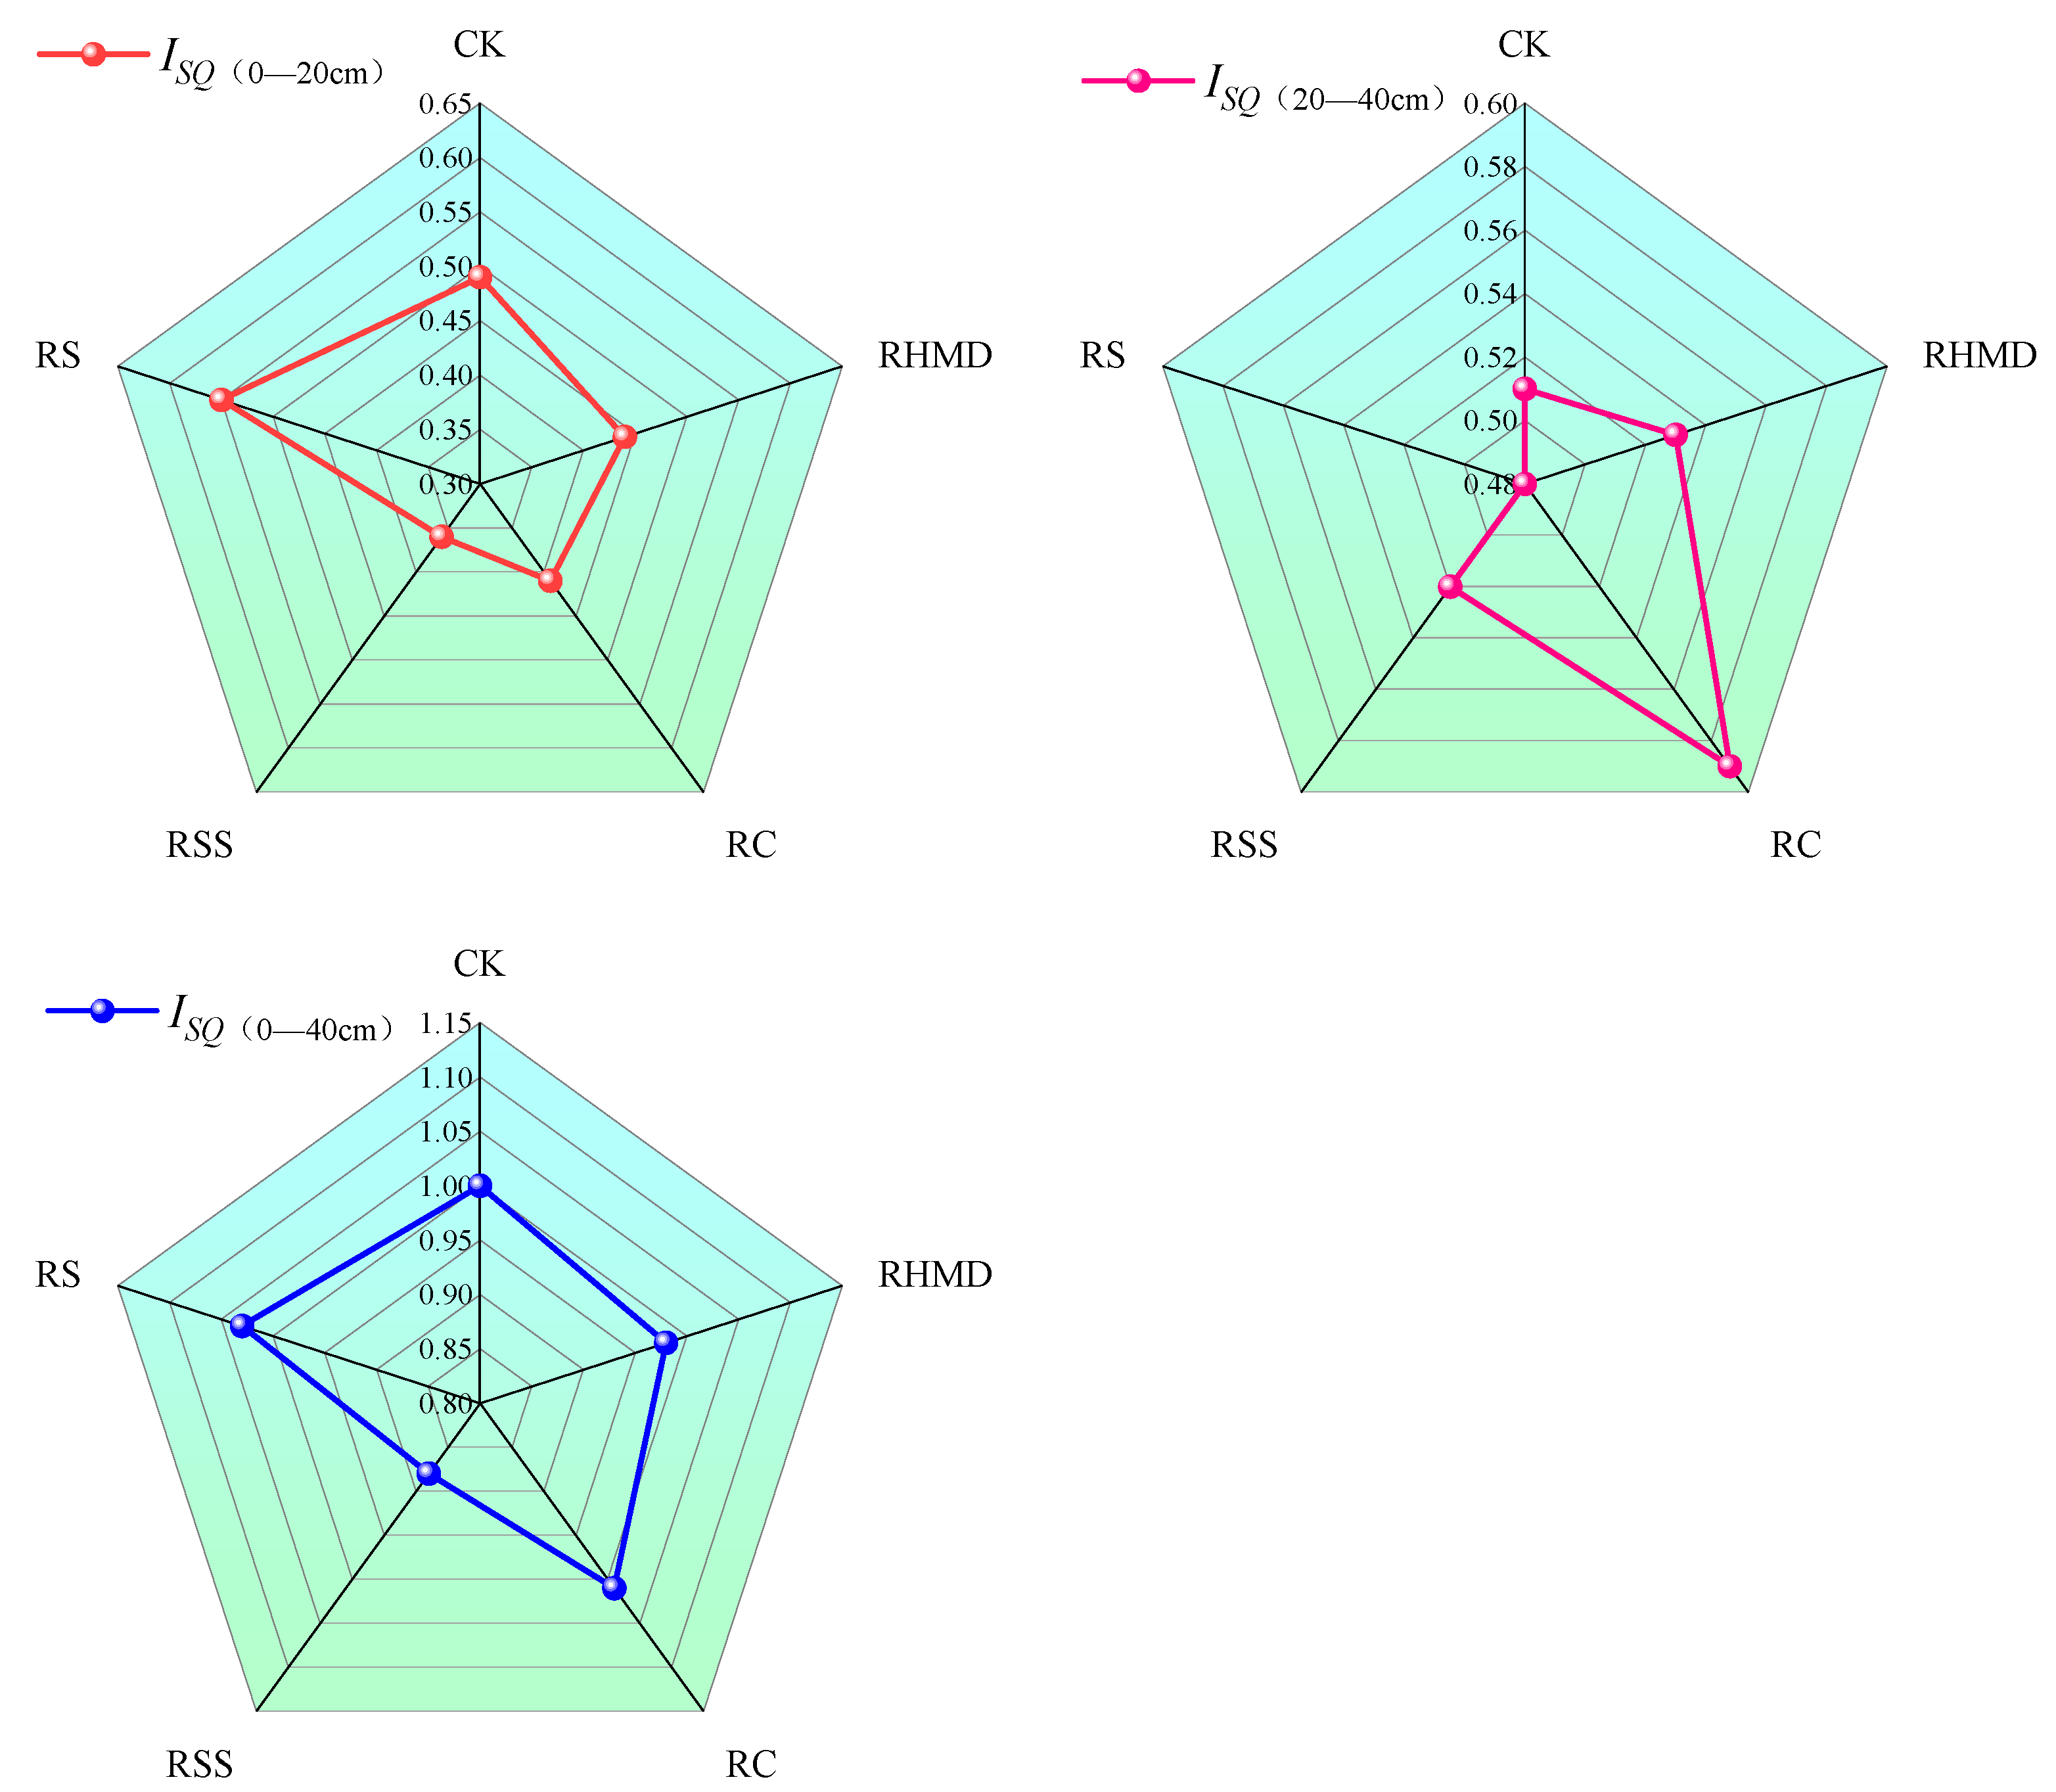
In this study, the full dataset (16 indicators in total) was applied to analyze the soil quality indices for the 0–40 cm soil layer, which can be seen in Figure 4. In the 0–20 cm soil layer, the soil quality indices under the treatments, in descending order, were RS (0.55) > CK (0.49) > RHMD (0.44) > RC (0.41) > RSS (0.36); in the 20–40 cm soil layer, these were RC (0.59) > RHMD (0.53) > RSS (0.52) > CK (0.51) > RS (0.48) in descending order; in the 0–40 cm soil layer, they were RS (1.03) > RC (1.01) > CK (1.00) > RHMD (0.98) > RSS (0.88) in descending order. In summary, the RS treatment can better improve the soil quality of the 0–20 cm soil layer, and the RC, RHMD, and RSS treatments can better improve that of the 20–40 cm soil layer. RS (rice–soybean) and RC (rice–corn) can better improve the soil quality of the 0–40 cm soil layer, and they are suitable for use in the north of the Yinbei area and the north-Yin area.

3.6. Mantel Correlation Analysis Between Soil Quality Index and Soil Texture, Physical and Chemical Properties, and Enzyme Activities

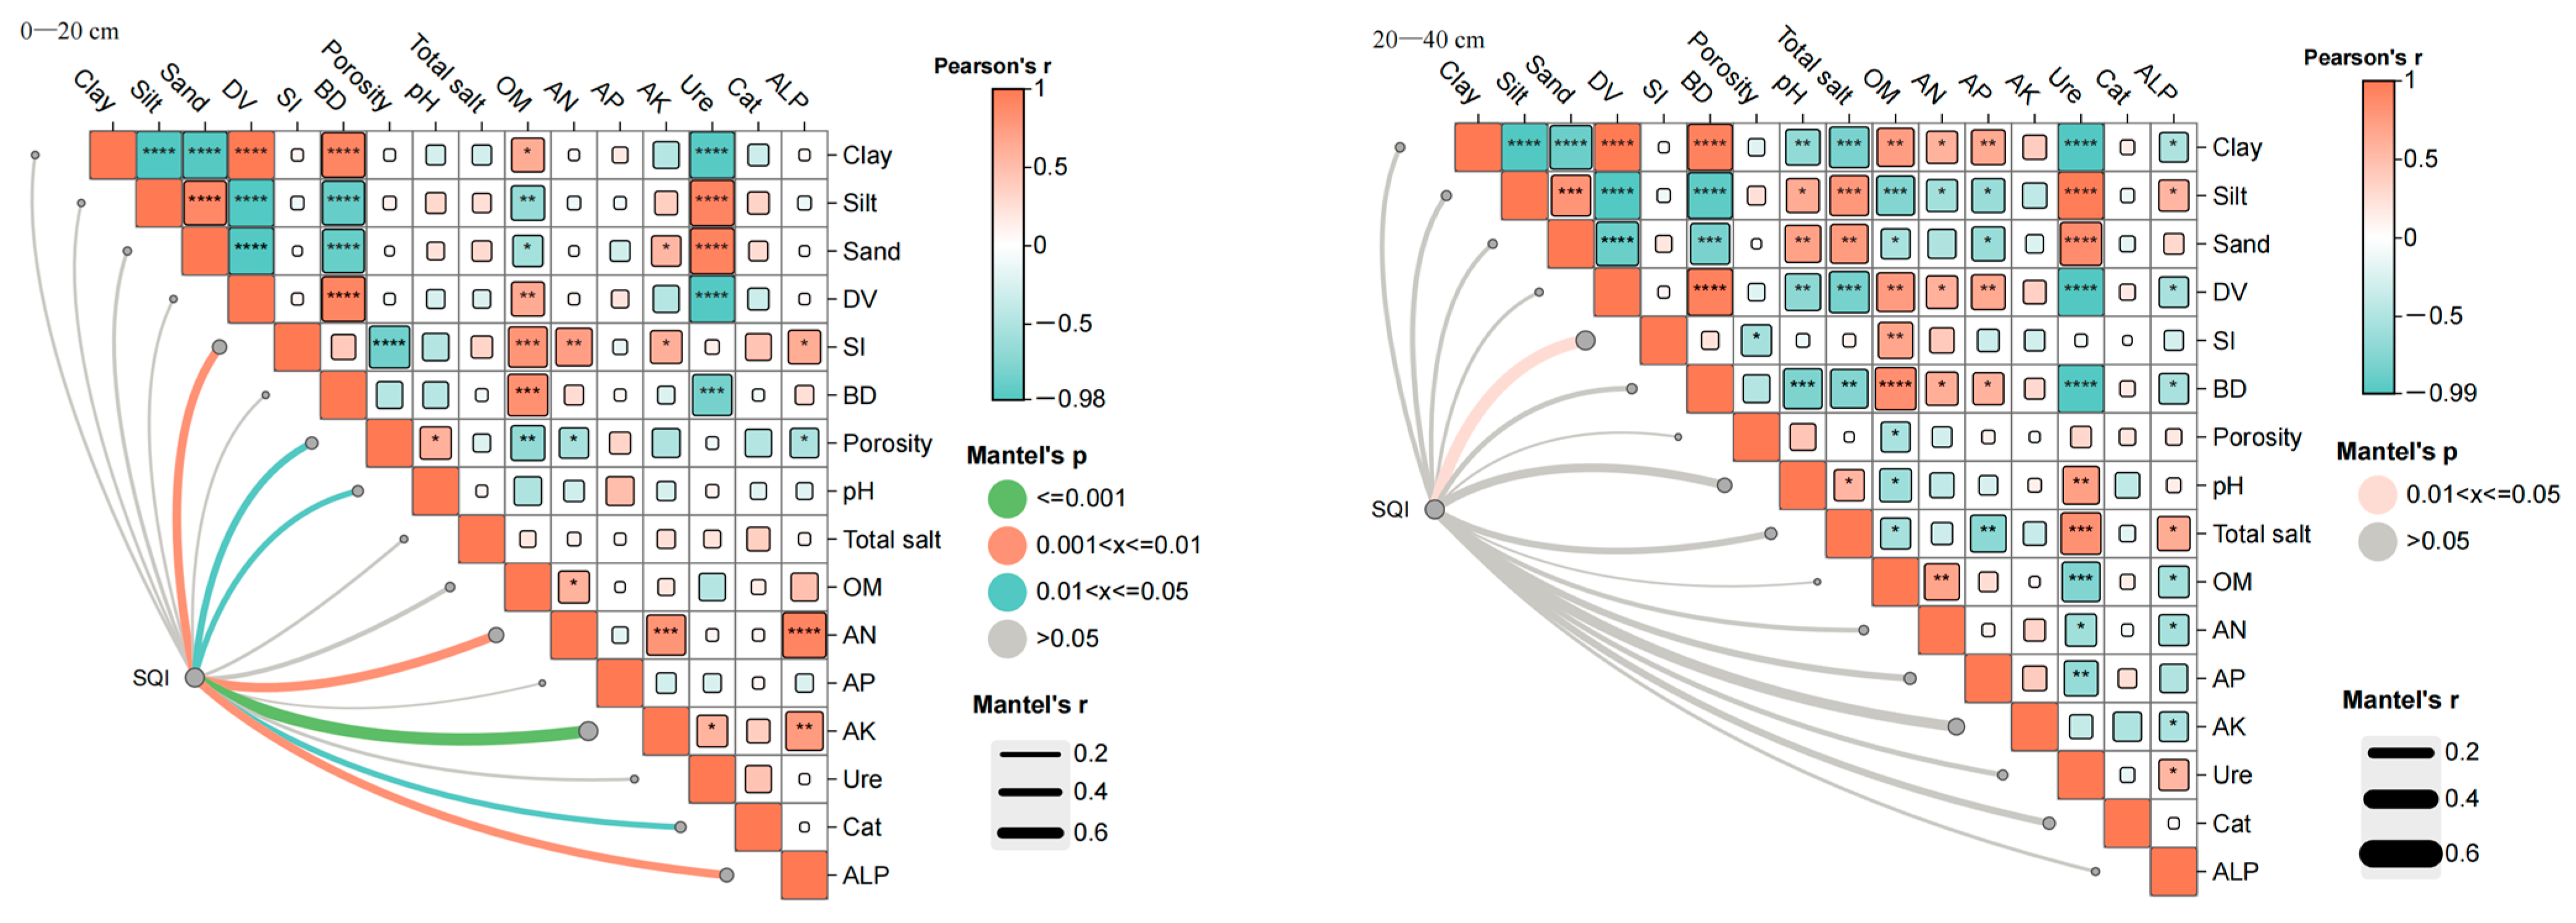
Mantel correlation analysis showed that the soil quality index of the surface layer (0–20 cm) was significantly correlated with soil structure factor, alkaline-dissolved nitrogen, and alkaline phosphatase (0.001 < p < 0.01), and was more affected by quick-acting phosphorus (p < 0.001, Figure 5, left); the soil quality index of the 20–40 cm soil layer was only affected by the soil structure factor (0.001 < p < 0.01, Figure 5, right).

3.7. Structural Equation Model

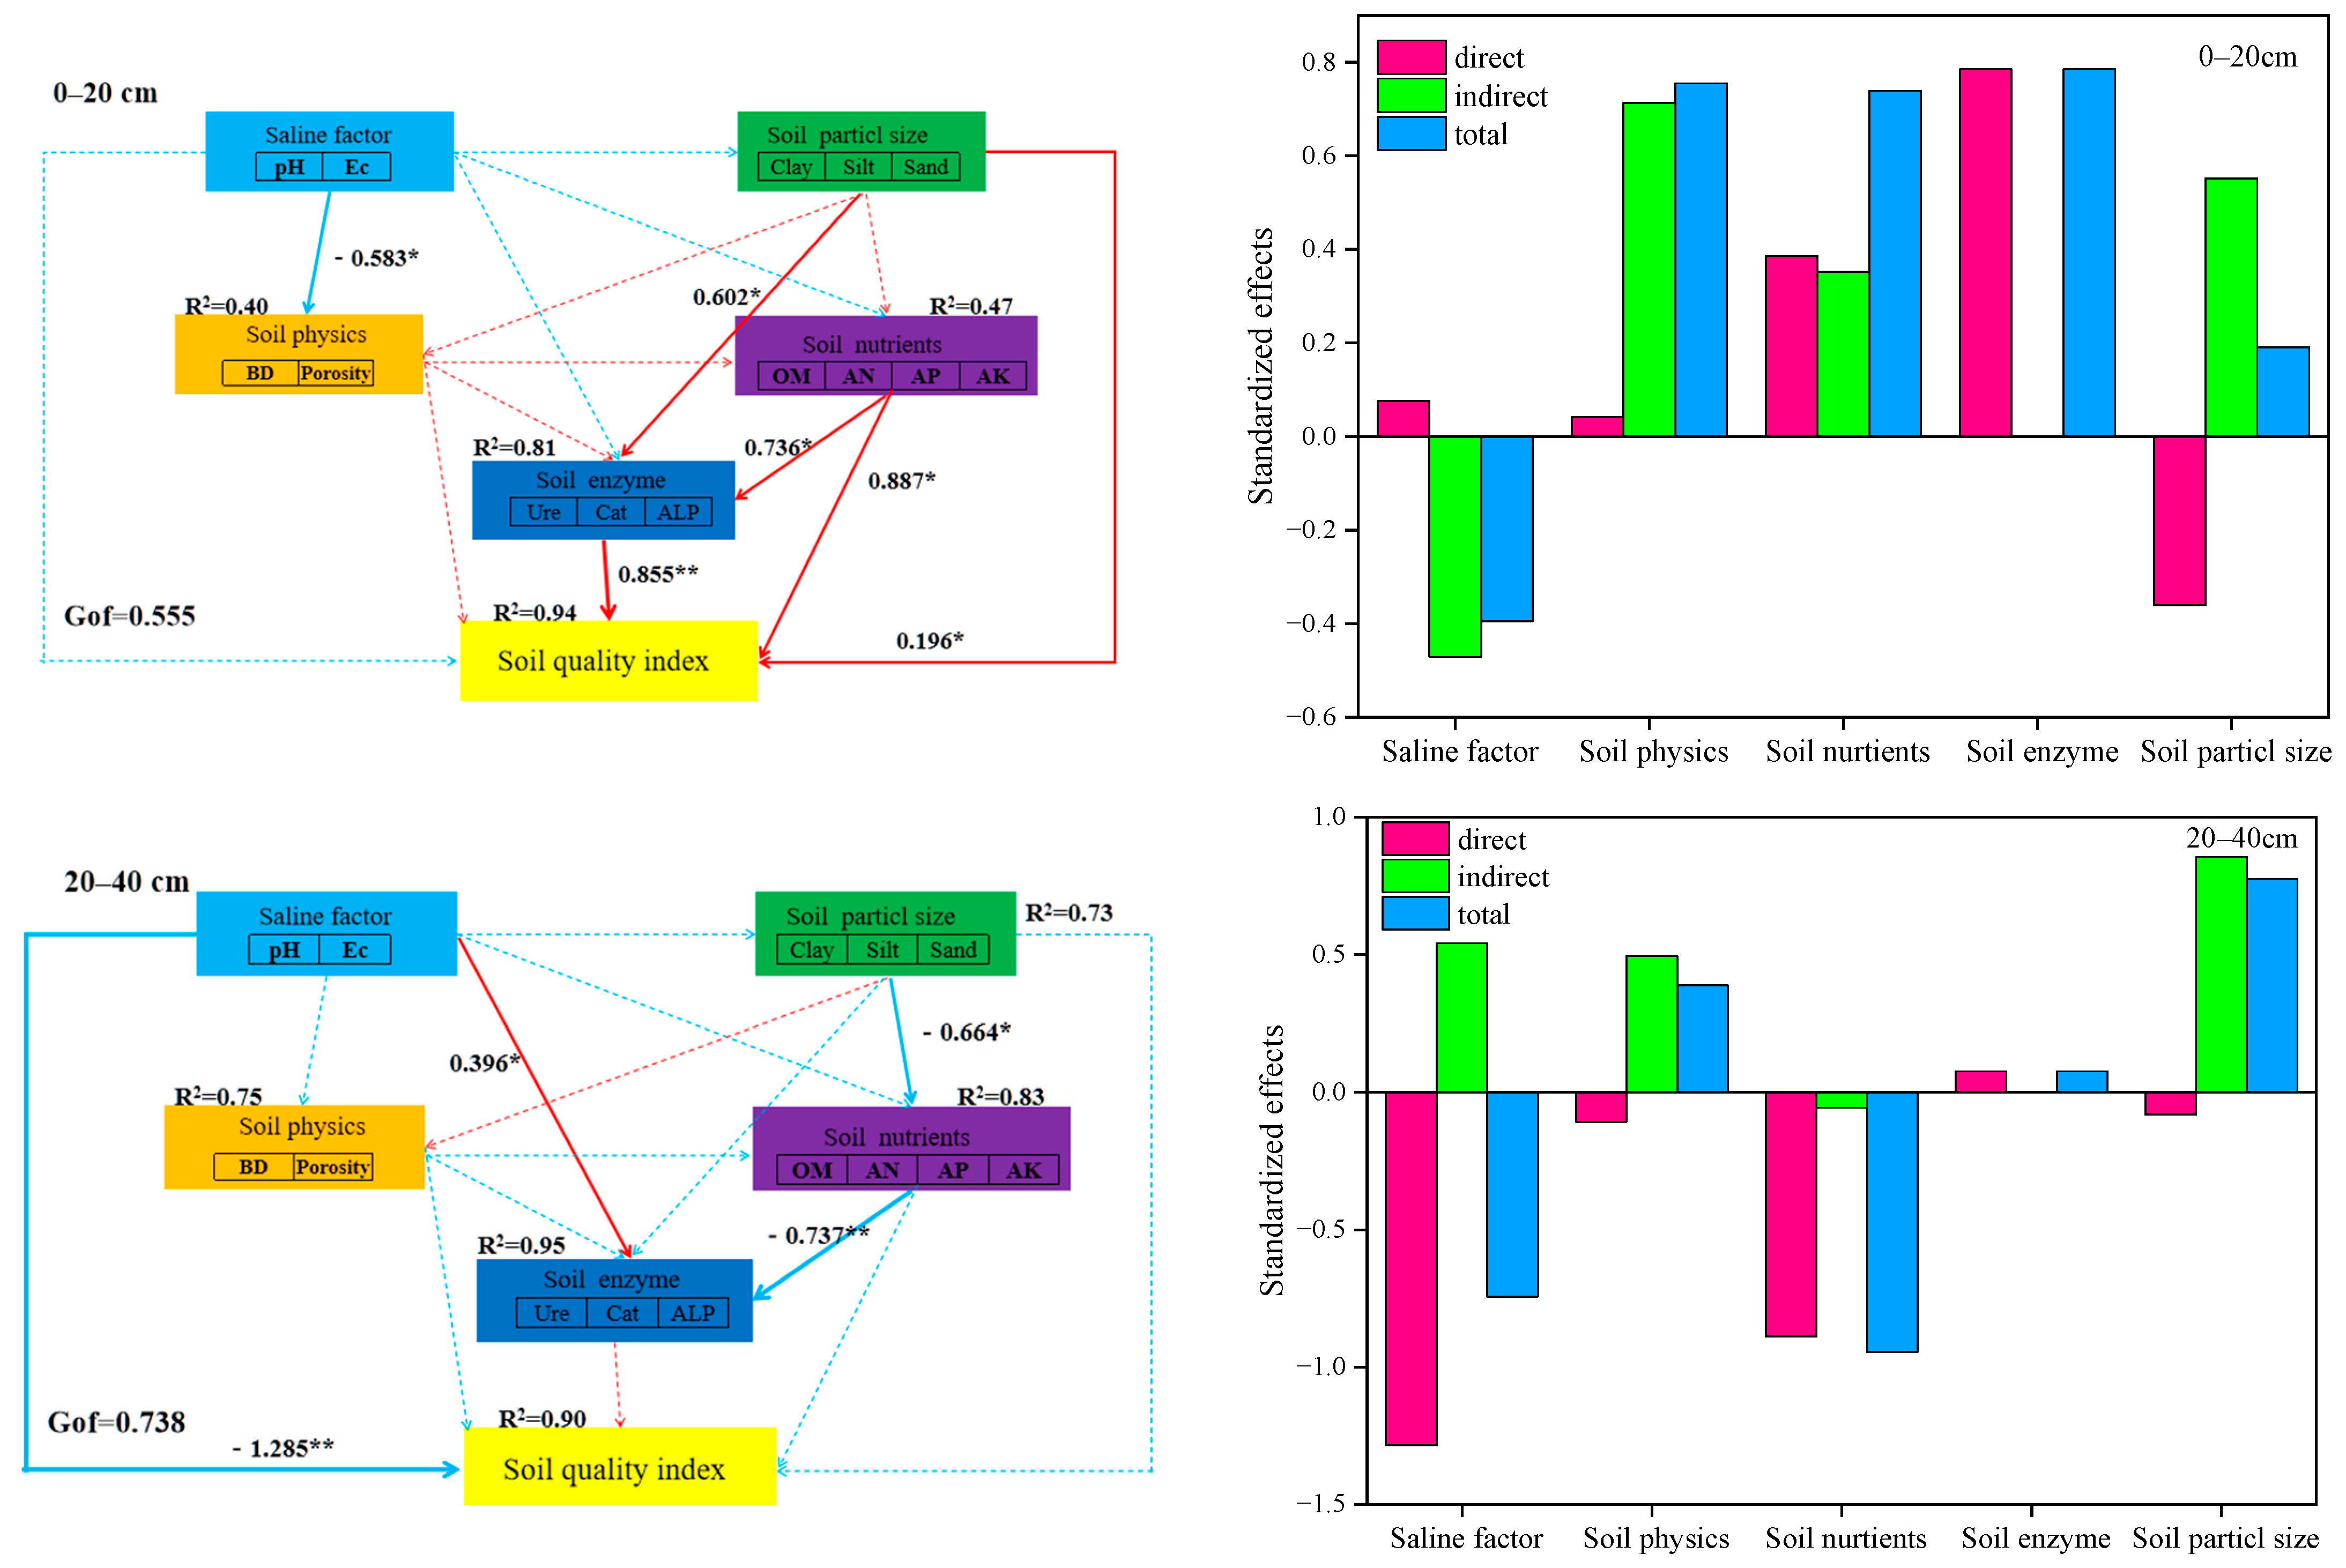
Structural equation modeling showed (Figure 6) that in the 0–20 cm soil layer, the positive factors that had a direct effect on the soil quality index were soil particles (p < 0.05), soil nutrients (p < 0.05), and soil enzyme activity (p < 0.01), with standardized path coefficients of 0.196, 0.887, and 0.855, respectively. In addition, soil physical properties were significantly inhibited (p < 0.05) by salt factors (pH, Ec). The soil quality index was significantly inhibited (p < 0.01) by the salt factor (pH, Ec) in the 20–40 cm soil layer with a standardized path coefficient of −1.285. In addition, soil enzyme activity was constrained by the salt factor (p < 0.05) and soil nutrients (p < 0.01) in the 20–40 cm soil layer with standardized path coefficients of 0.396–0.737, while soil nutrients were in turn significantly inhibited by soil particles (p < 0.05).
The total standardized effects of the structural equations showed that in the 0–20 cm soil layer, the salinity factor had the largest negative effect on the soil quality index (−0.395), and soil physical properties, soil nutrients, soil enzyme activities, and soil particles had a positive effect on the soil quality index, with total standardized effects of 0.755, 0.739, 0.785, and 0.191, respectively. In the 20–40 cm soil layer, soil nutrients had the largest negative effect on soil quality index (−0.945), indicating that crops absorbed a large amount of nutrients from the soil during growth; attention should be paid to the timely application of fertilizers to maintain soil fertility. This was followed by the salinity factor (−0.744), and soil particles had the largest positive effect on soil quality index (0.775). Overall, the salinity factor and soil nutrients were the key factors restricting the improvement of saline soil quality in north Yinbei.

4. Discussion

4.1. Effects of Different Crop Rotation Methods on Soil Particle Composition, Fractal Dimension, and Structural Stability Coefficient

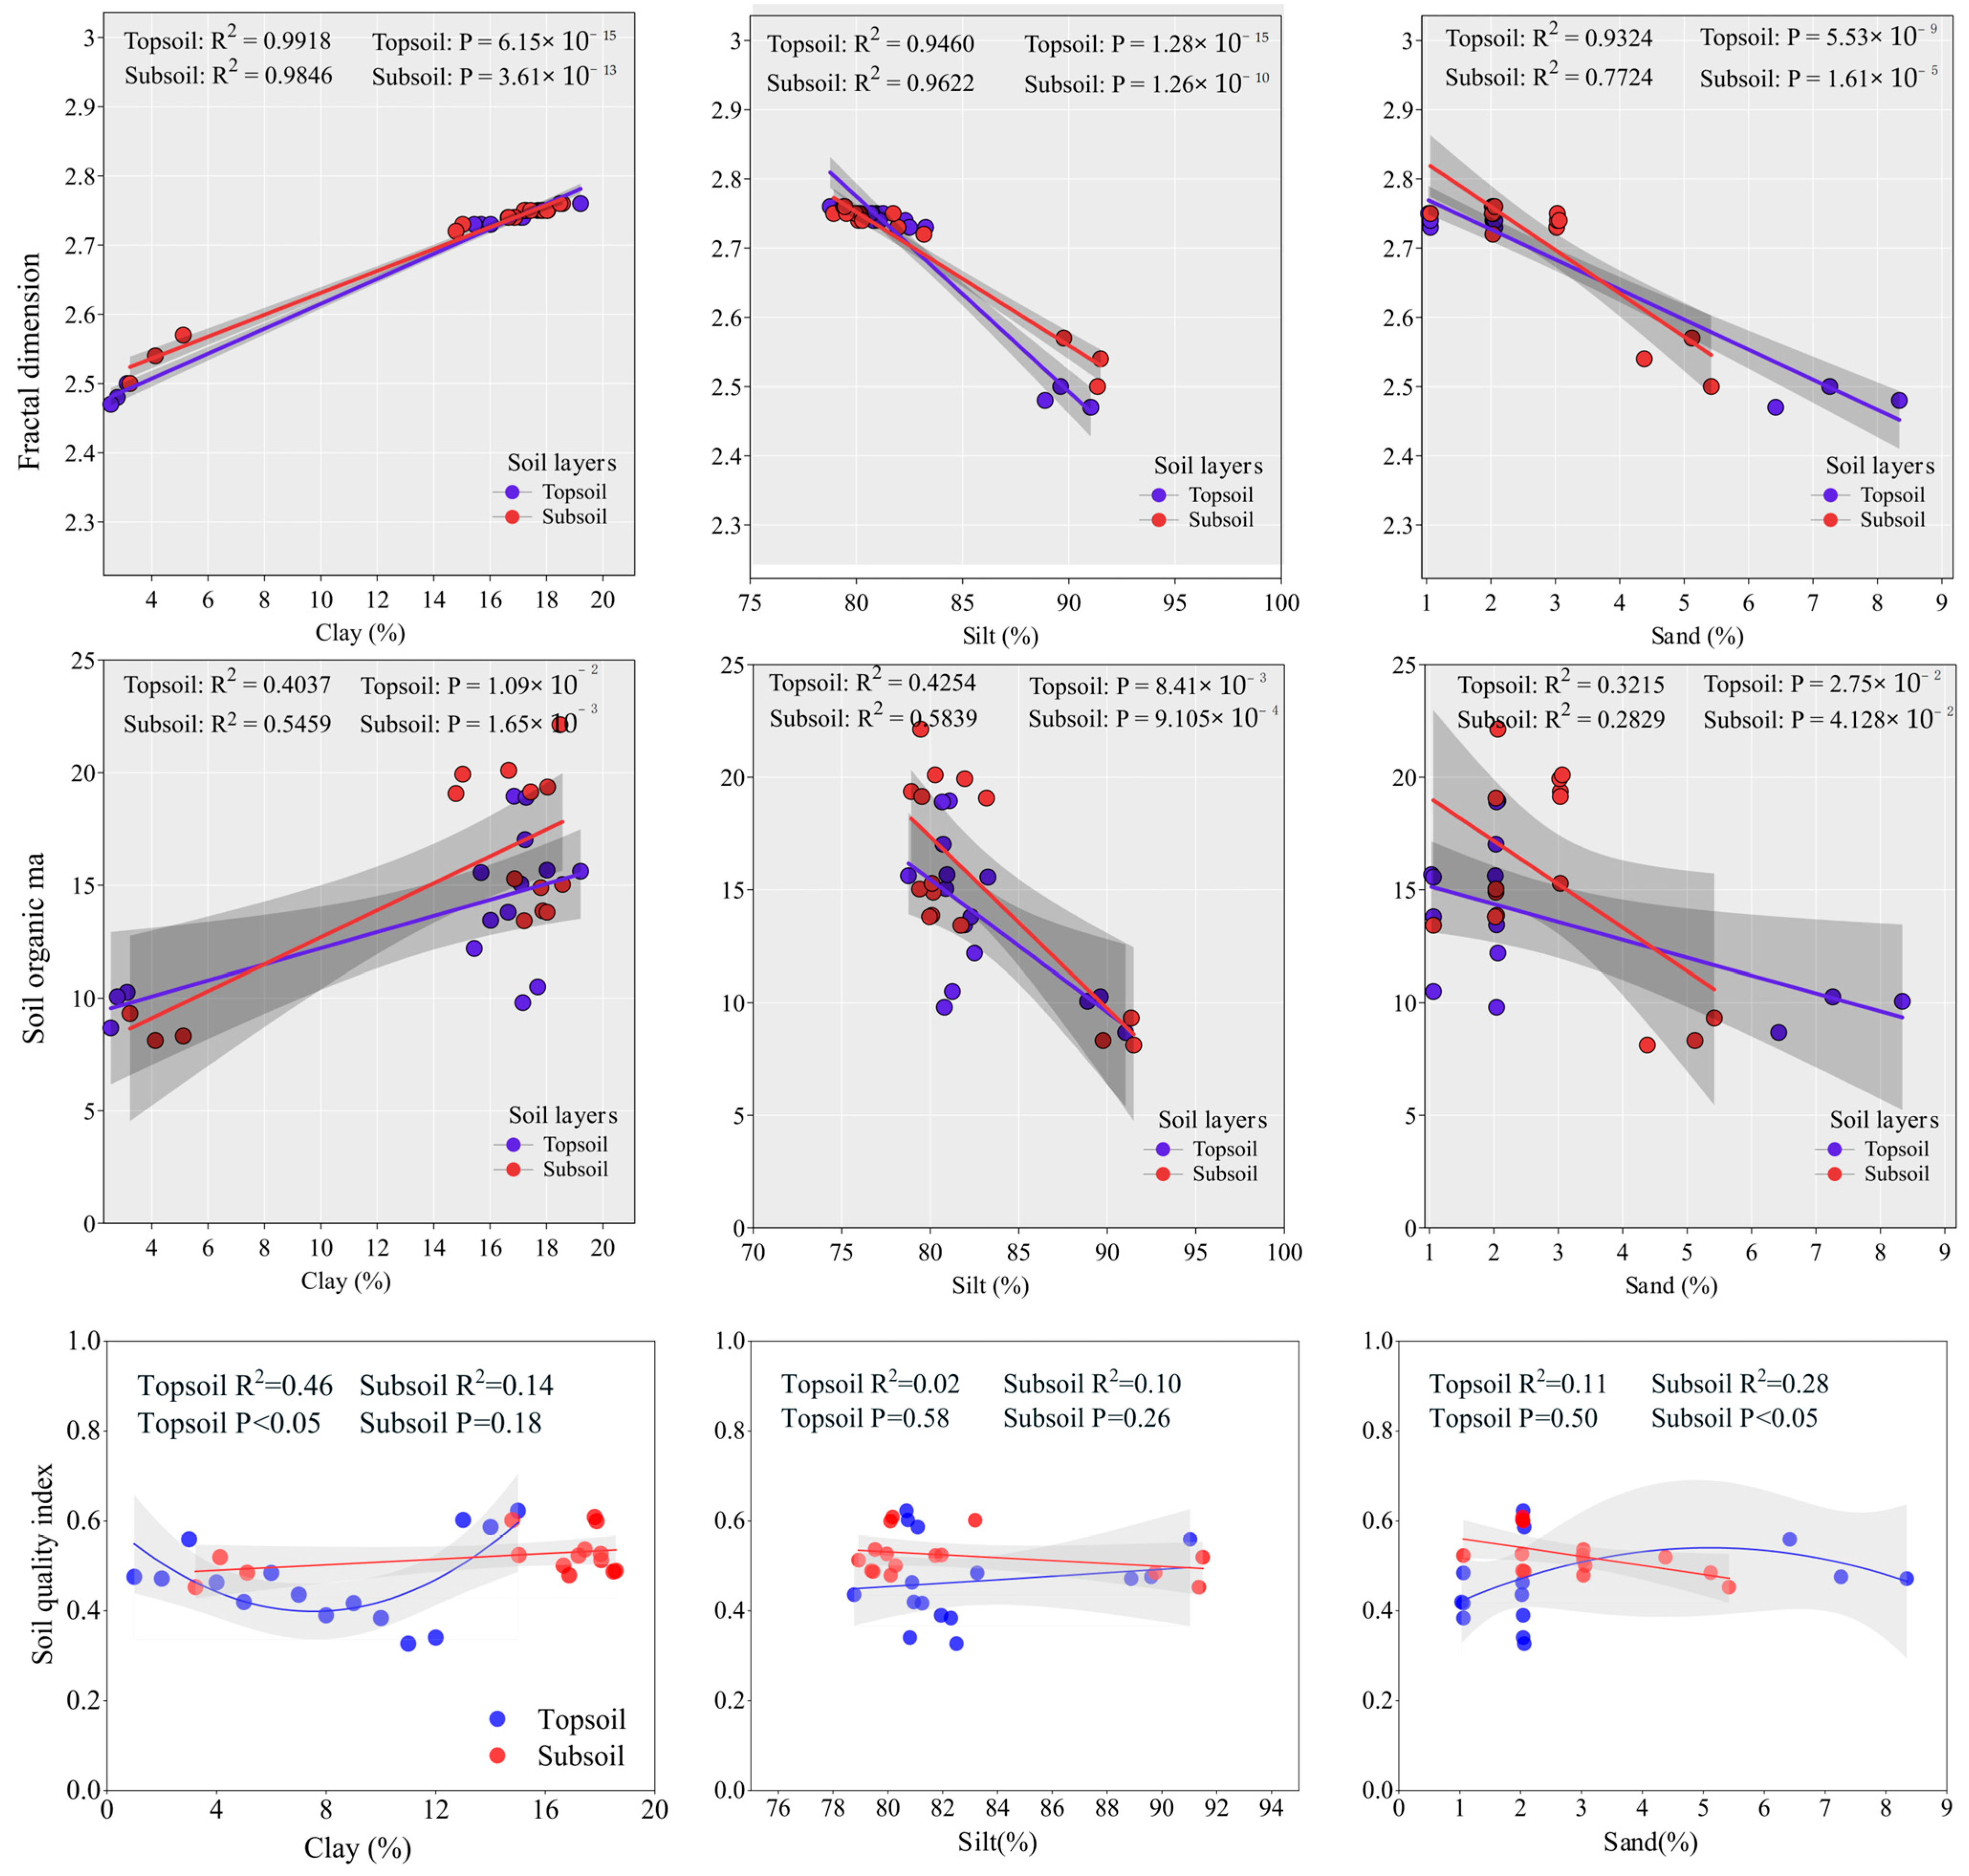
Soil particle composition is an important factor affecting the fractal dimension. Relevant studies have shown that there is a significant correlation between soil particle composition and fractal dimension number [22,23,24]. In this study, fractal dimension showed a highly significant positive correlation with the volume content of clay particles in the 0–20 cm soil layer, a significant positive correlation with the volume content of clay particles in the 20–40 cm layer, a significant negative correlation with the volume content of pulverized particles in the 20–40 cm layer, and a negative correlation with the volume content of sand particles in the 0–40 cm layer (Figure 7). There was no significant correlation between fractal dimension and sand content in this study, which may be due to the low volume content of sand particles under the conditions of this study, which was isolated and could not form an effective fractal structure, and the soil particle composition of the 0~40 cm soil layer changed significantly (clay content about 16~18% and silt content about 81%) after different crop rotation treatments (Figure 1). Therefore, in saline-alkali soils dominated by silt, the increase in clay (about 2% to 17%) began to significantly change the overall structural characteristics of 0~40 cm soil, resulting in a significant increase in fractal dimension (Figure 2), which was significantly negatively correlated with the decrease in silt (Figure 7). The results showed that there was no risk of degradation of the saline-alkali soil structure (SI > 9%) under the control treatment, and rice–Hunan millet (RHMD) and rice–soybean (RS) could improve the stability coefficient of soil structure in the tillage layer (0~40 cm) by increasing the soil organic matter content [25].

4.2. Effects of Different Crop Rotations on Soil Physical and Chemical Properties and Enzyme Activities

Saline soils are highly susceptible to adverse effects like physiological drought due to their unfavorable conditions, such as high salinity, high compactness, and low nutrient contents, which also limit crop yields to a great extent [26,27,28]. The results of this study showed that different rice–dry crop rotations could effectively reduce the total salt and pH in the soil tillage layer (0–40 cm), which may be due to the fact that dry crops absorb ions such as potassium, calcium, and magnesium from the soil, and some of the saline ions are removed with the harvested material, which reduces the total salt content of the soil; secondly, the root system of the crops can secrete organic acids (e.g., citric acid, oxalic acid, etc.), which can acidify the inter-root microenvironment [29]. In this study, it was found that the treatment of RS (rice–soybean) could significantly increase the organic matter content of the 0~40 cm soil layer compared with other treatments. The effect of RSS treatment on soil available phosphorus (107.67%) and available potassium (26.74%) was the most significant. The reason for this result may be that soybeans can promote microbial activity and accelerate organic matter accumulation through nitrogen fixation. The roots of sweet sorghum secreted organic acids, dissolved fixed phosphorus, increased the soil available phosphorus content, and had high biomass and strong potassium absorption capacity. The differences in different crop rotation methods were mainly due to the differences in crop types (legumes, grasses), root characteristics, and nutrient use efficiency [30,31,32].
The level of soil enzyme activity can objectively reflect the soil fertility status [33]. This study showed that the activities of urease, catalase, and alkaline phosphatase in the 0~40 cm soil layer decreased compared with CK (perennial rice) under different crop rotation treatments, which may be due to the change in soil moisture environment [34]: Long-term flooded rice fields create anaerobic conditions that promote urease production; when converted to dryland farming, aerobic conditions inhibit some anaerobic microbial activity. Catalase in dryland soils primarily functions to eliminate H2O2 (an aerobic metabolic byproduct). Rice paddy soils exhibit strong reducing properties, leading to lower H2O2 accumulation. Although conversion to dryland farming creates an oxidizing environment, salt-alkali stress may suppress microbial and root activity, reducing H2O2 production. Additionally, under flooded conditions, the reduction of Fe3+ to Fe2+ releases fixed phosphorus, stimulating phosphatase activity. After conversion to dryland farming, phosphorus is readily re-fixed (e.g., by binding with Ca2+), decreasing the demand for phosphatase.
In this study, it was also found that the soil alkaline phosphatase activity under RS (rice–soybean) treatment was higher than that of CK (5.34%), which may be due to the fact that soybean planting promoted soil organic matter accumulation and stimulated microbial proliferation [35,36].

4.3. Effect of Different Crop Rotations on Soil Quality

In order to improve the objectivity and accuracy of the evaluation results, a full dataset of 16 soil indicators was established [37]. The results showed that RS (rice–soybean) and RC (rice–maize) had higher soil quality indexes, which could improve the soil quality of 0~40 cm soil layer, making it suitable for rice drought rotation in the Yinbei region. The total normalization effect of the structural equation showed that salinity factor and soil nutrients were the key factors restricting the improvement of saline-alkali soil quality in Yinbei, indicating that timely fertilization should be paid attention to maintain soil nutrients during the crop growth process to avoid adverse effects on crop growth.

5. Conclusions

(1)
The saline soil in Yinbei Plain, where rice is grown all the year round, was chalky, and different rice–dry rotations changed the soil texture from chalky to chalky loam, improving the soil fractal dimension. The fractal dimension of saline soil was positively correlated with the volume content of clay particles, negatively correlated with the volume content of powder particles, and negatively correlated with the volume content of sand particles.
(2)
There is no structural degradation sub-risk (SI > 9%) in perennial rice saline soil, and RS (rice–soybean) can better improve the soil structure stabilization coefficient of the 0~40 cm soil layer.
(3)
Different rice–dry crop rotations can significantly affect soil physicochemical properties and enzyme activities, RS treatment (rice–soybean) can comprehensively improve soil fertility and is suitable for fertilizing the land, and RSS treatment (rice–sweet sorghum) has outstanding effects on phosphorus- and potassium-deficient soil restoration. The quality assessment of the soil in the 0–40 cm soil layer showed that RS (rice–soybean) and RC (rice–corn) had higher soil quality indices, which could better improve the soil quality of the 0–40 cm layer, and were suitable rice–dry rotations in the north of Yinbei. Structural equation modeling indicated that salinity factor and soil nutrients were the key factors limiting the improvement of saline soil quality in the north Yin area.

Author Contributions

J.W.: Writing—original draft, Visualization, Project administration, Methodology. B.Z.: Formal analysis, Data curation, Conceptualization. M.L.: Formal analysis, Data curation. R.B.: Validation, Investigation. X.B.: Validation, Investigation. X.Z.: Resources, Project administration. P.L.: Validation, Investigation. B.W.: Writing—review and editing, Supervision, Funding acquisition. All authors have read and agreed to the published version of the manuscript.

Funding

This work was financially supported by the National Key Research and Development Program (2021YFD1900600) and the Tsinghua University–Ningxia Yinchuan Water Network Digital Water Management Joint Research Institute Project (sklhse-2022-Iow03).

Data Availability Statement

The data will be made available on request.

Conflicts of Interest

The authors declare no conflicts of interest.

References

  1. Li, C.Y.; He, R.; Tian, C.Y.; Song, J. Utilization of halophytes in saline agriculture and restoration of contaminated salinized soils from genes to ecosystem: Suaeda salsa as an example. Mar. Pollut. Bull. 2023, 197, 115728. [Google Scholar] [CrossRef]
  2. Zhang, K.; Chang, L.; Li, G.; Li, Y. Advances and future research in ecological stoichiometry under saline-alkali stress. Environ. Sci. Pollut. Res. 2023, 30, 5475–5486. [Google Scholar] [CrossRef]
  3. Wang, Y.; Jie, W.; Peng, X.; Hua, X.; Yan, X.; Zhou, Z.; Lin, J. Physiological Adaptive Strategies of Oil Seed Crop Ricinus communis Early Seedlings (Cotyledon vs. True Leaf) Under Salt and Alkali Stresses: From the Growth, Photosynthesis and Chlorophyll Fluorescence. Front. Plant Sci. 2018, 9, 1939. [Google Scholar] [CrossRef] [PubMed]
  4. Luo, S.; Wang, S.; Tian, L.; Shi, S.; Xu, S.; Yang, F.; Li, X.; Wang, Z.; Tian, C. Aggregate-related changes in soil microbial communities under different ameliorant applications in saline-sodic soils. Geoderma 2018, 329, 108–117. [Google Scholar] [CrossRef]
  5. Yao, R.; Gao, Q.; Liu, Y.; Li, H.; Yang, J.; Bai, Y.; Zhu, H.; Wang, X.; Xie, W.; Zhang, X. Deep vertical rotary tillage mitigates salinization hazards and shifts microbial community structure in salt-affected anthropogenic-alluvial soil. Soil Till. Res. 2023, 227, 14. [Google Scholar] [CrossRef]
  6. Mokhtaran, A.; Sepehri, S.; Gilani, A.A.; Ebadi, A.A.; Jalali, S. Improving Rice Production Sustainability by Planting Salinity-Tolerant Rice Cultivars and Reusing Agricultural Drainage Water. J. Irrig. Drain. Eng. 2023, 149, 9. [Google Scholar] [CrossRef]
  7. Duran-Flores, D.; Heil, M. Growth inhibition by self-DNA: A phenomenon and its multiple explanations. New Phytol. 2015, 207, 482–485. [Google Scholar] [CrossRef]
  8. Luo, L.; Guo, C.; Wang, L.; Zhang, J.; Deng, L.; Luo, K.; Huang, H.; Liu, Y.; Mei, X.; Zhu, S.; et al. Negative Plant-Soil Feedback Driven by Re-assemblage of the Rhizosphere Microbiome with the Growth of Panax notoginseng. Front. Microbiol. 2019, 10, 13. [Google Scholar] [CrossRef] [PubMed]
  9. Bai, N.; Lv, W.; Chu, X.; Fan, H.; Li, S.; Zheng, X.; Zhang, J.; Zhang, H.; Zhang, H. Comparison of soil microbial community and physicochemical properties between rice-fallow and rice-bean (green manure) rotation. Soil Sci. Soc. Am. J. 2022, 86, 593–603. [Google Scholar] [CrossRef]
  10. Ge, S.; Chen, Y.; Wang, Z.; Li, Z.; Shen, C.; Zhang, T.; Wang, J. Deep insights into the diversified cropping and their impact on arbuscular mycorrhizal fungi: A global meta-analysis. Agric. Ecosyst. Environ. 2025, 383, 11. [Google Scholar] [CrossRef]
  11. Obour, P.B.; Xia, Y.; Ugarte, C.M.; Grift, T.E.; Wander, M.M. Soil physical properties and water dynamics under contrasting management regimes at the Morrow Plots. Soil Till. Res. 2025, 248, 9. [Google Scholar] [CrossRef]
  12. Sun, Q.; Zheng, Y.; Li, S.; Yang, J.; Zhao, X.; Du, L.; He, K.; Liu, J. Diversified crop rotation: Synergistically enhancing peanut yield and soil organic carbon stability. Agric. Ecosyst. Environ. 2025, 382, 13. [Google Scholar] [CrossRef]
  13. Zhao, Z.; Zhou, H.; Chen, W.; Wu, Y.; Liu, G.; Xue, S. Response of soil structure and fertility to long-term fertilization in alpine grasslands revealed based on fractal theory. Soil Till. Res. 2024, 242, 12. [Google Scholar] [CrossRef]
  14. Al-Kayssi, A.W. Quantifying soil physical quality by using indicators and pore volume-function characteristics of the gypsiferous soils in Iraq. Geoderma Reg. 2022, 30, 13. [Google Scholar] [CrossRef]
  15. Biswas, S.; Hazra, G.C.; Purakayastha, T.J.; Saha, N.; Mitran, T.; Roy, S.S.; Basak, N.; Mandal, B. Establishment of critical limits of indicators and indices of soil quality in rice-rice cropping systems under different soil orders. Geoderma 2017, 292, 34–48. [Google Scholar] [CrossRef]
  16. Yu, P.; Han, D.; Liu, S.; Wen, X.; Huang, Y.; Jia, H. Soil quality assessment under different land uses in an alpine grassland. Catena 2018, 171, 280–287. [Google Scholar] [CrossRef]
  17. Bansal, S.; Wang, T.; Osborne, S.L. Yield and Profit Comparison of Diversified Versus Conventional Crop Rotation Systems in South Dakota. Agron. J. 2024, 116, 3145–3157. [Google Scholar] [CrossRef]
  18. Malobane, M.E.; Nciizah, A.D.; Mudau, F.N.; Wakindiki, I.I.C. Soil Organic Carbon and Labile Carbon Pools Attributed by Tillage, Crop Residue and Crop Rotation Management in Sweet Sorghum Cropping System. Sustainability 2020, 12, 9782. [Google Scholar] [CrossRef]
  19. Tyler, S.W.; Wheatcraft, S.W. Fractal Scaling of Soil Particle-Size Distributions: Analysis and Limitations. Soil Sci. Soc. Am. J. 1992, 56, 362–369. [Google Scholar] [CrossRef]
  20. Reynolds, W.D.; Drury, C.F.; Tan, C.S.; Fox, C.A.; Yang, X.M. Use of Indicators and Pore Volume-Function Characteristics to Quantify Soil Physical Quality. Geoderma 2009, 152, 252–263. [Google Scholar] [CrossRef]
  21. Chang, F.; Zhang, H.; Song, J.; Yu, R.; Zhang, X.; Li, H.; Wang, J.; Kan, Z.; Li, Y. Once-middle Amount of Straw Interlayer Enhances Saline Soil Quality and Sunflower Yield in Semi-Arid Regions of China: Evidence from a Four-Year Experiment. J. Environ. Manag. 2023, 344, 118530. [Google Scholar] [CrossRef]
  22. Zhang, Y.; Zhong, X.; Lin, J.; Zhao, D.; Jiang, F.; Wang, M.; Ge, H.; Huang, Y. Corrigendum to “effects of Fractal Dimension and Water Content on the Shear Strength of Red Soil in the Hilly Granitic Region of Southern China” [geomorphology 351 (15 February 2020) 106956]. Geomorphology 2020, 360, 107207. [Google Scholar] [CrossRef]
  23. Gao, Z.; Niu, F.; Lin, Z.; Luo, J. Fractal and Multifractal Analysis of Soil Particle-Size Distribution and Correlation with Soil Hydrological Properties in Active Layer of Qinghai–Tibet Plateau, China. Catena 2021, 203, 105373. [Google Scholar] [CrossRef]
  24. Wang, Z.; Hasi, E.; Han, X.; Qingda, M. Fractal Characterization of Soil Particle Size Distribution under Different Land Use Patterns on the North Slope of Wula Mountain in China. J. Soil Sediment. 2024, 24, 1148–1164. [Google Scholar] [CrossRef]
  25. Pieri, C. Fertility of Soils: A Future for Farming in the West African Savannah; Springer: Berlin/Heidelberg, Germany, 1992. [Google Scholar]
  26. Yang, J.; Zhou, Y.; Ye, X.; Liu, E.; Sun, S.; Ren, X.; Jia, Z.; Wei, T.; Zhang, P. Continuous Ridge-Furrow Film Mulching Enhances Maize Root Growth and Crop Yield by Improving Soil Aggregates Characteristics in a Semiarid Area of China: An Eight-Year Field Experiment. Plant Soil 2024, 499, 173–191. [Google Scholar] [CrossRef]
  27. Zhang, Y.; Li, Y.; Ren, X.; Gao, J.; Wang, Y.; Zhu, D. Comparative Study on the Nutritional Quality of Peanut in Saline and Non-Saline Land. Foods 2024, 13, 3751. [Google Scholar] [CrossRef]
  28. Sun, X.; Wang, W.; Yi, S.; Zheng, F.; Zhang, Z.; Alharbi, S.A.; Filimonenko, E.; Wang, Z.; Kuzyakov, Y. Microbial Composition in Saline and Alkaline Soils Regulates Plant Growth with P-solubilizing Bacteria. Appl. Soil Ecol. 2024, 203, 105653. [Google Scholar] [CrossRef]
  29. Zhang, Q.; Song, Y.; Wu, Z.; Yan, X.; Gunina, A.; Kuzyakov, Y.; Xiong, Z. Effects of Six-Year Biochar Amendment on Soil Aggregation, Crop Growth, and Nitrogen and Phosphorus Use Efficiencies in a Rice-Wheat Rotation. J. Clean. Prod. 2019, 242, 118435. [Google Scholar] [CrossRef]
  30. Zong, M.; Yang, X.; Sanz-Cobena, A.; Jorgensen, U.; Butterbach-Bahl, K.; Abalos, D. Reductions in Nitrous Oxide Emissions in Diverse Crop Rotations Linked to Changes in Prokaryotic Community Structure. Agric. For. Meteorol. 2025, 362, 110370. [Google Scholar] [CrossRef]
  31. Xu, F.; Song, T.; Wang, K.; Xu, W.; Chen, G.; Xu, M.; Zhang, Q.; Liu, J.; Zhu, Y.; Rensing, C.; et al. Frequent Alternate Wetting and Drying Irrigation Mitigates the Effect of Low Phosphorus on Rice Grain Yield in a 4-year Field Trial by Increasing Soil Phosphorus Release and Rice Root Growth. Food Energy Secur. 2020, 9, e206. [Google Scholar] [CrossRef]
  32. Hou, J.; Gao, X.; Entz, M.H. Enhancing Zinc and Iron Bioavailability Through Crop Rotation and Organic Farming: Insights from a Long-Term Study. Field Crop Res. 2025, 322, 109710. [Google Scholar] [CrossRef]
  33. Yang, C.M.; Yang, L.Z.; Yang, Y.X.; Zhu, O.Y. Rice Root Growth and Nutrient Uptake As Influenced by Organic Manure in Continuously and Alternately Flooded Paddy Soils. Agric. Water Manag. 2004, 70, 67–81. [Google Scholar] [CrossRef]
  34. Hou, P.; Chien, C.; Chiang-Hsieh, Y.; Tseng, K.; Chow, C.; Huang, H.; Chang, W. Paddy-upland Rotation for Sustainable Agriculture with Regards to Diverse Soil Microbial Community. Sci. Rep. 2018, 8, 7966. [Google Scholar] [CrossRef]
  35. Gaiero, J.R.; McCall, C.A.; Thompson, K.A.; Day, N.J.; Best, A.S.; Dunfield, K.E. Inside the Root Microbiome: Bacterial Root Endophytes and Plant Growth Promotion. Am. J. Bot. 2013, 100, 1738–1750. [Google Scholar] [CrossRef]
  36. Hu, J.; Wei, Z.; Friman, V.; Gu, S.; Wang, X.; Eisenhauer, N.; Yang, T.; Ma, J.; Shen, Q.; Xu, Y.; et al. Probiotic Diversity Enhances Rhizosphere Microbiome Function and Plant Disease Suppression. MBio 2016, 7, 10-1128. [Google Scholar] [CrossRef] [PubMed]
  37. Zhu, M.; Ai, X.; Sheng, M.; Ai, S.; Miao, N.; Ai, Y. Using a Soil Quality Index to Evaluate the Artificial Soil Quality Response to Rehabilitation Time. Ecol. Eng. 2024, 202, 107234. [Google Scholar] [CrossRef]
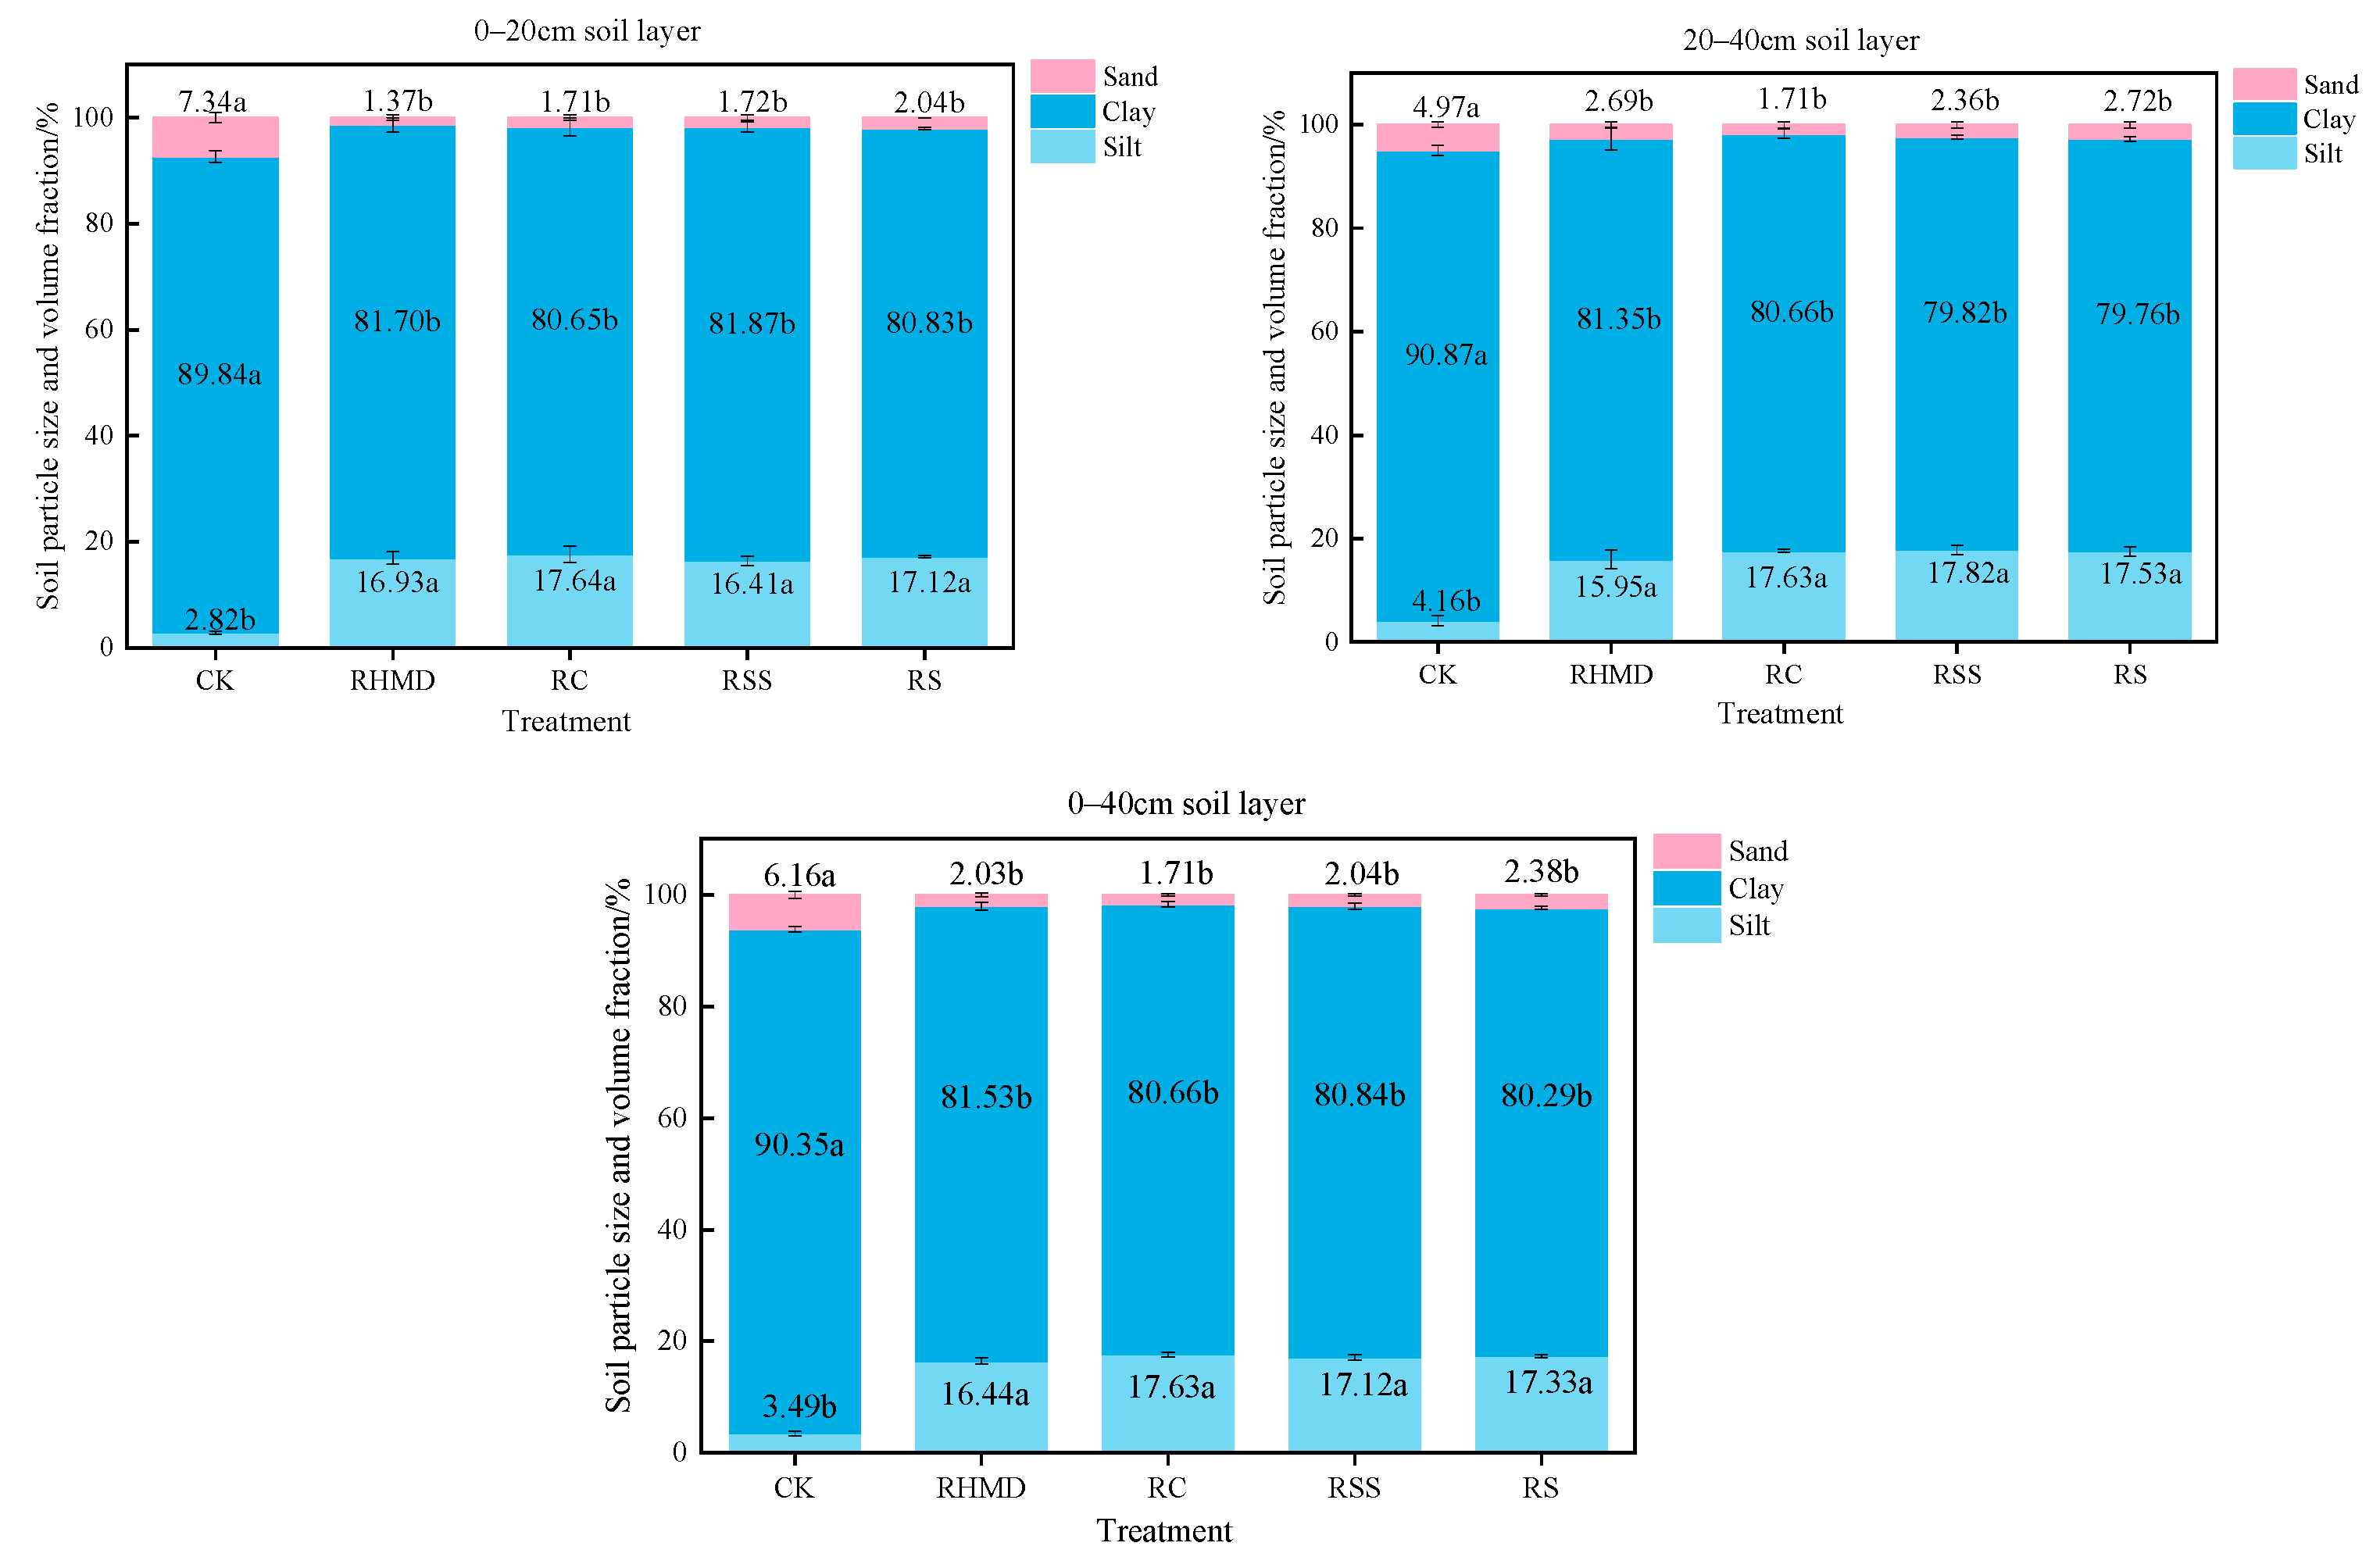
Figure 1. Composition of soil particles under different cropping systems. Note: Different lowercase letters in the figure indicate significant differences between different rotation methods.
Agronomy 15 02131 g001
Figure 2. Characteristics of soil particles and stability coefficient of soil structure under different rotation methods. Different lowercase letters in the figure indicate significant differences between different rotation methods.
Agronomy 15 02131 g002
Figure 3. Effect of different rotation patterns on soil enzyme activity. Note: Different lowercase letters in the figure indicate significant differences between different rotation methods.
Agronomy 15 02131 g003
Figure 4. Effects of different rotation methods on soil quality index.
Agronomy 15 02131 g004
Figure 5. Analysis of Mantel correlation between soil quality and soil texture, physicochemical properties, and enzyme activity. Note: Through the Mantel test, there is a correlation between the soil quality index and various environmental factors. The color gradient represents the Pearson correlation coefficient. The edge width corresponds to the Mantel r statistic of the correlation, and the edge color indicates statistical significance. Significance levels are denoted by * p < 0.05, ** p < 0.01, *** p < 0.001 and **** p < 0.0001. Soil variables include the following: Clay for clay particles; Silt for silt particles; Sand for sand particles; DV for fractal dimension; SI for soil structure stability coefficient; BD for soil bulk density; Porosity for porosity; Total salt for total salt content; OM for organic matter; AN for alkaline hydrolysis nitrogen; AP for available phosphorus; AK for available potassium; Ure for urease; Cat for catalase; ALP for alkaline phosphatase; and SQI for soil quality index. The figure below uses the same key.
Agronomy 15 02131 g005
Figure 6. Structural equation model for the effects of different rice drought rotation methods on soil salinity factor, particle composition, soil nutrients, soil enzyme activity, and soil quality. Note: The model was evaluated using the goodness of fit (Gof) statistic, the path on the line is a standardized path coefficient, and the relationship between the width and intensity of the line is proportional. The R2 values beside the latent variables are the coefficients of determination. Asterisks indicate significant effects: *, p < 0.05; **, p < 0.01. Solid blue and red arrows represent significant (p < 0.05) positive and negative paths, respectively, and arrow widths indicate the magnitude of these effects. Dashed lines indicate non-significant (p > 0.05) pathways.
Agronomy 15 02131 g006
Figure 7. Relationship between soil fractal dimension, organic matter, soil quality index, and soil particle composition under different rotation methods.
Agronomy 15 02131 g007
Table 1. Soil traits of Lvkanglin Family Farm in Pingluo County.
Soil LayerpHEc (ds/m)OM (g/kg)AN (mg/kg)AP (mg/kg)AK (mg/kg)
0–20 cm8.564.6213.4248.1230.6883.69
20–40 cm8.78 5.7910.0740.6923.4470.12
Table 2. Effects of different rotation methods on soil physical and chemical properties.
TreatmentSoil Depth (cm)BD/(g/cm3)Porosity (%)pHTotal Salt/(g/kg)OM/(g/kg)AN/(mg/kg)AP/(mg/kg)AK/(mg/kg)
CK0–20 cm1.27 ± 0.02 a51.95 ± 0.63 a8.59 ± 0.01 b3.20 ± 0.04 a13.52 ± 0.37 bc55.65 ± 5.05 b26.42 ± 2.86 ab62.58 ± 1.66 b
20–40 cm1.35 ± 0.02 a49.06 ± 0.66 a8.64 ± 0.01 ab2.78 ± 0.03 a15.98 ± 0.87 b60.32 ± 1.68 b23.09 ± 1.52 c60.28 ± 1.24 c
RHMD0–20 cm1.31 ± 0.01 a50.46 ± 0.41 a8.48 ± 0.01 c2.00 ± 0.18 b15.43 ± 0.19 b37.45 ± 1.07 c28.69 ± 2.79 ab53.12 ± 2.25 c
20–40 cm1.39 ± 0.02 a47.60 ± 1.07 a8.55 ± 0.08 ab1.86 ± 0.18 b19.45 ± 0.25 a50.87 ± 4.16 b37.95 ± 1.67 b59.74 ± 1.11 c
RC0–20 cm1.29 ± 0.02 a51.33 ± 0.33 a8.47 ± 0.02 c1.78 ± 0.21 b13.19 ± 1.48 bc42.93 ± 1.88 c21.56 ± 2.12 b57.17 ± 0.94 c
20–40 cm1.41 ± 0.07 a46.70 ± 2.73 a8.51 ± 0.02 b2.04 ± 0.20 b14.06 ± 0.44 b52.15 ± 5.05 b34.42 ± 2.15 b65.15 ± 2.04 b
RSS0–20 cm1.28 ± 0.03 a51.86 ± 2.48 a8.73 ± 0.02 a1.90 ± 0.18 b11.93 ± 1.16 c36.28 ± 0.84 c33.15 ± 2.32 a43.97 ± 1.84 d
20–40 cm1.40 ± 0.02 a47.01 ± 0.84 a8.68 ± 0.02 a1.79 ± 0.17 b14.70 ± 0.46 b56.93 ± 3.96 b47.95 ± 0.87 a76.40 ± 1.73 a
RS0–20 cm1.32 ± 0.01 a50.17 ± 0.77 a8.51 ± 0.05 c2.03 ± 0.21 b18.29 ± 0.64 a69.18 ± 3.06 a27.56 ± 1.83 ab83.93 ± 1.52 a
20–40 cm1.46 ± 0.01 a45.03 ± 0.34 a8.59 ± 0.03 ab2.15 ± 0.15 b20.46 ± 0.88 a74.20 ± 3.45 a24.76 ± 2.02 c69.47 ± 1.16 b
Treatment (T)1.311.2813.44 **16.27 **22.39 **22.98 **19.11 **47.67 **
Depth (D)24.10 **24.39 **3.170.3024.71 **24.73 **21.69 **35.73 **
T*D0.320.361.261.221.061.958.56 **58.01 **
Note: Different lowercase letters in the table indicate significant differences between different rotation methods. Different lowercase letters in the figure indicate significant differences between different rotation methods. ** p < 0.01.
Disclaimer/Publisher’s Note: The statements, opinions and data contained in all publications are solely those of the individual author(s) and contributor(s) and not of MDPI and/or the editor(s). MDPI and/or the editor(s) disclaim responsibility for any injury to people or property resulting from any ideas, methods, instructions or products referred to in the content.