Article

Variation of Protein and Protein Fraction Content in Wheat in Relation to NPK Mineral Fertilization

by
Alina Laura Agapie
1,
Marinel Nicolae Horablaga
1,2,
Gabriela Gorinoiu
1,
Adina Horablaga
3,
Mihai Valentin Herbei
3 and
Florin Sala
1,4,*
1
Agricultural Research and Development Station Lovrin, 307250 Lovrin, Romania
2
Department of Agricultural Technologies, University of Life Sciences “King Mihai I” from Timisoara, 300645 Timisoara, Romania
3
Department of Sustainable Development and Environmental Engineering, University of Life Sciences “King Mihai I” from Timisoara, 300645 Timisoara, Romania
4
Department of Soil Sciences, University of Life Sciences “King Mihai I” from Timisoara, 300645 Timisoara, Romania
*
Author to whom correspondence should be addressed.
Agronomy 2025, 15(9), 2076; https://doi.org/10.3390/agronomy15092076
Submission received: 5 August 2025 / Revised: 22 August 2025 / Accepted: 27 August 2025 / Published: 28 August 2025
(This article belongs to the Section Soil and Plant Nutrition)

Abstract

Wheat is a crucial crop for human nutrition, and the demand for high-quality indicators within the “from farm to fork” concept is increasing. Based on this premise, this study examined how, at the farm level, the fertilization system can influence key quality indicators relevant to wheat production and final products. This research was conducted under specific conditions of the Western Plain of Romania at the Agricultural Research and Development Station (ARDS), Lovrin, during 2015–2017. Fertilization involved the autumn application of phosphorus (concentrated superphosphate; 0, 40, 80, 120, 160 kg ha−1 active substance, a.s.) and potassium (potassium chloride; 0, 40, 80, 120 kg ha−1 a.s.). Nitrogen (ammonium nitrate; 0, 30, 60, 90, 120 kg ha−1 active substance) was applied in spring in two stages. The combination of these three fertilizers resulted in 18 fertilized variants (T2 to T19), tested alongside an unfertilized control (T1). The experimental variants were arranged in four randomized replications. Grain quality was assessed based on protein content (PRO, %), gluten (GLT, g 100 g−1), gliadins (Gliad, %), glutenins (Glut, g 100 g−1), high-molecular-weight glutenins (HMW, g 100 g−1), low-molecular-weight glutenins (LMW, g 100 g−1), and the gliadin/glutenin ratio (Gliad/Glut). Compared to the average values for each indicator across the experiment, certain variants produced values above the mean, with statistical significance. Variant T16 stood out by producing values above the mean for all indicators, with statistical confidence. Multivariate analysis showed that five indicators with very strong (PRO, GLT) and strong (HMW, Glut, LMW) influence grouped in PC1, while two indicators (Gliad, Gliad/Glut) with very strong and strong influence grouped in PC2. The analysis revealed varying levels of correlation between the applied fertilizers, with nitrogen (N) showing very strong and strong correlations with most indicators, while phosphorus and potassium showed moderate-to-weak correlations. Regression analysis generated mathematical models that statistically described how each indicator varied in relation to the fertilizers applied.

1. Introduction

Wheat (Triticum aestivum L.) is a major cereal crop important for human nutrition, serving as a plant-based source of protein and calories. It is grown in over 100 countries [1,2,3,4]. Gluten is a key indicator of wheat quality, and at the molecular level, it consists of different proteins—gliadins and glutenins [5]. The quality and usability of wheat grains are determined by the content and composition of storage and accumulation proteins [6,7]. The gluten content and its proteins, based on their quantity and type, are essential for wheat quality and influence its processing properties [4].
Gluten consists of over 50 proteins that play a key role in the functional properties of flour, dough, and finished products made from wheat flour [8,9]. Some previous studies have mentioned a complex group of 50–100 proteins that accumulate in wheat grains, influenced by genotype, environmental factors, and cultivation techniques [1,10]. Wheat proteins mainly fall into two groups: glutenins, which contribute to dough elasticity (polymeric proteins, with high-molecular-weight subunits—HMW-GS; and low-molecular-weight subunits—LMW-GS), and gliadins, which provide dough extensibility (monomeric proteins consisting of three major groups: α-, γ-, and ω-gliadins) [1,8,11]. Glutenin and gliadin are major components of gluten; provide an adequate gluten structure [12]; contribute fundamentally to the functional properties of dough and the quality of finished products [1]; and are of high importance for nutrition and human health [13].
The accumulation of glutenins and gliadins, which are main components of storage proteins (gluten), is considered to be controlled at the genetic level, by genes with distinct and differentiated action [6]. Grain quality indices (e.g., gluten, gliadin and glutenin proteins) are genetically determined, with variable alleles controlled by gene clusters [2,3,14,15,16,17,18]. Through knowledge and (programmed) genome editing, breeding programs have promoted different genotypes for varied diets and the quality of grain-based food products [3]. The limitation of HMW-GS alleles in common wheat has drawn attention to wheat relatives (e.g., Thinopyrum elongatum) as gene donors in breeding programs, and gluten content and quality have been significantly improved by substitution and addition of genes from T. elongatum [7].
Gliadins, glutenins and the Gli/Glu ratio in grains and flour from different wheat varieties have differentially influenced dough parameters and bread quality [19]. By supplementing glutenins and gliadins in different concentrations in basic flour, the variation in dough properties was recorded in a differentiated way in relation to the two supplemented components [20]. The gliadin/glutenin ratio was found to be important for the quality of finished products based on wheat flour [21]. The wide range of wheat flour products (bakery, pastry, etc.) is based precisely on the properties of the different types of proteins in the gluten component, their content, and the way in which these properties are highlighted through preparation techniques [1]. In the case of some alpha gliadins, the induction of side effects in certain categories of people has been recorded (e.g., the immunogenic potential of flour, celiac disease) [9].
The gluten content of wheat grains and flour is an important quality index in the food industry, and has a functional role in dough properties, bread volume, and finished product quality [22]. Based on the quality indices, the authors detected vital gluten samples from different suppliers by PCA analysis [22]. The inclusion of total gliadin in 1% basic flour (gliadin containing α-, γ- and ω-gliadins) caused changes in dough properties (e.g., stability, strength, dough softening) and improved bread volume [23]. The glutenin subunit ratio (LMW/HMW-GS) is important for wheat flour quality [24]. The supplementation of glutenin (LMW-GS, and HMW-GS) by addition (without partial reduction, reoxidation) and incorporation (with partial reduction, reoxidation) processes in basic flour generated different effects on the MR (maximum resistance) and EX (extensibility) indices of dough [25]. Glutenin subunits (HMW-GS) are important contributors to gluten elasticity and to the conditioning of the quality of final wheat products [14,15]. Variations in the gluten matrix and changes in the properties and functionality of glutenin and gliadin have been experimentally recorded by the supplementation of WBDF (wheat bran dietary fiber) in flour mixtures [12]. The influence of the gliadin/glutenin ratio has been recorded on some properties of gluten–starch mixtures, in relation to the processing and quality of finished cereal-based products [26]. The rheological quality of dough has been studied in relation to glutenin subunits (LMW-GSs) from wheat grains from different wheat varieties [16].
Although they are minor components in gluten, the HMW-GSs (storage proteins located in the endosperm of wheat grains, encoded by loci on chromosome 1 of hexaploid wheat, e.g., Glu-1), have a major role in dough properties [17]. The modification of some protein properties (e.g., aggregation, structural stability) has been studied in relation to flour maturation [27]. Gluten’s content, structure, and relative properties are determined by genetic, environmental, technological factors and their interactions [4]. Based on an extensive review, variation in gluten chemistry was highlighted in relation to species and genotype, soil conditions, weather conditions, CO2, the level of mineral element supply (N, S, P, K, and other mineral elements), or certain pathogens [4].
Previous studies have revealed a complex group of 50–100 proteins accumulated in wheat grains, in relation to genotype, environmental factors and cultivation technology [1,10]. Different wheat genotypes tested showed a stronger influence on the gliadin, glutenin, and gluten content of wheat, compared to experimental locations, while the variation in total protein content showed an equal variation between varieties and locations [28].
Protein accumulation, and the increase in protein content in gluten, in the vegetative stages of grain filling was influenced by nitrogen and nitrogen fertilization [29]. Experimental differential application of N and S (doses and application times) to wheat lines with low gliadin content led to differential accumulation of proteins (gliadins and glutenins) in the transgenic wheat lines studied [29]. Studies on several biofortified lines of common wheat (94 lines) showed that Fe and Zn were positively correlated with protein content, but not with yield or other quality indices [30].
Given the high interest in wheat quality, in the context of climate change, the energy crisis, the need to optimize agricultural technologies, and ensure quality agri-food products, the present study analyzed the influence of mineral fertilization (NPK) on wheat quality by (i) evaluating the quality indices represented by protein, gluten, gliadins, glutenins, HMW, LMW and the gliadin/glutenin ratio in relation to mineral fertilization; (ii) evaluating the differences generated by the experimental variants for each quality index through comparative analysis; (iii) grouping the quality indices as factors in describing wheat quality through multivariate analysis; (iv) quantifying the interdependence between quality indices and the mineral elements applied through correlation analysis and mathematical models.

2. Materials and Methods

2.1. Research Location and Experimental Conditions

This research was conducted at the Agricultural Research and Development Station Lovrin (ARDS Lovrin), Timis County, Romania. The field experiment area is specific to the Western Plain of Romania. The field experiments were conducted between 2015 and 2017. The wheat crop was located in plot 4, a non-irrigated system shown in Figure 1, which was generated based on [31]. The field experiments were located on a typical, weakly clayey chernozem soil, with the main characteristics presented in Table 1.
The morphological and micromorphological properties of the soil indicate a stage of development characteristic of soils from the Cernisol class, with the Am—A/C—Cca type profile. Typical chernozem has the following horizons: Am—A/C—Cca. Horizon A—bioaccumulative mineral horizon, with the following soil subtypes (Ap—processed horizon, Am—molic horizon): Horizon A/C—intermediate horizon—mineral bioaccumulative/unconsolidated; Horizon C—unconsolidated horizon, with the subtypes Cca—accumulative carbonate; Cca—gr-ac—accumulative carbonate, which is gleyic and salinized. The microstructure of the Am horizon is predominantly spongy, and generated by intense faunal (earthworms, mesofauna) and biological (roots) activity. At the level of the worked horizon (Ap, 0–20 cm) the microstructure takes the form of a fissure with isolated voids, exhibiting degradation of the initial zoobiological structure following the soil works. The AC horizon has dark brown colors in the upper part; a sandy-clay or clay–clay texture; and a granular structure. In the lower part of the horizon, efflorescences and pseudomicelles of CaCO3 appear. The Cca horizon is brown in the upper part and light yellowish brown in the lower part, with a sandy-clay texture, and has numerous accumulations of carbonates in the form of efflorescences, vinous and calcareous concretions.
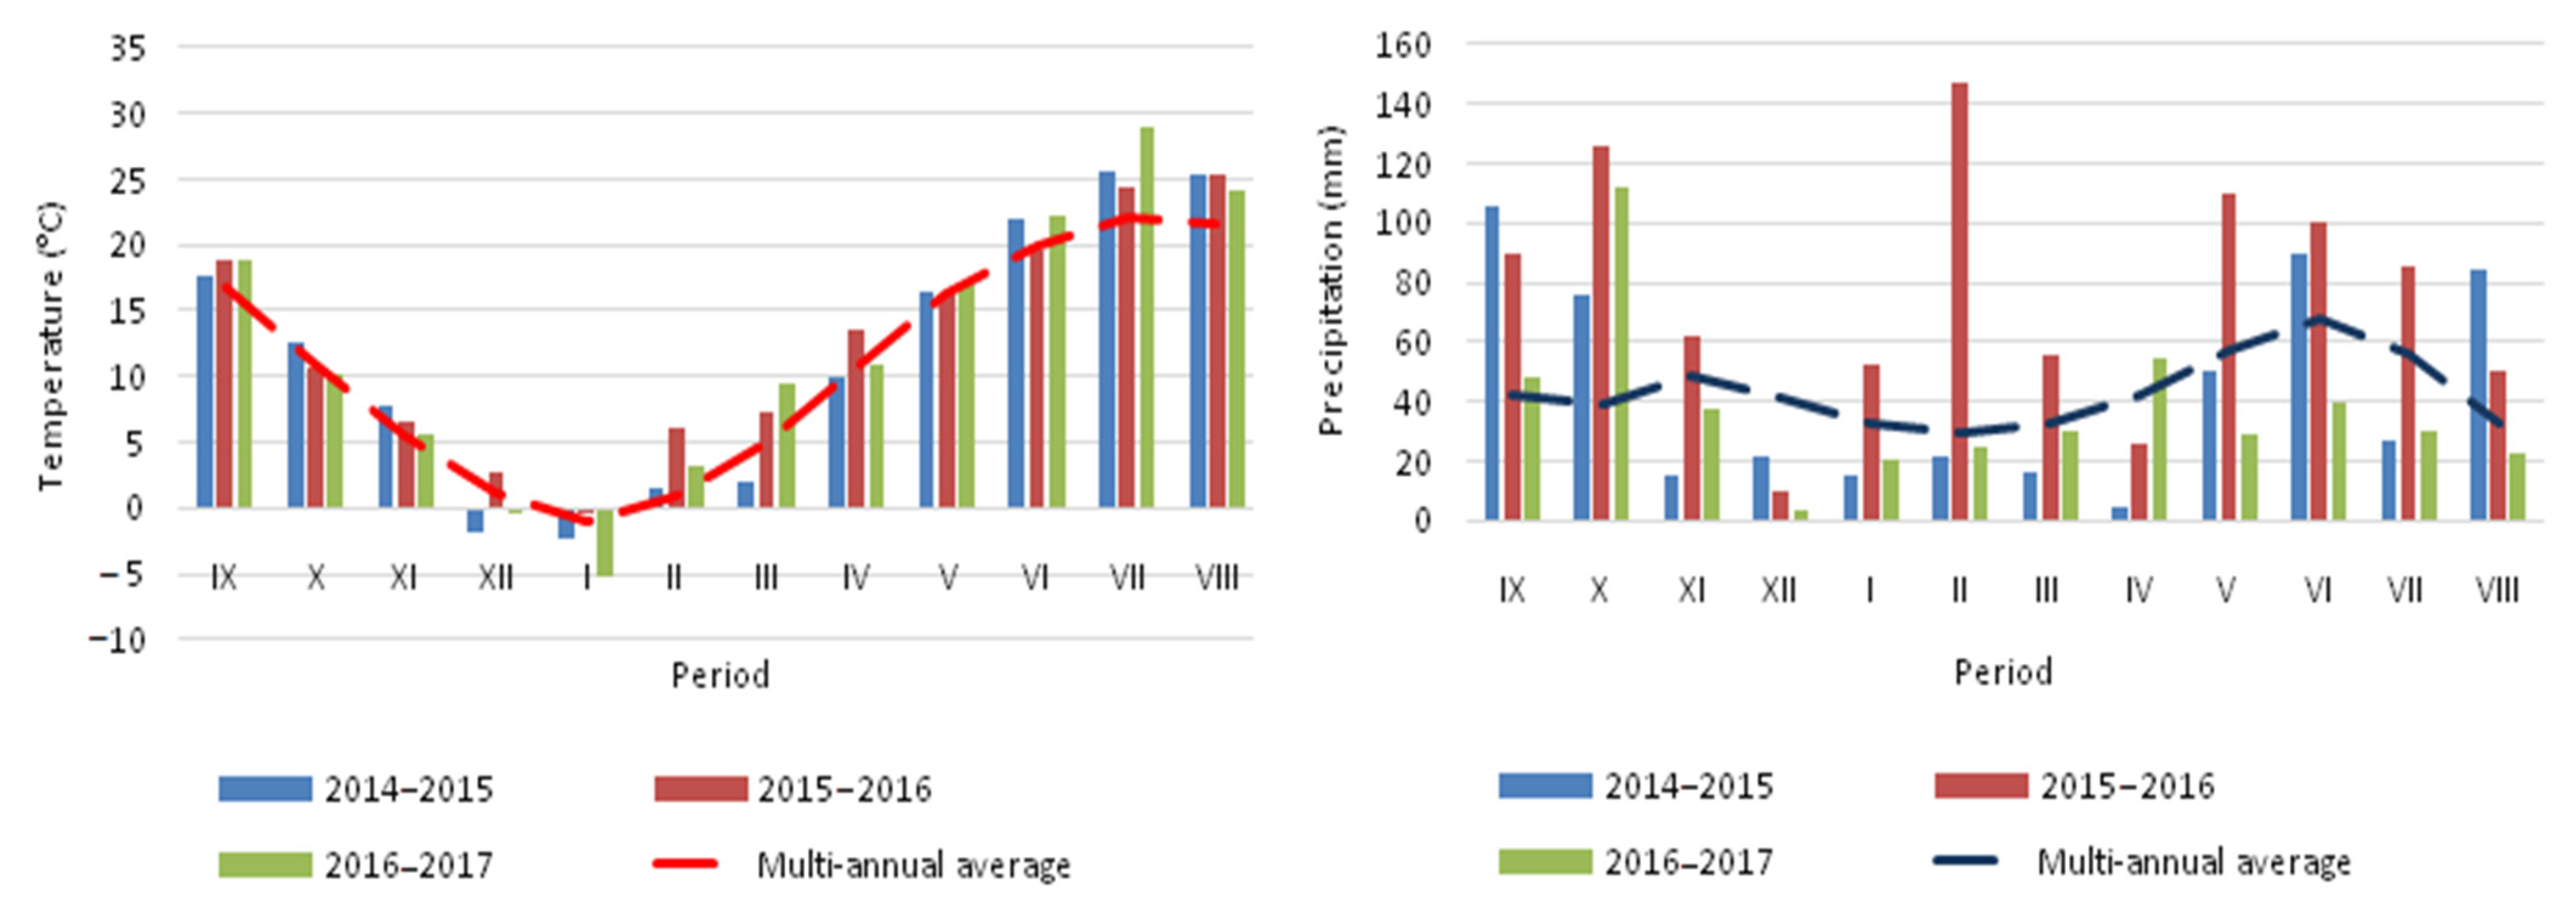
In the area where the experiments were carried out, the climate is temperate and moderately continental. It falls within the forest-steppe climate of Banat [32]. The climatic conditions during the experimental period (2015–2017), in terms of temperature and rainfall, are presented in Figure 2.
The average annual temperature of the area (calculated for a period of 80 years) is 10.8 °C. Annual variations have an increasing trend, with significant deviations from the multiannual average. Thus, the agricultural year 2014–2015 recorded an average temperature of 11.1 °C, with a positive deviation of +0.6 °C. The agricultural year 2015–2016 recorded a positive deviation from the multiannual average of +1.7 °C, with the warmest being (February +5.3 °C, March +2.7 °C, April +1.9 °C), and the year 2016–2017 had a deviation of +1.1 °C. Regarding the precipitation regime, compared to the multiannual average of 521.4 mm, the year 2015–2015 recorded appropriate average values of 526.8 mm. The year 2015–2016 had a surplus of precipitation—913.2 mm (with a positive deviation of 391.8 mm)—and the year 2016–2017 was deficient, recording an annual amount of 408.48 mm, with a negative deviation of 112.98 mm.

2.2. Biological Material and Experimental Variants

The biological material was represented by the wheat variety ‘Ciprian’, created within the ARDS Lovrin. The experimental variants were generated by applying nitrogen, phosphorus, and potassium fertilizers. Phosphorus (concentrated superphosphate; 0, 40, 80, 120, 160 kg ha−1 a.s.; a.s.—active substance) and potassium (potassium chloride; 0. 40, 80, 120 kg ha−1 a.s.) were applied in autumn and incorporated with the plowing work. Nitrogen (ammonium nitrate; 0, 30, 60, 90, 120 kg ha−1 a.s.) was applied in spring, in two stages. The wheat crop had soybean as the preceding crop, so no nitrogen fertilizers were applied at sowing. The first dose of nitrogen (40%) was applied at the emergence of spring—the second half of March—and the second dose (60%) at straw elongation—the end of April. The combination of the three fertilizers resulted in 18 fertilized variants (T2 to T19), tested alongside a control, unfertilized variant (T1). The experiments were organized in four replicates. The harvest of the grain production was performed at physiological maturity, BBCH Code 9 [33], for each experimental variant and replicate.

2.3. Analysis of Quality Indices

2.3.1. Determination of Protein and Gluten Content

Gluten and protein content were determined by non-destructive methods, with the Perten Inframatic 9200 device (PERTEN INSTRUMENTS GMBH, 2003, Hamburg, Germany).

2.3.2. Determination of Glutenin and Gliadin Content

The Lab-on-a-Chip (LoaC) technique was used to extract gliadins and glutenins, a rapid technique frequently used to separate and quantify proteins. Wheat grains, obtained after harvesting the crop, were ground to obtain flour. For extraction, 30 g of flour treated with 300 μL of 70% ethanol was used. Meanwhile, a 200 μL solution was used for gliadin extraction and 100 μL was used for glutenin extraction. Extraction of gluten-free spores took place after the removal of globulins and albumin. After evaporation of the ethanol, 350 μL 2% SDS solution containing 5% β-mercaptoethanol was used for the extraction of gliadins, maintained for 5 min at 100 °C. For the extraction of glutenins, the same volume of solution was used, to which 0.0625 M tris base was added and the same temperature conditions applied. The final solution for the extraction of gluten proteins contained a 4 μL sample, to which 2 μL Agilent sample buffer and 84 μL deionized water were added [34,35,36]. The molecular weights of the proteins were determined in the range 12.5–230 kDa, using chip electrophoresis technique on an Agilent 2100 Bioanalyzer with Protein 230 Plus Lab-on-a-Chip kit. After analysis, each subunit was manually integrated and their percentage was calculated from the time-corrected area. The gliadin/glutenin ratio (Gliad/Glut) was calculated based on the average values recorded on each experimental variant.

2.4. Statistical Analysis of Experimental Data

Within each index, a comparative analysis was made between the variants and the mean value per experiment (one-sample test) to quantify the level, significance, and safety of the differences. The p parameter thresholds were used (p < 0.05, p < 0.01, p < 0.001). Past software version 4.02 [37] was used. Multivariate analysis was used to rank the mineral elements on the main components. JASP version 0.16.4 software [38] was used. The interdependence between the quality indices was determined through correlation analysis. The statistical safety of the correlation levels was indicated by the symbol “*” in a differentiated way, associated with the safety threshold (p < 0.05, *; p < 0.01, **; p < 0.001, ***). The variation in quality indices in relation to the fertilizer elements (NPK) was evaluated by regression analysis. The degree of safety was quantified by the regression coefficient (R2) and the p parameter. The JASP software version 0.16.4 [38] and the Wolfral Alpha application, version 14.2 [39], were used.

3. Results

3.1. Quality Indices in Relation to Mineral Fertilization

Fertilization with mineral fertilizers N, P, and K led to differentiated results of quality indices in wheat, of the variety ‘Ciprian’, presented in Table 2. The protein content varied between 11.70 ± 0.31% (T1) and 15.60 ± 0.31% (T16). The gluten content varied between 26.10 ± 0.83% (T1) and 36.80 ± 0.83% (T16). The gliadin content varied between 24.80 ± 1.88 g 100 g−1 (T10) and 55.20 ± 1.88 g 100 g−1 (T9). The glutenin content varied between 10.80 ± 1.08 g 100 g−1 (T1) and 26.10 ± 1.08 g 100 g−1 (T16). The HMW index varied between 1.20 ± 0.37 g 100 g−1 (T9) and 7.10 ± 0.37 g 100 g−1 (T16). The LMW index varied between 8.53 ± 0.87 g 100 g−1 (T1) and 22.80 ± 0.87 g 100 g−1 (T19). The Giadine/Glutenin ratio (Gliad/Glut) varied between 1.08 ± 0.14 (T11), and 3.23 ± 0.14 (T9).

3.2. Comparative Analysis of the Results

The comparative analysis was made between the variants and the mean value per experiment for each quality index studied. The recorded results are presented in Table 3. In the case of protein content, the calculated mean value was =13.45%. Compared to the mean value, 16 variants showed differences in statistical safety conditions. Seven variants showed positive differences (T4, T15, and T17, in conditions of p < 0.01; T5, T16, T18, and T19, in conditions of p < 0.001). Nine variants showed negative differences (T9, in conditions of p < 0.05; T7, T8, T11, and T12, in conditions of p < 0.01; T1, T2, T, and T10, in conditions of p < 0.001). In the case of three variants (T3, T13, T14), the differences did not present statistical significance (p > 0.05).
In the case of gluten content, the average value calculated was GLT = 31.23%. Compared to the average value, 16 variants with differences in statistical safety conditions were recorded. Eight variants showed positive differences (T14, in conditions of p < 0.05; T4 and T17, in conditions of p < 0.01; T5, T15, T16, T18, and T19, in conditions of p < 0.001). Eight variants showed negative differences (T2, T8, and T11, in conditions of p < 0.01; T1, T6, T7, T9, and T10, in conditions of p < 0.001). In the case of three variants (T3, T12, and T13) the differences did not show statistical safety (p > 0.05).
In the case of gliadin content, the average value calculated was Gliad = 34.61%. Compared to the average value, 11 variants showed differences in statistical safety conditions. Four variants showed positive differences (T7, in conditions of p < 0.01; T8, T9, and T16, in conditions of p < 0.001). Seven variants showed negative differences (T14, in conditions of p < 0.05; T3, T11, T12, and T13, in conditions of p < 0.01; and T10, in conditions of p < 0.001). In the case of eight variants, the differences did not show statistical safety (T1, T2, T4, T5, T6T15, T17, and T18, p > 0.05).
In the case of glutenin content, the average value calculated was Glut = 20.595%. Compared to the average value, 13 variants showed differences in statistical safety conditions. Seven variants showed positive differences (T5 and T14, in conditions of p < 0.01; and T11, T16, T17, T18, and T19, in conditions of p < 0.001). Six variants showed negative differences (T12, in conditions of p < 0.05; T9, in conditions of p < 0.01; and T1, T2, T3, and T6, in conditions of p < 0.001). In the case of six variants, the differences did not show statistical safety (T4, T7, T8, T10, T13, and T15; p > 0.05).
In the case of the HMW index, the calculated mean value was HMW = 3.23 g 100 g−1. Compared to the calculated mean value, 14 variants showed differences in statistical safety conditions. Positive differences were shown by six variants (T14 and T17, at the p < 0.05 level; T18, at the p < 0.01 level; T5, T15, and T16, at the p < 0.001 level). Negative differences were shown by eight variants (T6, T7, T8, T11, and T12, at the p < 0.01 level; T1, T2, and T9, at the p < 0.001 level). In the case of five variants, the differences recorded did not show statistical safety (T3, T4, T10, T13, and T19; p > 0.05).
In the case of the LMW index, the calculated mean value was LMW = 16.73 g 100 g−1. Compared to the calculated mean value, 10 variants showed differences in statistical safety conditions. Positive differences were recorded in seven variants (T5, at the p < 0.05 level; T12, T16, and T18, at the p < 0.01 level; and T14, T17, and T19, at the p < 0.001 level). Negative differences were recorded in the case of three variants (T1, T2, and T6, at the p < 0.001 level). In the case of nine variants, the differences did not show statistical safety (T3, T4, T7, T8, T9, T10, T11, T13, and T15; p > 0.05).
In the case of the Gliad/Glut ratio, the average value calculated was Gliad/Glut = 1.84. Compared to the average value, 12 variants presented differences in statistical safety conditions. Positive differences were recorded in the case of four variants (T1, T2, T6, and T9, at the p < 0.001 level). Negative differences were recorded in the case of eight variants (T5, T15, and T19, at the p < 0.05 level; T14, T17, and T18, at the p < 0.01 level; and T10 and T11, at the p < 0.001 level). In the case of seven variants, the differences did not present statistical safety (T3, T4, T7, T8, T12, T13, and T16; p > 0.05).

3.3. Multivariate Analysis for Explaining Quality Indices Position

PCA analysis was used to find out how the quality indices determined as factors in describing the quality of wheat, the ‘Ciprian’ variety, under NPK mineral fertilization conditions are grouped. Table 4 was created as a result, with the grouping of indices by principal components and the values of the correlation coefficient. The characteristics of the components are presented in Table 5. From the analysis of the data in Table 4, it was found that the quality indices were grouped into two components.
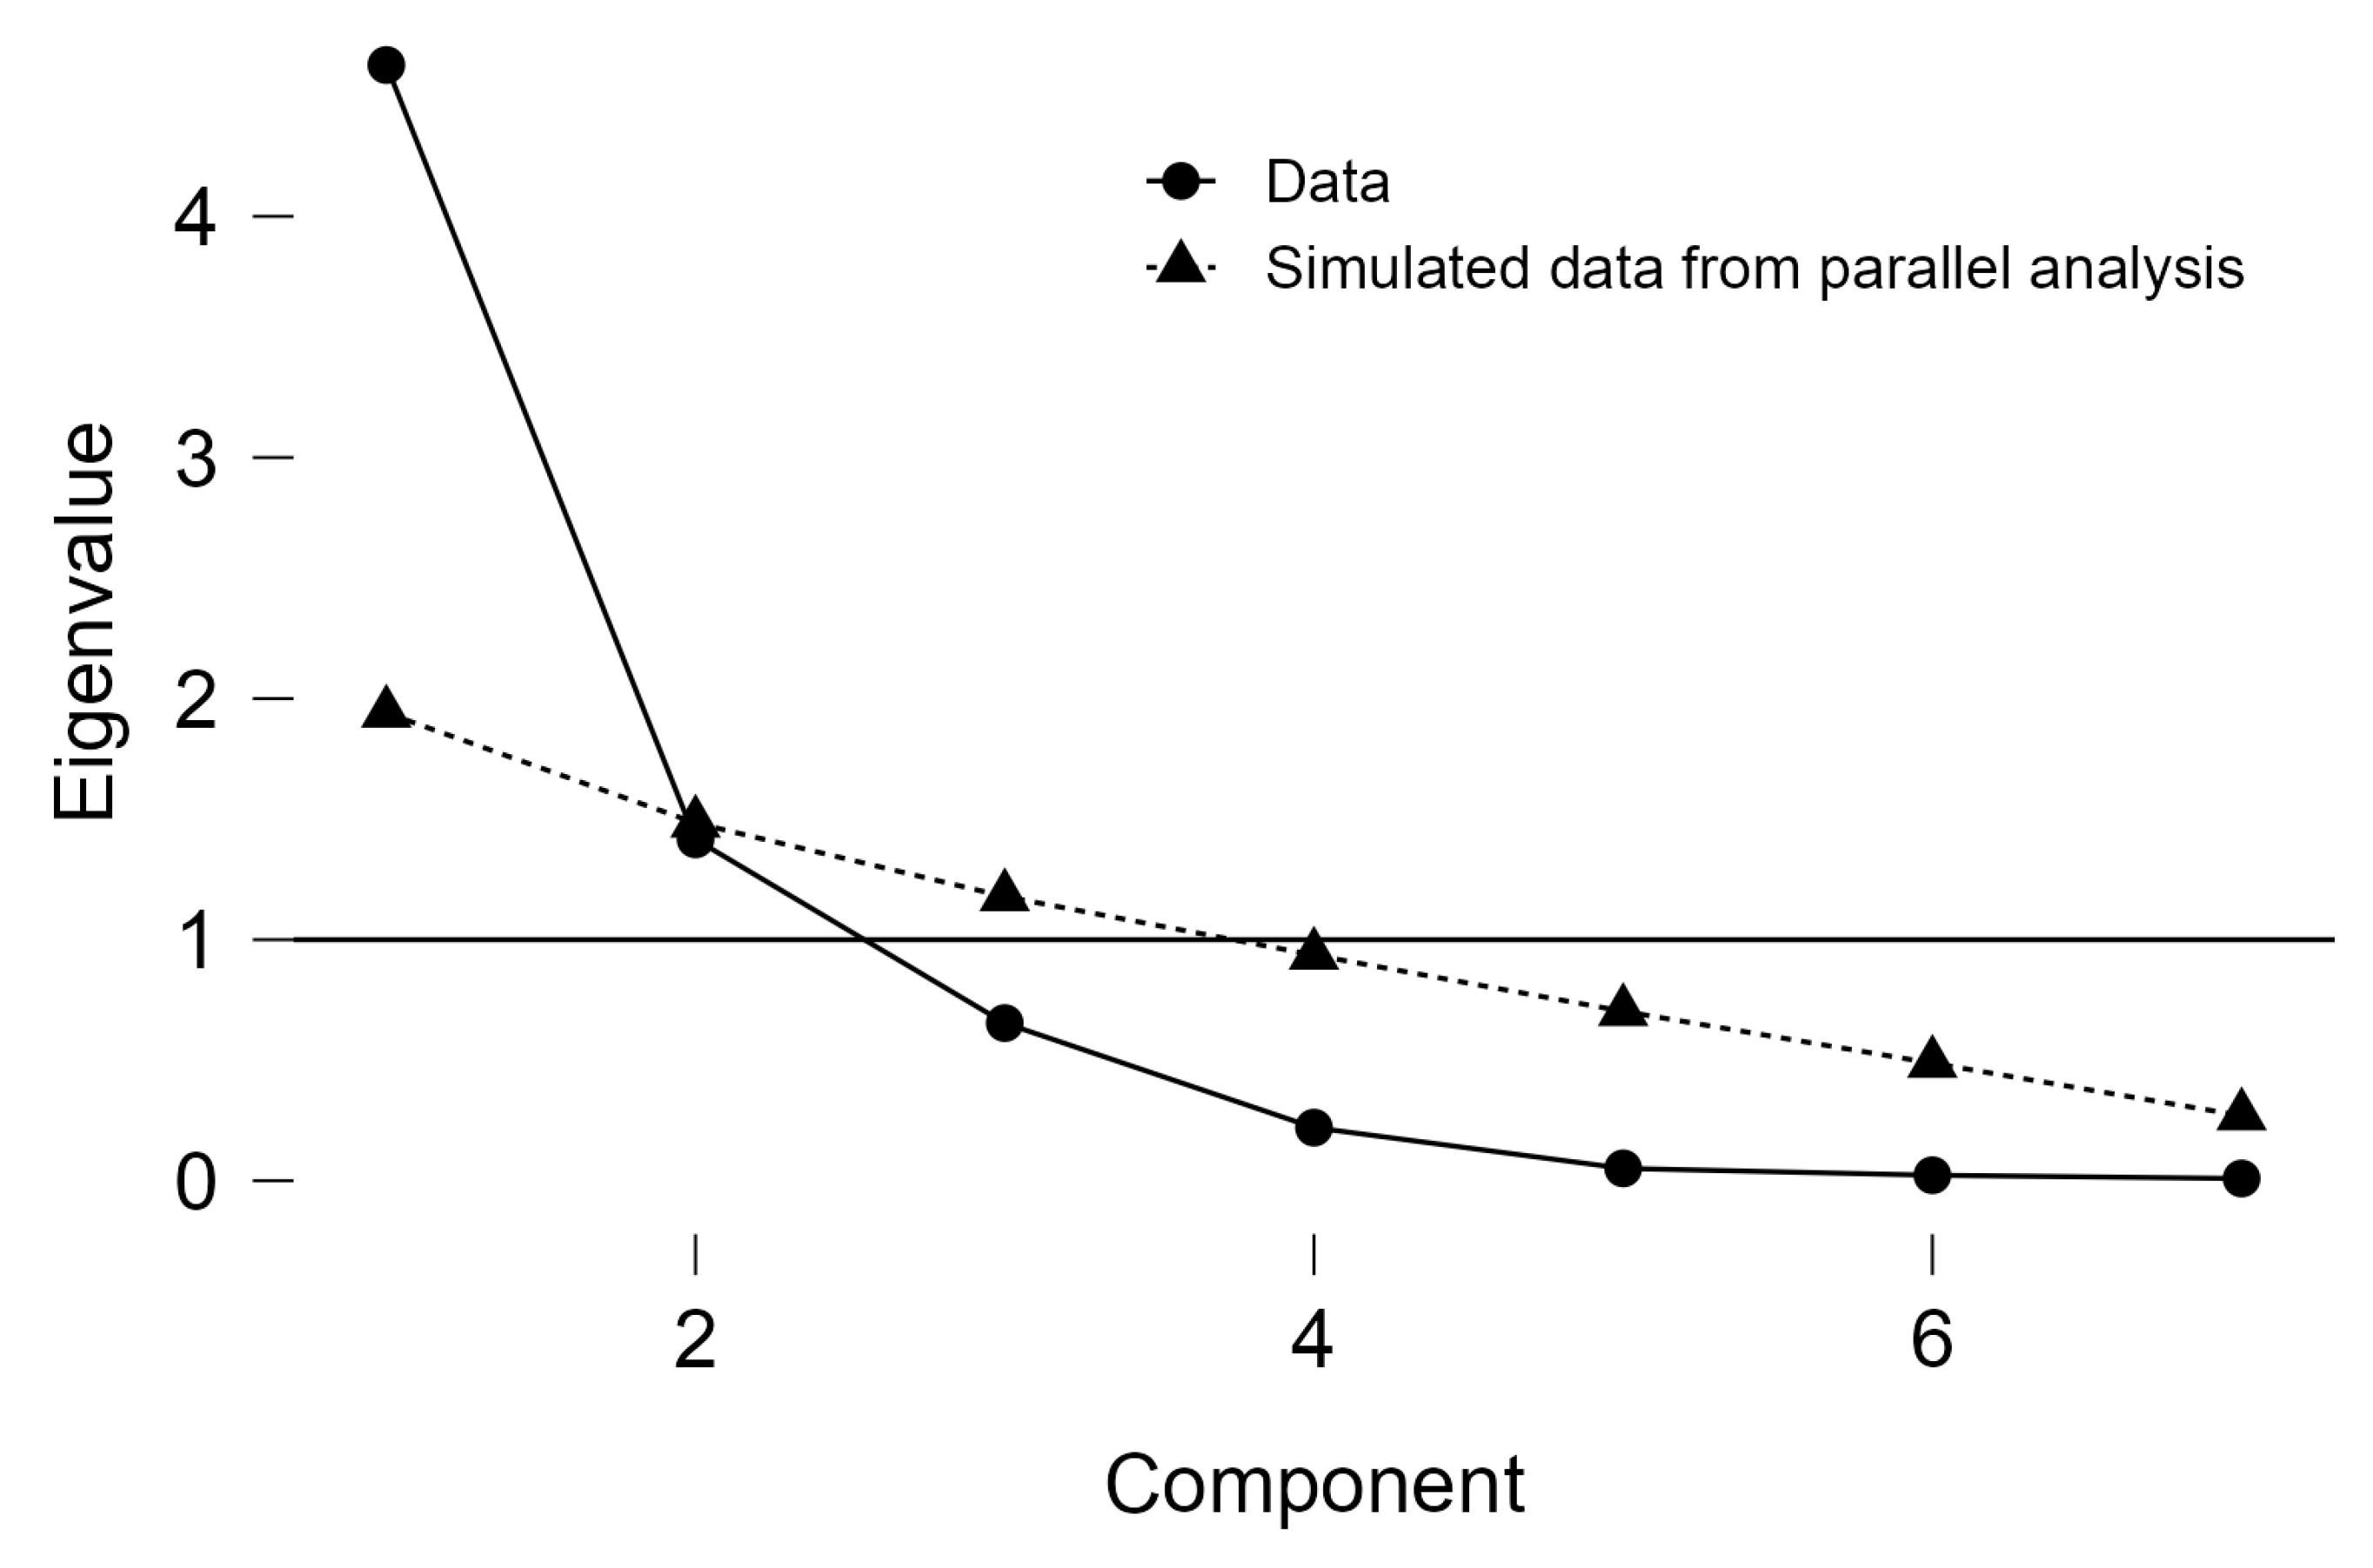
All quality indices showed positive action, according to the values of the correlation coefficient. PC1 included the PRO (protein), GLT (gluten), HMW (high-molecular-weight), Glut (glutenin) and LMW (low-molecular-weight) indices. The PRO and GLT indices showed very strong positive action (r = 0.955, respectively; r = 0.947). The HMW, Glut, and LMW indices showed strong action (r = 0.896, r = 0.869, and r = 0.836, respectively). PC2 included the Gliad indices (gliadins) and the Gliad/Glut ratio (gliadins/glutenins). The Gliad index showed very strong action (r = 0.936), and the Gliad/Glut index showed strong action (r = 0.798). The classification of the indices by principal components and the mode and intensity of action are graphically presented in Figure 3. The relationship between Eigenvalue and components is graphically presented in Figure 4.
PCA analysis was applied to understand the distribution of variants in relation to the quality indices considered and the calculated ratios. The PCA diagram in Figure 5 resulted, in which the variants were distributed correlated with certain indices. PC1 explained 55.808% of variance and PC2 explained 24.314% of variance.

3.4. Correlation Analysis Describing the Interaction of Quality Indices

To find out the interaction at the level of quality indices in wheat, as well as with mineral fertilizers (NPK), correlation analysis was applied. The correlation diagram resulted in the matrix plot format shown in Figure 6. From the analysis of the correlation coefficient values, it was found that N presented a very strong correlation with PRO (r = 0.954 ***), with GLT (r = 0.94 ***), strong correlation with HMW (r = 0.873 ***) and moderate and weak correlation with Glut and LMW (r = 0.605 **, respectively; r = 0.589 **). A negative correlation was recorded between N and the Gliad/Glut ratio (r = −0.419).
Phosphorus showed moderate correlation with Gliad (r = 0.63 **) and weak correlation with other indices. Potassium showed weak correlation, positive with LMW (r = 0.508 *) and negative with Gliad (r = −0.426), respectively, with Gliad/Glut (r = −0.47 *). At the level of quality indices, a very strong correlation was recorded between PRO and GLT (r = 0.972 ***), between PRO and HMW (r = −0.9 ***). Strong correlation was recorded between GLT and HMW (r = 0.887 ***) and between Glut and LMW (r = 0.896 ***). Moderate correlation was recorded between PRO and Glut (r = 0.727), between PRO and LMW (r = 0.713 ***), between GLT and Glut (r = 0.736 ***), between GLT and LMW (r = 0.768 ***), between Glut and Gliad/Glut (r = −0.739 ***), and between LMW and Gliad/Glut (r = 0.697 ***). Weak correlation was recorded at the level of other quality indices analyzed.

3.5. Variation Models of Quality Indices in Relation to NPK in Fertilizers

Starting from the values of quality indices recorded on the experimental variants, and the level of correlation recorded between quality indices and fertilization (NPK) applied, or between different quality indices, regression analysis was used to find out the influence of NPK in the variation of each index. In Equations (1) to (7), x represents nitrogen (N), y represents phosphorus (P), and z represents potassium (K) from fertilizers (kg ha−1).
The variation in protein (PRO; %) in relation to NPK is described by Equation (1), R2 = 0.979, p < 0.001, F = 39.1304, and RMSE = 0.5141.
P R O = 3.88 E 05 x 2 6.8 E 05 y 2 5.9 E 05 z 2 + 0.02969 x + 0.01872 y + 0.01644 z 0.00011 x y + 1.02 E + 12 x z   + 9.58 E 05 y z 1.3 E + 10 x y z + 11.125
The variation in gluten (GLT; %) in relation to NPK is described by Equation (2), R2 = 0.988, p < 0.001, F = 66.0154, and RMSE = 0.4299.
G L T = 0.00021 x 2 0.00013 y 2 + 2.84 E 05 z 2 + 0.10383 x + 0.03483 y + 0.03844 z 6.2 E 05 x y + 9.24 E + 11 x z   3.1 E 05 y z 1.2 E + 10 x y z + 25.75
The variation in gliadin (Gliad; g 100 g−1) in relation to NPK is described by Equation (3), R2 = 0.912, p = 0.0030, F = 8.3695, and RMSE = 7.8985.
G l i a d = 0.0035 x 2 + 0.00182 y 2 + 0.00309 z 2 0.45746 x 0.20723 y 0.48961 z + 0.00127 x y 4.6 E + 13 x z   + 0.00767 y z + 5.74 E + 11 x y z + 40
The variation in gluten (Glut; g 100 g−1) in relation to NPK is described by Equation (4), R2 = 0.879, p = 0.0097, F = 5.8643, and RMSE = 2.0858.
G l u t = 9.3 E 05 x 2 0.00081 y 2 0.00243 z 2 + 0.13617 x + 0.18433 y + 0.37308 z 0.00102 x y + 2.22 E + 12 x z   0.00124 y z 2.8 E + 10 x y z + 8.75
The variation in the HMW index (HMW; g 100 g−1) in relation to NPK is described by Equation (5), R2 = 0.963, p = 0.0001, F = 21.1410, and RMSE = 0.2943.
H M W = 0.000213 x 2 9.4 E 05 y 2 6.1 E 05 z 2 + 0.00292 x + 0.01029 y + 0.00594 z + 0.000126 x y 3.5 E   + 12 x z + 0.00071 y z + 4.43 E + 10 x y z + 2
The variation in the LMW index (LMW; g 100 g−1) in relation to NPK is described by Equation (6), R2 = 0.896, p = 0.0056, F = 6.9286, and RMSE = 2.1056.
L M W = 0.00054 x 2 0.00038 y 2 0.00079 z 2 + 0.15997 x + 0.11395 y + 0.19377 z 0.00083 x y + 2.03 E   + 12 x z 0.00124 y z 2.5 E + 10 x y z + 7
The variation in the gliadin/glutenin ratio (Gliad/Glut) in relation to NPK was described by Equation (7), R2 = 0.938, p = 0.00091, F = 12.2137, and RMSE = 1.6816.
G l i a d / G l u t = 0.00019 x 2 + 0.000193 y 2 + 0.000416 z 2 0.03939 x 0.03309 y 0.06595 z + 0.000205 x y 2.1 E   + 12 x z + 0.000517 y z + 2.62 E + 10 x y z + 4.25
The gliadin/gluten ratio (Gliad/Glut) was analyzed in relation to the gliadin and glutenin content, as well as in relation to the protein and gluten content of wheat grains. The variation in the Gliad/Glut ratio in relation to the gliadin and glutenin content (Gliad, Glut), was described by Equation (8), under conditions of R2 = 0.985, p < 0.001, F = 170.3674, and RMSE = 0.0747.
G l i a d / G l u t = 0.00017 x 2 + 0.00709 y 2 + 0.08253 x 0.2892 y 0.00234 x y + 3.2361
where x—gliadins content; y—glutenins content.
The variation in the Gliad/Glut ratio in relation to protein and gluten content (PRO, GLT) was described by Equation (9), under conditions of R2 = 0.539, p < 0.048, F = 3.0488, RMSE = 0.4133.
G l i a d / G l u t = 0.8475 x 2 + 0.18126 y 2 + 0.96956 x 1.53986 y 0.7464 x y + 19.96195
where x—protein content (PRO, %); y—gluten content (GLT, %).
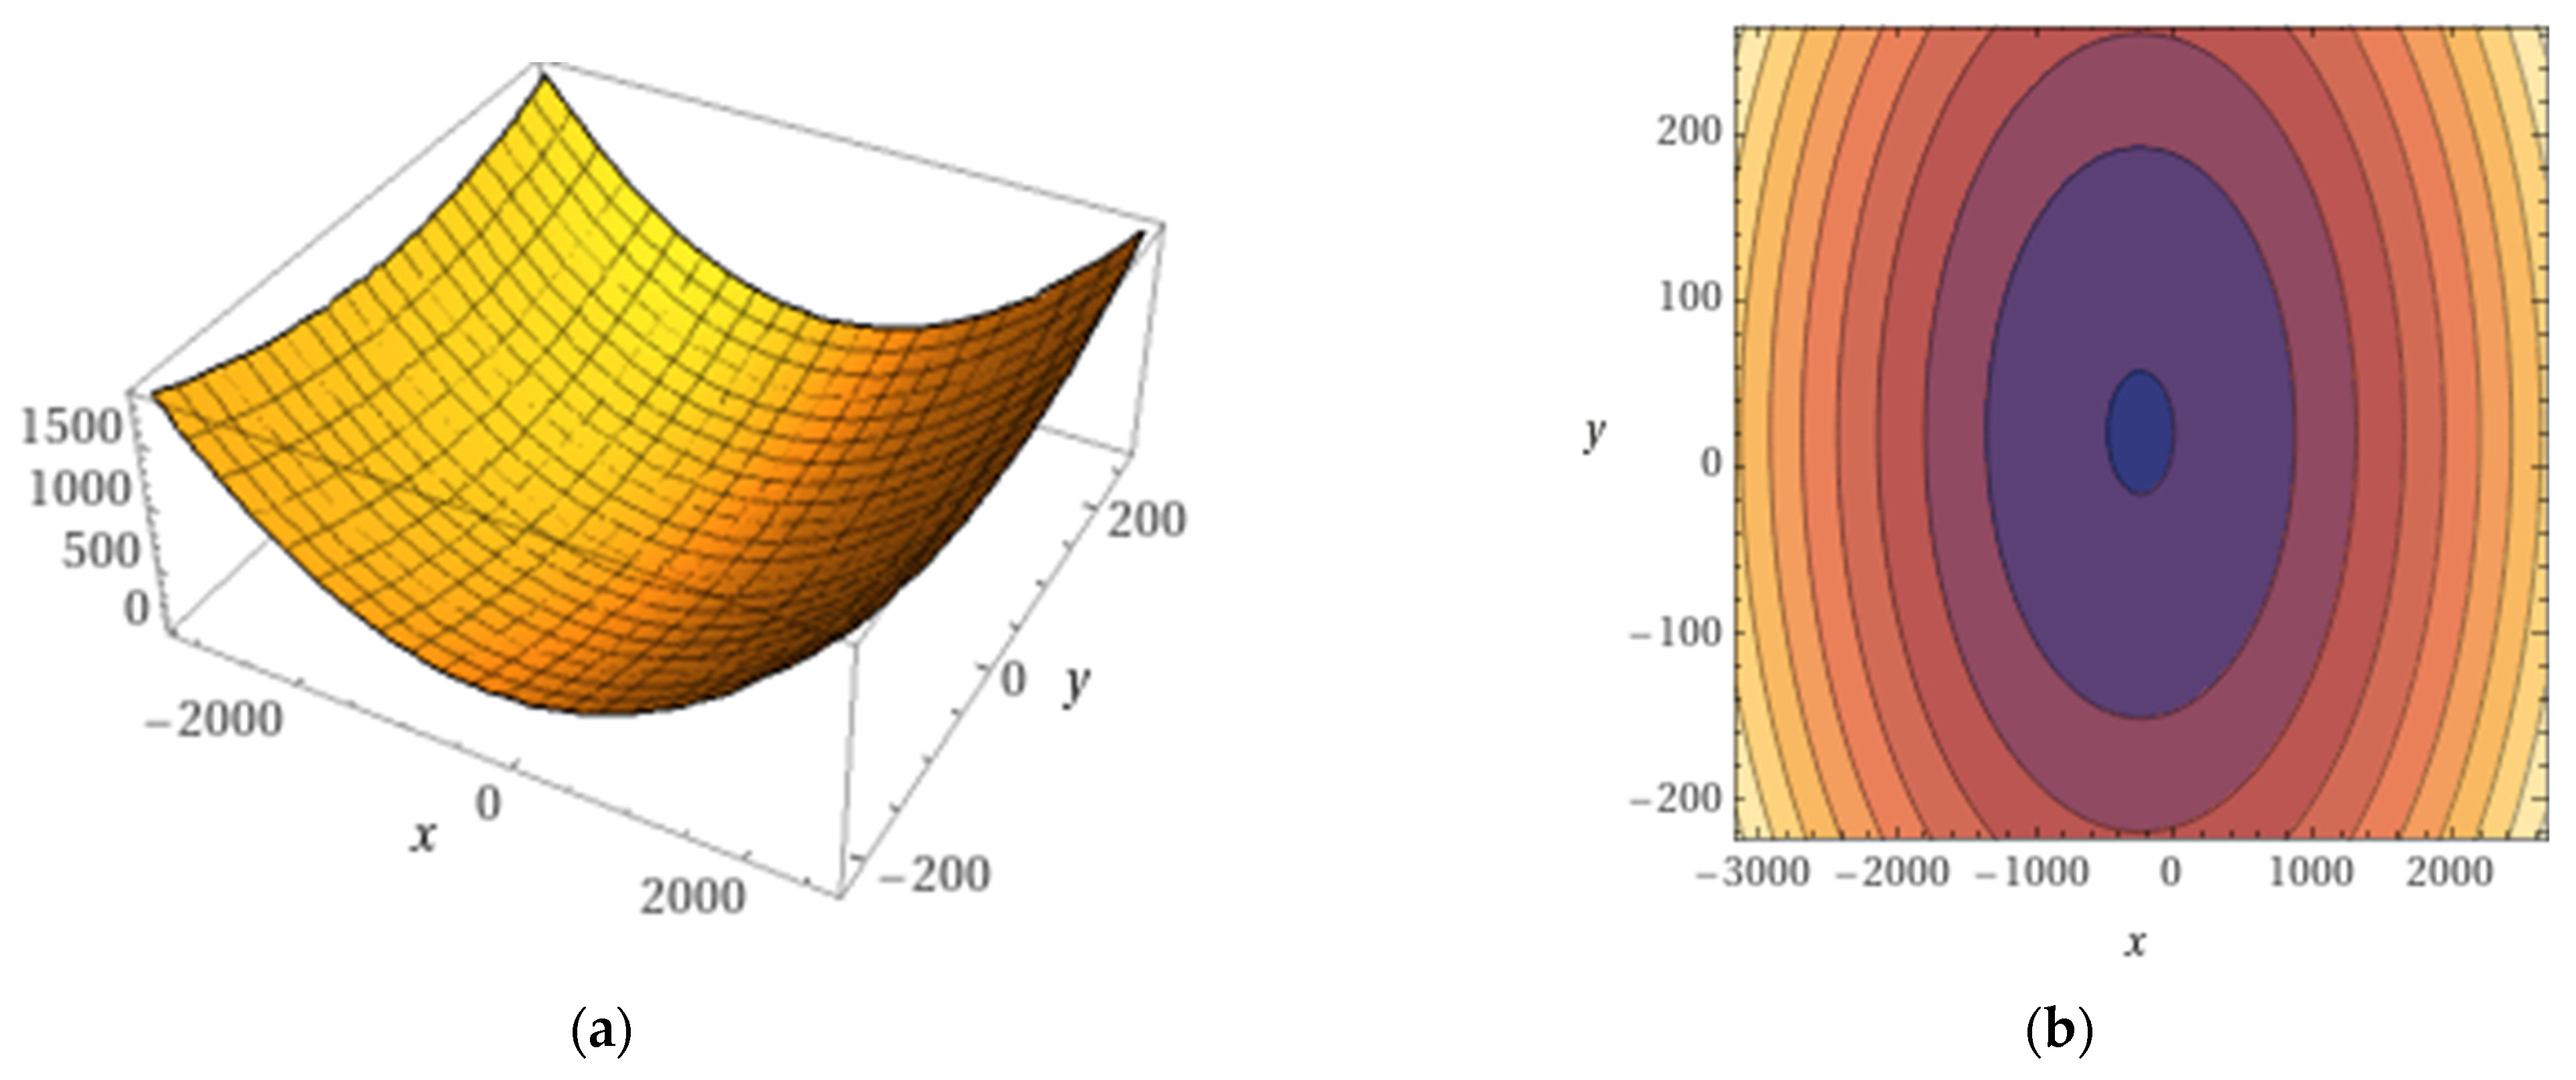
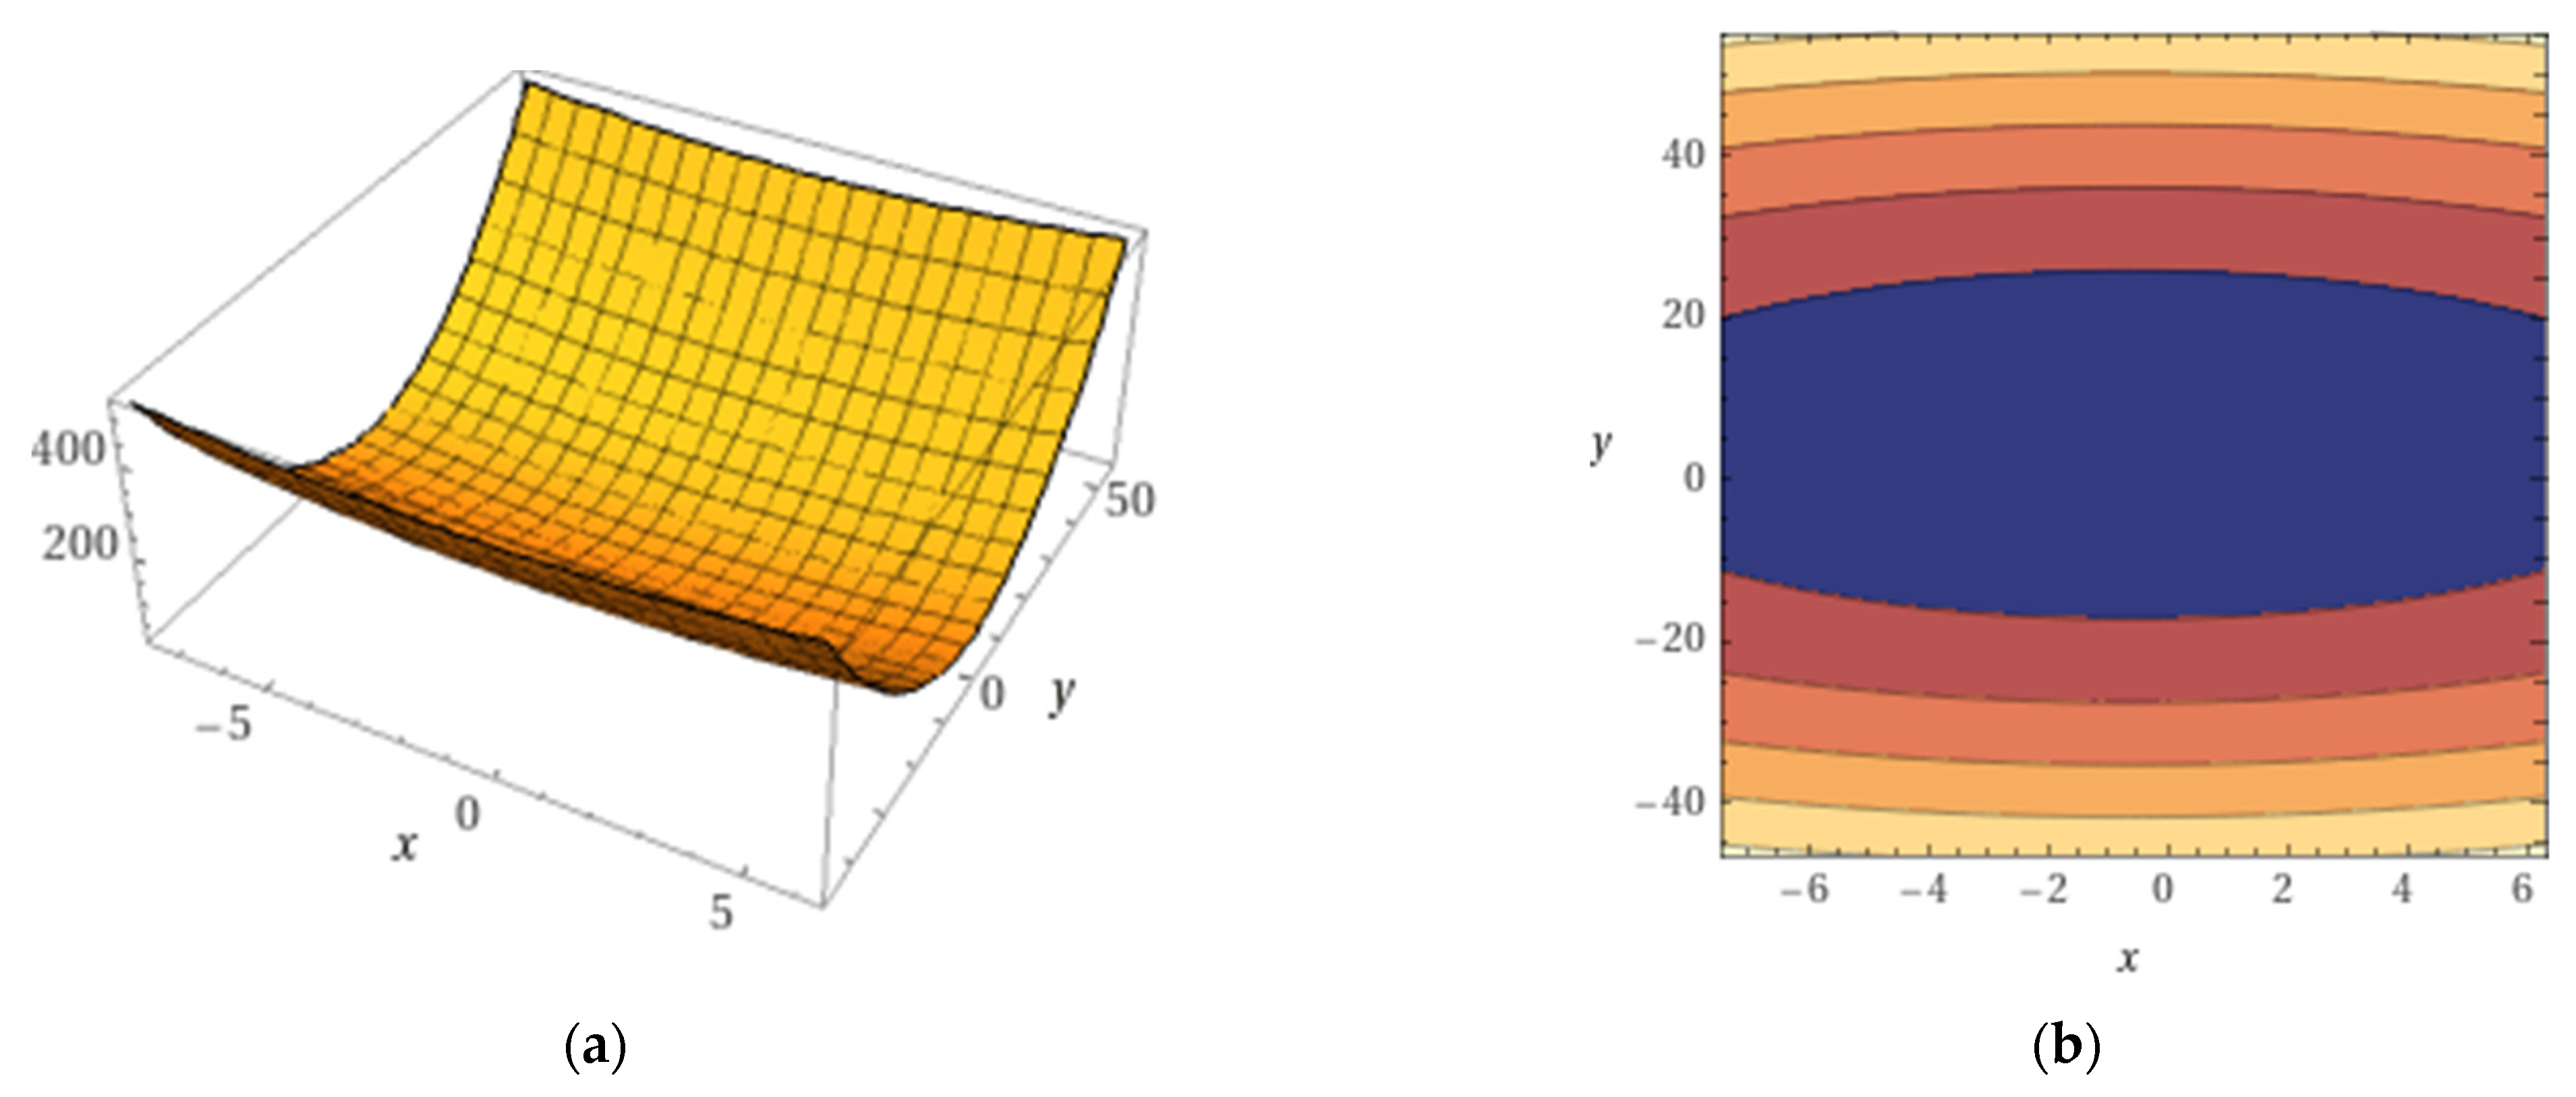
Based on the values of the coefficients of Equations (8) and (9), graphical representations were generated in 3D format and isoquants. These representations describe the variation in the Gliad/Glut ratio, as shown in Figure 7 and Figure 8.
In order to validate the obtained models, for each quality index, the degree of fit between the estimated (predicted) values, and the real (measured) values was evaluated. Linear equations described the relationship between the predicted values and the real (measured) values, according to Table 6.
From the analysis of the recorded values, a very high level of fit was observed between the actual and predicted values for the GLT index (R2 = 0.986), the HMW index (R2 = 0.968), and the PRO index (R2 = 0.911). A high level of fit was recorded for the Glut index (R2 = 0.836) and the LMW index (R2 = 0.820). A moderate level of fit was recorded for the Gliad index (R2 = 0.770). Linear regression lines and the degree of fit between the predicted values and the actual (measured) values for the quality indices studied are presented in Figure S1.
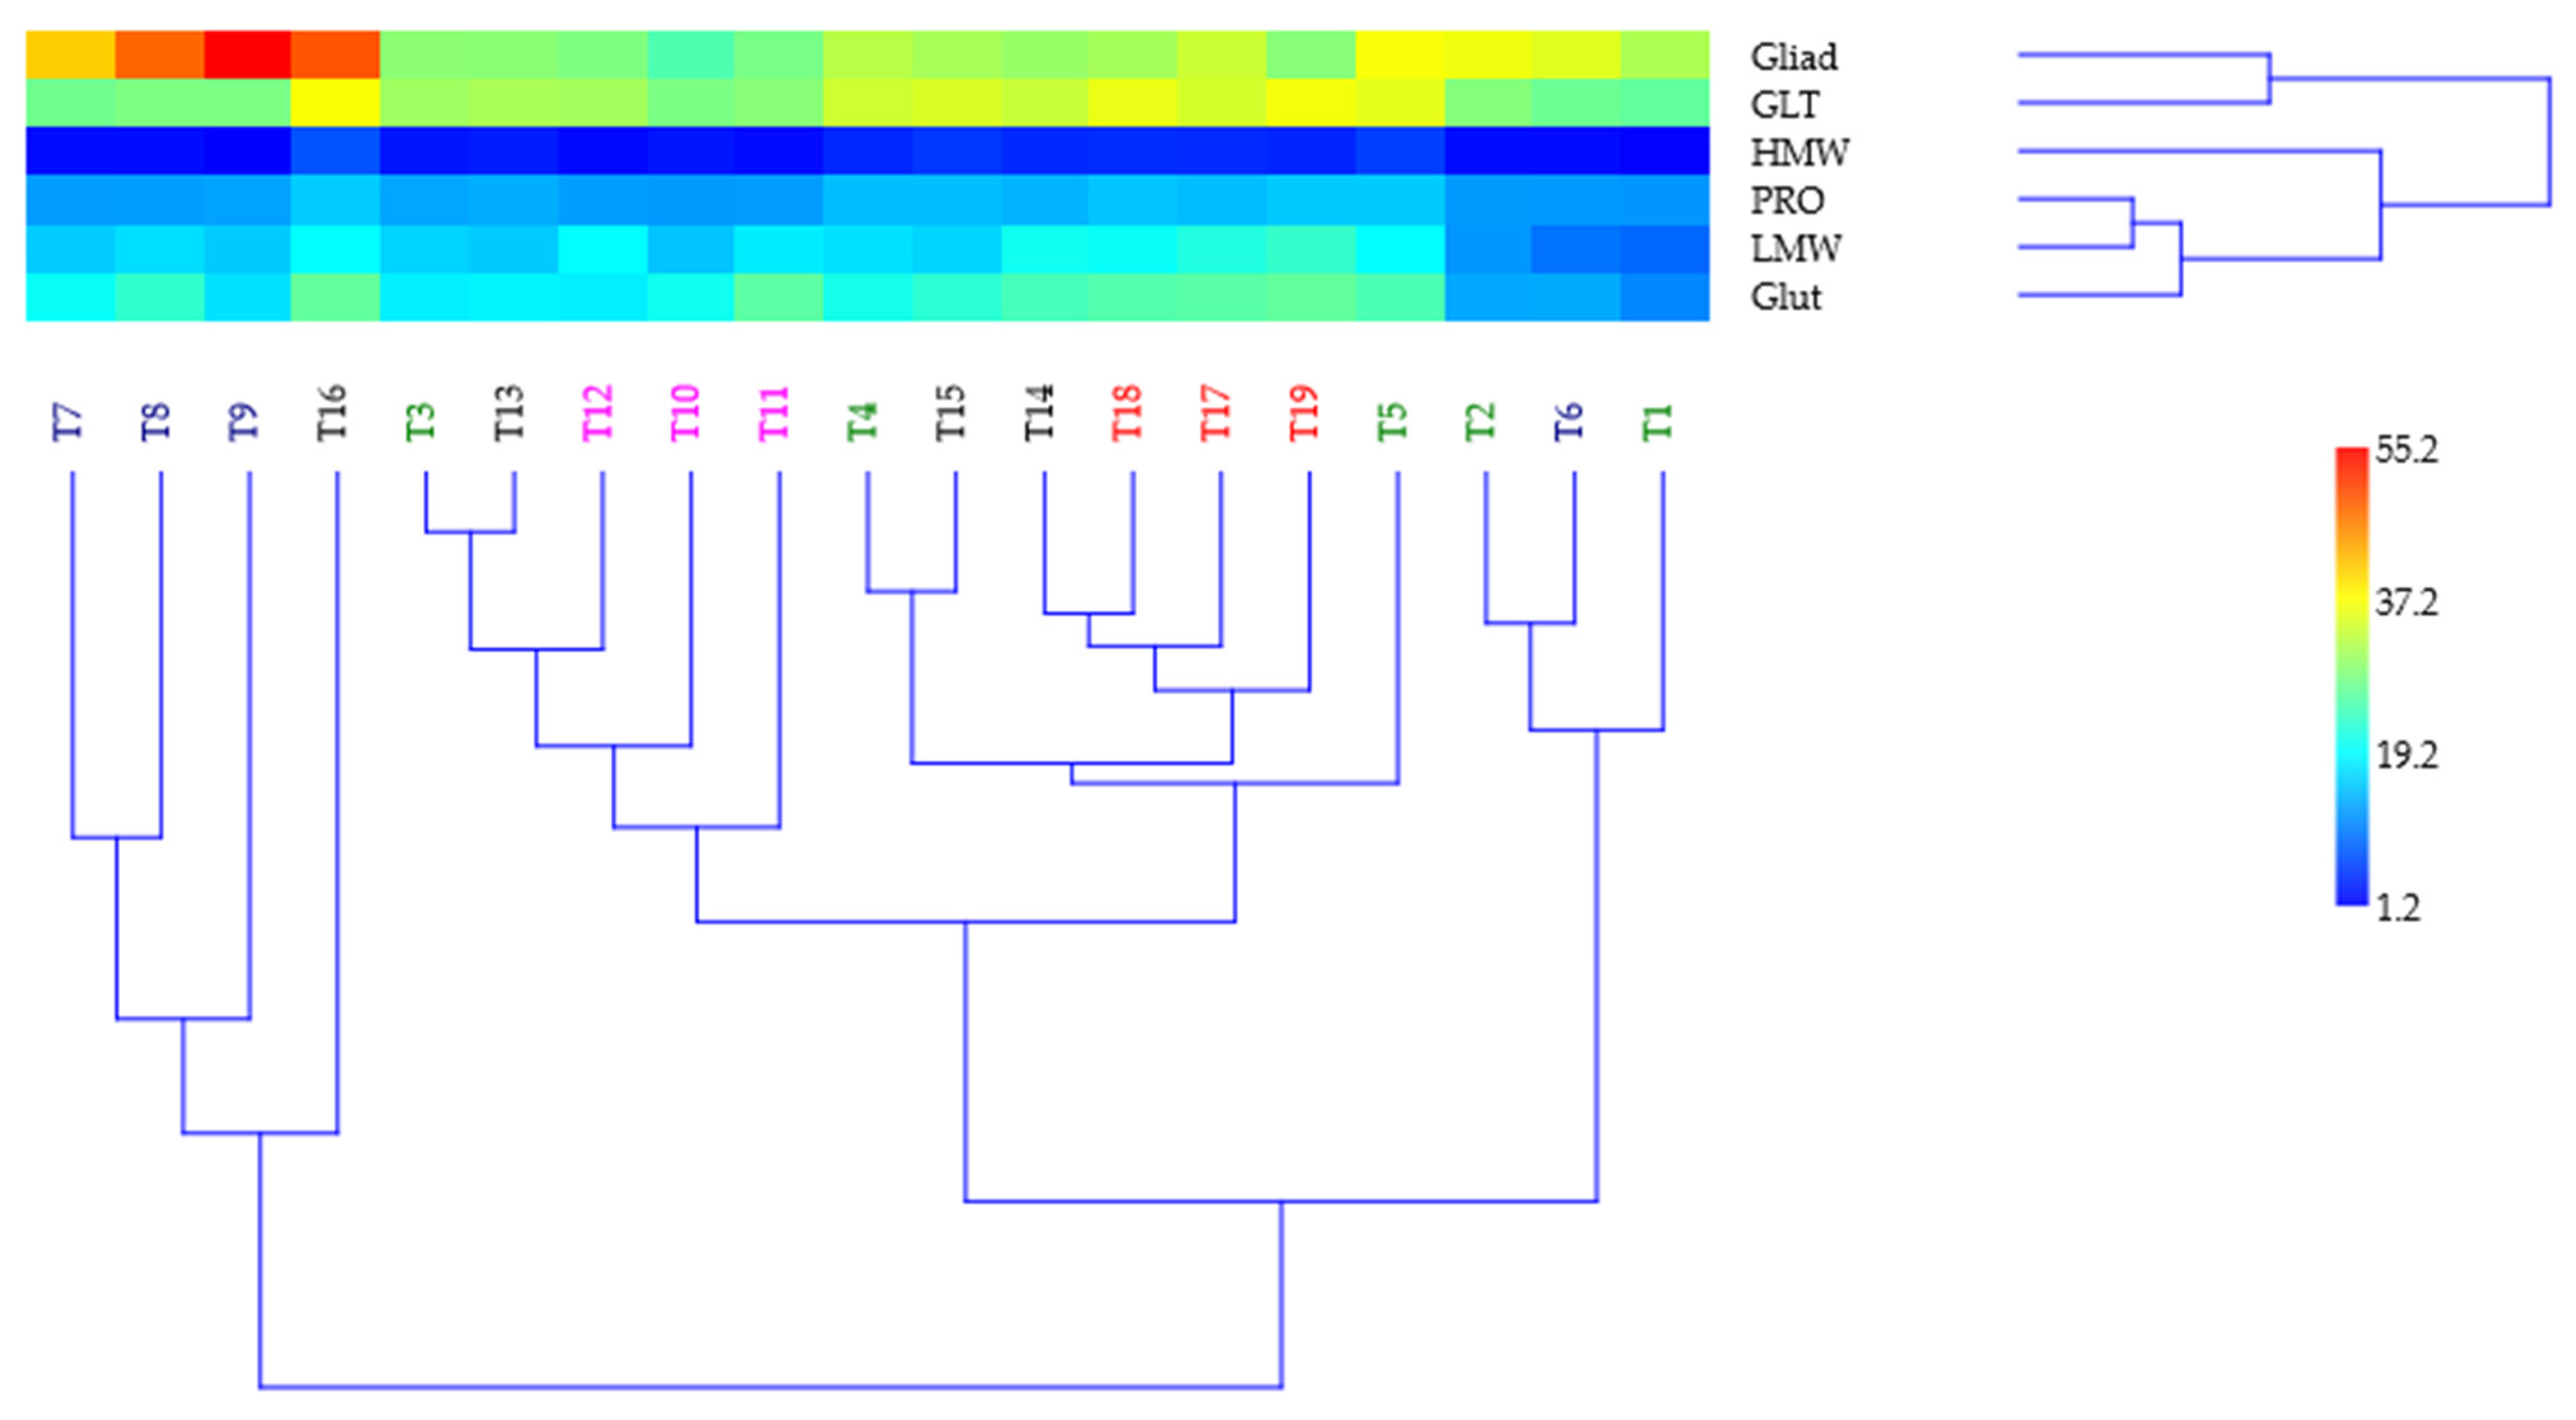
In order to facilitate the transfer of research results to agricultural practice, a cluster dendrogram was generated (Coph.corr. = 0.826 (Figure 9)), and similarity and distance indices—SDIs—were calculated (Table S1).
These metrics represent useful tools for growers to comparatively analyze fertilization variants with similar effects on wheat quality indices in order to optimize agricultural practices. Based on the dendrogram, it was observed how different trials generated similar results in quality indices (considered as a whole), but with variable fertilizer consumption. Experimental trials were grouped based on similarity into two distinct clusters, with several subclusters. In each cluster/subcluster, trials with a high level of similarity were identified (e.g., T3 with T13, SDI = 1.304, the highest level of similarity; T4 with T15, SDI = 2.612; T14 with T18, SDI = 3.098; T2 with T6, SDI = 3.311; T7 with T7, SDI = 8.014). In relation to each quality index, considered individually, dendrograms were generated (Figure S2) which showed the association of fertilization trials based on similarity, under conditions of statistical safety (Coph.corr. = 0.875 for PRO index; Coph.corr. = 0.852 for GLT index; Coph.corr. = 0.908 for Gliad index; Coph.corr. = 0.843 for Glut index; Coph.corr. = 0.843 for HMW index; and Coph.corr. = 0.847 for LMW index). In relation to wheat quality objectives and fertilization costs (price of fertilizers as inputs), growers can opt for one fertilization option or another in order to optimize agricultural technologies for wheat cultivation.

4. Discussion

Quality indices in wheat grains of the variety ‘Ciprian’ presented differentiated variability under the influence of applied mineral fertilization. Low variability was recorded in the case of PRO (CV = 10.19) and GLT (CV = 11.56). Moderate variability was recorded in the case of glutenins (CV = 22.90), in the case of LMW (CV = 22.58), and in the case of gliadins (CV = 23.67). High variability was recorded in the case of HMW (CV = 49.40), of the Gliad/Glut ratio (CV = 34.01), and of the HMW/LMW ratio (CV = 39.29). The variability of quality indices in wheat has also been reported in other studies. High variability was associated with nitrogen (51.4%) in the variation of protein content in wheat [40]. High variability was identified in the HMWGs and LMWGs groups, in a collection of Iranian wheat genotypes [41].
The experimental variants contributed differently to the values of the quality indices considered. Four fertilization variants, T1, T2, T6, and T10, generated results below the average value of the experiment for all indices considered (only for proteins, gluten, and gliadins in the case of T10), under statistical safety conditions. Variant T16 was the only variant that generated quality index values above the average value, under conditions of statistical safety. The other variants had variable contributions to the indices, with values above the average of the experiment or below the average, and different levels of statistical safety. However, variants T5, T17, T18 and T19 were observed to have a strong positive influence on the indices, under conditions of statistical safety. Specific to these variants was the presence of high amounts of nitrogen (T5), including the high dose of nitrogen associated with phosphorus and potassium (T17, T18, T19). In relation to climatic conditions, the best values in terms of wheat quality were obtained in 2015 and 2017. The year 2016, though it can be considered optimal in terms of recorded temperatures, ranked in last place in terms of grain quality due to the precipitation that fell in the period before the harvest, when the so-called qualitative washing of wheat occurred.
Similar studies have confirmed the influence of nitrogen in high doses on the accumulation of storage protein components, on the increase in the total content of gliadins and glutenins, and the content of gluten macropolymers, with favorable influences on dough properties and bread quality [42]. The application of nitrogen in high doses positively influenced the yield and quality of different wheat varieties, the content of protein and gluten, but also polymeric fractions, soluble glutenin, glutenin, insoluble GMP [43]. The increase in the synthesis and accumulation of HMW-GS was influenced by nitrogen from fertilizers applied to wheat, with a more pronounced effect in varieties with medium gluten compared to varieties with strong gluten [44]. Associated with the increase in the nitrogen rate (e.g., 240 kg ha−1 N, urea) an increase in the content of total protein and protein components was recorded, alongside a reduction in the synthesis and accumulation of HMW-GS under conditions of excess nitrogen application [45]. The good nitrogen supply of wheat crops and good nitrogen nutrition of plants led to increased protein content in grains, and to higher values of the gliadin/glutenin ratio, with good effects on the finished products [46]. Increasing the nitrogen rate led to an increase in protein, gluten, and GMP (glutenin micropolymer) content in wheat in a differentiated manner in relation to the specificity of the wheat lines; lower increases were recorded in lines lacking HMW-GS, compared to the wild type [47]. The authors associated the differentiation of the results with the manifestation of genes encoding HMW-GS and the activity of nitrate reductase and glutamine synthetase. Based on a meta-analysis (66 articles), it was concluded that the nitrogen application rate (NAR) significantly influenced protein content (growth increase 9.49–28.6%), gliadin content (growth between 9.1 and 30.5%), glutenin content (growth increase between 2.9 and 54.4%), albumin content (growth increase between 5.06 and 15.8%), and globulin (growth increase 8.52–24.0%) in wheat grains, compared to variants without fertilizers [48]. Optimal values between 240 and 300 kg ha−1 NAR have been reported, when environmental conditions were not considered, and other ranges of values correlated with specific crop conditions [48]. Variation in protein content in four wheat varieties (two medium-gluten varieties and two high-gluten varieties) was recorded in relation to the nitrogen fertilization gradient in five doses (N0, N120, N180, N240 and N360) [49]. Some bibliographic sources reported that the gliadin/glutenin ratio remained constant in relation to certain nitrogen fertilization regimes [50]. In relation to three tillage systems, phosphorus fertilizers positively influenced wheat gluten content [51]. Phosphorus applied singly had a less significant effect on wheat protein fractions compared to nitrogen or the associated application of phosphorus with nitrogen [52]. The fraction of large soluble and insoluble monomeric proteins increased at low nitrogen rates and low nitrogen and phosphorus rates, while the fractions of large polymeric proteins and total insoluble forms decreased in response to the same treatments [52]. Associated with the same nitrogen, or nitrogen and phosphorus treatments, small polymeric proteins (soluble and insoluble) increased significantly [52]. The possibility of potassium fertilizers contributing to the increase in protein content in wheat has been reported [53]. Foliar application of nutrients (sulfur and potassium) to two wheat varieties led to a decrease in albumin protein content, especially associated with high doses of potassium, without a significant effect on globulin content [54]. The associated application of the two nutrients by foliar route (0.2% S, 0.3% K) generated better effects compared to the single application of each [54].
The multivariate analysis facilitated the grouping of quality indices in relation to the action in the principal components. All quality indices showed positive action, according to the values of the correlation coefficient in PC1 and in PC2. Protein (PRO) and gluten (GLT) showed very strong action, with both indices in PC1. Glutenin (Glut) showed strong action in PC1, and gliadin (Gliad) showed very strong action in PC2. HMW and LMW fractions showed strong action, both in PC1. The gliadin/glutenin ratio (Gliad/Glut) showed moderate action in intensity in PC2. Principal component analysis differentiated wheat seed parameters with major implications for wheat flour quality (water absorption) in relation to the type of finished products [55].
In a study of 25 winter wheat varieties, principal component analysis explained through PC1 (42.5%) in yield components and through PC2 (21.1%) explained quality indices, e.g., sedimentation value, wet gluten ratio and protein content—VG/P [56]. Principal component analysis explained the variation in gliadin content (α- and γ-gliadins, in particular) as a close association/link, with the differential expression of accumulation of some α-gliadin variants in wheat [29]. Principal component analysis (PC1 and PC2 explained more than 80% of the variance) showed the association of the wild wheat genotype with increased cumulative α-gliadin gene expression at different N rates, while the RNAi genotypes were inversely associated, or showed no association with the respective genes [57]. PCA analysis confirmed that a wheat line (D793) was positively associated with some pseudogenes and negatively associated with the expression of putative α-gliadin genes, regardless of the level of N fertilization [29]. PCA analysis differentiated durum wheat varieties with high and medium-high gluten quality indices from genotypes with low and medium-low gluten quality indices, and was considered a reliable method for qualitative differentiation of wheat varieties [58]. Principal component analysis differentiated different wheat samples and groups of samples from different producers, based on priority quality indices in bread quality, as a finished product [22].
Based on the correlation analysis (Figure 7), a very strong correlation of nitrogen from fertilizers was found in the protein and gluten values and a strong correlation with HMW. These values showed the contribution of nitrogen from fertilizers applied to these quality indices. Positive-, moderate-, and weak-intensity action of nitrogen was recorded on glutenin (Glut) and on LMW, and weak negative action was recorded on the Gliad/Glut ratio. Phosphorus had a moderate correlation with, and therefore a moderate influence on, gliadin, and correlated with weak action in the formation of the other quality indices. Potassium showed a weak correlation and action, which was positive in the formation of LMW, and negative in the formation of gliadin.
In other studies, a high nitrogen contribution has also been reported to increase protein content, gluten, protein fractions [43], the HMW-GS index in medium-gluten varieties [44], total protein and protein components [45], protein content, gliadin, glutenin [42], increasing protein content and gliadin/glutenin ratio [46], protein content, gluten and GMP [47], protein content and protein fractions [48], and protein content [49].
The models obtained by regression analysis described the variation in the quality indices in relation to the applied fertilizers, in conditions of very high statistical safety (PRO, GLT, Gliad, HMW, Glisd/Glut) and high Glut, LMW, according to the values of the regression coefficient (R2) and the values of the statistical safety parameter p. The RMSE parameter confirmed the level of accuracy of the obtained models. The obtained models can be considered important for estimating the values of the quality indices and adjusting the doses of fertilizers in relation to certain desired levels for each index. Zhang et al. [59] reported regression models that described the need for NP and K for the formation of protein content and yield in wheat, under the conditions of the major wheat-growing regions in China.
From the analysis of the coefficients of Equation (8) and the graphical distribution, Figure 7a,b, it was found that the Gliad/Glut ratio varied more widely depending on gliadin (x-axis) than in relation to glutenin (y-axis). From the analysis of the coefficients of Equation (9) and the graphical distribution, Figure 8a,b), it was found that the Gliad/Glut ratio varied more widely depending on gluten content (x-axis) than in relation to protein content (y-axis).
Cluster analysis has been a useful tool for grouping wheat genotypes in relation to protein and gluten content, and identifying valuable genotypes in breeding programs for the creation of high-yielding varieties [60]. Cluster analysis was useful for classifying some wheat genotypes based on Euclidean distances regarding gliadin DAP sport under the influence of nitrogen fertilizer [42]. The classification of some wheat genotypes according to their tolerance to heat stress was performed through cluster analysis and multivariate analysis [61]. In the present study, cluster analysis facilitated the classification of 19 fertilized trials, based on similarity in relation to the set of quality indices studied (Figure 9), as well as in relation to each quality index, considered independently (Figure S2). Different associations of trials in clusters based on similarity were observed, depending on the analysis mode. In relation to the interest in maximizing a certain quality index, or for a qualitatively balanced level in wheat production, a certain fertilization trial can be chosen.

5. Conclusions

The results recorded showed the differentiated influence of the nutrients applied through fertilization on the quality indices of wheat of the ‘Ciprian’ variety. The nitrogen applied singly (T2–T5), in increased rates (e.g., T5), strongly influenced the protein and gluten content and fractions of proteins, glutenins, HMW, and LMW. The phosphorus applied singly (T6–T9) negatively influenced the content of protein, gluten, and HMW in relation to the average of the experiment, and positively influenced the content of gliadins, in conditions of statistical safety. Potassium applied singly (T10–T12) negatively influenced all indices in relation to the average of the experiment, except for variant T11, which had a positive influence on the glutenin content, and variant T12, which had a positive influence on the LMW index. Nitrogen in combination with phosphorus (T13–T16) generated positive effects on the quality indices in most cases with statistical certainty. Variant T16 stood out, presenting positive differences in all indices compared to the average of the experiment, in conditions of statistical certainty. At the same doses of nitrogen applied singly (T2–T5), nitrogen associated with phosphate (T13–T16) generated positive and more stable results. Nitrogen applied in association with phosphorus and potassium (T17–T19) generated better results compared to the single application of nitrogen (T2–T5), at the level of nitrogen–phosphorus fertilization (T13–T16), but some indices (e.g., glitenins, LMW) were higher and more stable. To these results, we added the additional effort associated with potassium fertilizers. The multivariate analysis classified the quality indices in relation to the principal components, with five indices included in PC1 (PRO, GLT, HMW, Glut, LMW) and two indices included in PC2 (Gliad, Gliad/Glut). All quality indices showed positive action in relation to the principal components. This suggests that through fertilization, under the study conditions, a positive influence of nutrients was recorded on the quality indices, and optimizing fertilization in relation to one index will have positive effects on the other indices, without major imbalances. A high level of fit was recorded between the estimated values of the indices by modeling, with independent variables, NPK and the measured values of the quality indices. The cluster analysis provided useful information in the form of dendrograms, which showed the level of similarity of the fertilization trials in relation to the quality indices, in order to transfer research information to agricultural practice and farmers. They can be a good tool for agricultural fertilization practices and management decisions in optimizing wheat crop technology.

Supplementary Materials

The following supporting information can be downloaded at https://www.mdpi.com/article/10.3390/agronomy15092076/s1. Figure S1. The degree of fit between the predicted values and the actual (measured) values for quality indices in wheat, ‘Ciprian’ variety, in conditions of NPK mineral fertilization. Table S1. Similarity and distance indices values for trials in relation to quality indices in wheat, ‘Ciprian’ variety. Figure S2. Cluster dendrograms grouping fertilization trials in relation to each wheat quality index, ‘Ciprian’ variety.

Author Contributions

Conceptualization, A.L.A. and F.S.; methodology, A.L.A. and F.S.; software, F.S. and M.V.H.; validation, F.S., A.H. and M.N.H.; formal analysis, F.S.; investigation, A.L.A., G.G. and F.S.; resources, A.L.A.; data curation, A.L.A.; writing—original draft preparation, A.L.A. and F.S.; writing—review and editing, M.V.H., A.H., M.N.H. and G.G.; visualization, A.L.A. and F.S.; supervision, M.V.H.; project administration, A.L.A. All authors have read and agreed to the published version of the manuscript.

Funding

This research received no external funding.

Data Availability Statement

Data are contained within the article.

Acknowledgments

The authors thank ARDS Lovrin for the support of this study. This work is published with the own funds of the “King Mihai I” University of Life Sciences in Timișoara.

Conflicts of Interest

The authors declare no conflicts of interest.

Abbreviations

The following abbreviations are used in this manuscript:
PROProtein content
GLTGluten content
GliadGliadins content
GlutGlutenins content
HMWHigh-molecular-weight subunits
LMWLow-molecular-weight subunits
a.s.Active substance
Sig.Significant
nsNot significant
meMilliequivalent
MmhosMillimhos

References

  1. Cho, K.; Beom, H.-R.; Jang, Y.-R.; Altenbach, S.B.; Vensel, W.H.; Simon-Buss, A.; Lim, S.-H.; Kim, M.G.; Lee, J.-Y. Proteomic profiling and epitope analysis of the complex α-, γ-, and ω-gliadin families in a commercial bread wheat. Front. Plant Sci. 2018, 9, 818. [Google Scholar] [CrossRef]
  2. Lakhneko, O.; Danchenko, M.; Morgun, B.; Kováč, A.; Majerová, P.; Škultéty, Ľ. Comprehensive comparison of clinically relevant grain proteins in modern and traditional bread wheat cultivars. Int. J. Mol. Sci. 2020, 21, 3445. [Google Scholar] [CrossRef]
  3. Pourmohammadi, K.; Abedi, E.; Hashemi, S.M.B. Gliadin and glutenin genomes and their effects on the technological aspect of wheat-based products. Curr. Res. Food Sci. 2023, 7, 100622. [Google Scholar] [CrossRef] [PubMed]
  4. Wieser, H.; Koehler, P.; Scherf, K.A. Chemistry of wheat gluten proteins: Quantitative composition. Cereal Chemi. 2023, 100, 36–55. [Google Scholar] [CrossRef]
  5. Wieser, H. Chemistry of gluten proteins. Food Microbiol. 2007, 24, 115–119. [Google Scholar] [CrossRef] [PubMed]
  6. Plessis, A.; Ravel, C.; Bordes, J.; Balfourier, F.; Martre, P. Association study of wheat grain protein composition reveals that gliadin and glutenin composition are trans-regulated by different chromosome regions. J. Exp. Bot. 2013, 64, 3627–3644. [Google Scholar] [CrossRef] [PubMed]
  7. Dai, Y.; Li, J.; Shi, J.; Gao, Y.; Ma, H.; Wang, Y.; Ma, H. Molecular characterization and marker development of the HMW-GS gene from Thinopyrum elongatum for improving wheat quality. Int. J. Mol. Sci. 2023, 24, 11072. [Google Scholar] [CrossRef]
  8. Shewry, P.R. What is gluten–Why is it special? Front. Nutr. 2019, 6, 101. [Google Scholar] [CrossRef]
  9. Altenbach, S.B.; Chang, H.-C.; Rowe, M.H.; Yu, X.B.; Simon-Buss, A.; Seabourn, B.W.; Green, P.H.; Alaedini, A. Reducing the immunogenic potential of wheat flour: Silencing of alpha gliadin genes in a U.S. wheat cultivar. Front. Plant Sci. 2020, 11, 20. [Google Scholar] [CrossRef]
  10. Delcour, J.A.; Joye, I.J.; Pareyt, B.; Wilderjans, E.; Brijs, K.; Lagrain, B. Wheat gluten functionality as a quality determinant in cereal-based food products. Annu. Rev. Food Sci. Technol. 2012, 3, 469–492. [Google Scholar] [CrossRef]
  11. Payne, P.I. Genetics of wheat storage proteins and the effect of allelic variation on bread-making quality. Ann. Rev. Plant Physiol. 1987, 38, 141–153. [Google Scholar] [CrossRef]
  12. Ma, S.; Han, W.; Li, L.; Zheng, X.; Wang, X. The thermal stability, structural changeability, and aggregability of glutenin and gliadin proteins induced by wheat bran dietary fiber. Food Funct. 2019, 10, 172–179. [Google Scholar] [CrossRef] [PubMed]
  13. Urade, R.; Sato, N.; Sugiyama, M. Gliadins from wheat grain: An overview, from primary structure to nanostructures of aggregates. Biophys. Rev. 2018, 10, 435–443. [Google Scholar] [CrossRef]
  14. Zhang, Y.; Hu, M.; Liu, Q.; Sun, L.; Chen, X.; Lv, L.; Liu, Y.; Jia, X.; Li, H. Deletion of high-molecular-weight glutenin subunits in wheat significantly reduced dough strength and bread-baking quality. BMC Plant Biol. 2018, 18, 319. [Google Scholar] [CrossRef] [PubMed]
  15. Nucia, A.; Okoń, S.; Tomczyńska-Mleko, M. Characterization of HMW glutenin subunits in European spring common wheat (Triticum aestivum L.). Genet. Resour. Crop Evol. 2019, 66, 579–588. [Google Scholar] [CrossRef]
  16. Franaszek, S.; Salmanowicz, B. Composition of low-molecular-weight glutenin subunits in common wheat (Triticum aestivum L.) and their effects on the rheological properties of dough. Open Life Sci. 2021, 16, 641–652. [Google Scholar] [CrossRef]
  17. Li, Y.; Fu, J.; Shen, Q.; Yang, D. High-molecular-weight glutenin subunits: Genetics, structures, and relation to end use qualities. Int. J. Mol. Sci. 2021, 22, 184. [Google Scholar] [CrossRef]
  18. Chen, Q.; Yang, C.; Zhang, Z.; Wang, Z.; Chen, Y.; Rossi, V.; Chen, W.; Xin, M.; Su, Z.; Du, J.; et al. Unprocessed wheat γ-gliadin reduces gluten accumulation associated with the endoplasmic reticulum stress and elevated cell death. New Phytol. 2022, 236, 146–164. [Google Scholar] [CrossRef]
  19. Barak, S.; Mudgil, D.; Khatkar, B.S. Relationship of gliadin and glutenin proteins with dough rheology, flour pasting and bread making performance of wheat varieties. LWT-Food Sci. Technol. 2013, 51, 211–217. [Google Scholar] [CrossRef]
  20. Barak, S.; Mudgil, D.; Khatkar, B.S. Influence of gliadin and glutenin fractions on rheological, pasting, and textural properties of dough. Int. J. Food Prop. 2014, 17, 1428–1438. [Google Scholar] [CrossRef]
  21. Dhaka, V.; Khatkar, B.S. Effects of gliadin/glutenin and HMW-GS/LMW-GS ratio on dough rheological properties and bread-making potential of wheat varieties. J. Food Qual. 2015, 38, 71–82. [Google Scholar] [CrossRef]
  22. Schopf, M.; Wehrli, M.C.; Becker, T.; Jekle, M.; Scherf, K.A. Fundamental characterization of wheat gluten. Eur. Food Res. Technol. 2021, 247, 985–997. [Google Scholar] [CrossRef]
  23. Chaudhary, N.; Virdi, A.S.; Dangi, P.; Khatkar, B.S.; Mohanty, A.K.; Singh, N. Protein, thermal and functional properties of α-, γ- and ω-gliadins of wheat and their effect on bread making characteristics. Food Hydrocoll. 2022, 124 Pt A, 107212. [Google Scholar] [CrossRef]
  24. Cinco-Moroyoqui, F.J.; MacRitchie, F. Quantitation of LMW-GS to HMW-GS ratio in wheat flours. Cereal Chem. 2008, 85, 824–829. [Google Scholar] [CrossRef]
  25. Verbruggen, I.M.; Veraverbeke, W.S.; Delcour, J.A. Significance of LMW-GS and HMW-GS for dough extensibility: «Addition» versus «Incorporation» protocols. J. Cereal Sci. 2001, 33, 253–260. [Google Scholar] [CrossRef]
  26. Li, M.; Yue, Q.; Liu, C.; Zheng, X.; Hong, J.; Li, L.; Bian, K. Effect of gliadin/glutenin ratio on pasting, thermal, and structural properties of wheat starch. J. Cereal Sci. 2020, 93, 102973. [Google Scholar] [CrossRef]
  27. Zhao, L.; Song, L.; Li, L.; Li, X. Effects of HMW-GS Dx2 absence on the protein aggregation characteristics and thermal stability of wheat flour during maturation. Food Qual. Saf. 2023, 7, fyad019. [Google Scholar] [CrossRef]
  28. Geisslitz, S.; Longin, C.F.H.; Scherf, K.A.; Koehler, P. Comparative study on gluten protein composition of ancient (einkorn, emmer and spelt) and modern wheat species (durum and common wheat). Foods 2019, 8, 409. [Google Scholar] [CrossRef]
  29. García-Molina, M.D.; Barro, F. Characterization of changes in gluten proteins in low-gliadin transgenic wheat lines in response to application of different nitrogen regimes. Front. Plant Sci. 2017, 8, 257. [Google Scholar] [CrossRef]
  30. Rathan, N.D.; Mahendru-Singh, A.; Govindan, V.; Ibba, M.I. Impact of high and low-molecular-weight glutenins on the processing quality of a set of biofortified common wheat (Triticum aestivum L.) lines. Front. Sustain. Food Syst. 2020, 4, 583367. [Google Scholar] [CrossRef]
  31. ESRI. ArcGIS Desktop, version Release 10; Environmental Systems Research Institute: Redlands, CA, USA, 2025.
  32. Șandru, I.; Pușcă, I. Stațiunea de Cercetări Agricole Lovrin; Editura Brumar: Timisoara, Romania, 2002; pp. 10–11. [Google Scholar]
  33. Meier, U. Growth Stages of Mono-and Dicotyledonous Plants e BBCH Monograph; Federal Biological Research Centre for Agriculture and Forestry: Bonn, Germany, 2001; 158p. [Google Scholar]
  34. Goetz, H.; Kuschel, M.; Wulff, T.; Sauber, C.; Miller, C.; Fisher, S.; Woodward, C. Comparison of selected analytical techniques for protein sizing, quantitation and molecular weight determination. J. Biochem. Biophys. Methods 2004, 60, 281–293. [Google Scholar] [CrossRef]
  35. Hey, J.S. Advances in microscale protein fractionation and analysis. Am. Biotechnol. Lab. 2007, 25, 12–16. [Google Scholar]
  36. Živančev, D.R.; Nikolovski, B.G.; Torbica, A.M.; Mastilović, J.S.; Dukić, N.H. Lab-on-a-chip method uncertainties in determination of high-molecular- weight glutenin subunits. Chem. Ind. Chem. Eng. Q. 2013, 19, 553–561. [Google Scholar] [CrossRef]
  37. Hammer, Ø.; Harper, D.A.T.; Ryan, P.D. PAST: Paleontological Statistics software package for education and data analysis. Palaeontol. Electron. 2001, 4, 1. [Google Scholar]
  38. JASP, Version 0.16.2; JASP Team: Washington, DC, USA, 2022.
  39. Mathematica, Version 14.2; Wolfram Research, Inc.: Champaign, IL, USA, 2024.
  40. Farrer, D.C.; Weisz, R.; Heiniger, R.; Murphy, J.P.; White, J.G. Minimizing protein variability in soft red winter wheat: Impact of nitrogen application timing and rate. Agron. J. 2006, 98, 1137–1145. [Google Scholar] [CrossRef]
  41. Maryami, Z.; Huertas-García, A.B.; Azimi, M.R.; Hernández-Espinosa, N.; Payne, T.; Cervantes, F.; Govindan, V.; Ibba, M.I.; Guzman, C. Variability for glutenins, gluten quality, iron, zinc and phytic acid in a set of one hundred and fifty-eight common wheat landraces from Iran. Agronomy 2020, 10, 1797. [Google Scholar] [CrossRef]
  42. Zhen, S.; Deng, X.; Xu, X.; Liu, N.; Zhu, D.; Wang, Z.; Yan, Y. Effect of high-nitrogen fertilizer on gliadin and glutenin subproteomes during kernel development in wheat (Triticum aestivum L.). Crop J. 2020, 8, 38–52. [Google Scholar] [CrossRef]
  43. Jiang, H.M.; Yu, S.L.; Yu, Z.W.; Zhao, Q.N.; Qiu, H.J.; Ding, X.Y. Response of wheat glutenin polymerization to increased nitrogen fertilization. J. Triticum Crops 2003, 23, 43–46, (In Chinese with English abstract). [Google Scholar]
  44. Zhang, D.Y.; Zhang, Y.Q.; Yang, W.D.; Yan, C.P.; Hu, T.J. Effect of nitrogen application on high molecular weight glutenin subunit expression and grain quality of winter wheat. Plant Nutr. Fertil. Sci. 2008, 14, 235–241. [Google Scholar] [CrossRef]
  45. Shi, Y.; Zhang, Y.L.; Yu, Z.W. Effects of nitrogen fertilizer application on protein components contents and processing quality of different wheat genotypes. Plant Nutr. Fertil. Sci. 2010, 16, 33–40, (In Chinese with English abstract). [Google Scholar]
  46. Trevisan, S.; Khorshidi, A.S.; Scanlon, M.G. Relationship between nitrogen functionality and wheat flour dough rheology: Extensional and shear approaches. Food Res. Int. 2022, 162 Pt B, 112049. [Google Scholar] [CrossRef]
  47. Yang, T.; Zhou, Q.; Wang, Q.; Wang, X.; Cai, J.; Huang, M.; Jiang, D. Effects of nitrogen fertilizer on quality characteristics of wheat with the absence of different individual high-molecular-weight glutenin subunits (HMW-GSs). Int. J. Mol. Sci. 2022, 23, 2178. [Google Scholar] [CrossRef]
  48. An, H.-Y.; Han, J.-J.; He, Q.-N.; Zhu, Y.-L.; Wu, P.; Wang, Y.-C.; Gao, Z.-Q.; Du, T.-Q.; Xue, J.-F. Influence of nitrogen application rate on wheat grain protein content and composition in china: A meta-analysis. Agronomy 2024, 14, 1164. [Google Scholar] [CrossRef]
  49. Hu, X.; Tian, P.; Fu, W.; Tian, Z.; Du, M.; Chang, Z.; Ye, Y.; Meng, X.; Wang, Y. Effects of nitrogen fertilizer application on the lodging resistance traits, yield, and quality of two gluten types of wheat. Agriculture 2025, 15, 637. [Google Scholar] [CrossRef]
  50. Rossmann, A.; Buchner, P.; Savill, G.P.; Hawkesford, M.J.; Scherf, K.A.; Mühling, K.H. Foliar N application at anthesis alters grain protein composition and enhances baking quality in winter wheat only under a low N fertiliser regimen. Eur. J. Agron. 2019, 109, 125909. [Google Scholar] [CrossRef]
  51. Ahmadi, H.; Mirseyed Hosseini, H.; Moshiri, F.; Alikhani, H.A.; Ftesami, H. Impact of varied tillage practices and phosphorus fertilization regimes on wheat yield and grain quality parameters in a five-year corn-wheat rotation system. Sci. Rep. 2024, 14, 14717. [Google Scholar] [CrossRef]
  52. Tóth, B.; van Biljon, A.; Labuschagne, M. Influence of low soil nitrogen and phosphorus on gluten polymeric and monomeric protein distribution in two high quality spring wheat cultivars. J. Cereal Sci. 2020, 91, 102867. [Google Scholar] [CrossRef]
  53. Bouacha, O.D.; Nouaigui, S.; Rezgui, S. Effects of N and K fertilizers on durum wheat quality in different environments. J. Cereal Sci. 2014, 59, 9–14. [Google Scholar] [CrossRef]
  54. Zang, F.; Zhang, M.; Zhou, Q.; Wang, X.; Zhong, Y.; Huang, M.; Dai, T.; Jiang, D.; Cai, J. Effect of sulfur and potassium foliar applications on wheat grain protein quality. Field Crops Res. 2024, 319, 109639. [Google Scholar] [CrossRef]
  55. Ahmad, S.; Pasha, I.; Saeed, M.; Shahid, M. Principal component analysis and correlation studies of spring wheats in relation to cookie making quality. Int. J. Food Prop. 2017, 20, 2299–2313. [Google Scholar] [CrossRef]
  56. Spanic, V.; Cosic, J.; Zdunic, Z.; Drezner, G. Characterization of agronomical and quality traits of winter wheat (Triticum aestivum L.) for fusarium head blight pressure in different environments. Agronomy 2021, 11, 213. [Google Scholar] [CrossRef]
  57. Sánchez-León, S.; Giménez, M.J.; Barro, F. The α-gliadins in bread wheat: Effect of nitrogen treatment on the expression of the major celiac disease immunogenic complex in two RNAi low-gliadin lines. Front. Plant Sci. 2021, 12, 663653. [Google Scholar] [CrossRef] [PubMed]
  58. Grassi, S.; Gullì, M.; Visioli, G.; Marti, A. Gluten aggregation properties as a tool for durum wheat quality assessment: A chemometric approach. LWT 2021, 142, 111048. [Google Scholar] [CrossRef]
  59. Zhang, X.; Guo, Z.; Xu, J.; Huang, C.; Dang, H.; Mu, W.; Zhang, L.; Hou, S.; Huang, N.; Li, C.; et al. Nutrient requirements determined by grain yield and protein content to optimize N, P, and K fertilizer management in China. Sci. Total Environ. 2024, 946, 174187. [Google Scholar] [CrossRef] [PubMed]
  60. Hailegiorgis, D.; Mesfin, M.; Genet, T. Genetic divergence analysis on some bread wheat genotypes grown in Ethiopia. J. Cent. Eur. Agric. 2011, 12, 344–352. [Google Scholar] [CrossRef]
  61. Hasan, M.M.; Mia, M.A.B.; Ahmed, J.U.; Karim, M.A.; Islam, A.K.M.A.; Moho-Ud-Din, M. Heat stress tolerance in wheat seedling: Clustering genotypes and identifying key traits using multivariate analysis. Heliyon 2024, 10, e38623. [Google Scholar] [CrossRef]
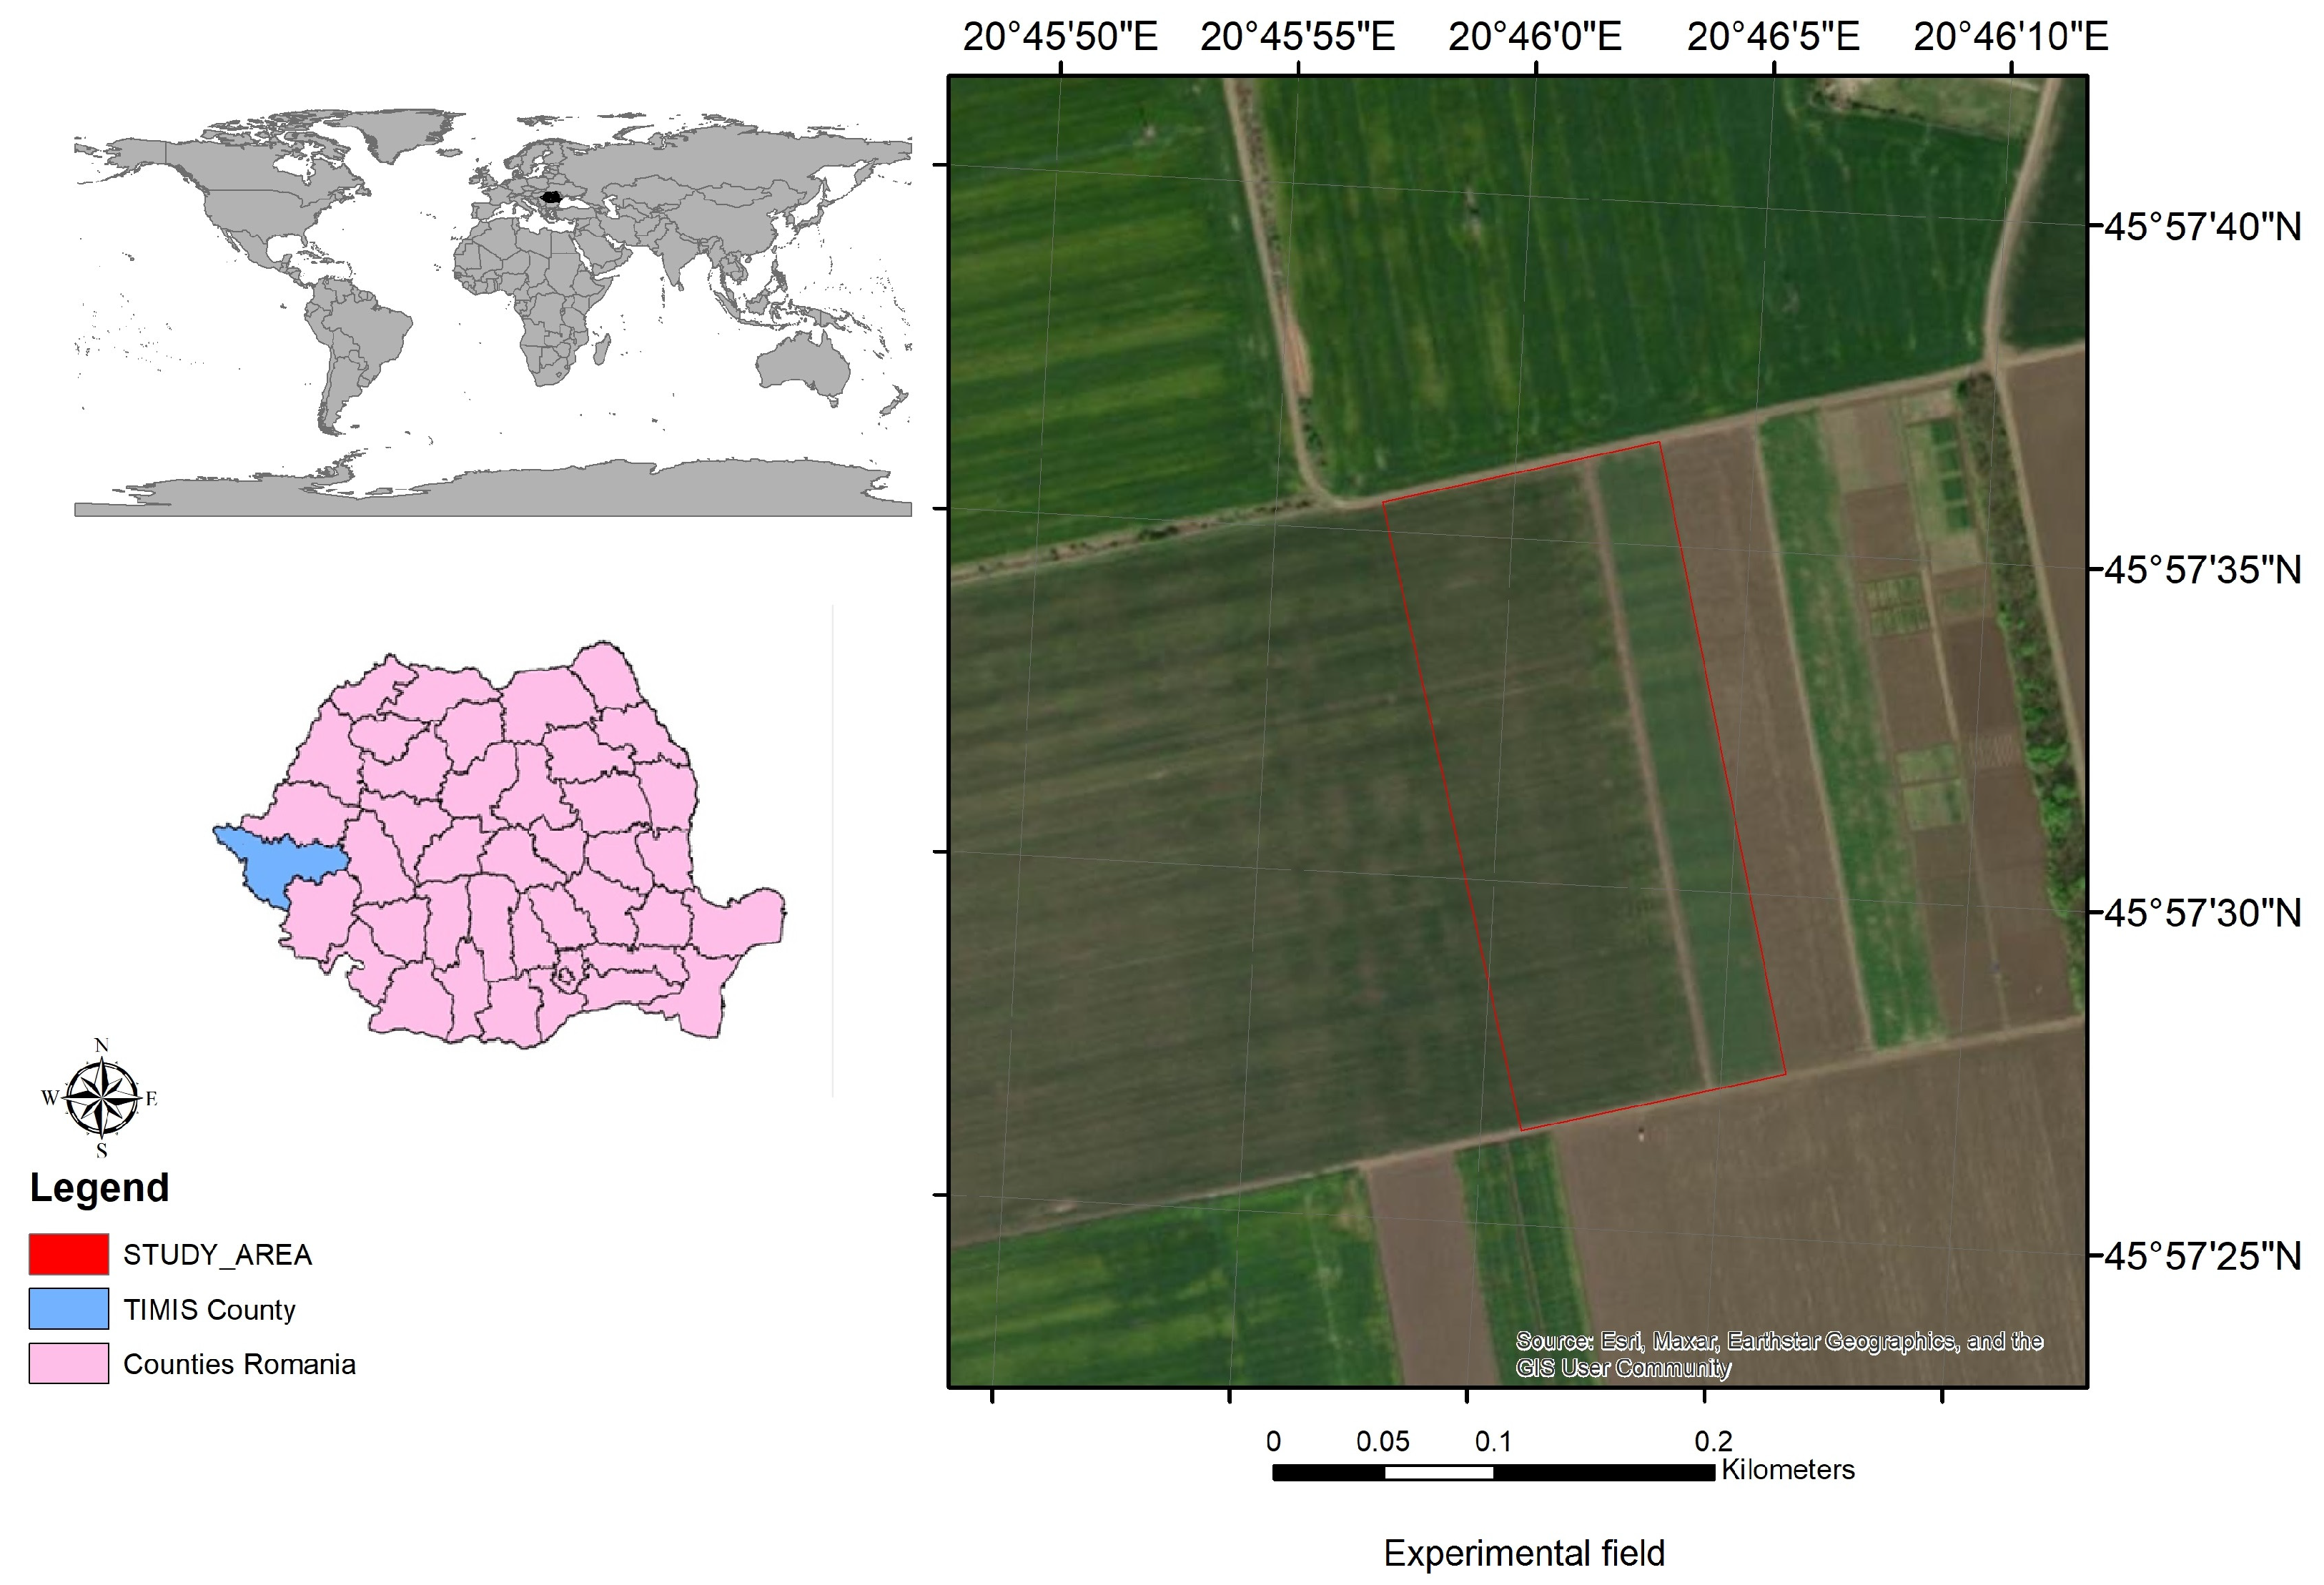
Figure 1. Location of field experiment, ARDS Lovrin, Timis County, Romania.
Agronomy 15 02076 g001
Figure 2. Climatic conditions recorded at ARDS Lovrin during the study period.
Agronomy 15 02076 g002
Figure 3. Path diagram of indices grouping by main components and the mode of indices’ action. Note: the green line indicates positive action; the red line indicates negative action; line thickness indicates action intensity (e.g., the thickest line—very strong action, and the thinnest line—very weak action).
Agronomy 15 02076 g003
Figure 4. Eigenvalue and component interaction.
Agronomy 15 02076 g004
Figure 5. PCA diagram regarding the arrangement of variants in relation to quality indices.
Agronomy 15 02076 g005
Figure 6. Correlations values between quality indices in wheat of the variety ‘Ciprian’. Explanations: “*”—significance for p < 0.05; “**”—significance for p < 0.01; “***”—significance for p < 0.001. Blue color, with different shades, indicates positive correlation; Red color, with different shades, indicates negative correlation.
Agronomy 15 02076 g006
Figure 7. Variation in the Gliad/Glut ratio in relation to the gliadin content (x-axis) and glutenin content (y-axes): (a) 3D model; (b) model in isoquants format.
Agronomy 15 02076 g007
Figure 8. Variation in the Gliad/Glut ratio in relation to the protein content (x-axis) and gluten content (y-axes): (a) 3D model; (b) model in isoquants format.
Agronomy 15 02076 g008
Figure 9. Cluster dendrogram with trials grouping based on similarity in relation to wheat quality indices. Trials’ color codes: green color—trials fertilized only with nitrogen; blue color—trials fertilized only with phosphorus; pink color—trials fertilized only with potassium; black color—trials fertilized with nitrogen and phosphorus; red color—trials fertilized with nitrogen, phosphorus and potassium.
Agronomy 15 02076 g009
Table 1. Physical–mechanical, hydrophysical and chemical characteristics of the typical, weakly gleyed, epicalcareous clay-clayey/medium clay-clayey chernozem from ARDS Lovrin [32].
ParametersSoil Profile Horizons
ApAmA/CCcaC/Ca
gr-ac
Depths (cm)0–2626–4747–4979–123123–200
Rough sand (2.0–0.2 mm, %)1.00.90.50.60.3
Fine sand (0.2–0.02 mm, %)34.336.435.238.524.7
Dust (0.02–0.002 mm, %)27.726.528.931.342.6
Clay (<0.002, %)37.036.235.429.632.4
Physical clay (<0.01 mm, %) 51.851.751.046.857.0
Specific density (D, g/cm3)2.432.552.562.63
Apparent density (AD, g/cm3)1.351.401.331.27
Total porosity (TP, %)45.00454850
Aeration porosity (AP, %)10.699.013.016.0
Coefficient of hygroscopicity (CH, %)8.798.07.87.0
Coefficient of withering (CW, %)13.1812.011.710.5
Fields capacity (FC, %)25.9026.026.025.4
Useful water capacity (UC, %)12.7514.014.314.8
Total water capacity (TC, %)33.8332.236.137.9
pH in H2O6.907.208.459.409.45
Carbonates (CaCO3, %)0.49.819.316.0
Hydraulic conductivity (K, mm/h)3.4711.910.312.8
Humus (H, %)3.473.282.73
Bacteria no. (mil/ 100 g dry soil)772
C:N13.713.913.7
Total nitrogen (%)0.1710.1590.120
Mobile phosphorus (ppm)75.731.78.7
Mobile potassium (ppm)205202163
Exchange bases (EB me for 100 g soil)27.627.620.3
Changeable hydrogen (CH me for 100 g soil)4.35
Cationic exchange capacity (CEC, me for 100 g soil)32.027.621.9
Bases saturation degree (V, %)86.4100100100100
EC (Mmhos/cm)0.780.571.68
Na+ (me for 100 g soil)0.040.100.66
Exchange Na+ (% of CEC)0.60.53.513.113.0
Table 2. Values of quality indices in wheat, variety ‘Ciprian’, in relation to mineral fertilization.
TrialNpKPROGLTGliadGlutHMWLMWGliad/Glut
(kg a.s. ha−1)(%)(g 100 g−1)(Ratio)
T100011.7026.1031.4010.801.308.532.91
T2300012.1028.6036.2013.102.1011.802.76
T3600012.9030.4029.1018.102.7016.101.61
T4900014.6033.7032.2020.604.0017.101.56
T51200015.5035.4036.7024.505.7019.201.50
T6040012.0026.8035.0013.202.009.302.65
T7080012.3027.1040.7019.702.0015.602.07
T80120012.4028.0048.0022.602.1016.902.12
T90160012.7027.9055.2017.101.2015.503.23
T10004012.1027.8024.8020.302.7015.101.22
T11008012.3028.8027.7025.702.0017.901.08
T120012012.4030.7028.2018.101.8019.301.56
T133080013.4031.2028.9018.503.2015.501.70
T146080013.9033.2030.0024.104.1020.301.30
T159080014.6034.5031.0022.305.1016.301.50
T1612080015.6036.8049.2026.107.1019.302.00
T1760808014.5034.2033.5025.404.2021.501.40
T18120804015.1035.7030.9025.004.3019.801.30
T19120808015.4036.4028.8026.103.8022.801.50
SE ±0.31±0.83±1.88±1.08±0.37±0.87±0.14
Table 3. Differences in relation to the average value for the studied indices in wheat of the ‘Ciprian’ variety.
TrialProteinGlutenGliadinsGluteninsHMWLMWGliadin/
Glutenin
DifferenceSigDifferenceSigDifferenceSigDifferenceSigDifferenceSig.DifferenceSig.DifferenceSig
T1−1.75ooo−5.14ooo−3.21ns−9.79ooo−1.93ooo−8.2ooo1.07***
T2−1.35ooo−2.64oo1.59ns−7.49ooo−1.13ooo−4.93ooo0.92***
T3−0.55ns−0.84ns−5.51oo−2.49ooo−0.53ns−0.63ns−0.23ns
T41.15**2.46**−2.41ns0.01ns0.77ns0.37ns−0.28ns
T52.05***4.16***2.09ns3.91**2.47***2.47*−0.34o
T6−1.45ooo−4.44ooo0.39ns−7.39ooo−1.23oo−7.43ooo0.81***
T7−1.15oo−4.14ooo6.09**−0.89ns−1.23oo−1.13ns0.23ns
T8−1.05oo−3.24oo13.39***2.01ns−1.13oo0.17ns0.28ns
T9−0.75o−3.34ooo20.59***−3.49oo−2.03ooo−1.23ns1.39***
T10−1.35ooo−3.44ooo−9.81ooo−0.29ns−0.53ns−1.63ns−0.62ooo
T11−1.15oo−2.44oo−6.91oo5.11***−1.23oo1.17ns−0.76ooo
T12−1.05oo−0.54ns−6.41oo−2.49o−1.43oo2.57**−0.28ns
T13−0.05ns−0.04ns−5.71oo−2.09ns−0.03ns−1.23ns−0.14ns
T140.45ns1.96*−4.61o3.51**0.87*3.57***−0.54oo
T151.15**3.26***−3.61ns1.71ns1.87***−0.43ns−0.34o
T162.15***5.56***14.59***5.51***3.87***2.57**0.16ns
T171.05**2.96**−1.11ns4.81***0.97*4.77***−0.44oo
T181.65***4.46***−3.71ns4.41***1.07**3.07**−0.54oo
T191.95***5.16***−5.81oo5.51***0.57ns6.07***−0.34o
Notes: positive differences, p < 0.05, *; p < 0.01, **; p < 0.001, ***; negative differences, p < 0.5, o; p < 0.01, oo; p < 0.001, ooo; insignificant differences, p > 0.05, ns.
Table 4. Grouping of quality indices by principal components and correlation coefficient values.
Title 1PC1PC2Uniqueness
PRO0.955 0.088
GLT0.947 0.090
HMW0.896 0.196
Glutenin0.869 0.185
LMW0.836 0.225
Gliadin 0.9360.113
Gliad/Glut 0.7980.059
Table 5. Component characteristics.
ComponentsUnrotated SolutionRotated Solution
EigenvalueProportion var.CumulativeSumSq. LoadingsProportion var.Cumulative
Component 14.6280.6610.6614.3810.6260.626
Component 21.4160.2020.8631.6630.2380.863
Table 6. Results of the fitting analysis between the estimated values and the real values of the quality indices.
Quality IndexFitting EquationStatistical Safety Parameters
R2Fp
PRO PRO_p = 1.141   PRO_r 1.956 0.911171.05p < 0.001
GLT GLT_p = 1.029   GLT_r 0.511 0.9861251.8p < 0.001
Gliad Gliad_p = 0.8334   Gliad_r + 3.676 0.77057.73p < 0.001
Glut Glut_p = 1.02   Glut_r 0.6496 0.83686.077p < 0.001
HMW HMW_p = 0.9066   HMW_r + 0.2729 0.968525.61p < 0.001
LMW LMW_p = 1.169   LMW_r 2.837 0.82077.586p < 0.001
Notes: “p” associated with each index indicates predicted values; “r” associated with each index indicates real (measured) values.
Disclaimer/Publisher’s Note: The statements, opinions and data contained in all publications are solely those of the individual author(s) and contributor(s) and not of MDPI and/or the editor(s). MDPI and/or the editor(s) disclaim responsibility for any injury to people or property resulting from any ideas, methods, instructions or products referred to in the content.