1. Introduction
Confronted with dual pressures from global food security challenges and resource and environmental constraints, precision agriculture, as the core paradigm of modern agricultural development, is profoundly transforming traditional agricultural production methods [
1,
2,
3,
4]. The foundation of its philosophy is the utilization of advanced sensor technology, spatial information technology, and big data analysis to achieve precise sensing of spatiotemporal variability in farmland, intelligent decision-making, and variable management. This, in turn, optimizes resource inputs, enhances production efficiency, and minimizes environmental impact to the greatest extent possible. In this context, soil, as the foundational medium and critical resource for crop growth, requires precise, rapid, and in situ monitoring of its physical, chemical, and biological properties. This monitoring process constitutes a critical component of precision agriculture decision-support systems [
5,
6,
7,
8,
9].
Soil compaction has been identified as a critical factor influencing crop growth and yield. Accurate assessment of soil compaction is therefore of vital importance to agricultural production. The advent of precision agriculture has prompted a shift in the research focus towards the spatial variability in soil compaction. Consequently, researchers have developed technical methods to obtain the spatial variability in soil compaction using soil mechanical resistance. Soil mechanical resistance, otherwise referred to as soil strength, is defined as the counterforce exerted by soil on tillage components when resisting cutting and destruction. Therefore, it can be concluded that soil mechanical resistance can effectively reflect soil compaction conditions [
10]. Conversely, soil mechanical resistance constitutes an indispensable foundation for the delineation of soil tillage patterns. During the process of deep plowing, precise measurement of soil mechanical resistance facilitates the rational allocation of plowing areas, the avoidance of excessive plowing in areas with superior soil conditions, and the conservation of energy and mechanical resources. During the implementation of deep plowing operations, the adjustment of operational parameters based on real-time measurements of soil mechanical resistance enables agricultural machinery to function under optimal conditions. This adjustment has the potential to reduce energy consumption and mechanical wear, thereby extending the lifespan of the machinery. Accurate soil mechanical resistance data can provide a reference for subsequent operations, such as seeding and fertilization. This, in turn, can optimize the allocation of agricultural resources and enhance the economic efficiency of agricultural production. Consequently, the development of efficient and precise soil mechanical resistance detection technology is of critical theoretical and practical value for achieving precision farming and sustainable soil health maintenance, core components of precision agriculture [
11].
In the context of actual production, the measurement of soil mechanical resistance is predominantly conducted through static means, primarily employing triaxial shear testing instruments and compaction meters for the purpose of detection. The former involves a relatively cumbersome operational process, is time-consuming, costly, and technically challenging. The latter is only suitable for static, fixed-point sampling measurements and cannot continuously reflect the spatial variability in soil mechanical resistance. Dynamic methods for obtaining soil mechanical resistance have been shown to efficiently collect a large number of data samples, thereby providing a detailed understanding of soil compaction conditions at a small scale and offering precise guidance for soil tillage operations.
The advent of sensor detection technology has led to a surge of interest in the dynamic acquisition of soil mechanical resistance [
12]. This area of research has garnered significant attention, with studies focusing on the use of sensor technologies such as strain, pressure, and multi-sensor fusion. Studies have been conducted on the dynamic acquisition of soil mechanical resistance using strain sensors. Sirjacobs et al. conducted research on the use of strain-based pressure sensors to measure soil mechanical resistance. The installation of strain-based pressure sensors between a tractor and a deep tillage plow support frame was conducted, and the horizontal resistance, vertical resistance, and torque exerted on the support frame were measured to reflect soil mechanical resistance [
13]. Xia Yongjun and Meng Chao affixed strain-type pressure sensors to the surface of a deep tillage plow. The slight deformation of the plow’s surface was used to determine the force acting on the plow. This method enabled the measurement of the soil mechanical resistance. Xia Yongjun et al. developed a simple continuous soil mechanical resistance measurement system based on this measurement principle and conducted field trials. They conducted a preliminary exploration of the spatial variability and step characteristics of soil mechanical resistance within the 0–20 cm soil layer. This exploration was based on changes in the resistance signal output by the strain-type pressure sensor [
14]. In a controlled experiment, Meng Chao and his colleagues examined the performance of strain-type pressure sensors in an indoor soil trench. The experiment involved maintaining the deep tillage plow at a depth of 15 cm and gradually traversing the trench. The mechanical resistance values obtained through measurement, which ranged from 89 to 95 Newton (N), exhibited an absolute error ranging from 0.2 to 2.7 Newton (N) when compared to the actual values [
15]. In terms of using pressure-sensing technology to obtain soil mechanical resistance data dynamically, Sheng Wenyi et al. implemented a sensor system comprising pressure sensors positioned between the deep tillage plow and the frame, with a sensor cone head installed at the base of the deep tillage plow. The resistance experienced by the sensor cone head was transmitted to the pressure sensor via a force transmission arm to measure soil mechanical resistance [
16]. Zeng et al. affixed a thin-film pressure sensor to the extremity of the deep tillage plow to quantify the cutting force exerted by the plow tip on the soil. The measurement results were then utilized to calibrate the contact parameters of a numerical simulation model [
17]. In terms of multi-sensor fusion for detecting soil mechanical resistance, Naderi-Boldaji et al. explored the feasibility of multi-sensor fusion for the detection of soil mechanical resistance. They proposed a novel sensor fusion method combining a single-probe horizontal penetrometer, a dielectric soil water content sensor, and a γ-ray sensor for the simultaneous measurement of mechanical resistance, volumetric water content, and clay content, respectively. It has been demonstrated that soil water content exerts influence on the acoustic frequency distribution spectrum and penetration resistance, and that the volumetric soil water content can be predicted with an error that is significantly smaller than that of the dielectric sensor alone. The integration of data from the three sensors facilitates enhanced prediction of soil compactness, with a concomitant reduction in error when compared with the use of a penetrometer alone [
18]. The aforementioned studies have achieved successful implementation of dynamic and continuous measurement of soil mechanical resistance; nonetheless, a consistent limitation lies in their sensor configuration—either positioned at a fixed location or mounted between the deep tillage shovel and the frame. While this setup facilitates the acquisition of soil mechanical resistance data at a specific depth, it remains inadequate in capturing the variability in mechanical resistance across different soil depth gradients.
The degree of soil compaction and soil mechanical resistance exhibits significant variability in the longitudinal spatial distribution due to differences in soil types, crops, and cultivation methods. In order to reflect the longitudinal distribution of soil mechanical resistance, Hemmat, Cho et al. investigated the method of obtaining soil mechanical resistance at several depths, and fixed pressure sensors were placed at three different depths of the soil entry portion of the deep loosening shovel, which were used to detect the soil mechanical resistance at three depths [
19]. In the field experiment conducted by Hemmat et al., the study examined the correlation between pressure sensor and firmness meter measurements at depths of 20 and 30 cm. The experimental findings revealed a significant correlation between the measurements, suggesting a robust correlation between the sensors’ readings and the firmness measurements [
20]. Chukwu et al. conducted tests in an indoor soil trench using an impedance sensor and demonstrated that the sensor was capable of measuring soil mechanical resistance with depth and location with a high degree of accuracy. Additionally, they found a strong correlation between the sensor readings and measurements from a soil firmness meter [
21]. Furthermore, Chung et al. conducted additional research on the use of a multipoint arrangement of sensors to detect soil mechanical resistance at five depths. The findings of the field tests demonstrated that the soil strength, as measured by the sensors, was contingent on soil water content, bulk weight, and texture. It was further observed that incorporating the working depths into the regression model or conducting regression analyses within a single depth range facilitated more precise estimation of soil mechanical resistance at the corresponding depths [
22]. The preceding studies have investigated the acquisition of soil mechanical resistance at varying depth layers. Despite the absence of mature products in practical applications, it has been demonstrated that soil mechanical resistance at multiple depth layers can be acquired through the utilization of a multipoint arrangement of sensors. However, this method is constrained to static or low-speed conditions.
In summary, scholars from different regions and countries, both domestically and internationally, have conducted research on the acquisition of soil mechanical resistance. This provides a solid theoretical foundation for the efficient acquisition of soil mechanical resistance. However, it is important to note that the majority of the detection devices are constrained by the dimensions of the S-type and the conductivity sensors employed. This results in a complex detection device structure that only permits the acquisition of a single soil layer depth at a time. The S-type tensile force sensor can directly measure soil resistance; however, its rigid structure and large volume characteristics are vulnerable to dynamic disturbances, and the complexity of installation restricts its flexible deployment. Conductivity-based sensors rely on indirect correlation and are susceptible to interference from the soil environment, thus preventing direct quantification of soil mechanical resistance in real time. The phenomenon exhibits an indirect correlation, is susceptible to interference from the soil environment, and is incapable of direct quantification of resistance in real time. The primary deficiency in extant technologies pertains to the absence of solutions that can directly and sensitively capture dynamic soil mechanical resistance in complex fields while concomitantly reducing disturbance and environmental interference. In recent years, there has been significant advancement in the field of flexible pressure sensing technology, which has led to its widespread utilization, particularly in the domains of medical and plant trait sensing [
23,
24,
25,
26]. The sensor exhibits numerous advantages, including high precision, high reliability, small size, and light weight [
27,
28]. Its compact dimensions allow for straightforward integration into the confined spaces of detection devices, obviating the necessity for modification of agricultural tools, thus addressing a critical gap in the current technological landscape. This paper presents a dynamic acquisition method for soil mechanical resistance based on flexible thin-film sensors. Leveraging the sensors’ inherent advantages of high sensitivity and flexible, convenient installation, the proposed method enables effective capture of soil mechanical resistance. This study encompasses three key aspects: the design of a dedicated soil mechanical resistance detection device, the development of a signal-processing algorithm for flexible thin-film pressure sensors tailored to soil mechanical resistance acquisition scenarios, and an investigation into the acquisition accuracy across different soil depths, as well as the realization of dynamic measurement capabilities. Specifically, this paper elaborates on the structural design of the detection device and the formulation of scenario-specific signal-processing strategies for flexible thin-film pressure sensors.
2. Materials and Methods
2.1. Design of the Detecting Instrument
The soil-mechanical-resistance-testing device was designed based on a deep tillage plow, with its specific structure illustrated in
Figure 1. The device is composed of a deep loosening shovel shank, a tip, a flexible thin-film pressure sensor, a pin shaft, springs, and a protective cover (
Figure 1a). The front side of the tip is shaped such that it is narrow at the front and wider at the back. It is mounted on the front side of the plow handle (
Figure 1b) and is used for breaking through soil without affecting tillage operations. The strain-type pressure sensor is strategically positioned between the tip and the plow handle. Upon encountering soil resistance, the tip transmits the force to the strain-type pressure sensor, inducing deformation and the subsequent generation of an electrical signal. The pin shaft is connected to the tip, allowing for relative sliding about the plow handle. The spring guarantees that the tip maintains uninterrupted contact with the strain-type pressure sensor, thereby enabling the sensor to perpetually and precisely detect soil resistance. The shovel handle is equipped with a pin hole through which the pin can slide. The symmetrical plate section at the rear of the tip makes contact with both sides of the shovel handle, thereby enabling the tip to slide while simultaneously preventing rotation. The groove on the anterior side of the shovel handle forms a thinned section, thereby facilitating the connection between the tip and the shovel handle. The wire channel’s design and the protective cover’s integration serve to safeguard the wires, thereby mitigating potential damage that could compromise data collection integrity.
When the device is operational, the tip of the device makes direct contact with the soil. The design of the tip, characterized by a sharp front and a wide rear, facilitates penetration into the soil, thereby reducing the initial resistance encountered during penetration. As the deep tillage plow penetrates deeper into the soil, the soil exerts a reaction force on the tip, i.e., soil mechanical resistance. This resistance is subsequently transmitted to the flexible thin-film pressure sensor, which is employed for the purpose of sensing the soil mechanical resistance. The pin is firmly attached to the tip and can slide within the pin hole of the plow handle, ensuring effective force transmission. When subjected to an external force, the sensor’s internal resistance undergoes a change, with the magnitude of this resistance change being directly proportional to the magnitude of the external force applied. This change in resistance value is converted into an electrical signal output (voltage), thereby achieving the initial conversion of soil mechanical resistance from a physical quantity to an electrical signal.
2.2. Design of the Detection System
To ensure the precise acquisition of signals from flexible thin-film pressure sensors, a signal acquisition system was meticulously designed. This system is predominantly composed of flexible thin-film sensors, signal-processing circuits, RS-485 communication modules (manufactured by Shenzhen Huaxuda Technology Co., Ltd., Shenzhen, China), and signal acquisition software systems (Specific software: ComMonitor.exe; Version: 6.0.0.1). As demonstrated in
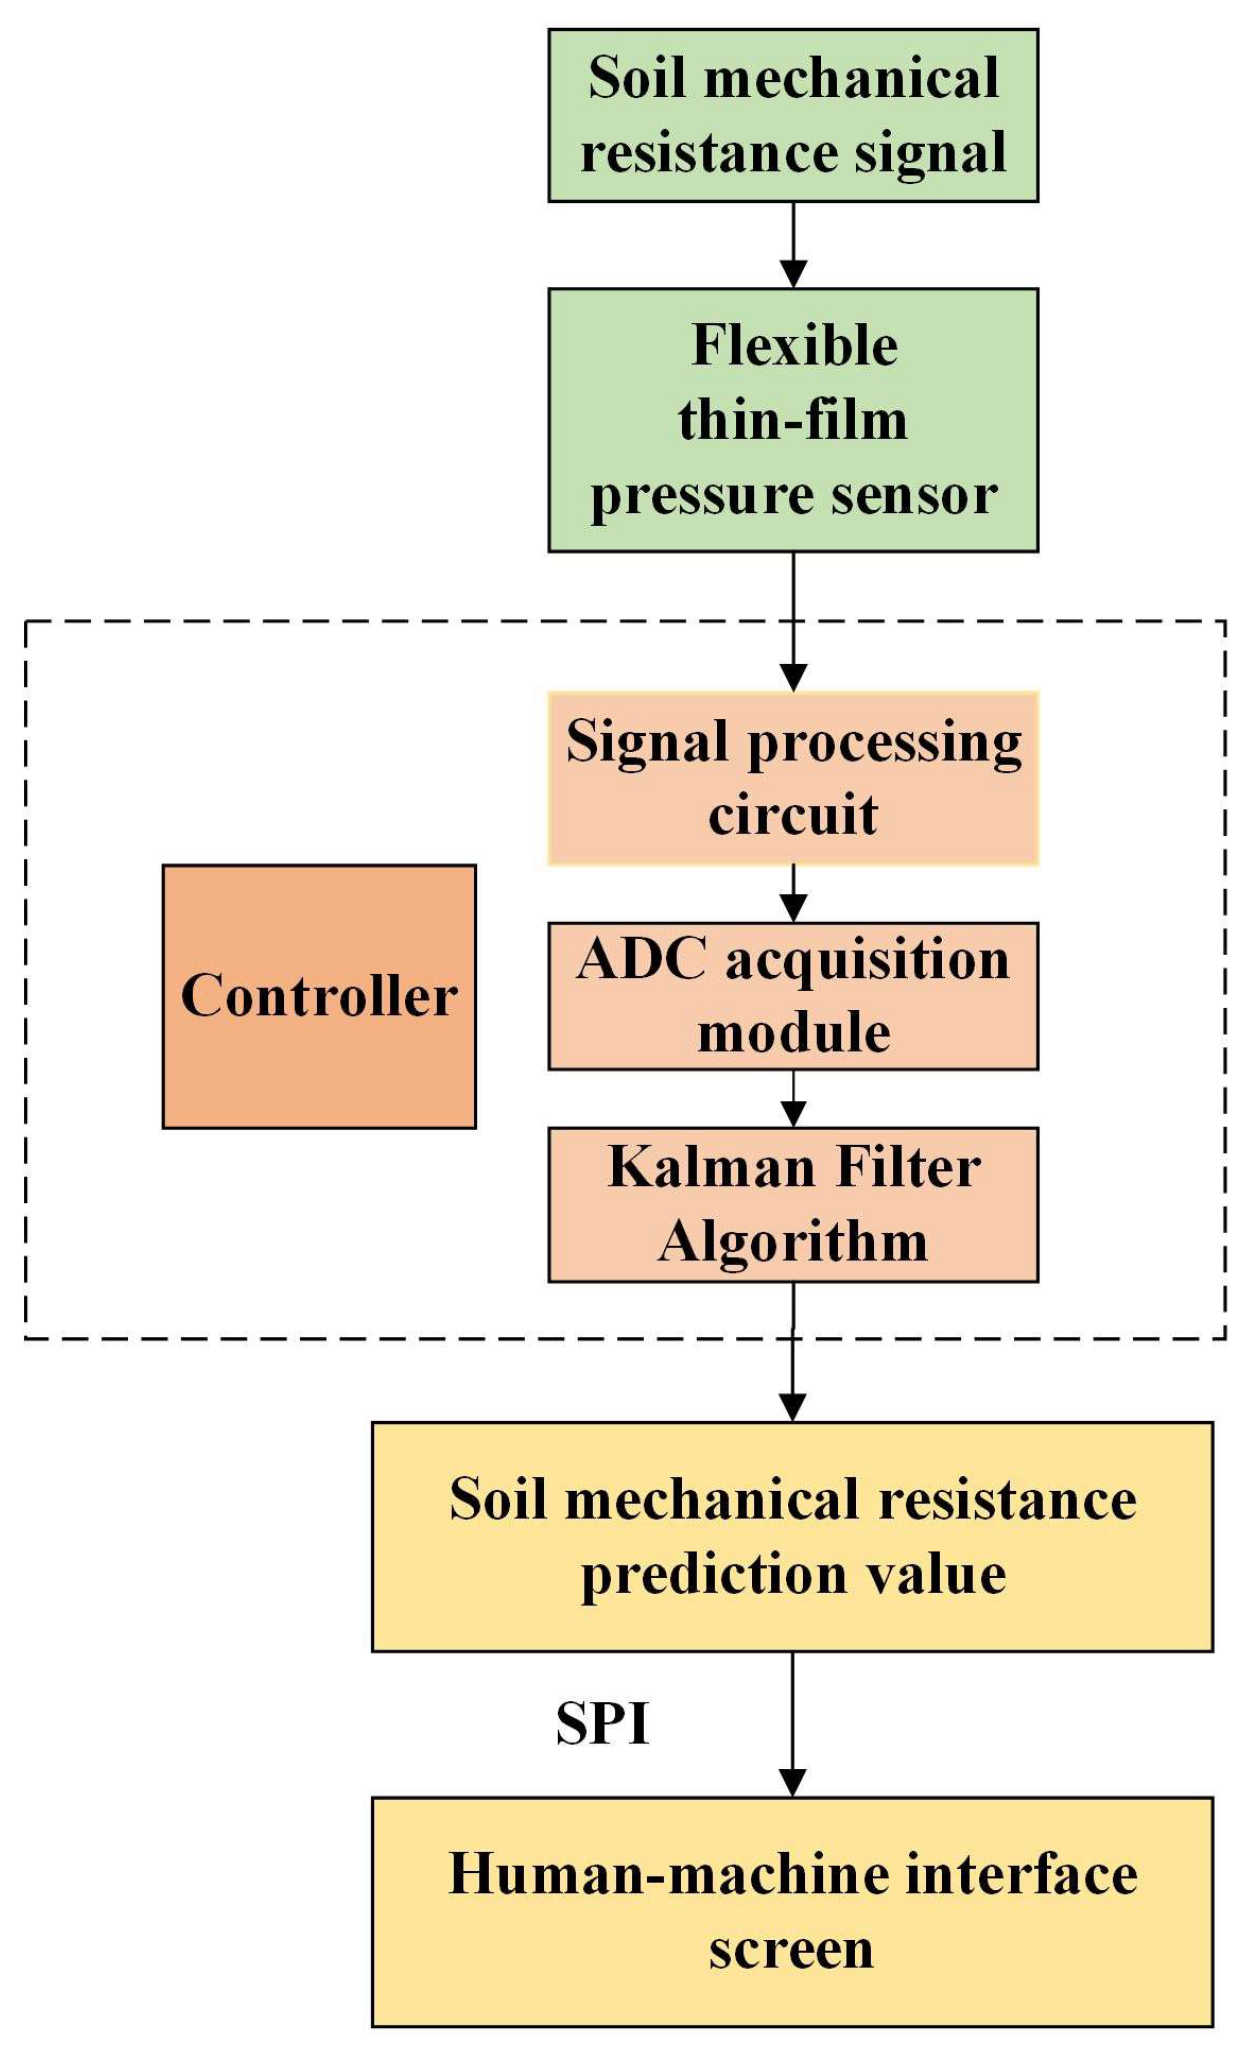
Figure 2, the pressure sensor converts variations in soil mechanical resistance into corresponding resistance values. These resistance values are then transmitted to the signal-processing circuit, which converts them into voltage signals. Subsequently, the ADC acquisition module present on the control board converts these voltage signals. The constructed soil mechanical resistance detection model serves as the foundation for this endeavor. The model enables the high-precision prediction of soil mechanical resistance through Kalman filter processing using the voltage signal. The predicted resistance values are transmitted via SPI communication to the human–machine interface screen for display.
The flexible thin-film pressure sensor employed in this detection system is the RX-H2026 ring-shaped single-point flexible pressure sensor manufactured by Changzhou Ruxi Electronic Technology Co., Ltd. (Changzhou, China). The outer diameter of the device is 26 mm, the inner ring electrode diameter is 8 mm, and the measurement range is from 0 to 500 N. The operating temperature range is from −30 °C to 60 °C, and the humidity range is from 0% to 95%. The response time of the system is of less than 20 ms, which is well within the range required for real-time monitoring of dynamic signals. Furthermore, the controller utilizes the STM32F407 chip, which is equipped with an ARM Cortex-M4 processor core, 18 ADC acquisition channels, and supports 12-bit resolution. This configuration is sufficient to fulfill the data acquisition requirements of the soil mechanical resistance detection device.
2.3. Testing the Response Characteristics of Flexible Thin-Film Pressure Sensors
The response characteristics of a flexible thin-film pressure sensor under different pressures form the foundation for signal-processing circuits and the construction of soil mechanical resistance prediction models. In order to elucidate the response characteristics of flexible thin-film pressure sensors, it is imperative to obtain sensor response signals under varying pressures. It is important to consider the potential for discrepancies in sensor response, which may be attributable to variations in the manufacturing process during sensor production. To this end, a set of three flexible thin-film pressure sensors was selected for response testing, with the objective of achieving soil mechanical resistance detection at three distinct soil layer depths (5 cm, 10 cm, and 15 cm). The pressure application range was determined based on the distribution of soil mechanical resistance data from the existing literature [
29,
30,
31]. The range was established to be between 50 and 500 N. Pressure was applied at 50 N intervals, and the resistance between the two ends was measured using an ohmmeter. The relevant data were obtained by taking the average of multiple measurements.
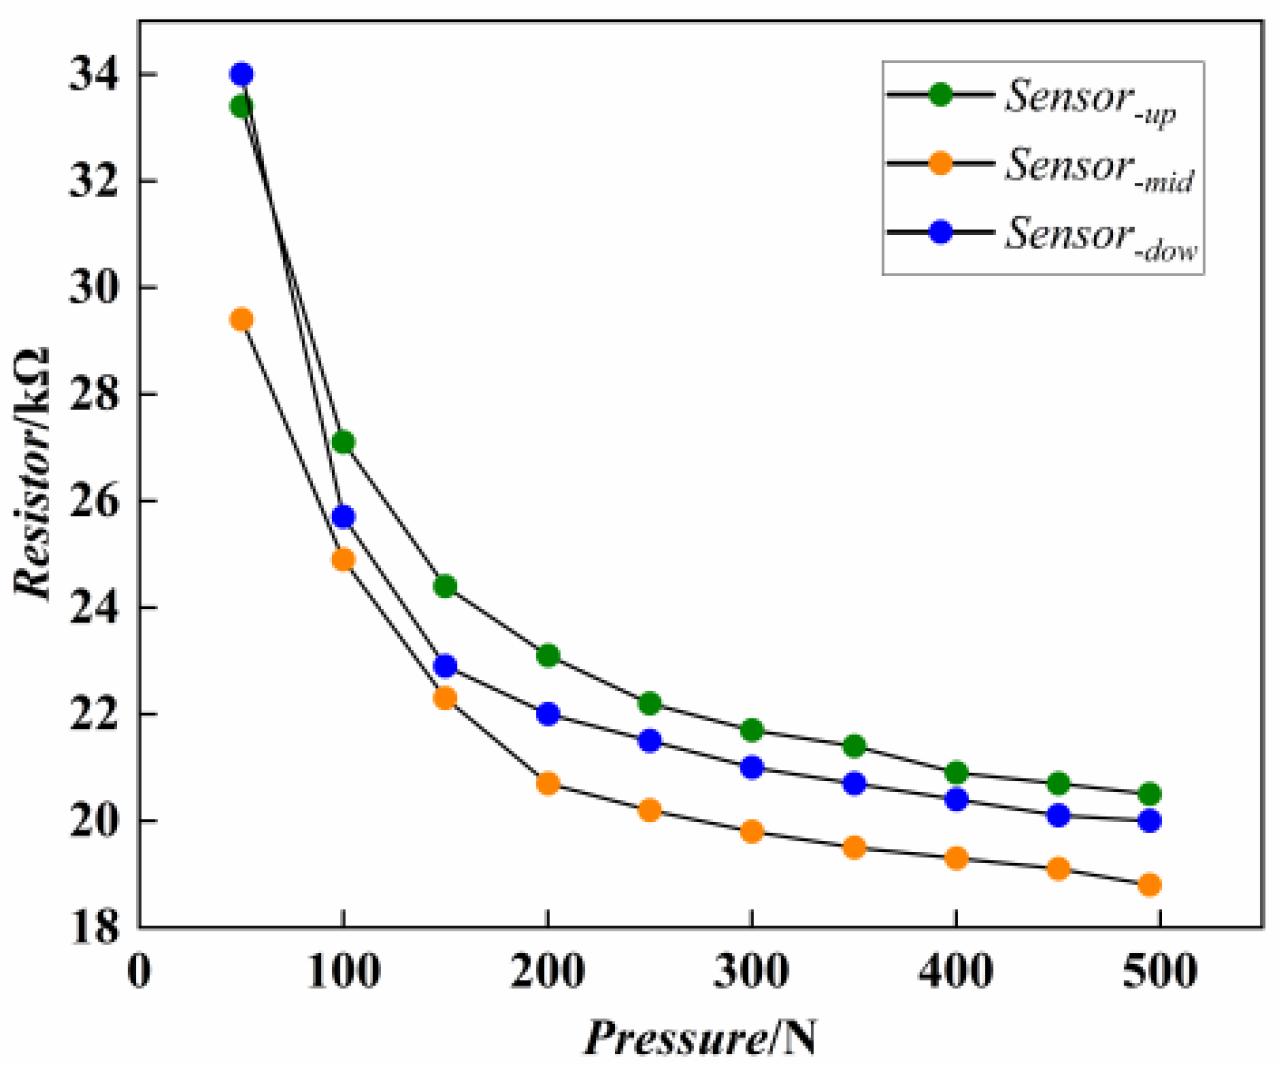
The response curves of the three sensors are displayed in
Figure 3. The response curves of the different sensors’ resistances to applied pressure exhibit certain patterns. The three curves in the figure demonstrate a nonlinear characteristic of “rapid change followed by a gradual change” in resistance to pressure. Within the 0 to 200 N range, the resistance undergoes a rapid decrease, indicating a high degree of sensitivity during this phase. It is noteworthy that even minor pressure changes can elicit substantial fluctuations in resistance. When the pressure range is between 200 and 500 N, the decrease in resistance slows down, indicating lower sensitivity, with pressure changes having a significantly reduced impact on resistance, though it still responds to pressure changes. This characteristic aligns with the requirements for detecting soil mechanical resistance. Surface soil is generally characterized by its loose texture, which results in low mechanical resistance. However, it is important to note that surface soil also exhibits significant variability. The sensor’s high sensitivity, ranging from 50 to 200 N, facilitates the precise detection of subtle variations in soil compaction within the tillage layer. In the context of detecting deep soil, characterized by its increased density and higher resistance, the sensor maintains stability within the 200–500 N pressure range. The gradual response characteristic of the sensor effectively prevents signal saturation distortion caused by high resistance in deep layers, ensuring reliable quantification of resistance in hard soil layers.
2.4. Signal-Processing Module Design
Flexible thin-film pressure sensors are inherently susceptible to interference, which may originate from power fluctuations, mechanical vibrations, or environmental factors [
32]. Given the heterogeneity of the soil in this experiment, which exhibits a wide range of mechanical resistance variations, it is necessary to optimize the circuit design based on the response characteristics of the flexible thin-film pressure sensor to determine an appropriate signal-processing circuit.
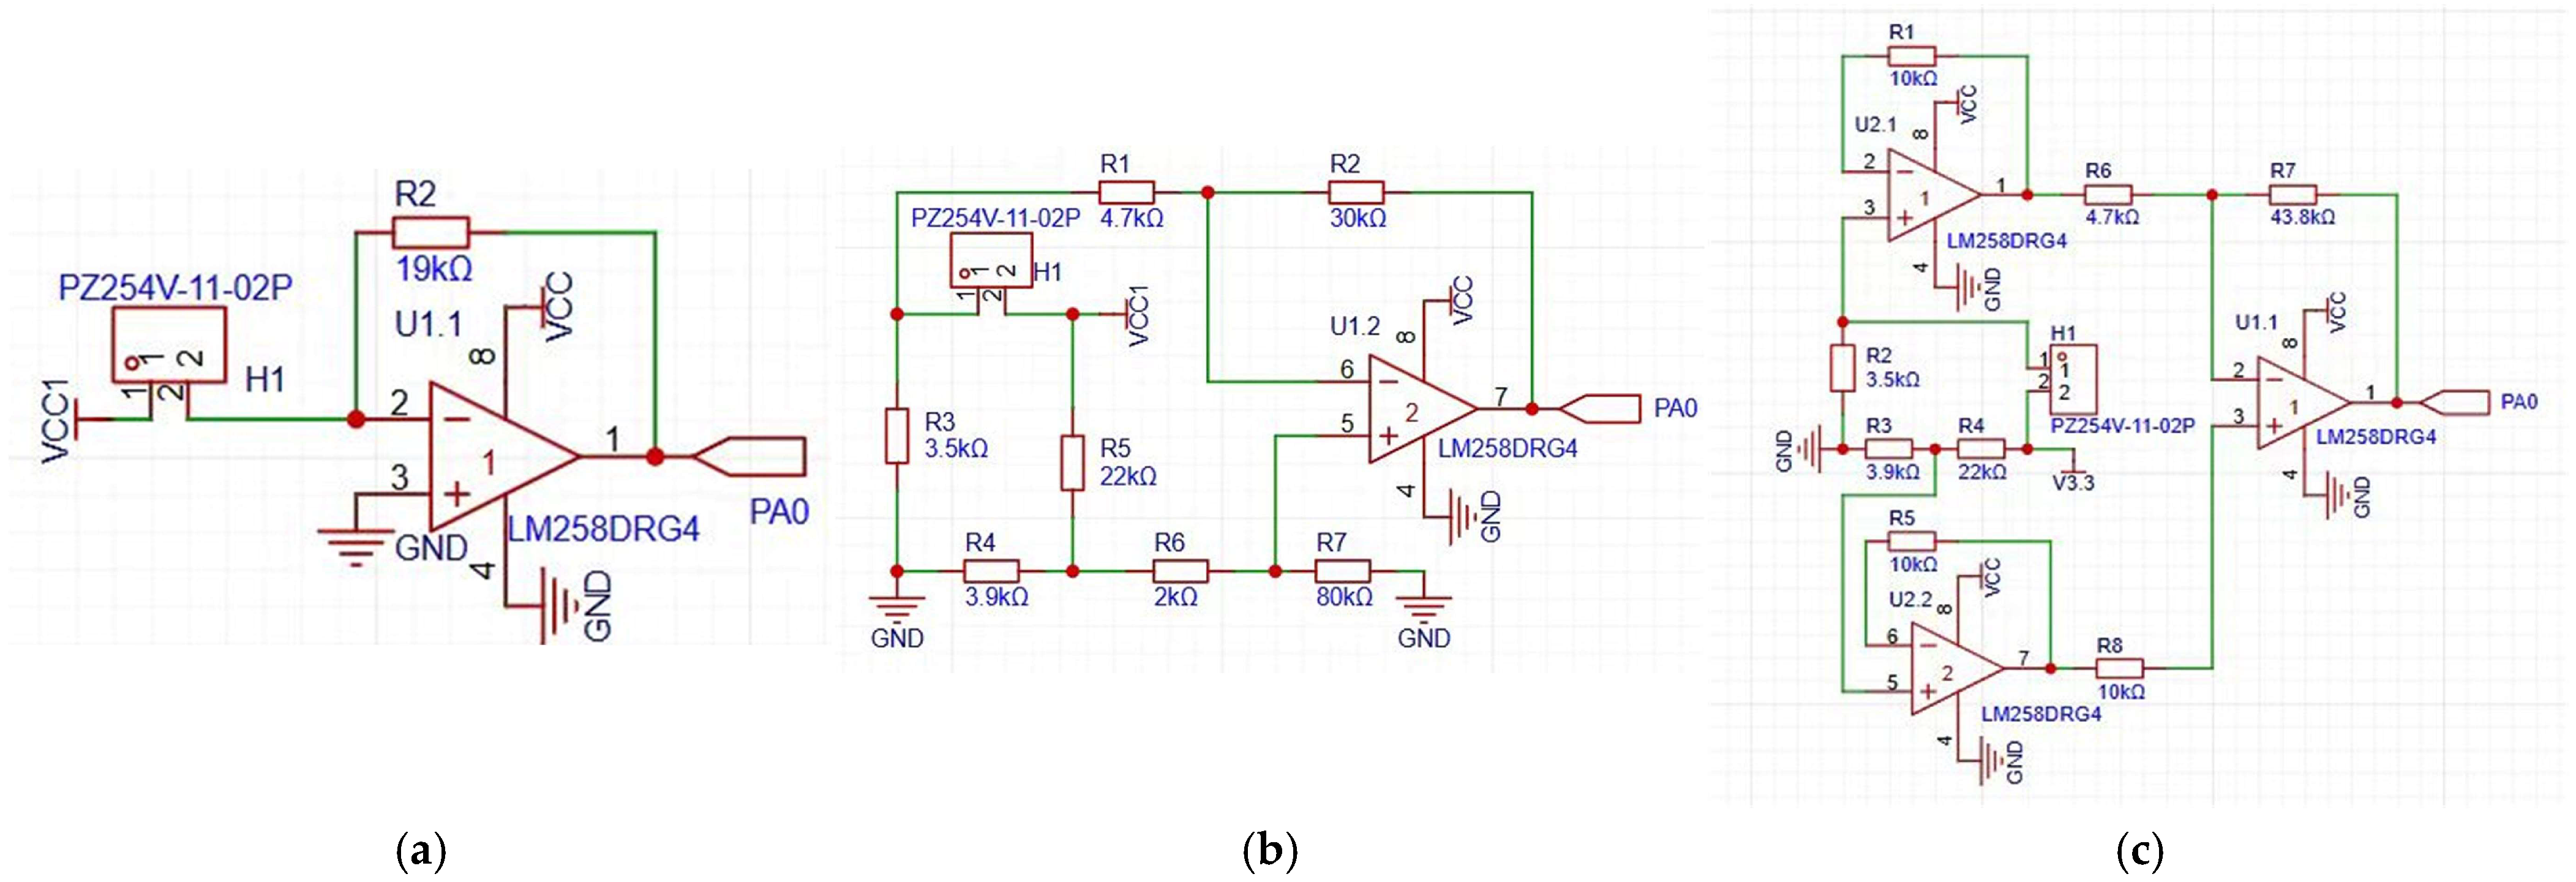
The response characteristics’ test of the flexible thin-film pressure sensor indicates that its piezoresistive characteristics exhibit a power function relationship between resistance and pressure. The response exhibited sensitivity at low pressures (0–200 N) and insensitivity at high pressures (200–500 N). To achieve detection across the full threshold range of 50–500 N, we constructed an amplification circuit during the signal extraction process. The design of the three signal-processing circuits is based on common resistive signal-processing methods, as illustrated in
Figure 4. The linear voltage divider circuit (
Figure 4a, henceforth referred to as the circuit) is a relatively elementary circuit that primarily focuses on proportional voltage distribution. The device under scrutiny converts signals through resistive voltage division; however, its performance in terms of precisely detecting weak signals and resisting interference is limited. It is potentially significantly affected by interference signals. Conversely, the Wheatstone bridge circuit can transform minor fluctuations in sensor resistance into substantial voltage fluctuations, thereby exhibiting high sensitivity and stable linearity within the suitable range of resistance changes. In light of the nonlinear relationship between sensor resistance values and pressure, two circuits were engineered. These circuits were designed based on the Wheatstone bridge circuit to ensure optimal response accuracy under high-load conditions. The first configuration consists of a Wheatstone bridge augmented by amplification (
Figure 4b, Circuit 2), while the second configuration combines a Wheatstone bridge with a follower and additional amplification (
Figure 4c, Circuit 3). Circuit 3 implements the placement of two voltage followers on opposing sides of the bridge, preceding the operational amplifier. Utilizing their remarkably elevated input impedance and notably diminished output impedance, these followers are capable of circumventing the interference from the load effect of the subsequent circuit on the bridge balance and signal accuracy while concurrently buffering the feeble voltage difference output by the bridge. A comparison of Circuit 3 with Circuit 2 may reveal that the former exhibits enhanced signal reconstruction capability under conditions of heavy load.
2.5. Construction of the Kalman Filter Algorithm
The Kalman filter is a filtering algorithm based on dynamic system state estimation. It processes data recursively to achieve optimal estimation of the state of a linear system. The Kalman filter is a mathematical model that incorporates historical signal information and current observations, and it dynamically updates the estimation of the signal state based on the system’s state equations and observation equations. This process minimizes the mean square error to obtain the optimal filtering estimation. Consequently, the Kalman filter finds extensive application in numerous fields [
33,
34,
35,
36,
37,
38,
39,
40,
41,
42]. In this experiment, the Kalman filter is employed to process the response signals of a flexible thin-film pressure sensor to enhance the signal’s response accuracy [
43,
44].
In Kalman filtering, three parameters are of particular importance: A, Q, and R. The A matrix is the state transfer matrix, which is set to 1 in consideration of the slow-change characteristics of the system. Q and R require adjustment in accordance with the response of the system. Q represents the process noise covariance, which describes the uncertainty of the model prediction, and R represents the observation noise covariance, which describes the uncertainty of the observed data. In the present system, fluctuations and errors are observed in the values collected directly using the ADC. The adjustment of these two parameters following the implementation of the Kalman filter has been shown to reduce fluctuations and errors in the signal, thereby enhancing the accuracy of the estimated values.
In the prediction step of the Kalman filter, the model predicts the current state based on the last optimal estimate and the process noise covariance, Q. It is important to note that the model will not be able to predict the current state if Q is set too large. Should Q be set at an overly elevated value, the model will place excessive trust in the predicted value, with the potential consequence of a divergence between the estimation result and the true value. Conversely, if Q is set at an overly reduced value, the model will disregard the predicted value to an excessive degree, resulting in the estimation result becoming excessively sensitive to variations in the observed value. It can thus be concluded that the process of adjusting Q and R is, in essence, a trade-off between the trust placed in model predictions and observations. In the initialization process, the two parameters are chiefly adjusted in accordance with the observed data of the sensor response. The threshold ranges of Q and R are set to [0, 1] and [1, 10], respectively. The adjustment is made in accordance with the principle that when the observed data are more accurate and reliable, the value of R is appropriately reduced, and the weight of the observed value in the estimation result is increased; when the model prediction is more accurate and reliable, the value of Q is appropriately reduced, and the weight of the predicted value in the estimation result is increased.
The mechanical resistance of soil at a specific depth is denoted by
, which is the state variable of the plowing depth detection device. Subsequently, the system prediction equation is as follows:
where
is the estimated value of the detection device at time
t, where
is a state transition matrix, where
A in this paper equals Matrix
.
where
is the predicted covariance at time
t,
is the system state covariance at time
t − 1,
is the system process noise, and
Q equals 0.1.
After completing the system prediction, the Kalman gain can be calculated:
where
is the Kalman gain,
is the system observation matrix,
H equals Matrix
,
is the observation noise variance, and
R equals 9.9.
Consequently, the optimal estimate of the system is as follows:
where
is the optimal estimate of the system at time
t, and
is the measurement value of the sensor at time
t, which is converted through the soil mechanical resistance and response voltage relationship model constructed.
After completing the system estimate, the system covariance is updated as follows:
where
is the identity matrix.
2.6. Test Arrangement
2.6.1. Signal-Processing Circuit Optimization
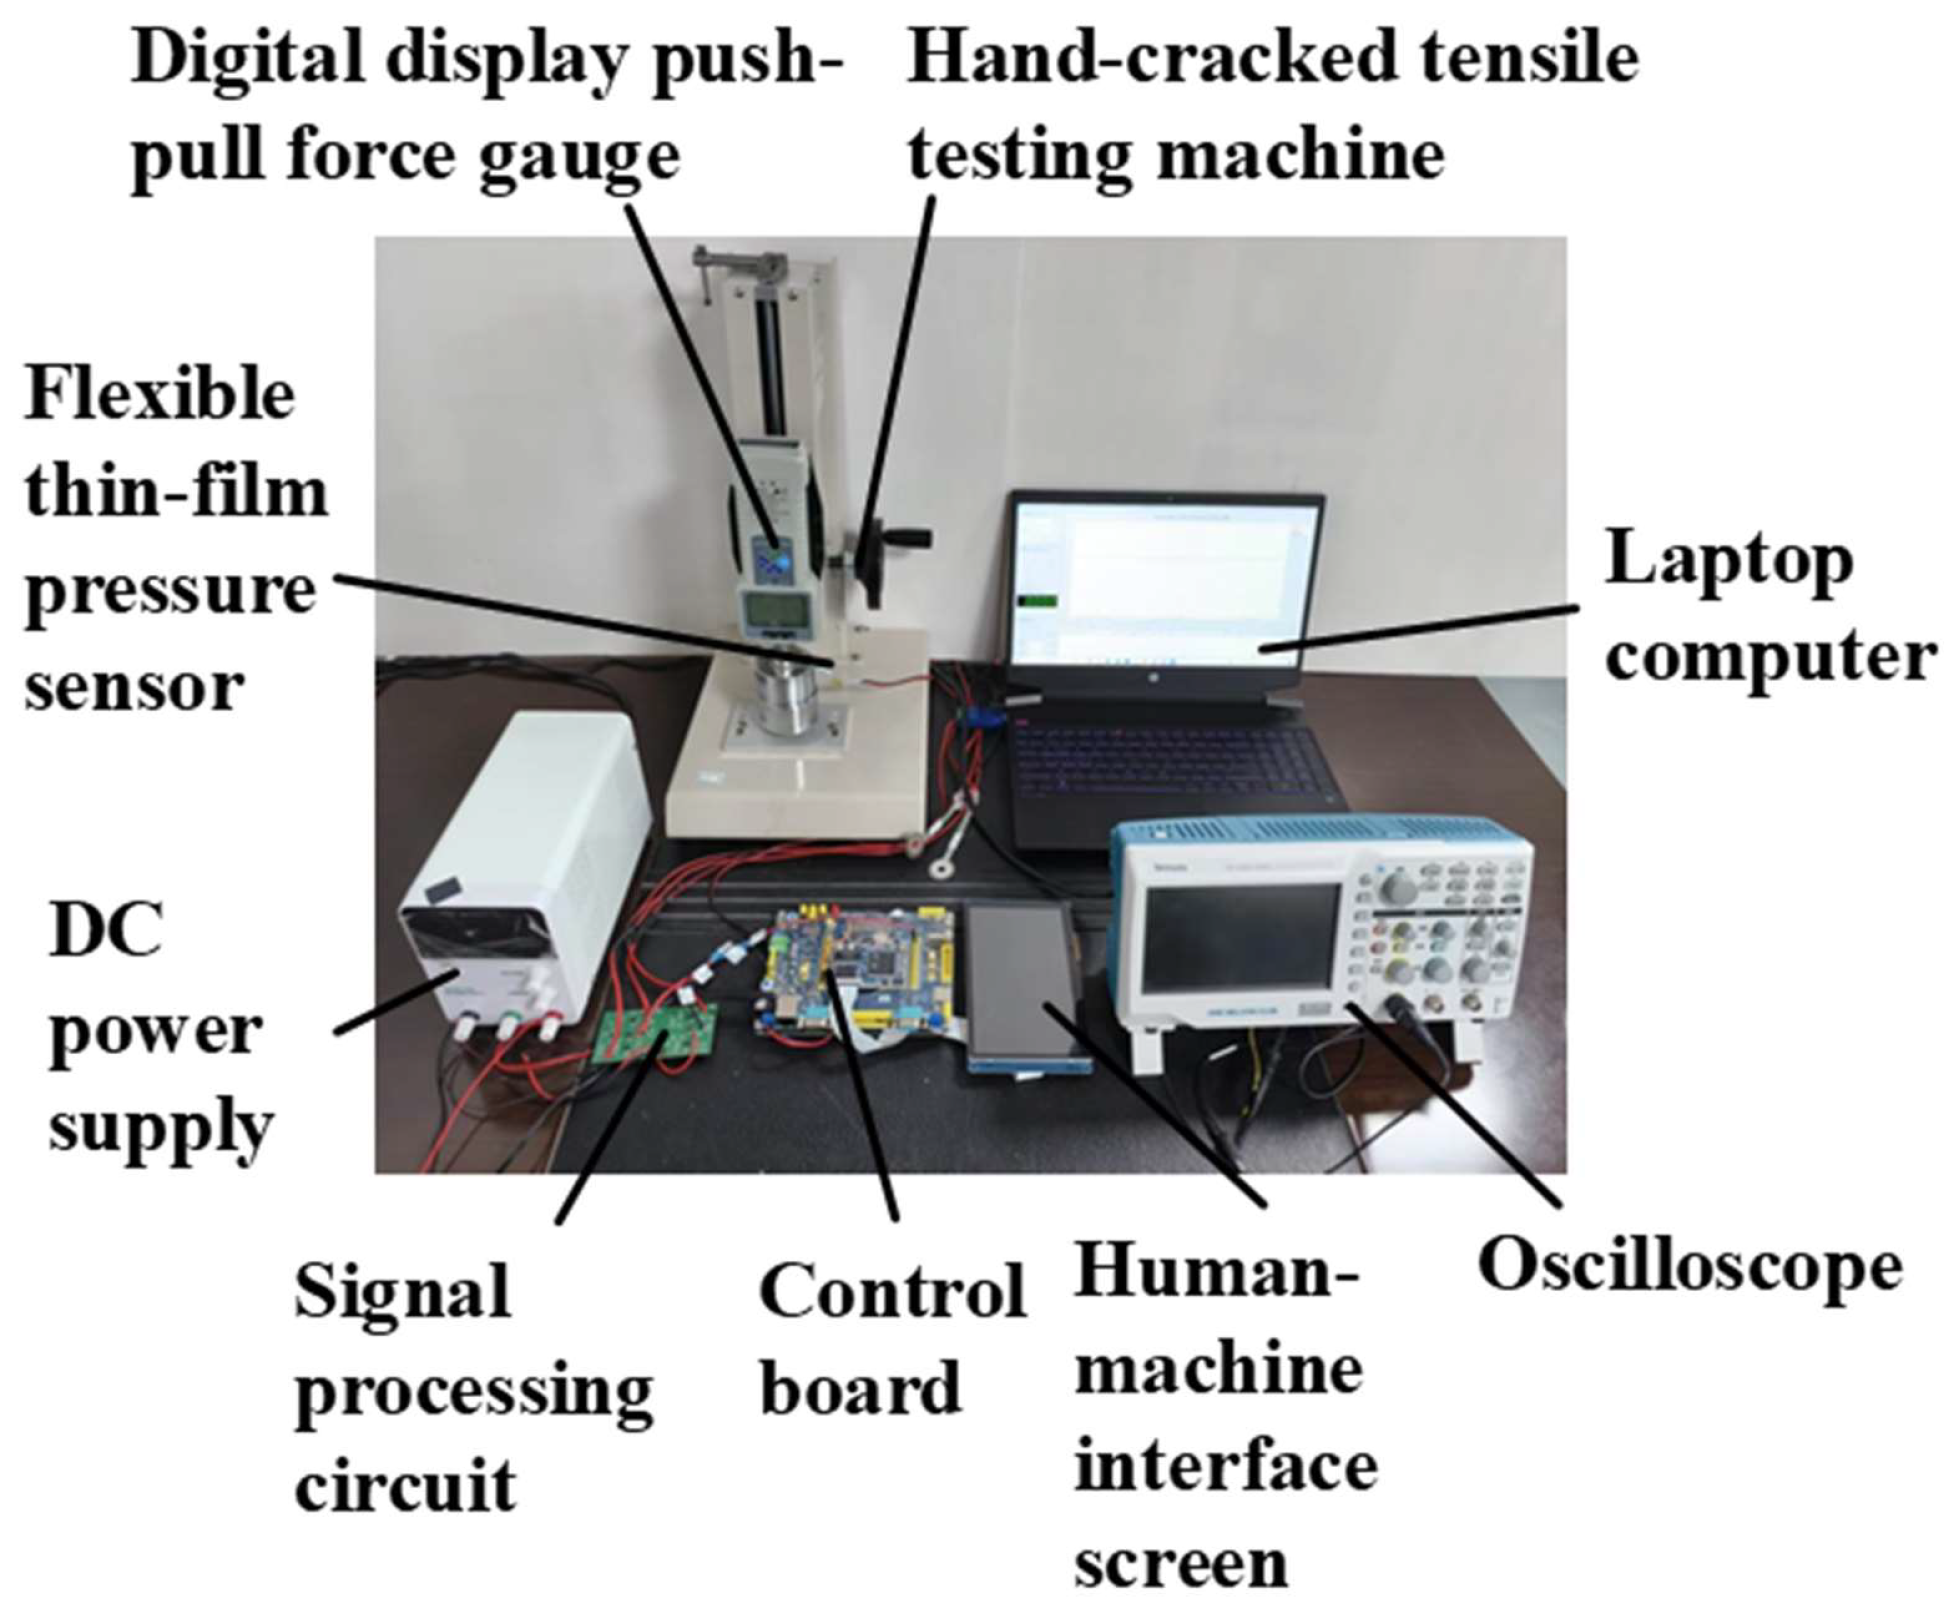
In order to elucidate the response performance of flexible thin-film pressure sensors under three signal-processing modules, the optimal signal-processing circuit suitable for soil resistance detection was selected, and a response characteristic testing platform was established, as illustrated in
Figure 5. The platform is composed of a hand-cranked tensile testing machine (manufactured by Shenzhen Ailigu Instrument Co., Ltd., Shenzhen, China), a digital display push–pull force gauge, a TBS1000X oscilloscope (Manufacturer: Tektronix Inc., Beaverton, OR, USA; Equipment sourcing location: Shenzhen, China), a control board, three signal-processing circuits, a human–machine interface screen, a laptop computer, and a DC power supply, among other components. The hand-cranked tensile tester utilizes a manual transmission mechanism to drive a gear screw downward, thereby applying a certain pressure to the flexible thin-film pressure sensor. The digital push–pull force gauge displays the pressure value in real time. The laptop is equipped with load acquisition software for the push–pull force gauge, enabling real-time recording of the pressure applied to the sensor. The oscilloscope is employed to capture and archive the voltage signals generated by the circuit board for subsequent analysis.
During the experiment, a constant load of 50–500 N was applied at 50 N intervals using a hand-cranked tensile testing machine. The response voltages of the three circuits under different applied loads were collected using an oscilloscope, with a collection time of 1.6 s. The standard deviation and maximum deviation of the collected signals were calculated to evaluate the stability and accuracy of the response signals under different circuits. The experimental results obtained were then used to select the optimal circuit for the measurement load range. Subsequently, a response signal model for soil mechanical resistance and flexible film sensors was constructed based on this circuit.
2.6.2. Kalman Filter Algorithm Prediction Accuracy
The same pressure test platform as that displayed in
Figure 5 was utilized to collect and analyze the signals following Kalman filtering. The pressure values predicted by the Kalman algorithm were transmitted to the laptop via RS-485 communication. The experiment was divided into two cases: steady state and variable load. In the steady-state test, four loads of 100 N, 200 N, 300 N, and 400 N were applied to the sensor, and the Kalman filtering algorithm was observed and recorded. In the variable-load test, two types of variable loads were applied to the sensors: The range of forces in question extends from 100 N to 200 N and then from 200 N to 300 N. During the loading process, the load was increased as smoothly as possible. The pressure values output by the force gauge and the Kalman filter prediction values transmitted to the laptop were observed and recorded. Each test was repeated three times, and the mean value was calculated.
2.6.3. Soil Bin Experiment
To validate the performance of the soil-mechanical-resistance-testing device and the predictive model developed, soil trench tests were conducted (
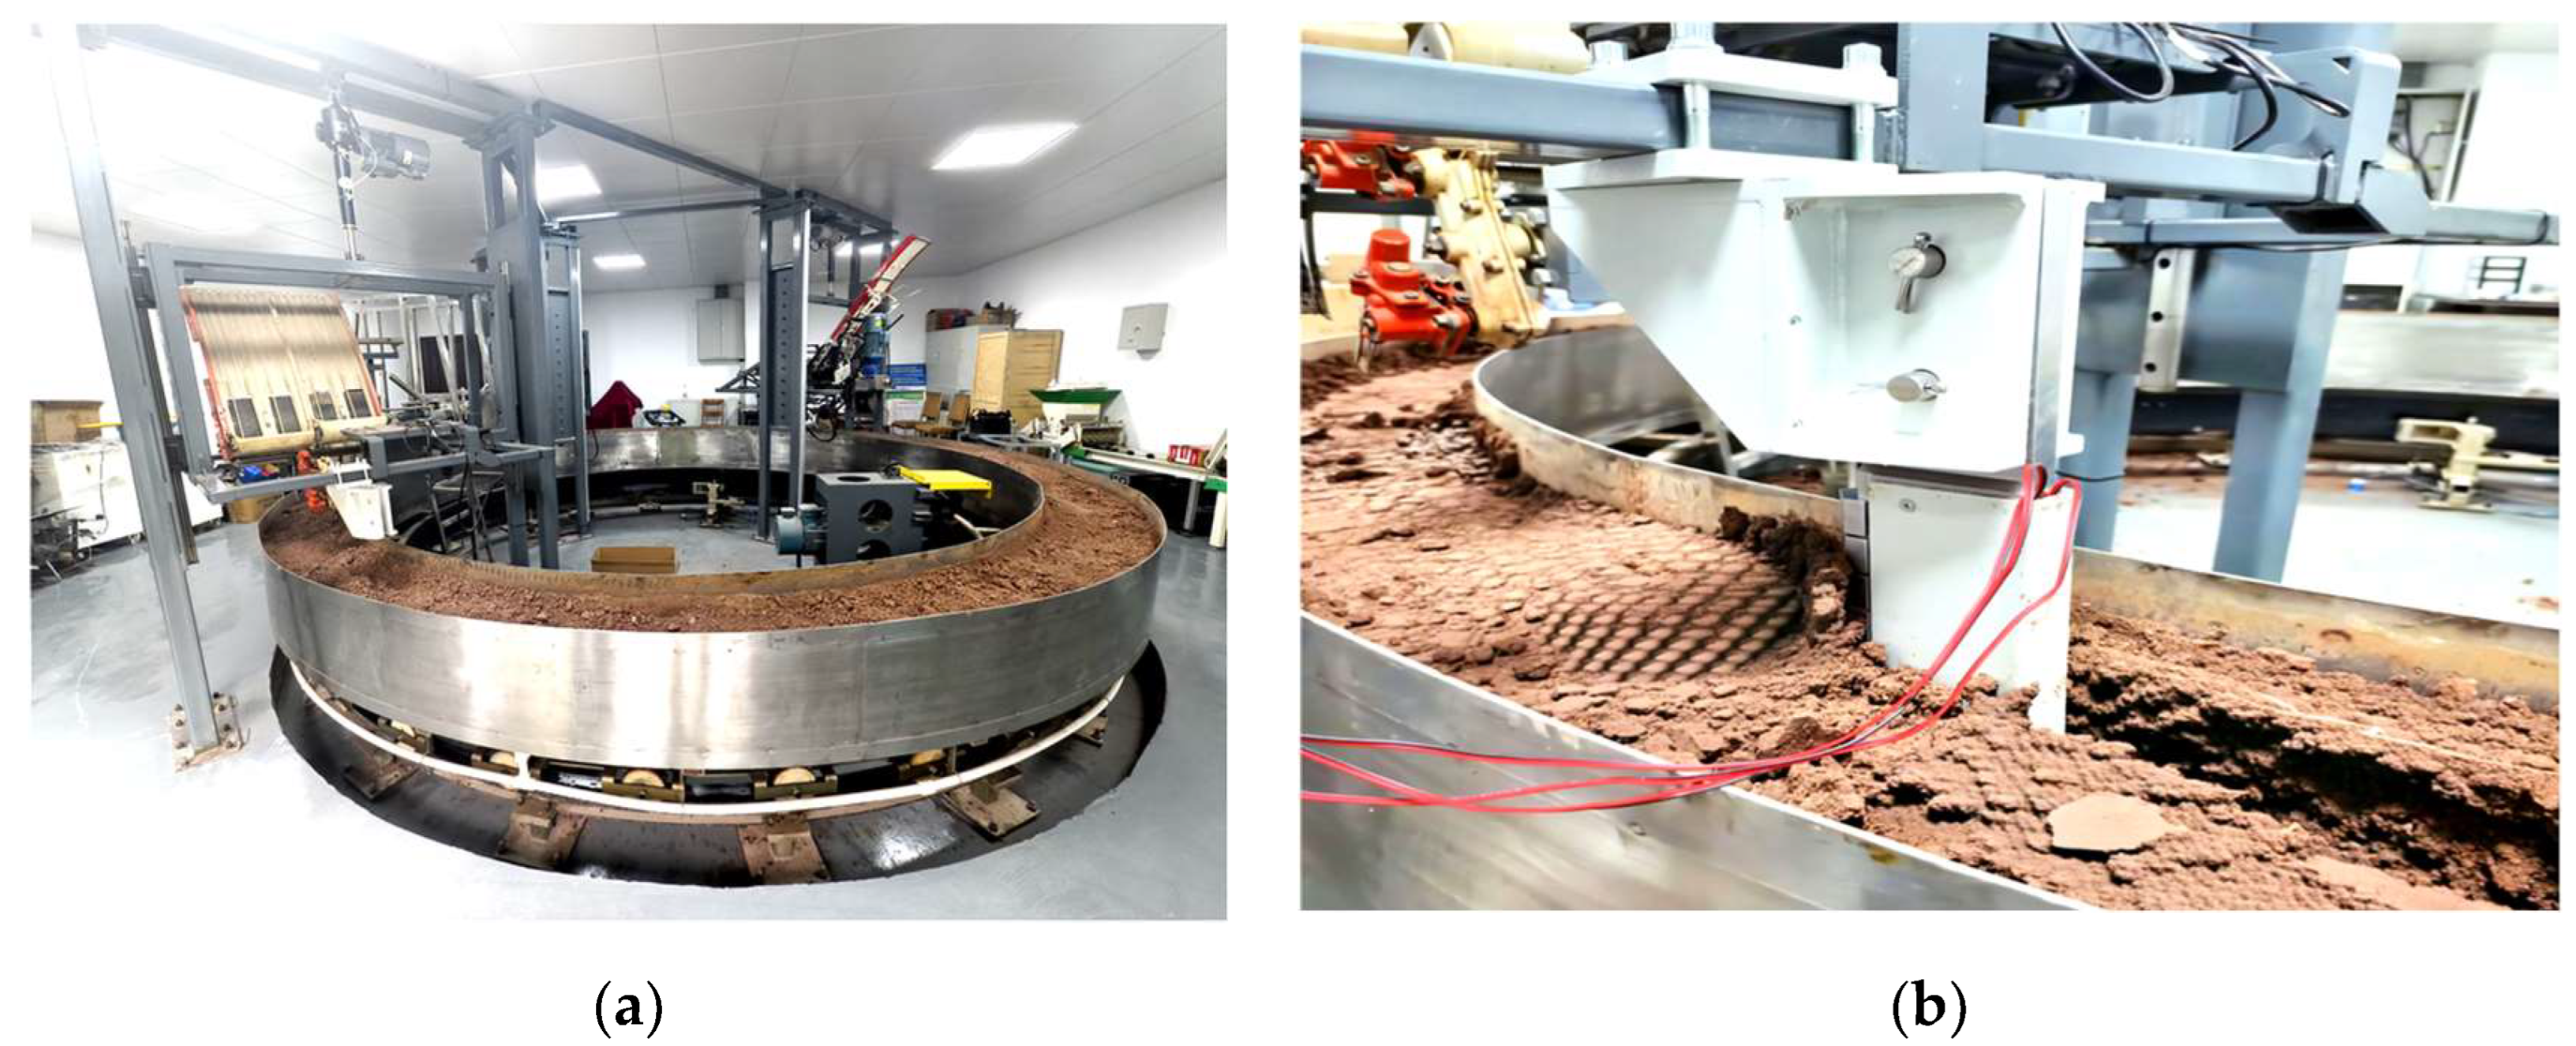
Figure 6). The soil trench test was conducted in late June 2025 at the Agricultural Machinery Testing Laboratory of the Nanjing Institute of Agricultural Mechanization, Ministry of Agriculture and Rural Affairs of China (118.83° E, 32.05° N), using a circular soil trench (
Figure 6a). The trench exhibited a radius of 2.6 m and a depth of 0.4 m. The indoor temperature was maintained at 28 degrees Celsius. The soil mechanical resistance detection device was installed on the test bench, which provided power for the operation. The installation setup is illustrated in
Figure 6b.
The soil used in the experiment was yellow-brown soil (Huangzongtu), a typical agricultural soil in Jiangsu Province. Its basic physical and chemical properties were characterized as follows: the soil texture was predominantly clay loam or loamy clay, with a moderate proportion of sand, silt, and clay particles; specifically, the clay content ranged from 20% to 30%, endowing the soil with balanced water retention and air permeability. The soil moisture content was maintained at 20% during the experiments. In terms of chemical properties, the yellow-brown soil exhibited a moderate organic matter content of 10–25 g/kg, with a pH value in the slightly acidic to neutral range (5.5–7.0). The clay mineral composition was dominated by hydromica and montmorillonite, accompanied by a small amount of kaolinite. Before the initiation of the experiment, the soil in the indoor soil trench must undergo a series of pretreatment steps, which primarily consist of three stages: watering, rotary tilling, and compaction. The rotary tilling depth is measured at 0.25 m, and the moisture content of the soil post-treatment is maintained at approximately 20%. The degree of soil compaction can be modulated by adjusting the number of compaction passes.
The soil trench test was conducted on three separate occasions. Before each test, a soil compaction meter was employed to assess soil compaction at three depths (5 cm, 10 cm, and 15 cm) at 15 cm intervals. The measured values were documented as actual values. During the test, the operating speed was set within the range of 0.69–0.72 km/h using the soil trench control panel. The soil mechanical resistance detection device utilizes three sensors arranged in a configuration designed to obtain real-time soil mechanical resistance detection values for each soil layer. A comparison of the measured values with the detected values was conducted to verify the error in soil mechanical resistance detection.
3. Results and Discussion
3.1. Signal-Processing Circuit Selection
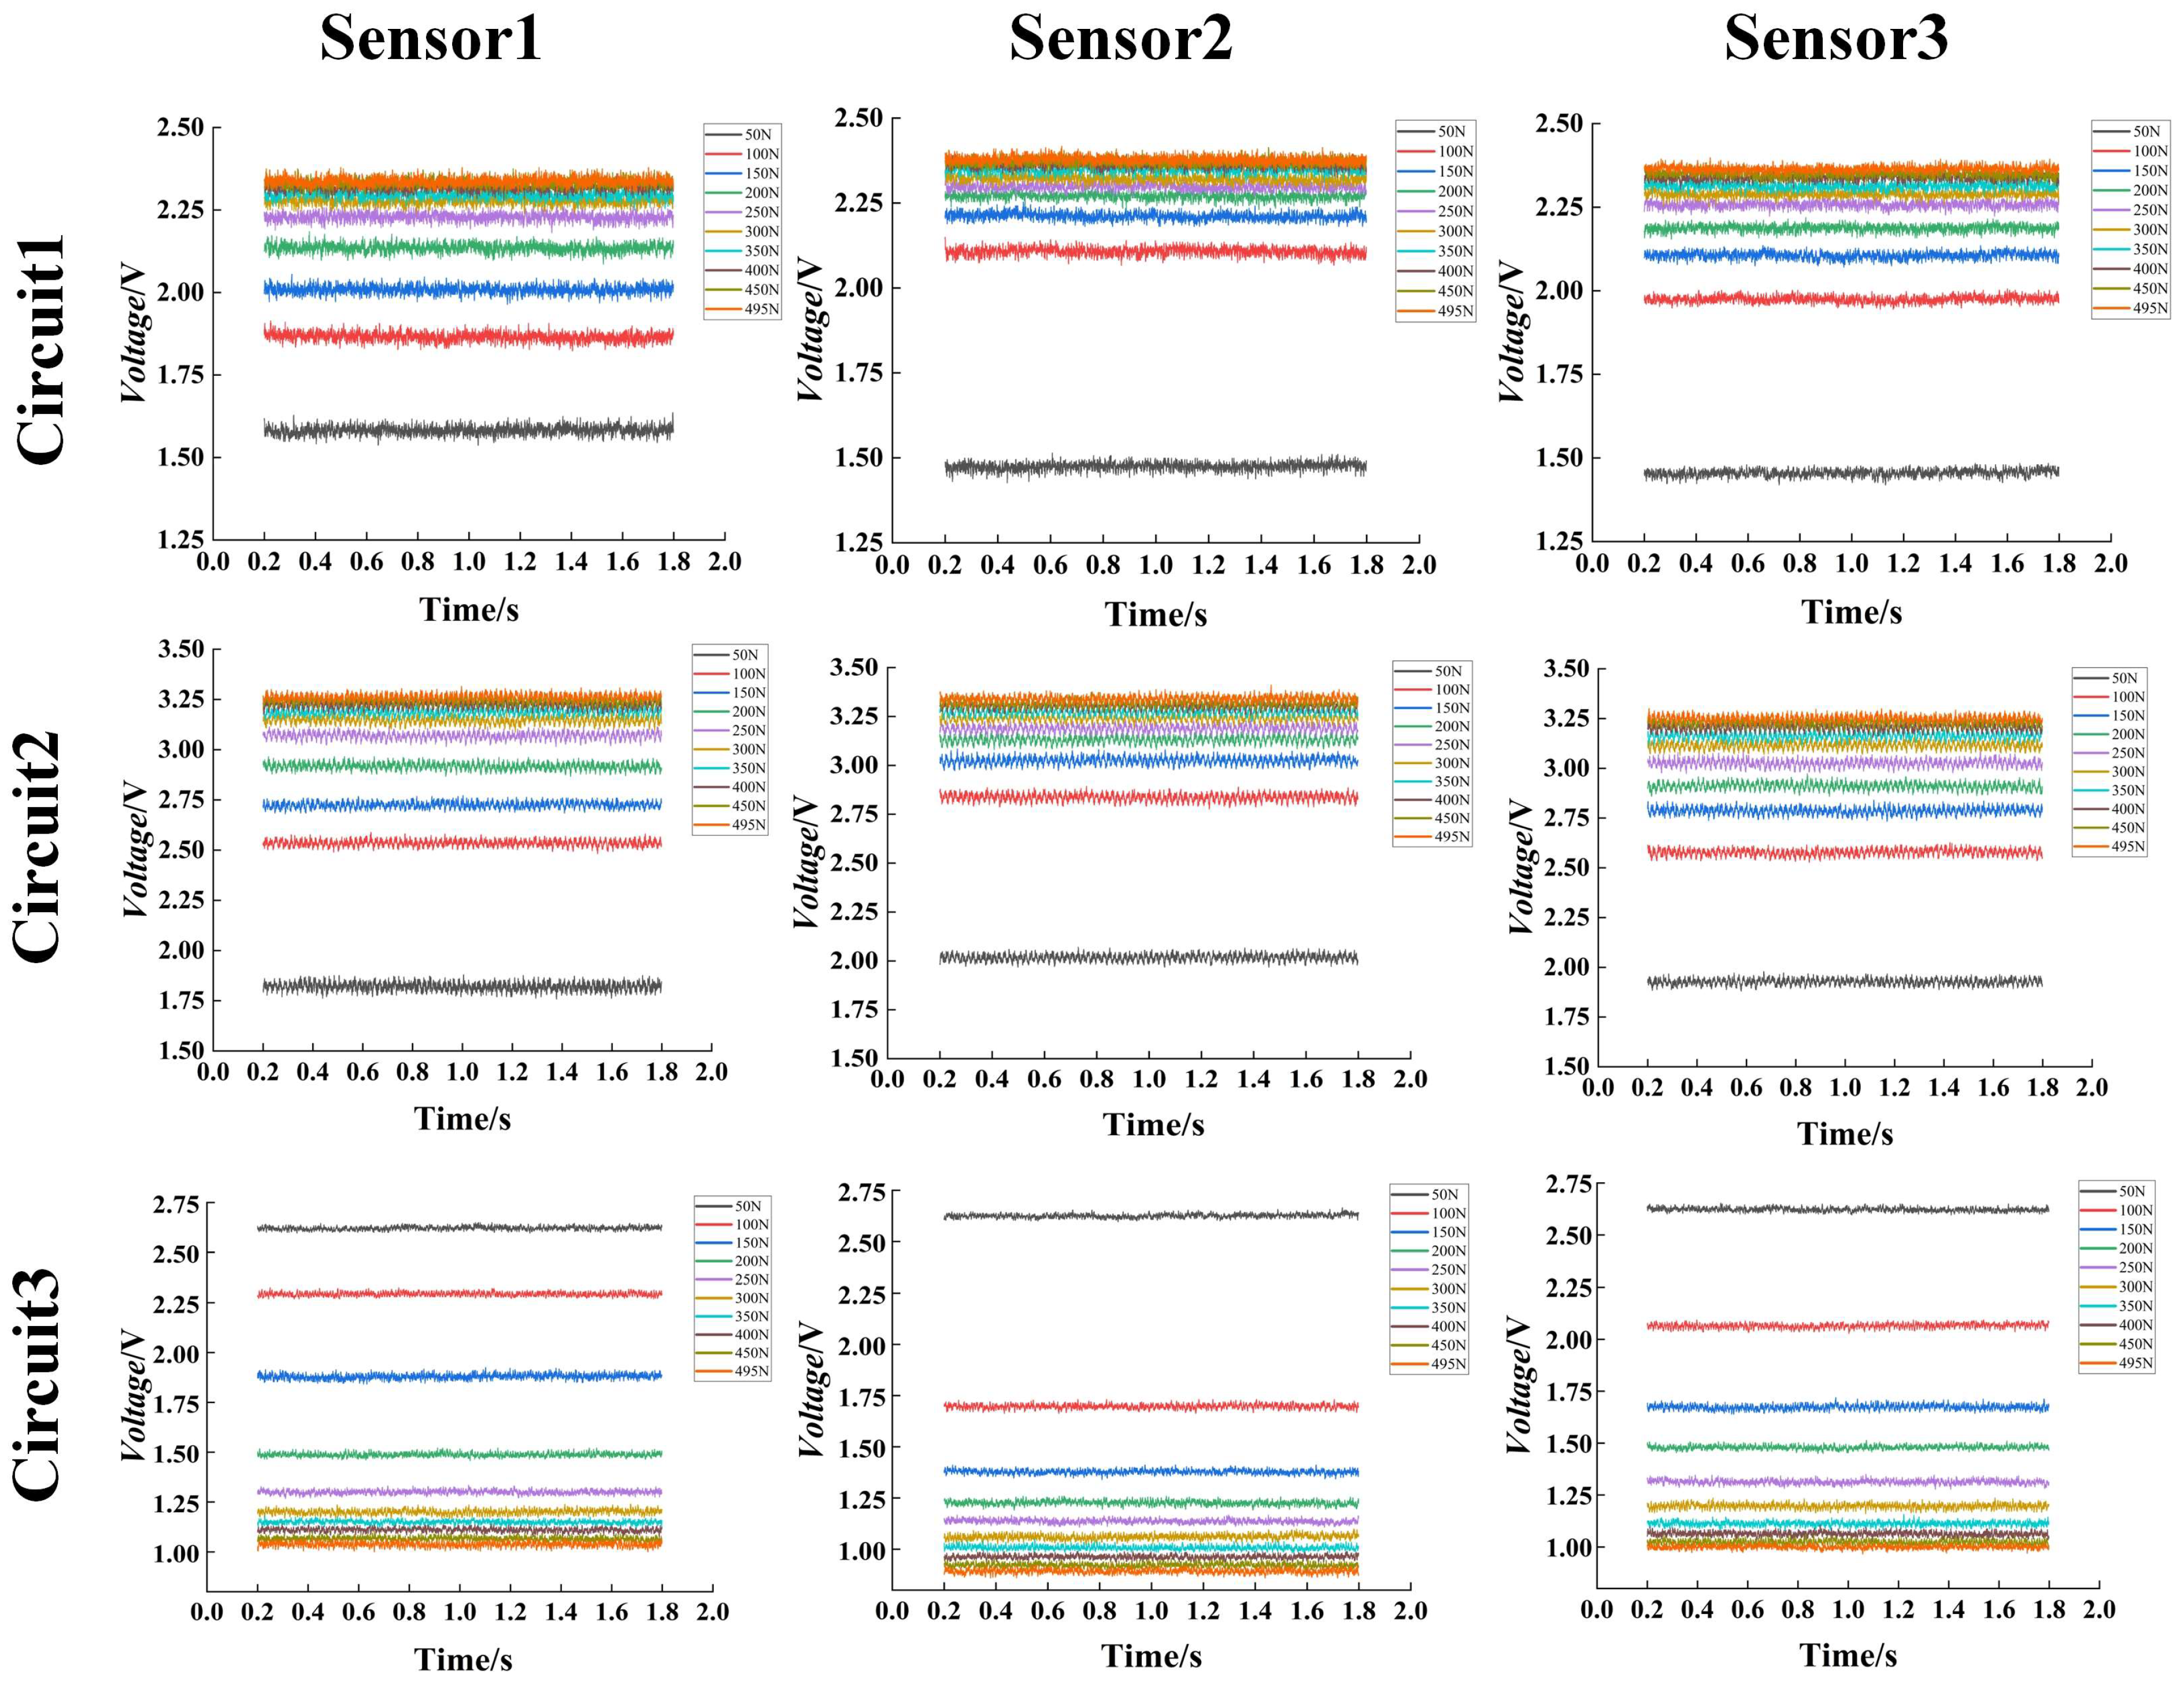
The steady-state response signals of the sensors under three different circuit configurations at various pressures are shown in
Figure 7. Within the pressure test range of 50–495 N, the steady-state response voltage of Sensors 1, 2, and 3 under circuit configurations 1, 2, and 3 exhibits consistent patterns.
For Circuit 1, the voltages from all three sensors are concentrated within a narrow voltage range. Specifically, the response voltage range of Sensor 1 is 1.6–2.3 V, that of Sensor 2 is 1.5–2.4 V, and that of Sensor 3 is 1.5–2.3 V. Within this range, voltage fluctuations are minimal, demonstrating excellent consistency and noise immunity. However, the phenomenon of voltage amplitude concentration under higher-load conditions (200–500 N) indicates low pressure resolution, which may affect detection accuracy.
In Circuit 2, the voltage distribution ranges of all sensors have been expanded. The range of the sensors is as follows: Sensor 1 ranges from 1.8 to 3.3 volts (V), Sensor 2 ranges from 2.0 to 3.4 V, and Sensor 3 ranges from 1.9 to 3.3 V. As the distribution ranges expand, the dispersion of the curves increases, enhancing pressure sensitivity, resulting in a certain degree of improvement compared to Circuit 1.
In Circuit 3, the amplitude range of the three sensor voltages has increased considerably. Sensor 1 has a range of 1 to 2.6 volts (V), Sensor 2 has a range of 0.8 to 2.6 V, and Sensor 3 has a range of 1 to 2.6 V. A comparison of Circuits 1 and 2 reveals that the response signal curves under different loads exhibit layering, with distinct steady-state values. Despite minor fluctuations in voltage, within the range of ±0.1 V, the pressure recognition capability exhibits a high degree of stability and consistency.
The standard deviation and maximum deviation statistics of the steady-state response voltages of the sensors under three different circuits at various pressures are shown in
Table 1. Within the pressure range of 50–495 N, an analysis of the steady-state response of Sensors 1–3 under Circuits 1–3 was conducted using standard deviation and maximum deviation as indicators.
In Circuit 1, the standard deviation and maximum deviation of all three sensors are within the minimum range. The mean standard deviation values for Sensors 1, 2, and 3 are 0.009, 0.012, and 0.010, respectively, while the mean maximum deviation values are 0.040, 0.049, and 0.043, respectively. This finding suggests that the signal stability is excellent.
In Circuit 2, both the standard deviation and mean error exhibited a twofold increase. The mean standard deviations for Sensors 1, 2, and 3 were 0.020, 0.029, and 0.023, respectively, while the mean maximum deviations were 0.099, 0.094, and 0.131, respectively. This finding suggests that the circuit is vulnerable to environmental noise and exhibits suboptimal signal reliability.
In Circuit 3, the standard deviations and maximum deviation values of all three sensors are lower than those in Circuit 2. This finding suggests that the implementation of voltage followers at both ends of the Wheatstone bridge can effectively suppress noise and enhance signal reliability.
As demonstrated in
Figure 8, under the optimal circuit configuration (Circuit 3), to further enhance the accuracy of soil mechanical resistance detection, a pressure-sensor signal characterization model was constructed for Sensors 1, 2, and 3 by fitting the relationship between voltage and resistance, as demonstrated in the following equation:
The coefficient of determination (R2) for each model is greater than 0.9. The findings indicate that the soil mechanical resistance signal model constructed using Circuit 3 demonstrates a high degree of measurement accuracy.
3.2. Kalman Filter Response Test Results
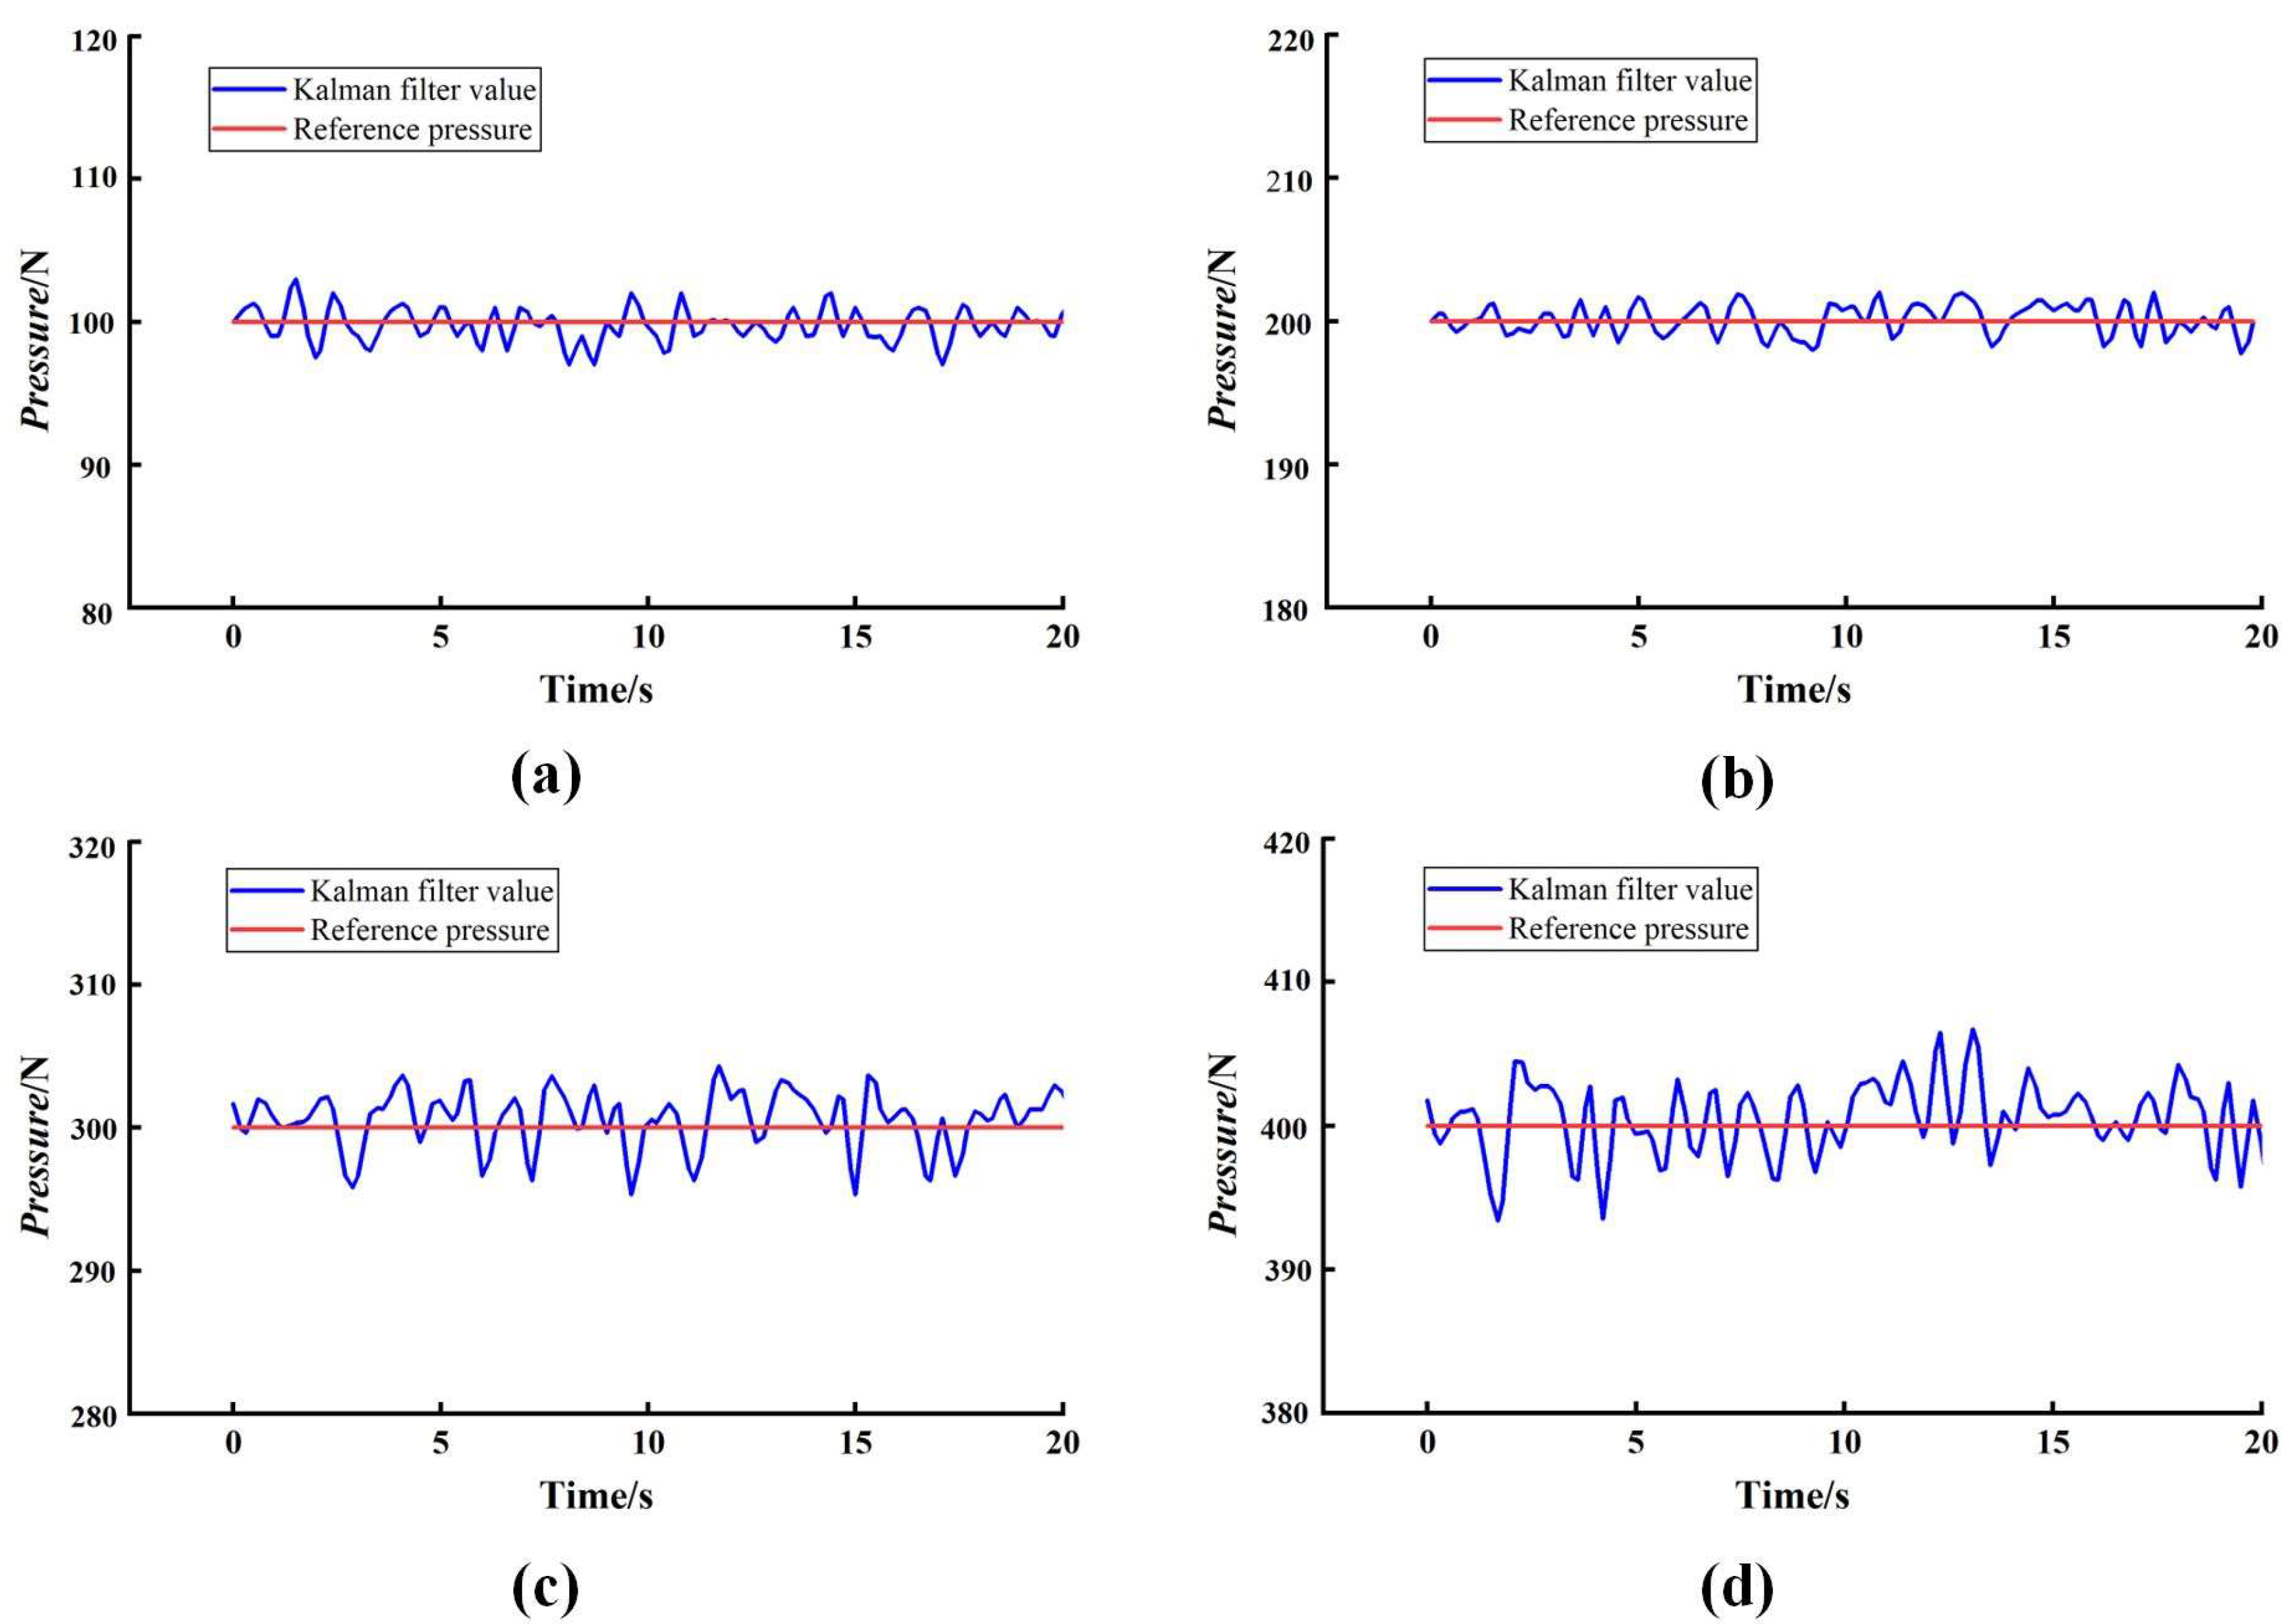
The constructed Kalman filter algorithm was subjected to testing under the optimal Circuit 3 conditions. The results of the pressure prediction analysis for steady-state loads are presented in
Figure 9. In the 100 N pressure scenario, the reference pressure value remains stable at approximately 100 N. The Kalman filter prediction values closely follow the reference pressure, with a narrow fluctuation range. This indicates that the algorithm can accurately predict the reference pressure at this pressure (
Figure 9a). At 200 N pressure, the predicted values also oscillate slightly near the reference pressure curve, with good alignment with the reference values (
Figure 9b); under 300 N and 400 N pressure conditions, the analysis indicates that the prediction values exhibit minor fluctuations due to the electrical characteristics of the system’s inherent components, such as sensor noise and circuit interference. However, the values remain distributed around the reference pressure value, with no significant deviation or divergence (
Figure 9c,d). Consequently, the predicted values generated by the Kalman filter algorithm can generally characterize the reference pressure, thereby demonstrating the efficacy of the designed Kalman filter algorithm in accurately predicting the reference pressure.
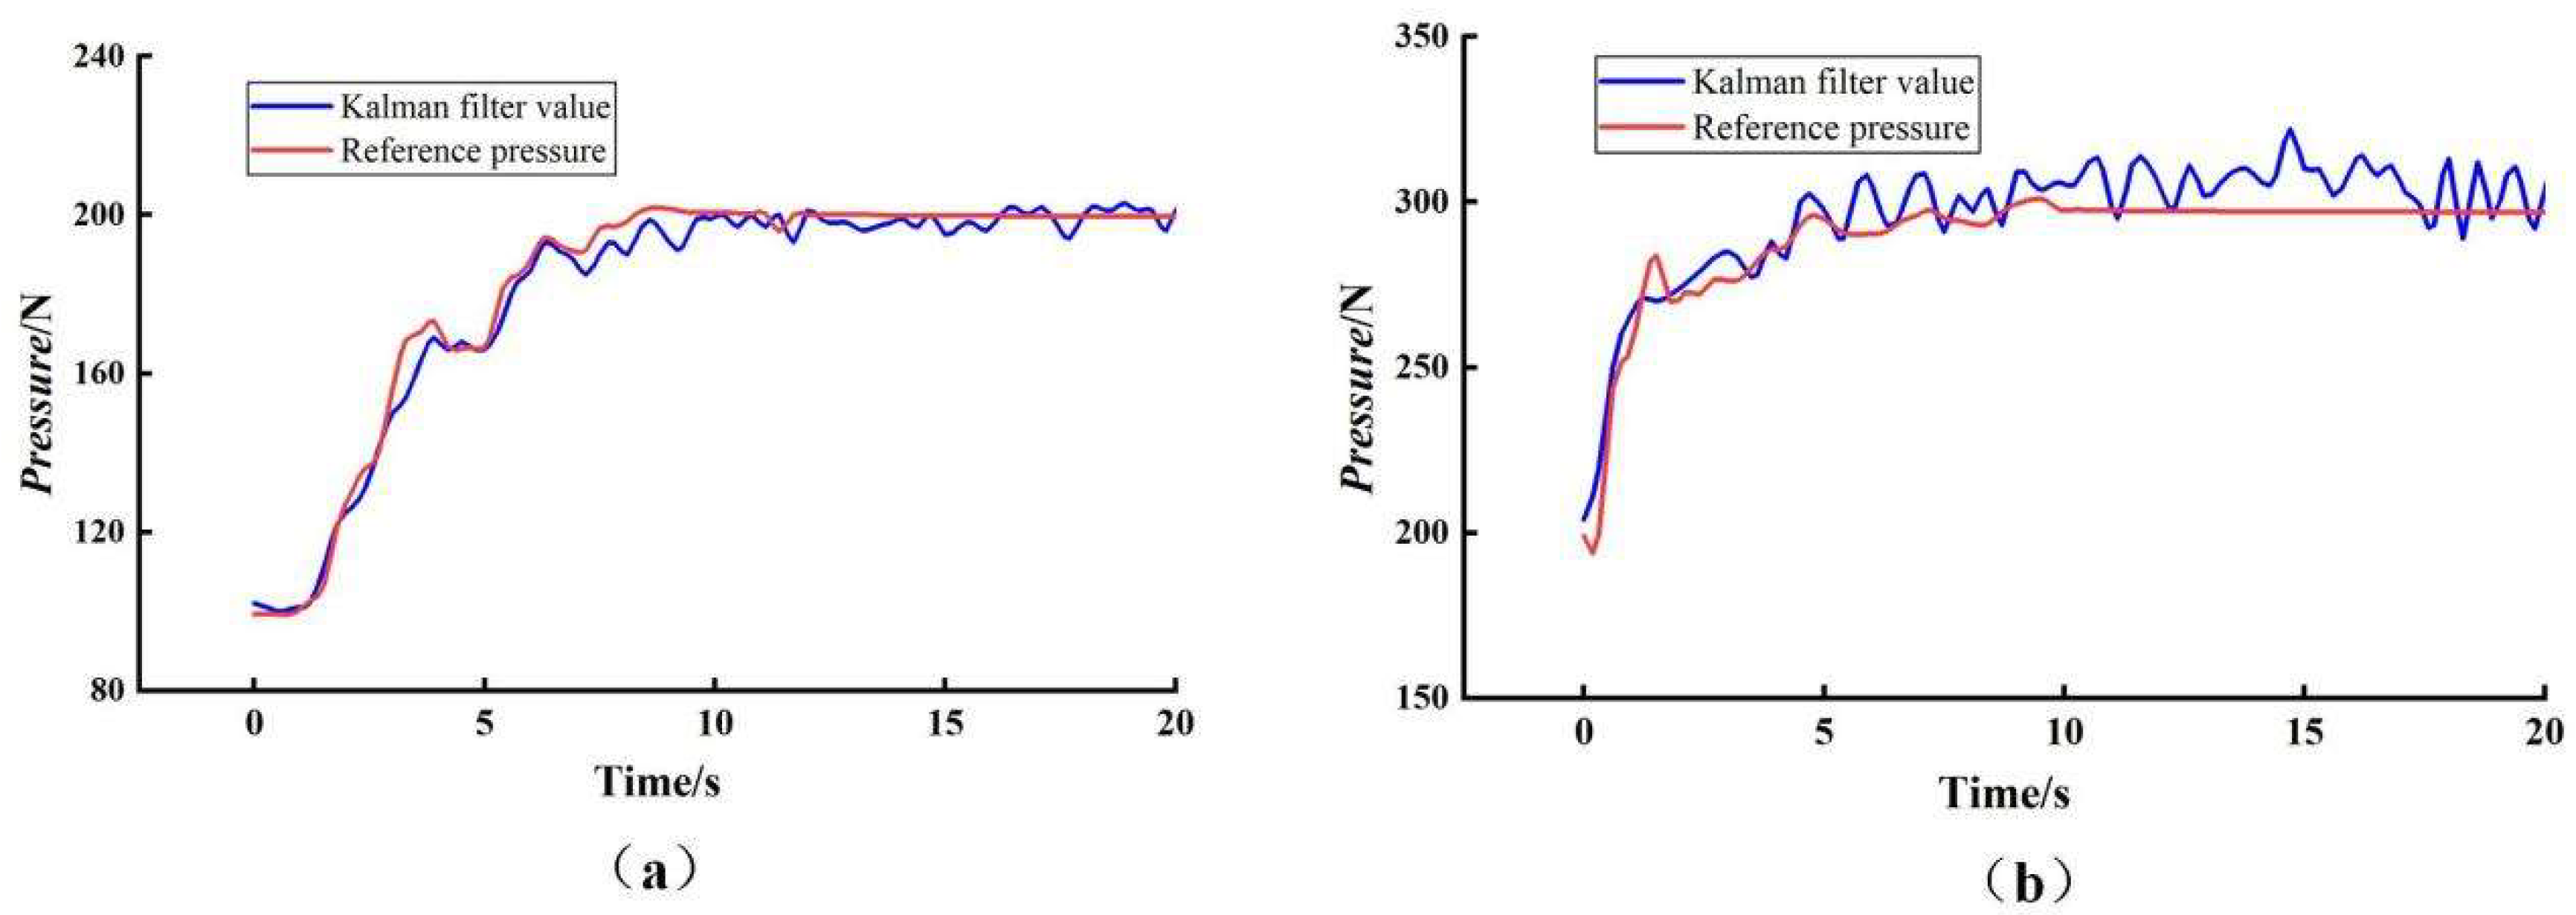
The prediction results of the Kalman filter algorithm under dynamic loading conditions are shown in
Figure 10. In the 100–200 N range, from 0 to 5 s, the reference pressure increases from approximately 100 N to 200 N. Although the Kalman filter prediction values exhibit a brief delay, they quickly track the reference pressure (
Figure 10a). During the stable phase, which occurred between 5 and 20 s, the prediction values fluctuated slightly around the reference pressure, indicating a high degree of agreement. In the 200–300 N range, during the pressure rise from 0 to 7 s, the prediction values exhibit minor deviations from the reference pressure due to reduced signal resolution under high loads. However, during the pressure stabilization phase, ranging from 7 to 20 s, the response signals rapidly converge and stabilize near the reference value (
Figure 10b). This phenomenon serves to demonstrate the Kalman filter algorithm’s capacity to effectively track dynamic pressure changes.
In summary, under dynamic test conditions, the Kalman filter algorithm’s predicted values demonstrate a high degree of correlation with changes in the reference pressure. Upon attaining the steady-state response stage, the system rapidly converges, exhibiting a close match with the reference pressure value. However, slight fluctuations remain above and below the reference pressure, with no discernible trend drift. This finding confirms the efficacy of the Kalman filter algorithm, which was meticulously engineered under dynamic test conditions, in accurately predicting the reference pressure value.
3.3. Results of Soil Tank Experiments
The findings of the soil mechanical resistance tests, as derived from the soil bin experiment, are presented in
Figure 11. Given the incompatibility of the soil compaction meter and the testing device in terms of force-bearing areas, the values obtained from manual sampling and the values predicted by the testing device were collectively assessed as pressure for the purpose of comparison and analysis, with this assessment being based on force and area. As illustrated in
Figure 11, the distribution of manual actual values and testing values at depths of 5 cm, 10 cm, and 15 cm is depicted for the three sensors. At the 5 cm surface layer, the testing values and actual values of Sensors 1, 2, and 3 exhibit good consistency, with the two values closely aligned and fluctuating together most of the time. Despite minor local deviations in some sampling points, such as Sensor 3, these variations do not induce trend drift. The mean discrepancy between the values obtained from testing and the actual values was found to be 2.03%. At a depth of 10 cm, the predicted values maintain a satisfactory correlation with the actual values; however, variations in local deviations are observed among different sensors. For instance, Sensor 2 demonstrates discernible deviations at select sampling points. This phenomenon may be attributed to the spatial heterogeneity of the soil. The manually sampled values and the detected processed data are not perfectly aligned, yet the predicted values do not demonstrate persistent drift. At this juncture, the mean discrepancy between the detected values and the actual measured values is 1.48%. At a soil depth of 15 cm, the predicted values persist in exhibiting a dynamic correlation with the actual values. Local deviations in sensor readings are observed, yet no sustained drift is detected. In these conditions, the mean discrepancy between the detected values and the measured values is 6.27%.
As demonstrated in
Figure 12, the detected values were aligned with the actual measured values, and the 95% confidence intervals are delineated in the dark purple area of the figure. The findings indicate a substantial linear correlation between the two variables, as evidenced by a coefficient of determination (
R2) of 0.95753, which approaches one. When considered in conjunction with the 95% confidence intervals, it is evident that the data points are distributed centrally around the fitted straight line. The width of the intervals is deemed reasonable, and the degree of coverage is high. This suggests that the constructed detection device and model of soil mechanical resistance are highly aligned with the trend of the actual measured values, thereby validating the model. The model demonstrated an ability to predict values within the 95% confidence interval, and the measured values exhibited a satisfactory degree of fit, accompanied by notable reliability and stability.
In summary, the soil mechanical resistance detection model can dynamically track the actual values at soil depths of 5 cm, 10 cm, and 15 cm. Despite the potential for local deviations in predicted values as depth increases, there is an absence of trend drift, suggesting the efficacy of the detection device in soil mechanical resistance detection.

