Article

Phosphorus and Microbial Degradation Mediate Vegetation-Induced Macroaggregate Dynamics on the Loess Plateau, China

1
College of Advanced Agricultural Science, Yulin University, Yulin 719000, China
2
College of Soil and Water Conservation Science and Engineering, Northwest A&F University, Yangling 712100, China
*
Author to whom correspondence should be addressed.
These authors contributed equally to this work.
Agronomy 2025, 15(8), 2011; https://doi.org/10.3390/agronomy15082011
Submission received: 18 July 2025 / Revised: 20 August 2025 / Accepted: 20 August 2025 / Published: 21 August 2025
(This article belongs to the Section Agroecology Innovation: Achieving System Resilience)

Abstract

Vegetation restoration enhances soil erosion resistance by enhancing soil aggregates, but the function of these aggregates and their relationship with soil nutrients and microbes remain unclear. In this study, two land cover types that induce different aggregate ratios were selected to determine the soil aggregate ratio, aggregate ability, nutrients, and microbes. The results showed that high vegetation cover induced a higher macroaggregate ratio and soil water content; stronger soil shear strength; higher mean weight and geometric mean diameters; and lower soil bulk density. Macroaggregates had a lower soil organic matter (SOM) content compared with small macroaggregates. The aggregates and SOM influenced soil microbial diversity, especially microbial species and functions, and the large and small macroaggregate soils contained more microbes involved in SOM degradation, which accelerated the degradation and induced macroaggregate fragmentation. Total phosphorus (TP) had a direct impact on macroaggregates, and TP and macroaggregates showed the same correlation with the main microbial abundance. Taken together, we conclude that in the environment studied, SOM influenced soil microbes and the microbial function in SOM degradation affecting soil aggregates. TP contributed more to soil aggregate variations, especially in large macroaggregate formation.

1. Introduction

Stable soil aggregates help improve soil structure, boost soil fertility, reduce soil erodibility, and mitigate soil erosion [1]. The literature suggests that over 24 billion tons of fertile soil is lost annually worldwide, threatening 33% of the Earth’s arable land [2] and reducing agricultural productivity, with yield losses of up to 50% in extreme cases. This increasing the sedimentation of aquatic ecosystems and increases greenhouse gas emissions from carbon-depleted soils [3,4,5]. The self-reinforcing nature of erosion processes is alarming. Once initiated, soil structure deterioration creates conditions for exponentially faster degradation [6]. Central to understanding erosion resistance is the role of soil aggregates, that is, the fundamental architectural units of soil formed through the cohesion of mineral particles, organic matter, and microbial byproducts [7]. Vegetation restoration enhances soil’s erosion resistance by enhancing soil aggregates [8]. These aggregates, ranging from microscale (<0.25 mm) to macroscale (>2 mm) formations, create pore networks that regulate critical soil functions, such as water infiltration rates, reducing runoff by 40–70%; carbon sequestration capacity, storing 60–90% of soil organic carbon; and resistance to shear forces generated by rainfall impact [9,10]. Aggregates’ stability determines their vulnerability to disintegration under erosive forces. However, current erosion models frequently treat soil as a homogeneous medium, thus largely overlooking the aggregate-mediated processes that govern real-world detachment and transport mechanisms.
Different aggregate size classes exhibit distinct behaviors in erosion processes and organic matter dynamics [11,12]. Macroaggregates (>0.25 mm) demonstrate superior structural stability owing to a greater quantity of organic binding agents (polysaccharides and fungal hyphae), which reduce these aggregates’ susceptibility to break down via raindrop impact relative to microaggregates [12,13]. Conversely, microaggregates (<0.25 mm) serve as long-term organic carbon reservoirs through mineral–organic complexation but show 30–50% lower microbial biomass due to restricted pore accessibility [14]. This size-dependent differentiation creates a complex regulation process. Firstly, macroaggregates physically protect soil organic matter (SOM) from decomposition, and their breakdown during erosion events abruptly exposes SOM to microbial mineralization [15]. Then, the increased available SOM content increases soil microbial diversity in microaggregates, thereby affecting soil aggregation formation [16]. As feedback, the increased SOM could accelerate macroaggregate formation. In addition, microbial dimensions add further complexity. Recent metagenomic studies have shown that aggregate size creates distinct microbial habitats. Macroaggregates host fungal-dominated communities specialized in decomposing fresh organic inputs, whereas microaggregates favor bacteria adapted to stabilized carbon forms [17,18]. This spatial partitioning of microbial guilds directly influences aggregate stability through the differential production of binding agents, such as glomalin from arbuscular mycorrhizal fungi in macroaggregates. In addition, the requirements for soil nutrients total nitrogen (TN) and SOM could be met via nitrogen deposition and the decomposition of vegetation litter, while those for total phosphorus (TP) cannot be met naturally [19,20]. Without additional supplements, adequate nitrogen enrichment and limited phosphorus are common in ecologically fragile areas. Therefore, at least two critical knowledge gaps persist: (1) the influence of soil aggregates differing in size and composition on soil erosion and the relationships between aggregate size distribution and erosion resistance and (2) the clear influence of soil aggregates on insufficient soil nutrients due to severe soil erosion. Resolving these questions is essential for developing site-specific soil conservation strategies.
Located in Northwest China, the Loess Plateau is one of the areas most severely affected by erosion worldwide, especially on high and steep slopes [21]. Over the past few decades, the Grain for Green project has demonstrated a strong influence on ameliorating soil erosion. Large-scale planting of grass and trees has resulted in various landscapes with different land cover levels. This has provided an ideal experimental site with which to study the effects of soil erosion on nutrient and aggregate composition under different vegetation cover levels and to explore its microbial-driven mechanisms. To address these critical gaps, we implemented a novel size-fractionation approach to investigate aggregate-mediated erosion processes through three interconnected dimensions: microbial community dynamics, organic matter, and physical stability. We hypothesized that different levels of plant coverage on the land result in various aggregates, with microbes and soil nutrients playing vital roles in this process. To confirm this hypothesis, a sample site with different levels of land coverage but covered with the same grass taxon was selected. Surface soil samples susceptible to erosion were collected and used to determine the soil erosion index, aggregate size, soil nutrients, and soil microbial diversity in soil aggregates of different sizes.

2. Materials and Methods

2.1. Sample Sites and Sampling

High and steep slopes located on the Loess Plateau (N 38.35° E 109.83°) were selected for soil sample collection (Figure 1A). The gradient of this area was 28°, and it was restored after the Grain for Green project started in 1999. The soil covered in the slope was calcaric regosols (sand, 67.51%; silt, 21.42%; clay, 11.07%). The soil mass is loose, profile development is not obvious, and the slope is less affected by human activities due to its high and steep gradient. Sites with two different land cover levels (high land cover 80%, HC; low land cover 35%, LC; Figure 1B–D) were selected. The dominant plant taxon at these sites was Stipa bungeana. This region experiences a typical continental arid and semi-arid climate, with an average annual rainfall of 400 mm, which is mainly concentrated in July and August. Therefore, high and steep slopes are affected by intense rainfall, resulting in severe water erosion.
On 4 October 2024, the soil was sampled at a depth of 0–30 cm. Three plots (5 × 5 m) were selected for each site, and three sampling points were randomly selected for each plot. A soil profile with a depth of 0–30 cm and a width of 100 cm was prepared in each sampling point. After measuring the soil shear resistance, the soil was sampled at 0–10 cm, 10–20 cm, and 20–30 cm depths. Undisturbed soil samples were obtained with stainless steel cutting rings of standard dimensions: 5.05 cm internal diameter, 5.00 cm height, and 100 cm3 volume. Two rings were used to collect two soil samples in each soil layer to detect soil bulk density and stable infiltration rate, respectively. Soil samples from the same depth interval of three soil profiles in the same plot were combined into a single composite sample. A total of 18 composite soil samples were collected for analysis. Aluminum cans with a diameter of 4.00 cm and height of 2.50 cm were used to measure soil water content. The soils were kept cold (approximately 4 °C) and taken to the laboratory.

2.2. Soil Physical Fractionation for Aggregate Studies

The soil was lyophilized using a Freeze Dryer (LGJ-10N/A; Yaxing Yi Ke, Beijing, China). The lyophilized soil was separated into three aggregate sizes (>2.00 mm, large macroaggregates; 0.25–2.00 mm, small macroaggregates; and <0.25 mm, microaggregates) using the dry sieving method. The nest of sieves consisting of 2 mm mesh size sieve, sitting on top of the 0.25 mm mesh size sieve associated with an automated equipment (8411, Zhejiang Geotechnical Instrument Manufacturing Co., Ltd., Shaoxing, China). Then, 500 g freeze-dried soil was placed on top of the nest of sieves and dry-sieved at a vertical amplitude of 1400 r min−1 for 5 min. The soil samples were shaken, and the materials left on the top of all sieves were collected. From a total of 54 samples obtained, those remaining on the 2 mm and 0.25 mm and those passing through the 0.25 mm sieves were designated large macroaggregates, small macroaggregates, and microaggregates, respectively [22]. The different sized aggregates were weighed. A portion of each sample was used to determine microbial diversity. A subsample of each aggregate fraction was then passed through a 0.2 mm sieve to measure the SOM, total phosphorus (TP), and total nitrogen (TN) contents. The remaining subsamples were used to calculate the mean weight diameter (MWD) and geometric mean diameter (GMD).

2.3. Soil Measurements

Soil shear resistance was measured in the field using a micro-vane shear apparatus (WXSZB-2.0, Ying’an Instrument Co., Ltd., Suzhou, China). We placed the soil onto a cross plate and twisted the instrument; the maximum force that the soil could withstand before being damaged was the measured value.
The aggregate stability indices MWD and GMD were determined after successful isolation of the three aggregate size fractions. These determinations are based on the equations given in [10]. MWD was calculated as follows:
M W D = i = 1 n X W i
where X is the mean diameter of the aggregates remaining on the respective sieves, Wi is the ratio of the weight of the aggregate remaining on the sieve to the total weight of the sample, and n is the number of sieves used for aggregate separation.
GMD was calculated as follows:
G M D = e x p ( i = 1 n W i log X i i = 1 n W i )
where Xi is the mean diameter of each aggregate oversized by each sieve, Wi is the total dry weight of the obtained aggregates, and n is the total number of sieves.
The aggregate ratio was the weight proportion of the specific sized soil aggregate to that of the total soil (500 g). For example, a large macroaggregate ratio was the ratio of the weight of a large macroaggregate to the total soil weight.
The stable soil infiltration rate was measured using the cutting ring method [23]. Briefly, undisturbed soil was collected using steel ring (5.05 cm × 5.00 cm); then, an empty steel ring (5.05 cm × 5.00 cm) is fixed on top of the steel ring whose sample collection has been completed with impermeable tape, after which a Marriotte bottle was used to inject water into the upper empty steel ring, ensuring that the water head of the ring remained consistent at 5 cm. The water volume change in the Marriott water bottle was recorded every minute during the first 20 min of the experiment. After 20 min, it was recorded every two minutes until the infiltration volume in the Marriott water bottle remained stable. The stable infiltration rate is the ratio of the stable infiltration volume measured within a certain time interval to that time interval (Figure S1). It is calculated according to the following formula.
Stable infiltration rate = (ΔV × L)/(AT × (L + H))
where ΔV is the water flow flux within the specified time (mL); A is the cross-sectional area of the inner ring (mm2); T is the time interval (min); L is the depth of the double ring pressing into the soil (mm); H is the height of the water head (mm).
Soil water content was detected using the oven drying method. Briefly, an aluminum can containing fresh soil was weighed, after which the soil was dried at 105 °C to achieve Wt and Wd, respectively. The soil water content was calculated as follows:
Soil water content = (Wt − Wd)/(Wd − Wb) × 100
where Wb is the weight of the aluminum can.
Soil bulk density was determined using cylindrical rings (100 cm3). The undisturbed soil was collected and taken back to the lab to dry at 105 °C to a constant weight to achieve the dry soil weight; then, the soil bulk density was calculated as the ratio of the dry soil weight to 100 cm3.
SOM was determined using the potassium dichromate volumetric method with an external heating method. TP was determined using the antimony molybdenum colorimetric method after the soil was treated with the sodium hydroxide fusion method, and TN was determined with a Kjeltec 2300 analyzer unit (Foss Tecator AB, Hoganas, Sweden) after using the Kjeldahl method.

2.4. Microbial Diversity Determination

Microbial diversity was determined by the 16S rRNA and ITS sequence using the primers 16S-338F (5′-ACTCCTACGGGAGGCAGCA-3′) and 16S-806R (5′-GGACTACHVGGGTWTCTAAT-3′), and ITS-F (5′-CTGGTCATTTAGGGAAGTAA-3′) and ITS-R (5′-GTGCGTTCTTCATCGATGC-3′). DNA extraction, PCR amplification, and sequencing were performed using an Illumina NovaSeq (Majorbio Group, Shanghai, China). After quality control and filtering of the raw sequence obtained from sequencing, it was then processed using UPARSE software (version 7.0.1090 (http://drive5.com/uparse/, accessed on 20 January 2025)). Operational classification units (OUT) with a similarity threshold of 97% were clustered and compared with the Silva and Unite databases to obtain OUT classification species information. Based on the sequencing volume of each sample, a diversity index analysis, including Chao1 and the Shannon index [24], was performed after flattening with the minimum sequencing volume. Chao1 is one of the indicators used for measuring the richness of species. The Shannon index was used to estimate the diversity of microorganisms in soils. Phylogenetic Investigation of Communities by Reconstruction of Unobserved States (PICRUSt2) was used to predict enzyme function by predicting the gene sequence in the functional database KEGG (https://www.kegg.jp/, accessed on 22 January 2025). The raw sequence data were deposited in the Genome Sequence Archive in the National Genomics Data Center (CRA027904, https://ngdc.cncb.ac.cn/gsa, accessed on 22 July 2025).

2.5. Data Processing and Statistical Analysis

Differences between the two soils under two land cover levels at the same soil depths were determined with the t-test, and the influences of coverage level, soil depth, and their interaction were confirmed via two-way analysis of variance using SPSS Statistics ver. 20.0 software (SPSS Inc., Chicago, IL, USA). Correlation analysis between soil properties (macroaggregate rate, TP, SOM, and TN) and microbes was conducted using the Majorbio Cloud (https://analysis.majorbio.com/, accessed on 20 January 2025) under the taxonomic level genus. Statistical significance was set at p < 0.05. comparison. Principal component analysis (PCA) was performed using GraphPad Prism 9.5 (GraphPad Software, Boston, MA, USA). GraphPad Prism 9.5 and SigmaPlot 12.5 (Systat Software Inc., San Jose, CA, USA) were used to produce the figures.

3. Results

3.1. Soil Aggregate and Soil Stability Indices

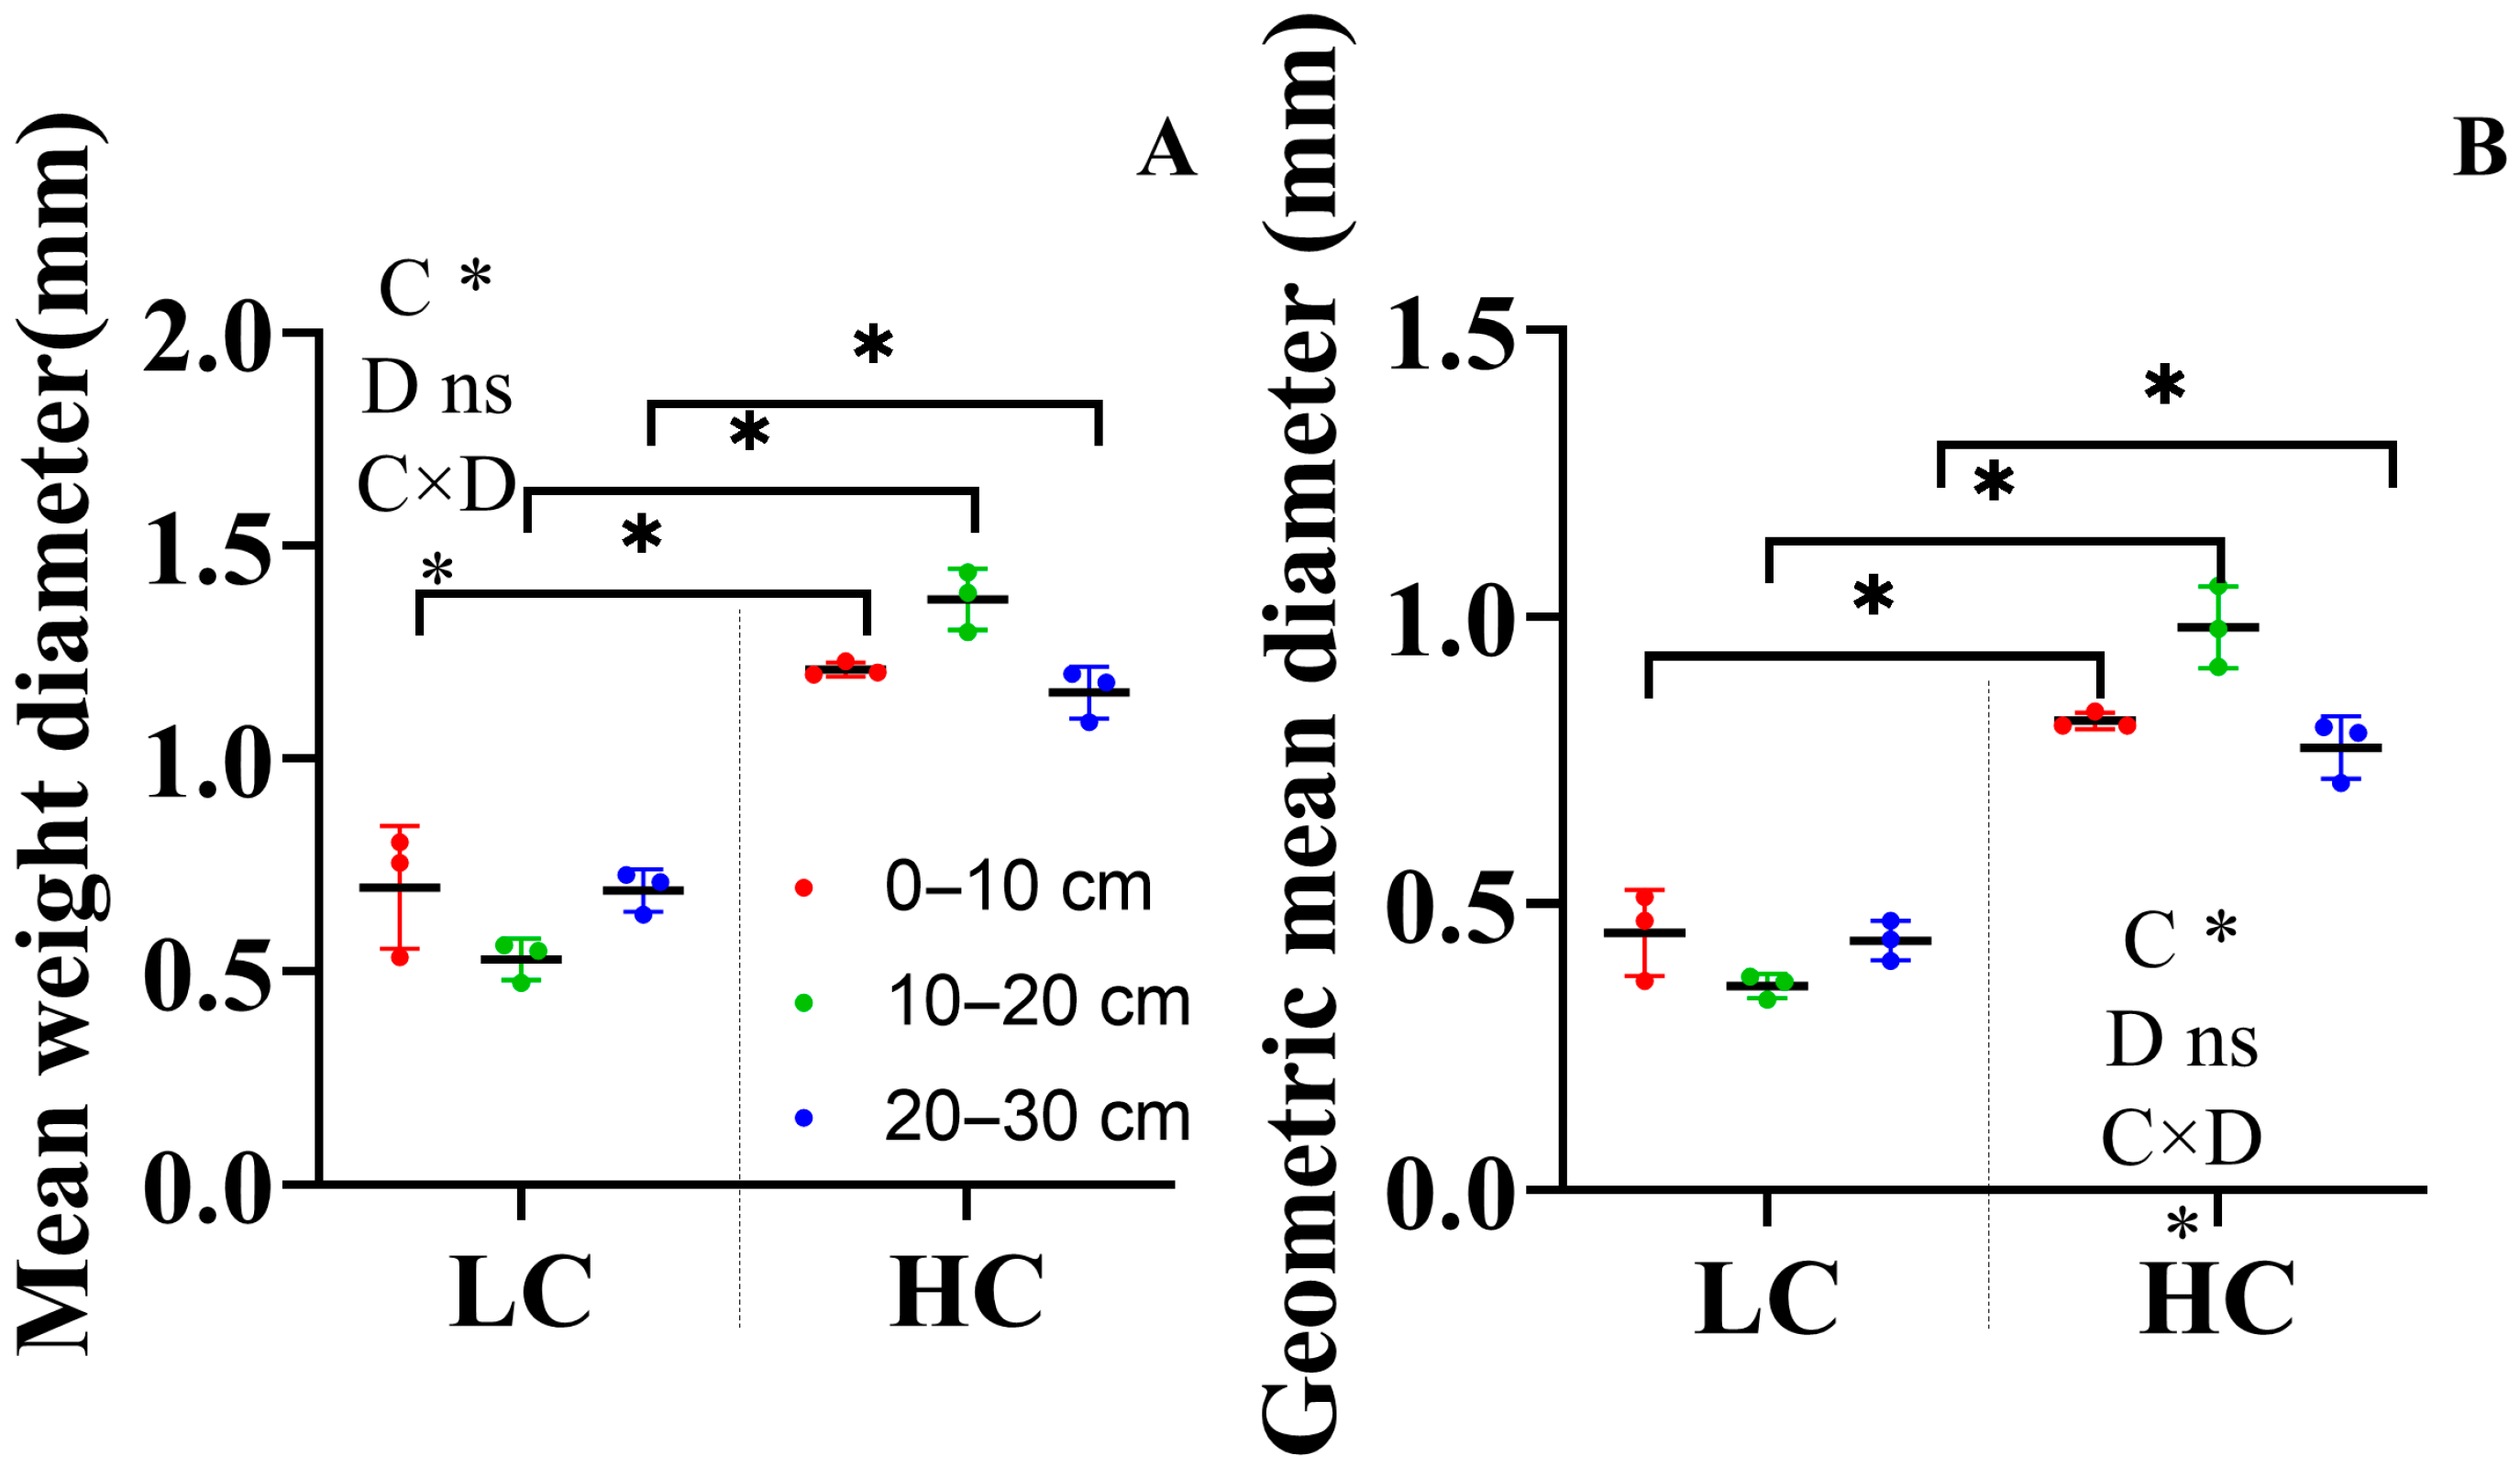
Vegetation cover significantly affected soil aggregates (Figure 2). At the 0–10 cm soil depth, more than 60% of the soil aggregates were microaggregates (<0.25 mm) under low coverage, which was 64.6% higher than that of high coverage. Under high coverage, the macroaggregates were dominant (52.16%, Figure 2A). Similar results were detected in the subsoils (10–20 cm and 20–30 cm, Figure 2B,C). Vegetation cover (C) significantly influenced MWD and GMD (Figure 3), whereas soil depth (D) did not have a significant effect on these two indices. The HC group had 71.9–146% higher MWD and GMD values than the LC group at all three soil depths.
With increasing soil depths, the soil shear strength increased, except at the 0–10 cm depth in the HC group (Figure 4A). The HC group held a significantly higher soil shear strength index than the LC group at the same soil depth. Soil depth, land cover, and their interactions significantly influenced soil shear strength. In addition, the soil water content increased as the soil depth increased, and the HC group had a relatively higher soil water content (18.1–41.6% higher) than the LC group (Figure 4B). Meanwhile, the soil bulk density was higher in LC than HC. While the bulk density of the topsoil (0–10 cm) of LC was lower than the subsoils, there was no significant difference among the soils of HC, and the soil depth and interaction of depth and cover did not significantly affect soil bulk density (Figure 4C).
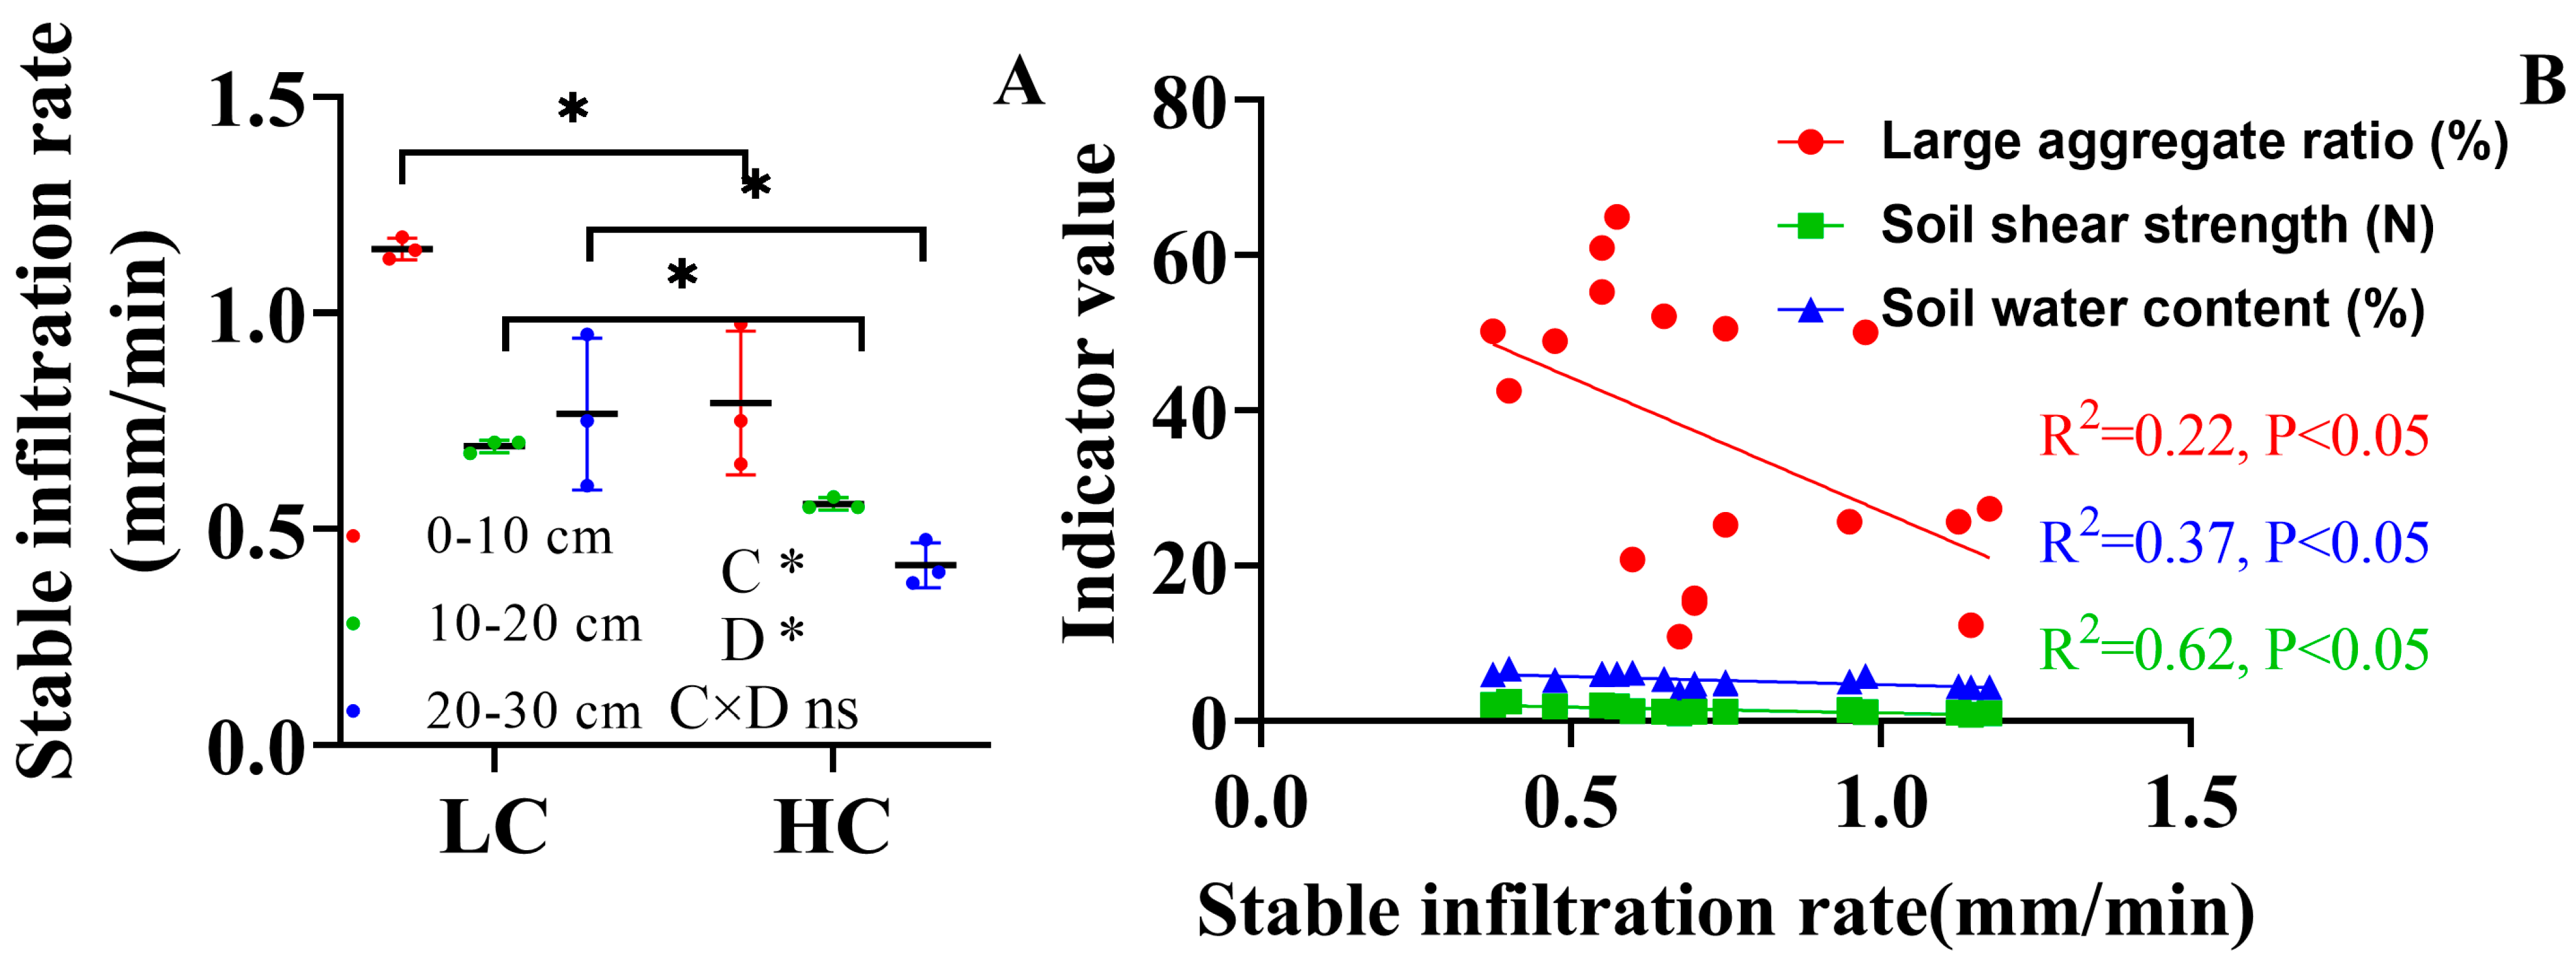
The stable infiltration rate was significantly affected by soil depth and land cover (Figure 5A). The topsoil had a higher stable infiltration rate (63.5–87.5% higher) in these two groups, which decreased with the increasing soil depth. The LC exhibited a higher stable infiltration rate (approximately 27.3–87.5% higher at the same soil layer) than HC. Correlation analysis showed that the stable infiltration rate was significantly negatively affected by soil large macroaggregates, shear strength, and water content (p < 0.05, Figure 5B). Soil water content and shear strength were positively and negatively influenced by the large macroaggregates and microaggregates, respectively. Meanwhile, soil bulk density was positively and negatively influenced by microaggregates and large macroaggregates, respectively (Figure S2).

3.2. Soil Nutrient Content

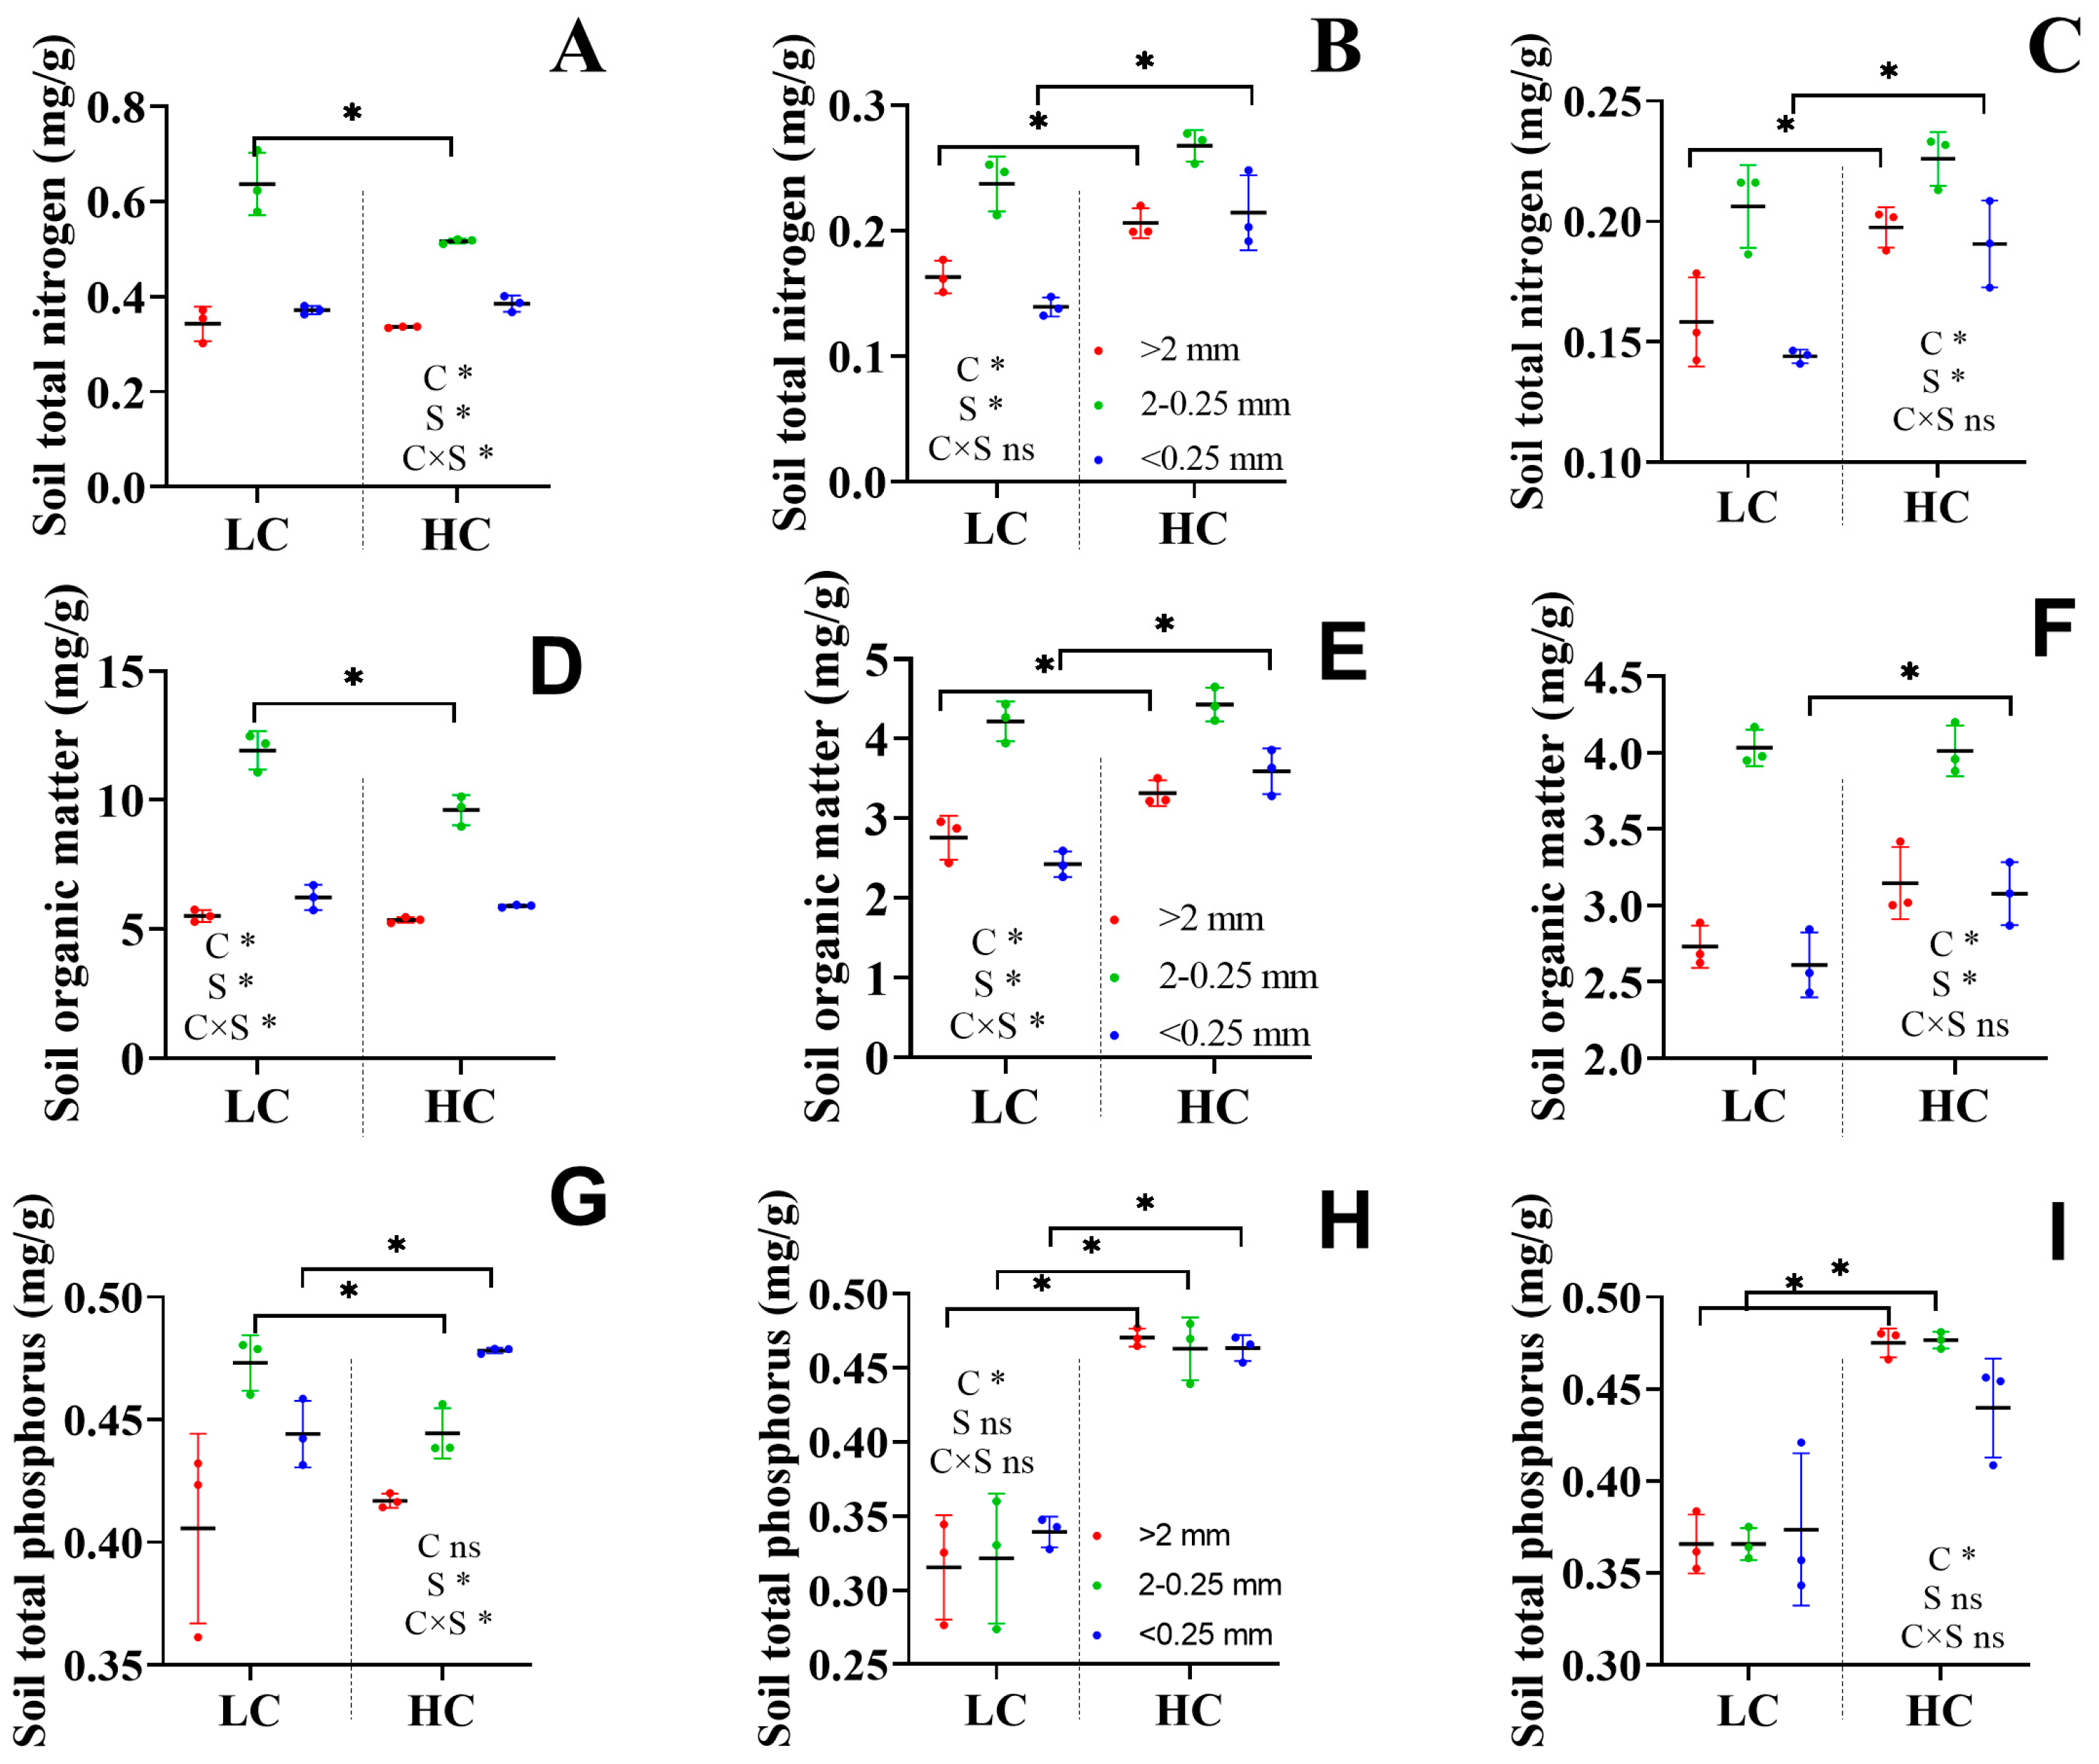
Small macroaggregates contained more soil TN, approximately 13.2–76% higher than the other aggregates at the same soil layer (Figure 6A–C). The high vegetation cover group had a higher soil TN content in the subsoils. Meanwhile, in the topsoils, LC had a higher TN. TN was significantly influenced by soil land cover and aggregate size (p < 0.05). SOM had a trend similar to that of soil TN (Figure 6D–F). Small aggregates contain more soil TP (Figure 6G–I), especially in the topsoil, where aggregate size had a significant influence on soil TP. In the subsoils, land cover had a considerable influence on TP, and HC had a higher TP, regardless of soil depth or aggregate size. Overall, the LC group had higher soil TN in the topsoils, while the HC group had higher TN in the subsoils (10–20 and 20–30 cm, Figure S3A). SOM produced results similar to those of TN (Figure S3B). The TP content was significantly higher in HC at 10–20 cm depth (Figure S3C). These three indices were significantly influenced by the cover, soil depth, and their interactions. Correlation analysis showed that soil shear strength was significantly negatively correlated with SOM content (p < 0.05), and a stable infiltration rate was positively correlated with SOM (p = 0.063, Figure S4). Regarding TP content, it was significantly correlated with soil aggregates, with a positive relationship with large and small macroaggregate content and a negative relationship with microaggregates (p < 0.05, Figure S5).

3.3. Microbial Diversity and Function

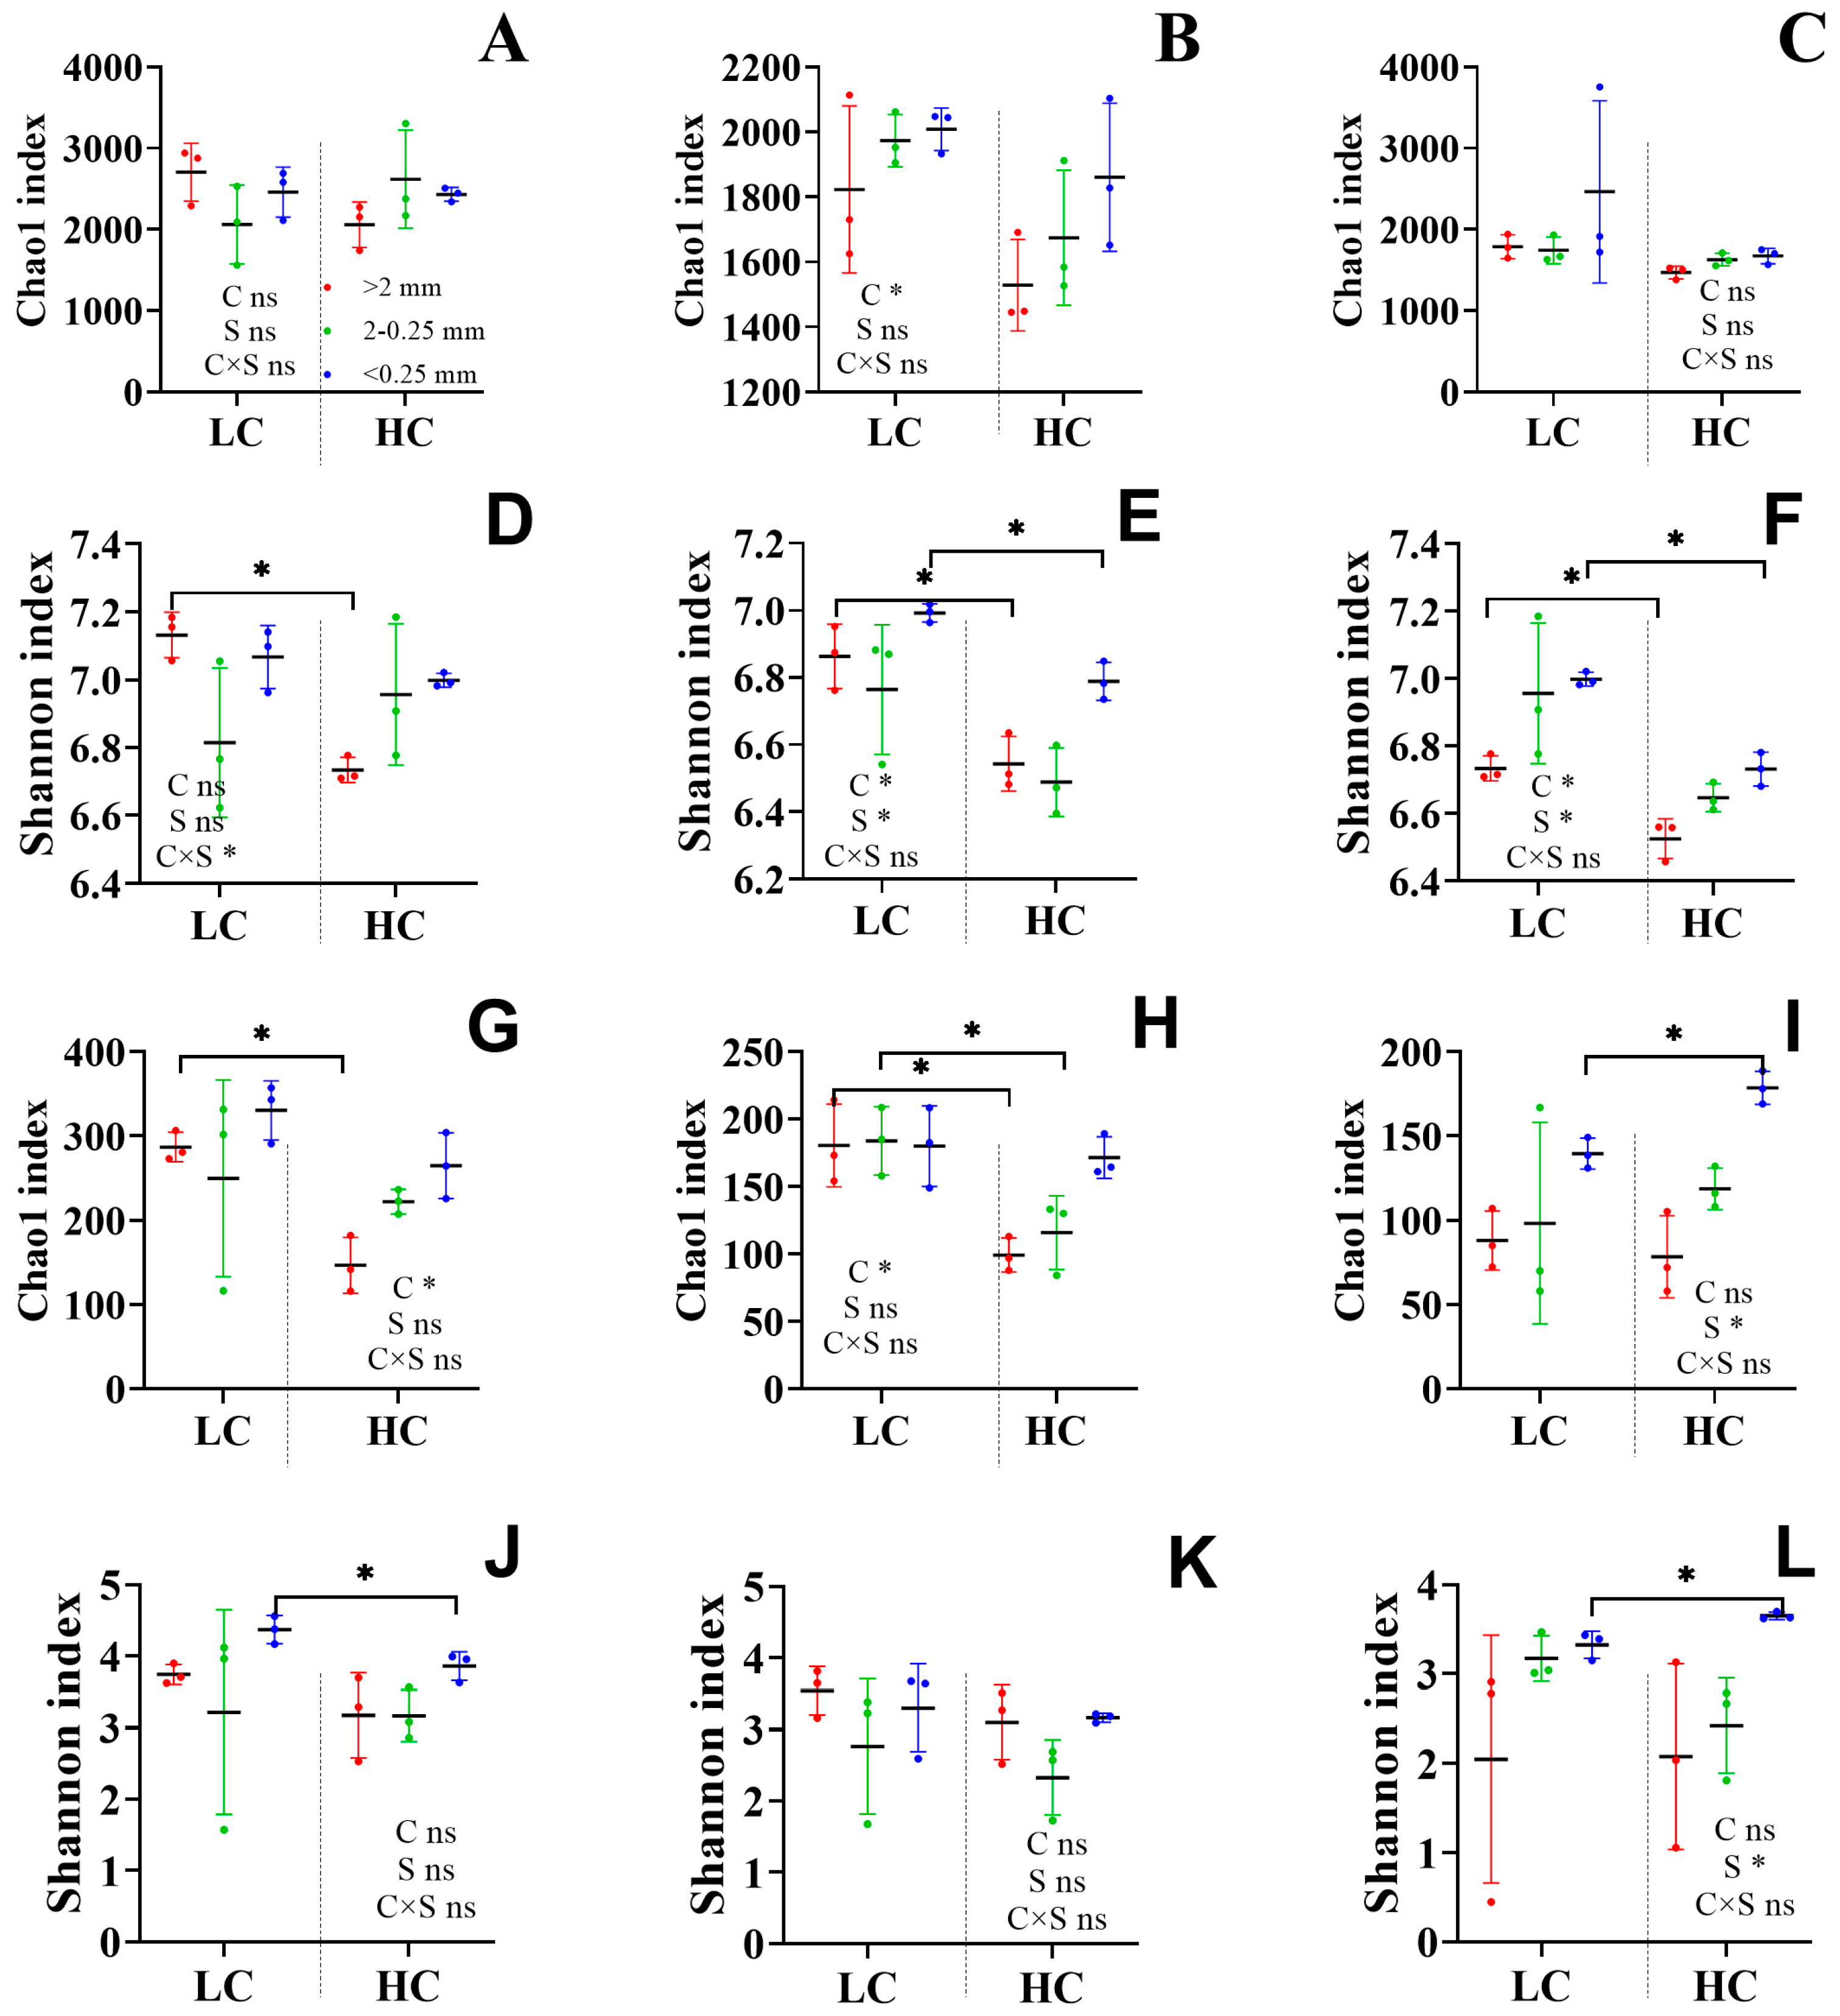
Bacterial diversity was determined using 16s rRNA data, while fungal diversity was analyzed using ITS data. For the bacteria, there was no significant difference in the Chao 1 index, which indicates the number of operational taxonomic units in a community, between the HC and LC groups in 0–10 and 20–30 cm depth soils. Meanwhile, it was higher in LC than in HC in 10–20 cm depth soils, especially in the large and small macroaggregate soils (Figure 7A–C). In 10–20 cm depth soils, large macroaggregates had a lower Chao 1 index. The LC had a higher Shannon index (SI) than the HC, especially in the subsoils (10–20 and 20–30 cm, Figure 7D–F). Large macroaggregates had a lower bacterial SI than the small macroaggregates and microaggregates. Regarding fungal diversity, LC had a higher Chao 1 index at the 0–10 and 10–20 cm depths than HC (Figure 7G,H). However, this trend was not found in the 20–30 cm layer (Figure 7I). As the aggregate size decreased, the Chao 1 index increased (Figure 7G–I). The difference in SI was found in microaggregates at depths of 0–10 and 20–30 cm, in which it was higher and lower at 0–10 cm and 20–30 cm depths in LC than HC, respectively (Figure 7J–L).
The PCoA results showed that PC1 and PC2 divided microbes of different land coverages and different aggregates at the amplicon sequence variant level, respectively (Figure S6). The bacterial and fungal communities at the three soil aggregates were clustered separately, and microbes from the small macroaggregates were separated out more clearly than those of the other aggregate sizes. The explanatory rate of variation from 42.15% to 60.22% (p < 0.05) indicated significant differences between the different bacterial and fungal communities. RB41, Vicinamibacteraceae, Vicinamibacterales, Bacillus, Streptomyces, MND1, and Gemmatimonadaceae were the main bacterial genera in different land plant coverages according to their abundance. MND1, Gemmatimonadaceae, and MB-A2-108 were mainly enriched in HC, while Bacillus, RB41, and Vicinamibacterales were mainly enriched in LC, and their abundance differed regardless of aggregate size and soil depth (Figure S7A). RB41, which functions in decomposing SOM [25], was highly enriched in LC topsoils, especially in macroaggregates. Meanwhile, Vicinamibacteraceae, another bacterium involved in decomposing SOM [26], was highly enriched in HC topsoils, especially in macroaggregates. Bacillus, which decomposes complex organic compounds and fixes nitrogen [27], was enriched in the 10–20 cm depth soil layer of the LC group. Coprinopsis, Sordariales, Panaeolus, and Chaetomiaceae were the main fungal taxa, and their abundances also differed regardless of aggregate size and soil depth (Figure S7B). Panaeolus, which decomposes SOM, was highly enriched in the LC soils (0–10 and 10–20 cm). Sordariales, functioning in decomposing cellulose and lignin, were highly enriched in the 0–10 and 10–20 cm soil depths in both land cover types. Meanwhile, in the 20–30 cm depth layers, they were highly enriched in the LC group.
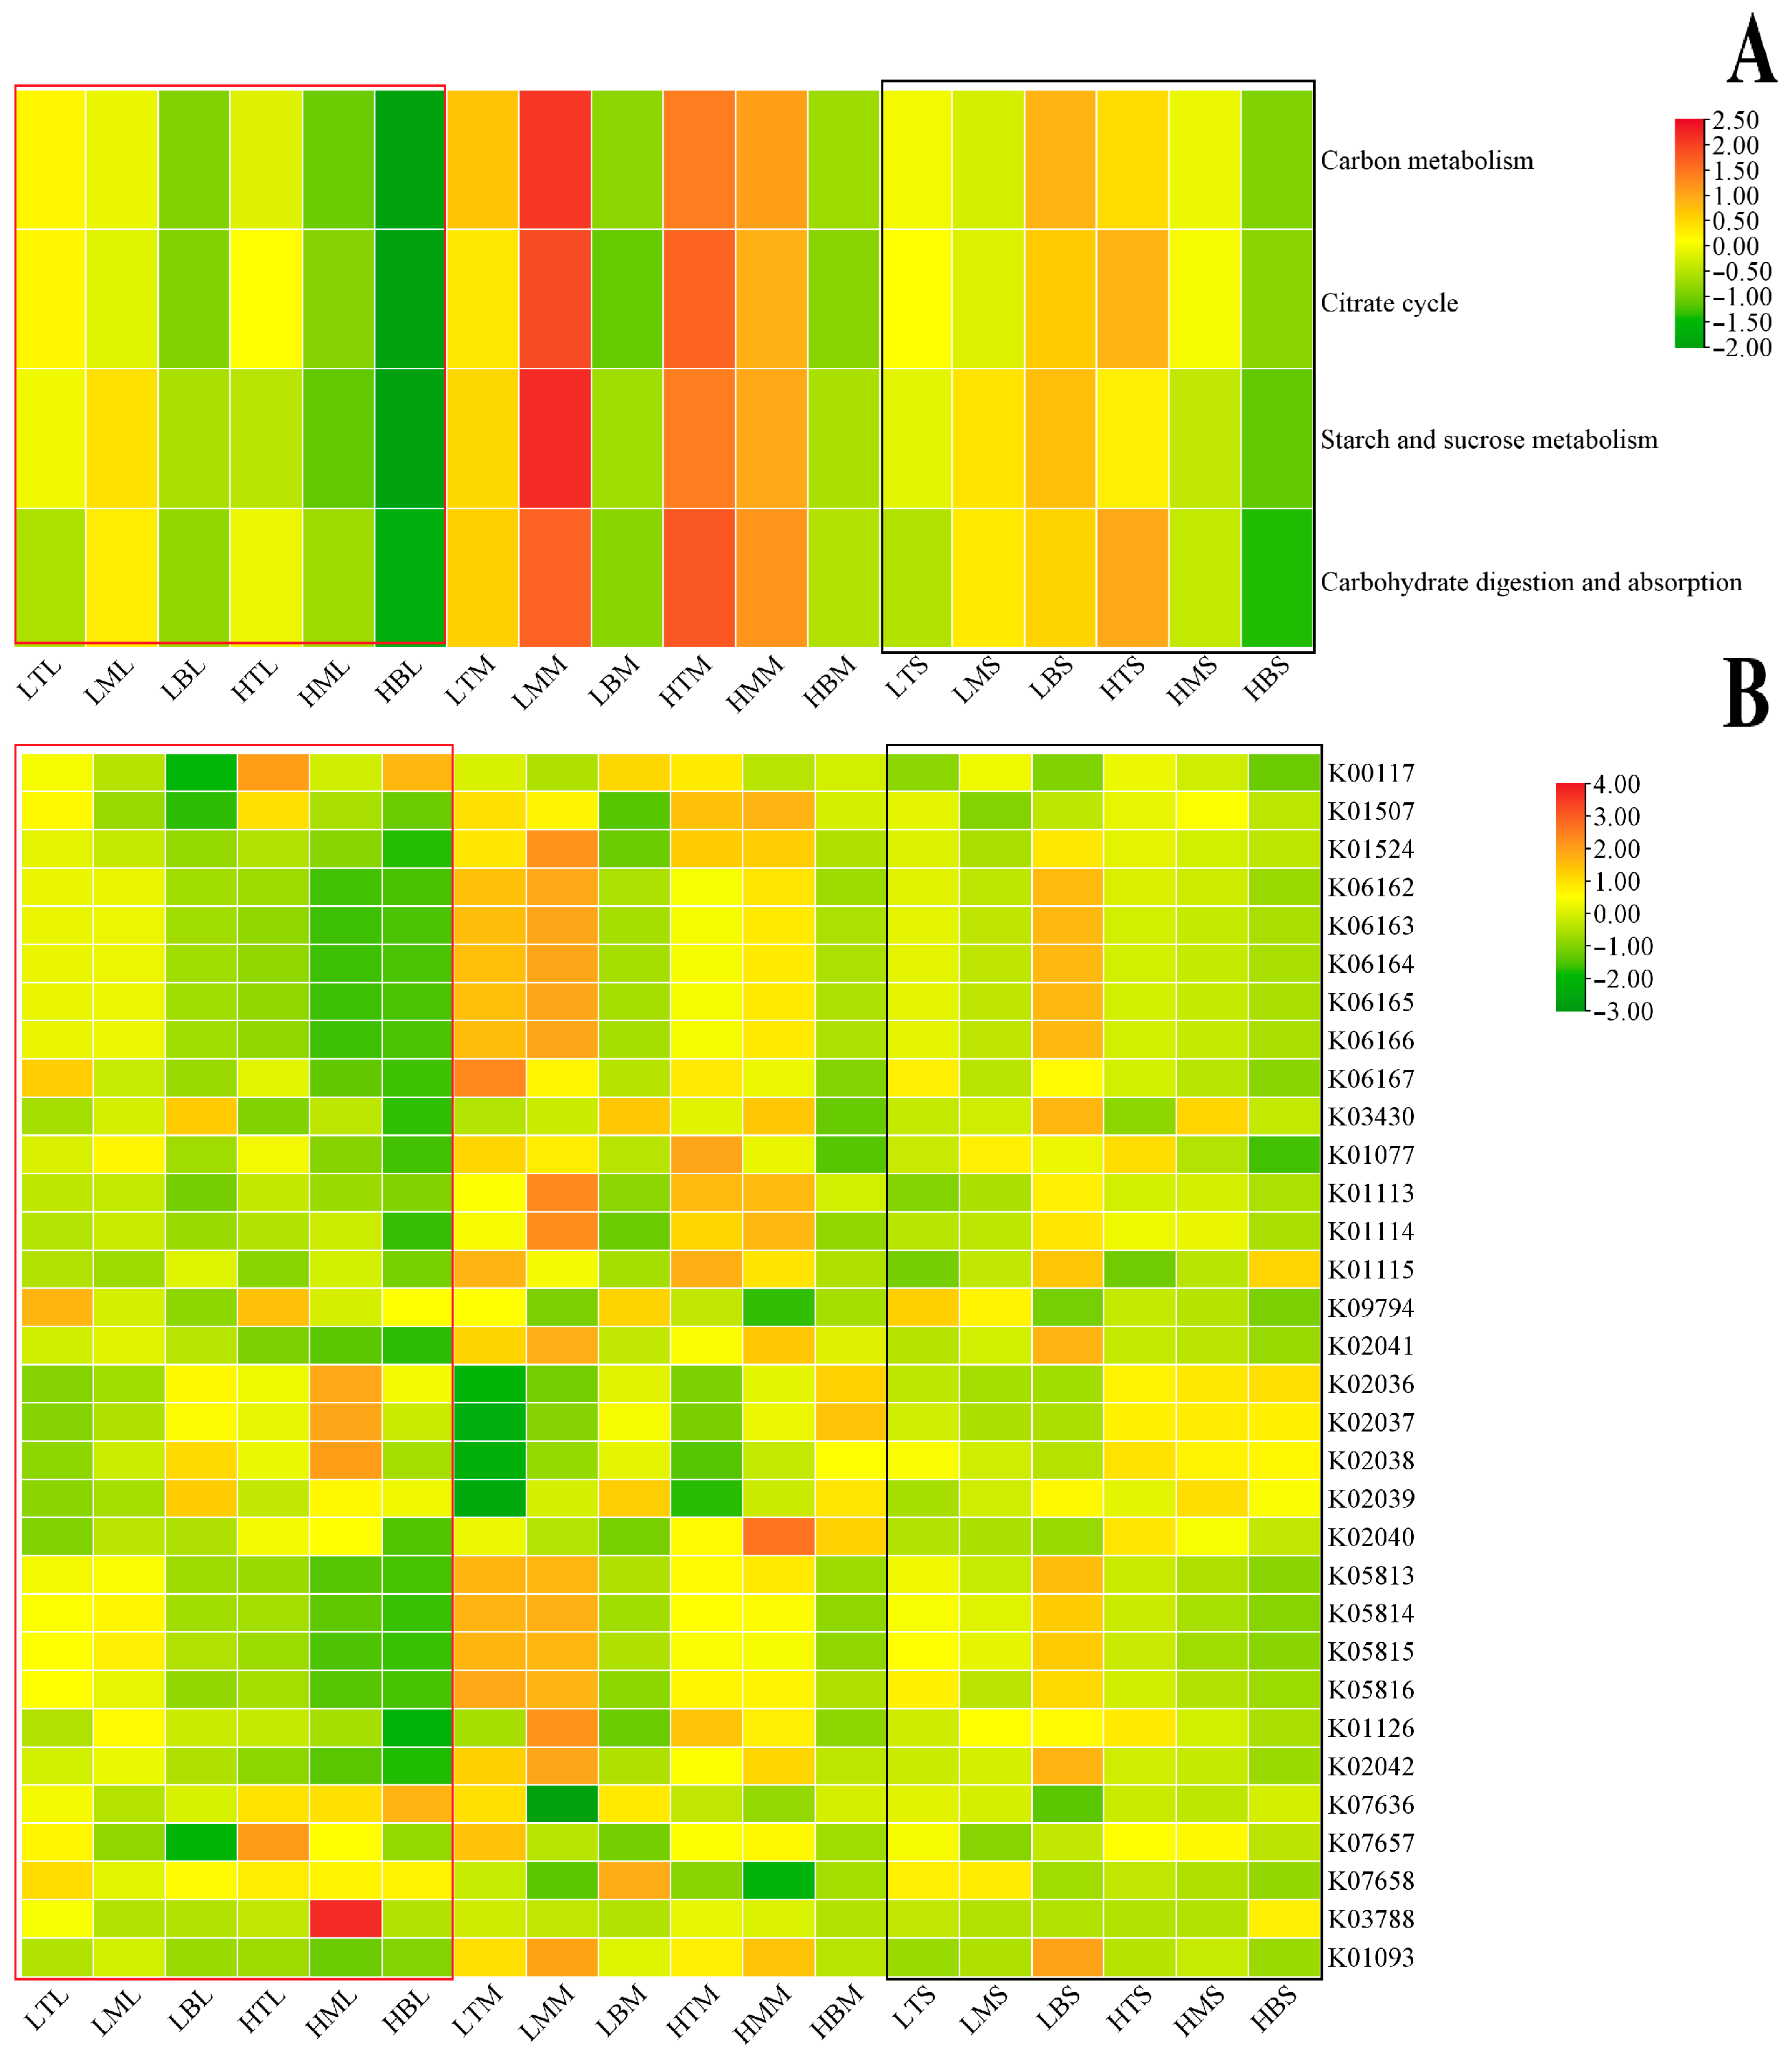
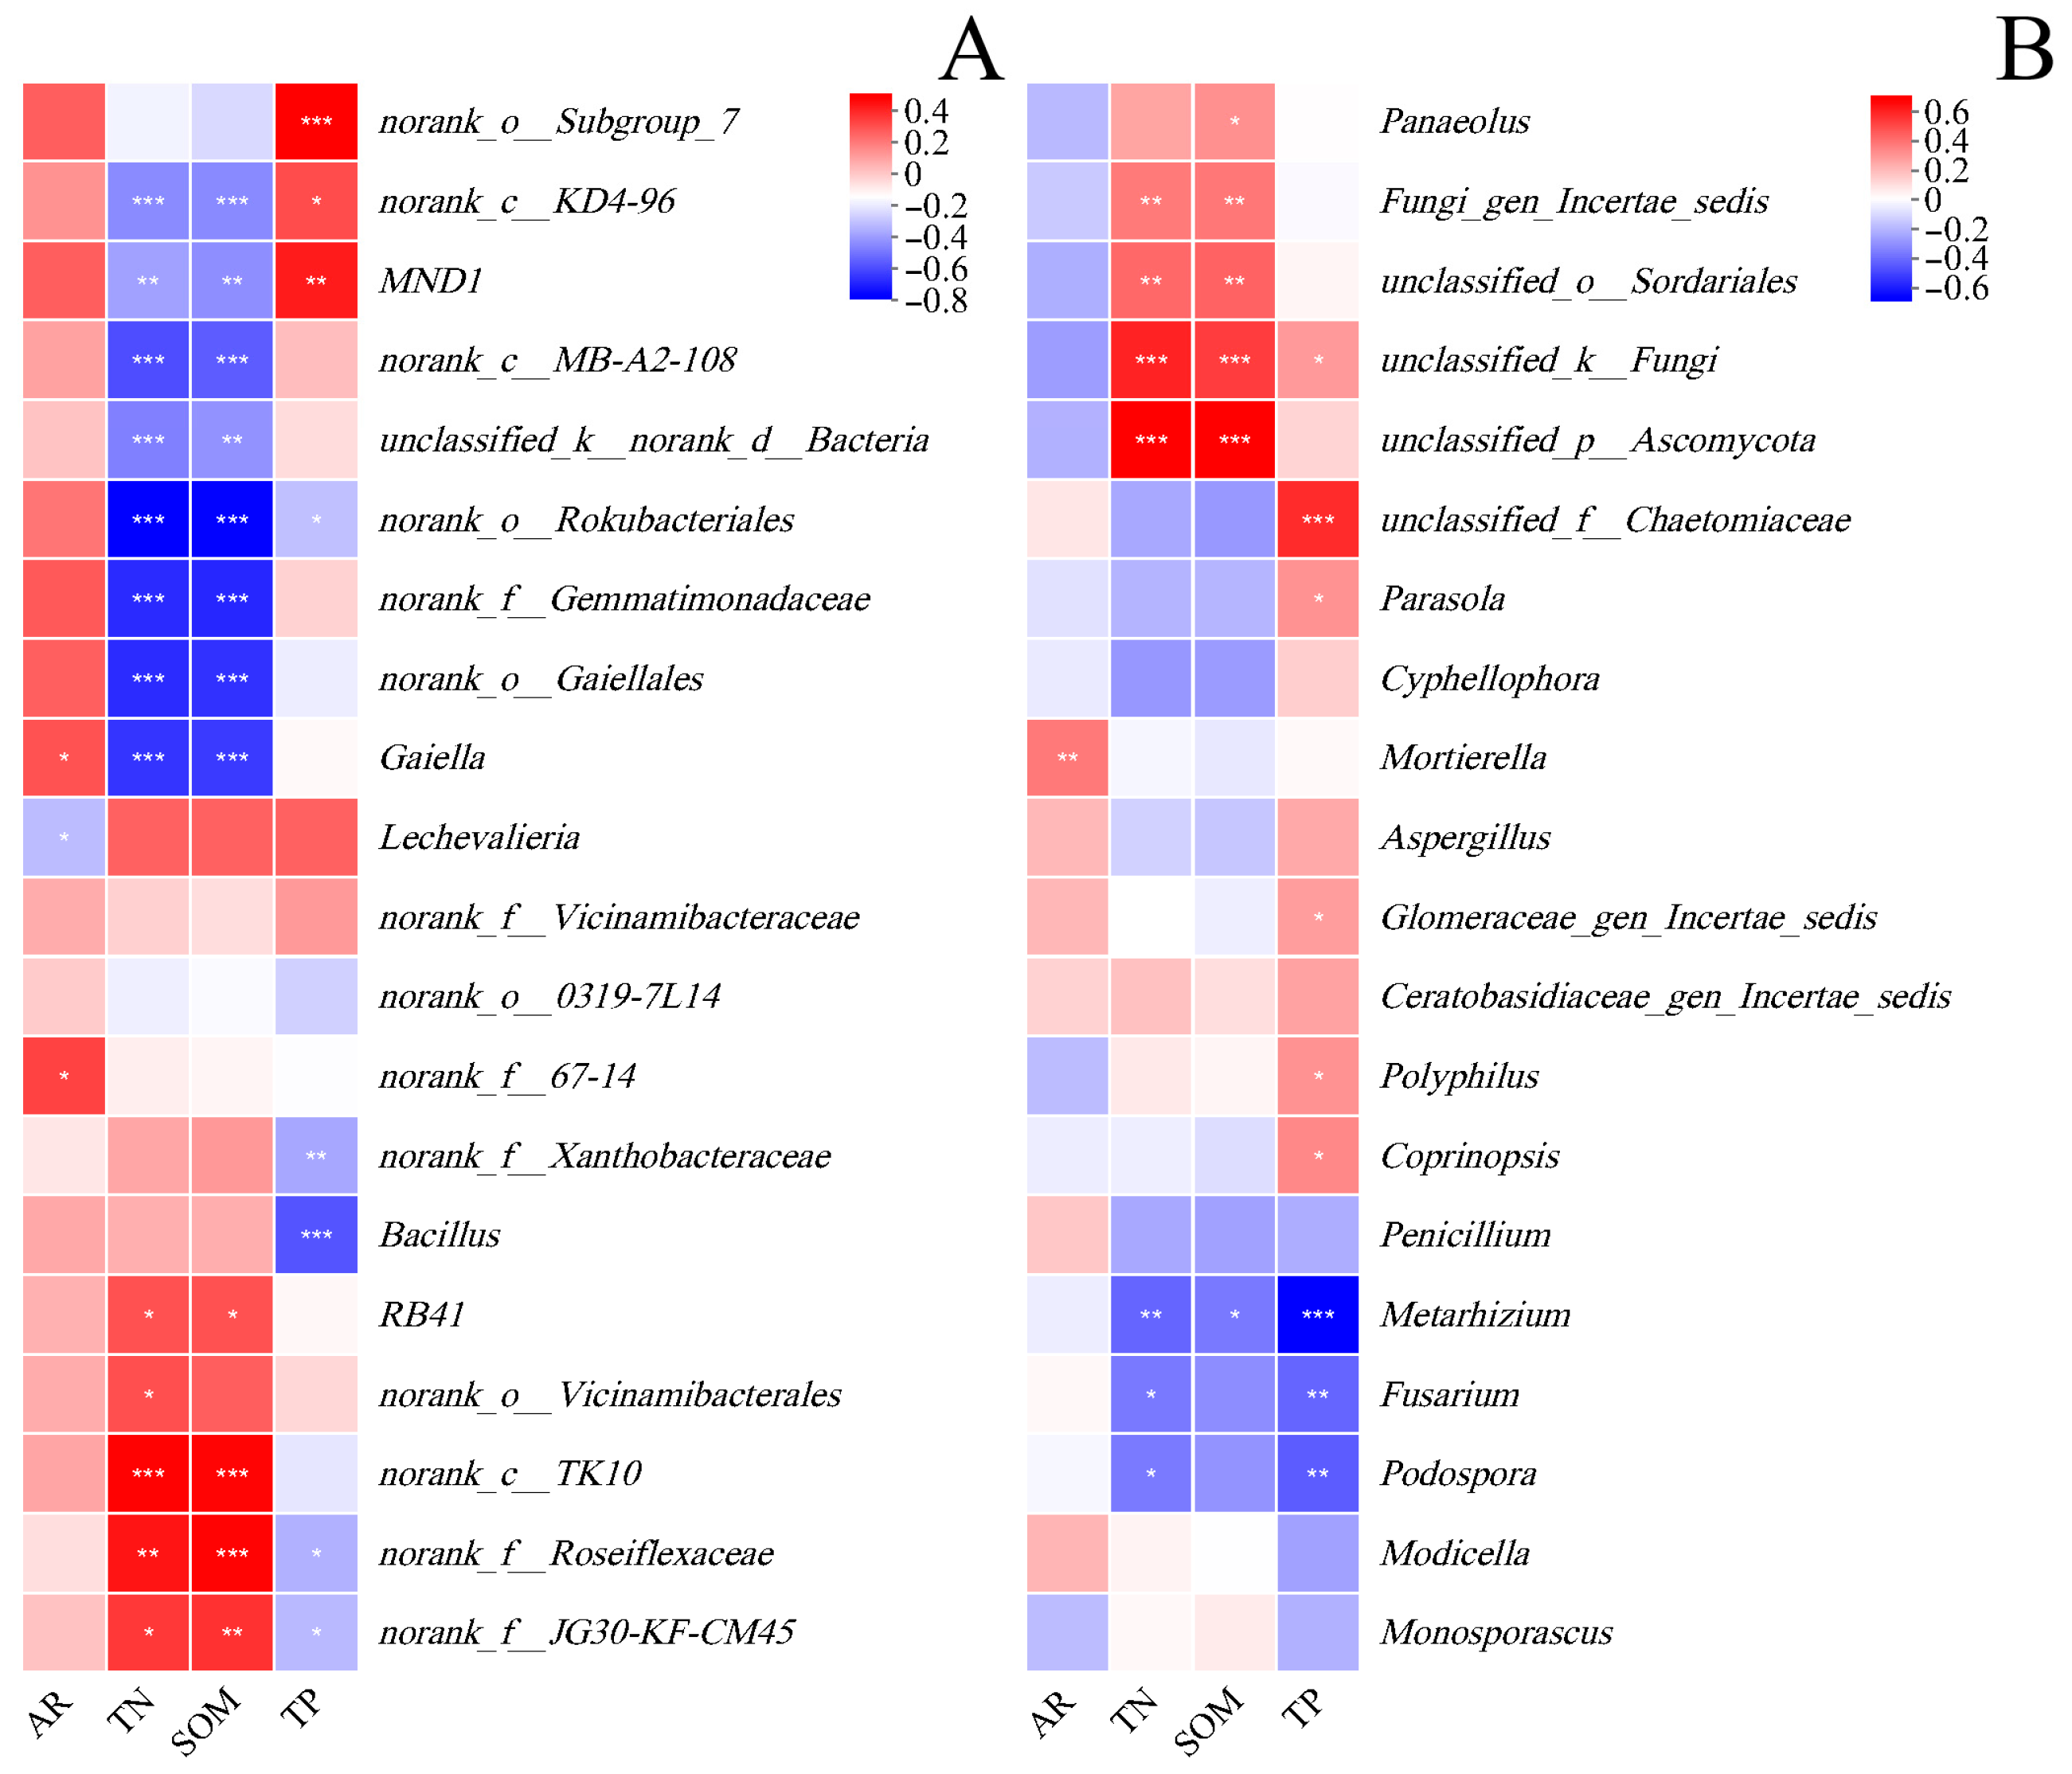
The PICRUSt2 results showed that genes involved in SOM metabolism activity were higher in small macroaggregates, especially at 0–10 and 10–20 cm depths. Genes involved in P metabolism were also upregulated in small macroaggregates (Figure 8 and Figure S8). Considering soil properties, e.g., macroaggregates, TN, TP, SOM, and microbes, in the analysis process, the results showed that bacteria, like MND1 and KD4-96, were negatively correlated with TN and SOM but positively with TP. Bacillus showed a negative correlation with TP, and some bacteria, e.g., 67-14 and Giella, influenced aggregates (Figure 9A and Figure S9). Among fungi, Mortierella affected soil aggregates, and Sordaroales and Metarhizium influenced soil TN, SOM, and TP. Regarding large macroaggregates, microbes, including bacteria and fungi, showed a similar influence on aggregate ratio and TP content (Figure 9B); on the other hand, regarding microaggregates, the positive or negative correlations between aggregates and TP were opposite. The microbes produced the same influence on SOM and TN. Integrating the soil stability index and soil nutrients in the PCA, the results showed that PC1 and PC2 explained 60.69% and 64.18% of the variation in 16S rRNA and ITS, respectively (Figure 10). SOM was the main nutrient factor influencing microbes, while TP was the one influencing macroaggregates and soil shear strength (Figure 10 and Table S1). Large macroaggregates were significantly affected by TP (Figure S9 and Table S1).

4. Discussion

The present study showed that the soil shear strength, MWD, GMD, and soil infiltration rate were significantly influenced by aggregates, especially macroaggregates. The results showed that macroaggregates enhanced soil resistance to erosion. A deeper level analysis indicated that aggregate size affected the SOM and soil TP content, as macro- and microaggregates had lower SOM and TP content than small macroaggregates. Microbial diversity and PICRUSt2 indicated that aggregate size had a significant influence on microbes and that soil from small macroaggregates had higher enzymatic upregulation related to the decomposition of organic matter and metabolism of P. These results confirmed our original hypothesis that different land coverages of plants produce various aggregates, among which microbes and soil nutrients play vital roles.

4.1. Land Cover Increased the Formation of Macroaggregates but Not Small Macroaggregates

Soil aggregates entail complex hierarchical processes of soil particle organization, in which transient, temporary, and persistent binders lead to the formation of microaggregates and macroaggregates [28]. With vegetation recovery increasing the land coverage of plants, which produce more litter and roots, the quantity and quality of litter and root inputs promote the formation and stability of aggregates [29,30]. The results showed that as the land cover increased, the large-macroaggregate rate increased. Meanwhile, the small macroaggregate rate was unclear, except for in the 20–30 cm depth soils. In aggregate formation, SOM is the main factor controlling the soil particle cementation that forms aggregates [31]. In our study, a greater degree of vegetation cover increased the SOM content, especially in microaggregates and small macroaggregates. Meanwhile, SOM content in macroaggregates was lower than that in the other two aggregates, which was similar to a previous study [32]. As in previous studies [33,34], the higher SOM content in the microaggregates contributed to macroaggregate formation. However, higher SOM content attracted more microbes that functioned in the degradation of organic matter, for example, RB41, Vicinamibacteraceae, and Sordariales, especially in small macroaggregates and macroaggregates (Figure S7). During macroaggregate formation, the microbes started degrading organic matter. As the macroaggregates formed, the SOM content decreased. With the loss of SOM, macroaggregates begin to break down to form several microaggregates [35].
Macroaggregates can significantly reduce wind and water erosion rates compared to no-structure soils containing weaker aggregates [36,37,38]. With an increased rate of macroaggregates, the MWD and GMD increased, and the soil shear strength and soil stable infiltration rate improved significantly. Increased SOC content input through increased litter increased MWD, and GMD enhanced aggregate stability [39,40]. Here, higher vegetation cover could improve litter and root input into soils, resulting in a higher SOM content, which improves soil aggregate stability [41]. A higher macroaggregate rate improves soil shear strength and stable infiltration rate [42,43]. The stable infiltration rate and soil shear strength were significantly correlated with SOM content and macroaggregate ratio, which is consistent with previous studies. The PCA showed that macroaggregates were significantly correlated with TP (Figure 10), and the following results confirmed that TP influenced the abundance of many microbes. In fact, macroaggregates determined the soil TP content, as a previous study found that poplar soil reduced TP mainly in macroaggregates [44]. In the present study, the main microbes in macroaggregates exhibited the same correlation with TP and the macroaggregate ratio (Figure S9A,D), suggesting that microbes drove the reduction in TP in macroaggregates, and the low TP content may result in a low macroaggregate ratio in LC. More microbes in macroaggregates increased the available P consumption and the conversion of TP to available P, inducing TP reduction [45], as the low TP content in topsoils was comparable with that of subsoils, especially in HC. We found that higher vegetation covers enhanced SOM and TP content, resulting in a higher ratio of macroaggregates, improved soil shear strength, and decreased soil stable infiltration rate.

4.2. Variation in SOM Content of Different Aggregate Sizes Changes Soil Microbial Diversity and Taxa

Soil stability and aggregates are important drivers of soil fertility and microbial diversity, especially in areas with fragile ecological environments and susceptibility to erosion. Soil aggregates positively regulate soil multifunctionality [15], microbial ecological adaptation, and community assembly in agricultural soils due to the adaptation of microbes to nutrient variables [12,46]. The TN produced similar results to SOM, which may be because SOM and TN are more closely related. One reason is that they may be replenished through litter degradation, and nitrogen can be replenished through atmospheric deposition. The Chao 1 and Shannon indices differed at different soil depths and aggregate size levels, and the enzyme function prediction indicated that the small macroaggregates contained more enzymes involved in organic matter degradation (Figure 7 and Figure 8). Although the microbial diversity of the small macroaggregates was not the highest among the three aggregate sizes, the higher enzyme accumulation associated with higher SOM content indicated the important roles of SOM in regulating microbes. Macroaggregates change their microbial communities to produce organic matter [47].
Under field conditions, the macroaggregate and microbial composition explained more than 82% of the variation in SOM accumulation [48]. This highlighted the importance of the aggregate and microbes and the mutual feedback influence between microbes and SOM [48]. The interactions among microbes, aggregates, and SOM are complex. With different research aims, different results have been obtained. For example, in studying soil carbon (C) sequencing, it was found that macroaggregates protect SOC and increase microbial diversity [16]. In other studies, SOM was found to have a dominant effect on aggregate stability [10,12,49], and the microaggregates contained more SOM per mass than macroaggregates [13]. Here, the SOM content increased in microaggregates and reached the highest SOM content in the aggregate medium, indicating that SOM accumulation could function in the process of aggregate formation. SOM affected aggregate formation, and a higher number of microbes involved in SOM degradation contributed to aggregate fragmentation. Subsequently, the macroaggregate broke into small macroaggregates.

4.3. Aggregates Affect Soil Microbes

Microbes within macroaggregates can act as biological indicators useful for soil management. Macroaggregates provide spatially heterogeneous microenvironments for the soil microbiome and ecological processes [12]. Microbes are susceptible to nutrient changes; it has been shown that they are significantly affected by soil nutrients, especially SOM. Soil microorganisms can modify their environments by altering the properties of the soil in their surroundings or building mineral structures [50]. Therefore, microorganism–soil interactions can generate feedback loops. With an increase in SOM, soil bacterial and fungal diversity increase, leading to increased respiration of soil aggregates. This could be the result of increased microbes involved in SOM degradation [51]. Here, we found that under different soil depth layers and soil aggregates, the main microbial taxa were different (Figure S7). Regarding microbial diversity, no significant difference was found in the bacterial Chao 1 index, whereas land cover affected fungal diversity. The aggregate size had almost no significant effect on microbial diversity. The main differences were in the microbial species and enzyme functions of the microorganisms. Land use has less influence on soil microbial communities [52]. Microbial decomposition and respiration (catabolism) are responsible for a significant proportion of the annual carbon dioxide emissions from SOM to the atmosphere [53]. The relatively low microbial diversity in the macroaggregates could be a result of the low SOM content, which was affected by soil aggregates.

5. Conclusions

Soil aggregates are important for maintaining soil stability and improving soil erosion resistance. In this study, we found that different soil and vegetation cover density resulted in significant differences in the soil aggregate size ratio, and high land vegetation cover induced high macroaggregate content, which confirmed our hypothesis that different land coverages of plants produce various aggregates. The large macroaggregate ratio contributed to higher WMD and GMD, indicating higher soil aggregate stability. Large macroaggregates also contribute to higher soil shear strength and soil water content and a stable infiltration rate. Large macroaggregates had a lower SOM content than small macroaggregates. The aggregates influenced soil microbial diversity, especially microbial species and functions, and the large- and small-macroaggregate soils contained more microbes involved in the SOM degradation of microaggregates. This could be because the increased SOM in the aggregates increased macroaggregate formation. Meanwhile, they attracted more microorganisms related to organic matter degradation, which accelerated SOM degradation and induced macroaggregate disintegration. TP functioned directly in macroaggregate formation as the TP content controlled the macroaggregate ratio, and they were regulated by the same microbes. However, the mechanism underlying this process remains to be elucidated. As SOM could be supplemented through plant litter, P addition should be considered in the future. Our results contribute to a better understanding of soil aggregate stability factors and indicate that SOM and TP influence microbe functioning in aggregate size dynamics.

Supplementary Materials

The following supporting information can be downloaded at: https://www.mdpi.com/article/10.3390/agronomy15082011/s1, Figure S1: The diagram of the apparatus used for stable soil infiltration rate; Figure S2: Correlation between soil shear strength, soil water content and soil bulk density and large macroaggregate (A), small macroaggregate (B) and microaggregate(C) (n = 18); Figure S3: Response of total nitrogen, total phosphorus, soil organic matter to soil depth and land coverage. The C, D and C × D indicates the influence of coverage, depth and interaction of them, respectively. * indicated the significant difference at 0.05 level; Figure S4: Correlation between soil organic matter content and soil stable infiltration rate and soil shear strength, n = 18; Figure S5: Correlation between soil organic matter content, total nitrogen and total phosphorus and aggregate (A, large macroaggregate; B, small macroaggregate; C, microaggregate, n = 18); Figure S6: PCoA results of 16S (A, top soils 0–10 cm; B 10–20 cm; and C 20–30 cm) and ITS (D, top soils 0–10 cm; E 10–20 cm; and F 20–30 cm); Figure S7: A dendrogram showing main microbes in different soils (A, 16S; B, ITS); Figure S8: PICRUSt2 results of ITS. LTS… and HBL, the third letter S, M and L indicates microaggregate, small macroaggregate and large macroaggregate, respectively. The second letter T, M and B indicates 0–10, 10–20 and 20–30 cm soil depth. And the first letter L and H indicate low land coverage and high land coverage; Figure S9: Correlation between soil properties and main microbes (Top 20 of abundance, n = 18). (A–C) showed 16S and (D–F) showed ITS results; Table S1: Pearson correlation matrix of soil properties.

Author Contributions

Conceptualization, N.Z. and P.C.; methodology, N.Z.; formal analysis, P.C.; investigation, N.Z.; writing—original draft preparation, J.Y. and N.Z.; writing—review and editing, Z.W.; supervision, J.Y.; project administration, J.Y.; funding acquisition, J.Y. All authors have read and agreed to the published version of the manuscript.

Funding

This research was funded by National Natural Science Foundation of China (grant no. 42067016), the Key Research and Development Program of Shaanxi Province (grant no. 2023-ZDLSF-28), The Youth Project of the Natural Science Basic Research Program of Shaanxi Province, China (grant no. 2020JQ-264), Key Scientific Research Program of Shaanxi Provincial Department of Education (grant no. 23JS066), and Yulin University Graduate Innovation Foundation (grant no. 2024YLYCX18 and 2024YLYCX16).

Data Availability Statement

The raw sequence data reported in this paper have been deposited in the Genome Sequence Archive (Genomics, Proteomics & Bioinformatics 2021) in National Genomics Data Center (Nucleic Acids Res 2022), China National Center for Bioinformation/Beijing Institute of Genomics, Chinese Academy of Sciences (GSA: CRA027904) that are publicly accessible at https://ngdc.cncb.ac.cn/gsa (accessed on 22 July 2025).

Acknowledgments

We are profoundly grateful to the two anonymous reviewers and the journal editor for their invaluable contributions.

Conflicts of Interest

The authors declare no conflicts of interest.

References

  1. Wang, G.; Zhang, Z.; Henderson, M.; Chen, M.; Dou, Z.; Zhou, W.; Huang, W.; Liu, B. Effects of terracing on soil aggregate stability and erodibility in sloped farmland in black soil (Mollisols) region of China. Agriculture 2024, 14, 1534. [Google Scholar] [CrossRef]
  2. Borrelli, P.; Robinson, D.A.; Panagos, P.; Lugato, E.; Yang, J.E.; Alewell, C.; Wuepper, D.; Montanarella, L.; Ballabio, C. Land use and climate change impacts on global soil erosion by water (2015–2070). Proc. Natl. Acad. Sci. USA 2020, 117, 21994–22001. [Google Scholar] [CrossRef]
  3. Li, R.; Hu, W.; Jia, Z.; Liu, H.; Zhang, C.; Huang, B.; Yang, S.; Zhao, Y.; Zhao, Y.; Shukla, M.K.; et al. Soil degradation: A global threat to sustainable use of black soils. Pedosphere 2025, 35, 264–279. [Google Scholar] [CrossRef]
  4. Pacheco, F.A.L.; Sanches Fernandes, L.F.; Valle Junior, R.F.; Valera, C.A.; Pissarra, T.C.T. Land degradation: Multiple environmental consequences and routes to neutrality. Curr. Opin. Environ. Sci. Health 2018, 5, 79–86. [Google Scholar] [CrossRef]
  5. Song, J.; Wan, S.; Zhang, K.; Hong, S.; Xia, J.; Piao, S.; Wang, Y.P.; Chen, J.; Hui, D.; Luo, Y.; et al. Ecological restoration enhances dryland carbon stock by reducing surface soil carbon loss due to wind erosion. Proc. Natl. Acad. Sci. USA 2024, 121, e2416281121. [Google Scholar] [CrossRef]
  6. Wu, Q.; Jiang, X.; Shi, X.; Zhang, Y.; Liu, Y.; Cai, W. Spatiotemporal evolution characteristics of soil erosion and its driving mechanisms—A case Study: Loess Plateau, China. Catena 2024, 242, 108075. [Google Scholar] [CrossRef]
  7. Torri, D.; Ciampalini, R.; Gil, P.A. The role of soil aggregates in soil erosion processes. In Modelling Soil Erosion by Water; Springer: Berlin/Heidelberg, Germany, 1998. [Google Scholar]
  8. Ma, R.; Hu, F.; Xu, C.; Liu, J.; Yu, Z.; Liu, G.; Zhao, S.; Zheng, F. Vegetation restoration enhances soil erosion resistance through decreasing the net repulsive force between soil particles. Catena 2023, 226, 107085. [Google Scholar] [CrossRef]
  9. Six, J.; Bossuyt, H.; Degryze, S.; Denef, K. A history of research on the link between (micro)aggregates, soil biota, and soil organic matter dynamics. Soil Till. Res. 2004, 79, 7–31. [Google Scholar] [CrossRef]
  10. Mustafa, A.; Minggang, X.; Ali Shah, S.A.; Abrar, M.M.; Nan, S.; Baoren, W.; Zejiang, C.; Saeed, Q.; Naveed, M.; Mehmood, K.; et al. Soil aggregation and soil aggregate stability regulate organic carbon and nitrogen storage in a red soil of southern China. J. Environ. Manag. 2020, 270, 110894. [Google Scholar] [CrossRef] [PubMed]
  11. Zhu, X.; Liu, W.; Yuan, X.; Chen, C.; Zhu, K.; Zhang, W.; Yang, B. Aggregate stability and size distribution regulate rainsplash erosion: Evidence from a humid tropical soil under different land-use regimes. Geoderma 2022, 420, 115880. [Google Scholar] [CrossRef]
  12. Liao, H.; Hao, X.; Zhang, Y.; Qin, F.; Xu, M.; Cai, P.; Chen, W.; Huang, Q. Soil aggregate modulates microbial ecological adaptations and community assemblies in agricultural soils. Soil Biol. Biochem. 2022, 172, 108769. [Google Scholar] [CrossRef]
  13. Jesús Melej, M.; Acevedo, S.E.; Contreras, C.P.; Giraldo, C.V.; Maurer, T.; Calderón, F.J.; Bonilla, C.A. Changes in macroaggregate stability as a result of wetting/drying cycles of soils with different organic matter and clay contents. Geoderma 2024, 448, 116965. [Google Scholar] [CrossRef]
  14. Totsche, K.U.; Amelung, W.; Gerzabek, M.H.; Guggenberger, G.; Klumpp, E.; Knief, C.; Lehndorff, E.; Mikutta, R.; Peth, S.; Prechtel, A.; et al. Microaggregates in soils. J. Plant Nut. Soil Sci. 2018, 181, 104–136. [Google Scholar] [CrossRef]
  15. Han, S.; Delgado-Baquerizo, M.; Luo, X.; Liu, Y.; Van Nostrand, J.D.; Chen, W.; Zhou, J.; Huang, Q. Soil aggregate size-dependent relationships between microbial functional diversity and multifunctionality. Soil Biol. Biochem. 2021, 154, 108143. [Google Scholar] [CrossRef]
  16. Tong, L.; Zhu, L.; Lv, Y.; Zhu, K.; Liu, X.; Zhao, R. Response of organic carbon fractions and microbial community composition of soil aggregates to long-term fertilizations in an intensive greenhouse system. J. Soils Sed. 2020, 20, 641–652. [Google Scholar] [CrossRef]
  17. Chen, X.; Han, X.; You, M.; Yan, J.; Lu, X.; Horwath, W.R.; Zou, W. Soil macroaggregates and organic-matter content regulate microbial communities and enzymatic activity in a Chinese Mollisol. J. Integr. Agric. 2019, 18, 2605–2618. [Google Scholar] [CrossRef]
  18. Zhang, W.; Munkholm, L.J.; Liu, X.; An, T.; Xu, Y.; Ge, Z.; Xie, N.; Li, A.; Dong, Y.; Peng, C.; et al. Soil aggregate microstructure and microbial community structure mediate soil organic carbon accumulation: Evidence from one-year field experiment. Geoderma 2023, 430, 116324. [Google Scholar] [CrossRef]
  19. Ackerman, D.; Millet, D.B.; Chen, X. Global estimates of inorganic nitrogen deposition across four decades. Glob. Biogeochem. Cycl. 2019, 33, 100–107. [Google Scholar] [CrossRef]
  20. Zhang, W.; Wang, R.; Li, Q.; Liu, J.; Ma, X.; Xu, W.; Tang, A.; Collett, J.L.; Li, H.; Liu, X. Spatiotemporal variations of nitrogen and phosphorus deposition across China. Sci. Total Environ. 2022, 830, 154740. [Google Scholar]
  21. Han, X.; Xiao, J.; Wang, L.; Tian, S.; Liang, T.; Liu, Y. Identification of areas vulnerable to soil erosion and risk assessment of phosphorus transport in a typical watershed in the Loess Plateau. Sci. Total Environ. 2021, 758, 143661. [Google Scholar] [CrossRef]
  22. Gan, F.; Xia, Y.; Li, W.; Tan, X.; Jiang, L.; Dai, Q.; Yan, Y.; Fan, Y.; Pu, J. Long-term abandoned farmland enhanced soil aggregate-associated total carbon, nitrogen, and phosphorus storage under different rocky desertification grades in a karst trough valley. Catena 2025, 259, 109326. [Google Scholar] [CrossRef]
  23. Yang, W.; Peng, X.; Dai, Q.; Li, C.; Xu, S.; Liu, T. Storage infiltration of rock-soil interface soil on rock surface flow in the rocky desertification area. Geoderma 2023, 435, 116512. [Google Scholar] [CrossRef]
  24. Schloss, P.D.; Westcott, S.L.; Ryabin, T.; Hall, J.R.; Hartmann, M.; Hollister, E.B.; Lesniewski, R.A.; Oakley, B.B.; Parks, D.H.; Robinson, C.J.; et al. Introducing mothur: Open-source, platform-independent, community-supported software for describing and comparing microbial communities. Appl. Environ. Microbiol. 2009, 75, 7537–7541. [Google Scholar] [CrossRef]
  25. Lin, L.; Olga, V.T.; Jason, M.U.; Liu, S.; Liu, Y.; Guo, L.; Wei, G.; Chen, C. Pristine and sulfidized zinc oxide nanoparticles promote the release and decomposition of organic carbon in the Legume rhizosphere. Environ. Sci. Technol. 2023, 57, 8943–8953. [Google Scholar] [CrossRef]
  26. Cheng, L.; Wang, L.; Wang, X.; Ou, Y.; Liu, H.; Hou, X.; Yan, L.; Li, X. The various effect of cow manure compost on the degradation of imazethapyr in different soil types. Chemosphere 2023, 337, 139325. [Google Scholar] [CrossRef] [PubMed]
  27. Jain, S.; Varma, A.; Choudhary, D.K. Perspectives on nitrogen-fixing bacillus species. In Soil Nitrogen Ecology; Soil Biology; Cruz, C., Vishwakarma, K., Choudhary, D.K., Varma, A., Eds.; Springer: Cham, Switzerland, 2021; Volume 62. [Google Scholar] [CrossRef]
  28. Xiao, L.; Zhang, W.; Hu, P.; Xiao, D.; Yang, R.; Ye, Y.; Wang, K. The formation of large macroaggregates induces soil organic carbon sequestration in short-term cropland restoration in a typical karst area. Sci. Total Environ. 2021, 801, 149588. [Google Scholar] [CrossRef]
  29. Feng, J.; Wang, C.; Gao, J.; Ma, H.; Li, Z.; Hao, Y.; Qiu, X.; Ru, J.; Song, J.; Wan, S. Changes in plant litter and root carbon inputs alter soil respiration in three different forests of a climate transitional region. Agric. Forest Meteorol. 2024, 358, 110212. [Google Scholar] [CrossRef]
  30. Pucetaite, M.; Persson, P.; Parker, J.; Johansson, U.; Hammer, E.C. Visualization of soil aggregate structures provides insights into their formation mechanisms induced by litter inputs. Soil Biol. Biochem. 2025, 202, 109686. [Google Scholar] [CrossRef]
  31. Even, R.J.; Francesca Cotrufo, M. The ability of soils to aggregate, more than the state of aggregation, promotes protected soil organic matter formation. Geoderma 2024, 442, 116760. [Google Scholar] [CrossRef]
  32. Cui, H.; Zhu, H.; Shutes, B.; Rousseau, A.N.; Feng, W.D.; Hou, S.N.; Ou, Y.; Yan, B.X. Soil aggregate-driven changes in nutrient redistribution and microbial communities after 10-year organic fertilization. J. Environ. Manag. 2023, 348, 119306. [Google Scholar] [CrossRef] [PubMed]
  33. Wang, J.; Yang, W.; Yu, B.; Li, Z.; Cai, C.; Ma, R. Estimating the influence of related soil properties on macro- and micro-aggregate stability in ultisols of south-central China. Catena 2016, 137, 545–553. [Google Scholar] [CrossRef]
  34. Zhao, Z.; Mao, Y.; Gao, S.; Lu, C.; Pan, C.; Li, X. Organic carbon accumulation and aggregate formation in soils under organic and inorganic fertilizer management practices in a rice–wheat cropping system. Sci. Rep. 2023, 13, 3665. [Google Scholar] [CrossRef]
  35. Amelung, W.; Meyer, N.; Rodionov, A.; Knief, C.; Aehnelt, M.S.; Bauke, L.; Biesgen, D.; Dultz, S.; Guggenberger, G.; Jaber, M.; et al. Process sequence of soil aggregate formation disentangled through multi-isotope labelling. Geoderma 2023, 429, 116226. [Google Scholar] [CrossRef]
  36. Shahabinejad, N.; Mahmoodabadi, M.; Jalalian, A.; Chavoshi, E. The fractionation of soil aggregates associated with primary particles influencing wind erosion rates in arid to semiarid environments. Geoderma 2019, 356, 113936. [Google Scholar] [CrossRef]
  37. Wang, Z.; Peng, Y.; Lv, J.; Shi, J.; Shang, J.; Wang, X. Effects of erosion on macroaggregation, aggregate associated organic carbon sources and compositions in a Mollisol agricultural landscape. Catena 2024, 240, 107994. [Google Scholar] [CrossRef]
  38. Dai, W.; Feng, G.; Huang, Y.; Adeli, A.; Jenkins, J.N. Soil aggregate stability and erodibility as influenced by soil amendments and winter cover crop in upland soils. Soil Sci. Soc. Am. J. 2025, 89, e70022. [Google Scholar] [CrossRef]
  39. Zhou, M.; Liu, C.; Wang, J.; Meng, Q.; Yuan, Y.; Ma, X.; Liu, X.; Zhu, Y.; Ding, G.; Zhang, J.; et al. Soil aggregates stability and storage of soil organic carbon respond to cropping systems on Black Soils of Northeast China. Sci. Rep. 2020, 10, 265. [Google Scholar] [CrossRef]
  40. Liu, B.; Fan, H.; Jiang, Y.; Ma, R. Evaluation of soil macro-aggregate characteristics in response to soil macropore characteristics investigated by X-ray computed tomography under freeze-thaw effects. Soil Till. Res. 2023, 225, 105559. [Google Scholar] [CrossRef]
  41. Zhang, W.P.; Fornara, D.; Yang, H.; Yu, R.P.; Callaway, R.M.; Li, L. Plant litter strengthens positive biodiversity–ecosystem functioning relationships over time. Trends Ecol. Evol. 2023, 38, 473–484. [Google Scholar] [CrossRef] [PubMed]
  42. Urbanek, E.; Horn, R.; Smucker, A.J.M. Tensile and erosive strength of soil macro-aggregates from soils under different management system. J. Hydrol. Hydromech. 2014, 62, 324–333. [Google Scholar] [CrossRef]
  43. Yang, T.; Zhang, Z.; Yu, P.; Yin, Z.; Li, A.; Zhou, X.; Qi, Z.; Wang, B. Soil Aggregates and Water Infiltration Performance of Different Water and Soil Conservation Measures on Phaeozems Sloping Farmland in Northeast China. Agronomy 2024, 14, 2410. [Google Scholar] [CrossRef]
  44. Zhu, M.; Cao, X.; Guo, Y.; Shi, S.; Wang, W.; Wang, H. Soil P components and soil fungi community traits in poplar shelterbelts and neighboring farmlands in northeastern China: Total alterations and complex associations. Catena 2022, 218, 106531. [Google Scholar] [CrossRef]
  45. Zhang, Q.; Jia, X.; Li, T.; Shao, M.; Yu, Q.; Wei, X. Decreased soil total phosphorus following artificial plantation in the Loess Plateau of China. Geoderma 2021, 385, 114882. [Google Scholar] [CrossRef]
  46. Simon, E.; Guseva, K.; Darcy, S.; Alteio, L.; Pjevac, P.; Schmidt, H.; Jenab, K.; Ranits, C.; Kaiser, C. Distinct microbial communities are linked to organic matter properties in millimetre-sized soil aggregates. ISME J. 2024, 18, wrae156. [Google Scholar] [CrossRef] [PubMed]
  47. Zhang, M.; Song, X.; Wu, X.; Zheng, F.; Li, S.; Zhuang, Y.; Man, X.; Degré, A. Microbial regulation of aggregate stability and carbon sequestration under long-term conservation tillage and nitrogen application. Sust. Prod. Consum. 2024, 44, 74–86. [Google Scholar] [CrossRef]
  48. Zhang, X.; Xin, X.; Zhu, A.; Yang, W.; Zhang, J.; Ding, S.; Mu, L.; Shao, L. Linking macroaggregation to soil microbial community and organic carbon accumulation under different tillage and residue managements. Soil Till. Res. 2018, 178, 99–107. [Google Scholar] [CrossRef]
  49. Jiang, Y.; Chen, L.; Zhu, F.; Wang, Y.; Jiang, J.; Chen, K.; Xue, S. Stable Aggregate Formation and Microbial Diversity Resilience in Soil Formation of Bauxite Residue: Roles of Extracellular Polymeric Substances Secreted by Penicillium oxalicum. ACS EST Eng. 2023, 3, 1758–1769. [Google Scholar] [CrossRef]
  50. Philippot, L.; Chenu, C.; Kappler, A.; Rillig, M.C.; Fierer, N. The interplay between microbial communities and soil properties. Nat. Rev. Microbiol. 2024, 22, 226–239. [Google Scholar] [CrossRef]
  51. Yang, C.; Liu, N.; Zhang, Y. Soil aggregates regulate the impact of soil bacterial and fungal communities on soil respiration. Geoderma 2019, 337, 444–452. [Google Scholar] [CrossRef]
  52. Williams, G.; Miller, R.; Deng, S. Dynamic relationships between microbial community, enzyme activity, and soil properties across global ecosystems. Appl. Soil Ecol. 2025, 206, 105843. [Google Scholar] [CrossRef]
  53. Whalen, E.D.; Grandy, A.S.; Geyer, K.M.; Morrison, E.W.; Frey, S.D. Microbial trait multifunctionality drives soil organic matter formation potential. Nat. Commun. 2024, 15, 10209. [Google Scholar] [CrossRef] [PubMed]
Figure 1. Information on location and geomorphic features of sample site (A). (B,C), from left to right, indicate the different levels of land coverage, and (D) shows the coverage rates. * indicates the significant different at 0.05 level.
Agronomy 15 02011 g001
Figure 2. Response of soil aggregate to land coverage in soils at 0–10 cm (A), 10–20 cm (B), and 20–30 cm (C). C, coverage level; S, aggregate ratios. Dotted line represents boundary between different coverage levels. * indicates the significant difference at 0.05 level and ns indicates no significant difference.
Agronomy 15 02011 g002
Figure 3. Response of mean weight diameter (A) and geometric mean diameter (B) to soil depth and land coverage. C, D, and C × D indicate influences of coverage (C), depth (D), and their interactions, respectively. * indicates the significant difference at 0.05 level and ns indicates no significant difference. Dotted line represents boundary between different coverage levels.
Agronomy 15 02011 g003
Figure 4. Response of soil shear strength (A), soil water content (B), and soil bulk density (C) to soil depth and land coverage. C, D, and C × D indicate influence of coverage, depth, and interaction between them, respectively. * indicates the significant difference at 0.05 level and ns indicates no significant difference. Dotted line represents boundary between different coverage levels.
Agronomy 15 02011 g004
Figure 5. Response of soil stable infiltration rate (A) to soil depth and land coverage. C, D, and C × D indicate influence of coverage, depth, and interaction between them, respectively. * indicates the significant difference at 0.05 level and ns indicates no significant difference. (B) shows correlation between stable infiltration rate and large macroaggregate, soil shear strength, and water content (n = 18). Dotted line represents boundary between different coverage levels.
Agronomy 15 02011 g005
Figure 6. Response of total nitrogen (AC), soil organic matter (DF), and total phosphorus (GI) to aggregate size and land coverage. C, S, and C × S indicate the influence of coverage, size, and interaction between them, respectively. * indicates the significant difference at 0.05 level and ns indicates no significant difference. (AC), (DF) and (GI) showed 0–10 cm, 10–20 cm, and 20–30 cm, respectively. The dotted line represents the boundary between different coverage levels.
Agronomy 15 02011 g006
Figure 7. Response of microbial diversity indexes to aggregate size and land coverage. C, S, and C × S indicate the influence of coverage, size, and interaction between them, respectively. * indicates the significant difference at 0.05 level and ns indicates no significant difference. (AC,DF,GI,JL) showed 0–10 cm, 10–20 cm, and 20–30 cm, respectively. (AF) and (GL) showed the results of 16S and ITS, respectively. The dotted line represents the boundary between different coverage levels.
Agronomy 15 02011 g007
Figure 8. PICRUSt2 results of 16s rRNA. (A) SOM metabolism, (B) P metabolism. LTS… and HBL, the third letter S, M and L indicates microaggregate, small macroaggregate and large macroaggregate, respectively. The second letter T, M and B indicates 0–10, 10–20 and 20–30 cm soil depth. And the first letter L and H indicate low land coverage and high land coverage.
Agronomy 15 02011 g008
Figure 9. Correlation between soil properties and main microbes (top 20 of abundance, n = 18). (A,B) showed 16S and ITS results, respectively. AR, large macroaggregate ratio; TP, total phosphorus; SOM, soil organic matter; TN, total nitrogen. *, **and *** indicate the significant difference at 0.05, 0.01 and 0.001 levels, respectively.
Agronomy 15 02011 g009
Figure 10. Principal component analysis of 16S (A) and ITS (B), and soil physical and chemical parameters. SBD, soil bulk density; SOM, soil organic matter; SWC, soil water content; Macro, large macroaggregate ratio; SSS, soil shear strength; TP, total phosphorus. Asco: Ascomycota, Basi: Basidiomycota, uncl: unclassified_Fungi, Glom: Glomeromycota, Mort, Mortierellomycota, Ince, Incertae_sedis. Acti: Actinobacteriota, Prot, Proteobacteria, Acid: Acidobacteriota, Chlo, Chloroflexi, Gemm: Gemmatimonadota, Firm: Firmicutes, Myxo, Myxococcota, Meth: Methylomirabilota.
Agronomy 15 02011 g010
Disclaimer/Publisher’s Note: The statements, opinions and data contained in all publications are solely those of the individual author(s) and contributor(s) and not of MDPI and/or the editor(s). MDPI and/or the editor(s) disclaim responsibility for any injury to people or property resulting from any ideas, methods, instructions or products referred to in the content.