Article

Spatial Distribution Characteristics of Soil Nutrients and Stoichiometric Ratios in Eragrostis minor Distribution Areas of Gansu Province, Northwestern China

1
College of Grassland Science, Gansu Agricultural University, Lanzhou 730070, China
2
Key Laboratory of Grassland Ecosystem (Ministry of Education), Lanzhou 730070, China
*
Author to whom correspondence should be addressed.
Agronomy 2025, 15(8), 1996; https://doi.org/10.3390/agronomy15081996
Submission received: 22 July 2025 / Revised: 9 August 2025 / Accepted: 12 August 2025 / Published: 20 August 2025
(This article belongs to the Section Soil and Plant Nutrition)

Abstract

Soil nutrients and stoichiometric ratios are significant parameters for Eragrostis minor Host sustainability in a recent climate change scenario. However, their characteristics in Northwestern China are still unclear, particularly at Gansu belt, and require further investigation. In the study, we analyzed soil pH, organic matter (OM), nutrients, and stoichiometric ratios from eight E. minor distribution sites in Gansu Province at 0–10, 10–20 and 20–30 cm soil depths. Results showed that soils were alkaline, with pH increasing significantly with depth (p < 0.05). The soil OM, nitrogen (N), and phosphorus (P) decreased with depth, showing topsoil nutrient enrichment. Baiyin Huining (HN) and Dingxi Anding (AD) exhibited the highest nutrient levels, likely due to higher altitudes. The soil stoichiometric ratios were lower than both China’s depth-averaged values and the global averages, indicating N as the primary limiting factor. Further, correlation analysis showed that the soil nutrients were mainly affected by altitude, and N chiefly limited the soil stoichiometric ratios. Therefore, E. minor can be managed and conserved sustainably at HN and AD sites in Gansu’s dry temperate ecosystem. These findings offer theoretical support for ecological adaptability assessment, conservation of germplasm resources, and E. minor utilization in Gansu province, China.

1. Introduction

Soil nutrient contents and stoichiometric ratios are critical indicators of soil fertility, which directly affects plant growth and development [1]. Carbon (C), nitrogen (N), phosphorus (P), and potassium (K) are essential mineral nutrients for plants, playing important roles in tissue structure, carbon metabolism, and cellular osmotic regulation [2]. Additionally, these nutrients are key indicators for soil fertility, while the stoichiometric ratio of C, N, and P can reflect the nutrient limitation in soil [3]. For example, the soil C:N ratio predicts the nitrogen mineralization potential, the C:P ratio reflects phosphorus availability, and the N:P ratio determines nutrient limitation thresholds [4]. Specifically, a high C:N ratio indicates that organic matter is accumulating faster than it is decomposing [5], whereas a lower C:N ratio reflects high fertility and faster C and N mineralization rates [6]. Similarly, a lower C:P ratio generally suggests a higher availability of phosphorus in the soil [7]. For the N:P ratio, values less than 12 and greater than 16 typically indicate nitrogen and phosphorus limitation, respectively, while co-limitation occurs between 12 and 16 [8]. These stoichiometric characteristics not only reveal the interactions and balance among C, N, and P but also indicate nutrient effectiveness, which significantly improves the understanding of soil ecosystem development [9]. Variations in stoichiometric ratios affect the balance of constituent elements in the plants through feedback regulation, which in turn influences the growth, development, and morphological changes in the plant body. Current studies on the relationship between plant habitat distribution (spatial and vertical) and soil properties in arid and semi-arid regions of northwestern China remain limited. Investigating soil nutrients and stoichiometric characteristics in arid ecosystems could help elucidate plant adaptation strategies, assess soil fertility dynamics, and provide theoretical support for sustainable ecosystem management.
Given the critical role of soil nutrients and their stoichiometry in plant growth, elucidating their spatial variability and driving mechanisms is essential for accurately assessing regional soil fertility [10]. Soil nutrient contents and stoichiometric ratios are affected by environmental factors such as altitude, temperature, humidity, and wind speed, which influence nutrient cycling and utilization. Zhang et al. [11] showed that soil C and N contents, as well as C:N and N:P ratios are lower at high altitudes. High temperatures may accelerate the decomposition of organic matter (OM), leading to the rapid release of nutrients. Drought conditions limit water availability and root growth, reducing nutrient accessibility. Wind erosion can carry away surface fines, diminish soil water-holding capacity, and reduce OM content and soil nutrient status, leading to coarsening of soil texture, moisture loss, and nutrient redistribution [12]. Additionally, fertilizer application also affects soil nutrients concentration and availability as well as stoichiometric ratios. Studies have shown that long-term application of organic and inorganic fertilizers can mitigate soil C:N ratio imbalance [13]. A comprehensive understanding of these relationships is vital for predicting plant community dynamics, enhancing vegetation restoration in nutrient-limited ecosystems, and formulating targeted conservation strategies for alpine plant species under changing environmental conditions.
Eragrostis is an annual or perennial herbaceous plant belonging to the Gramineae family, originating from Africa and widely distributed in tropical and temperate regions [14]. This species thrives in nutrient-poor soils and demonstrates remarkable adaptability to diverse ecological conditions [15]. In arid and semi-arid desert regions, Eragrostis minor Host forms dense vegetation cover on fixed dunes, maintains high productivity even under arid conditions or intensive grazing pressure [16,17]. As a pasture and cereal crop, its cultivation is important for animal husbandry and food security in resource-limited regions [18,19,20]. Despite its ecological and agricultural significance, research on E. remain limited in scope. Earlier studies only focused on E. taxonomy [15], cultivation practices [21], chemosensitivity [22,23,24], and stress resistance [25], but there are only few studies available on the vertical distribution of soil properties especially at different soil layers in its habitat. Gansu is located in the inland northwest of China and exhibits complex and diverse topography along with varied climate types, providing diverse environmental conditions for the growth of E. minor. Investigating the vertical distribution characteristics of soil properties within E. minor habitats can provide valuable insights into its ecological adaptation mechanisms and may help to elucidate soil–plant interactions. Moreover, grassland managers and policymakers can use this information to make informed decisions about sustainable utilization of wild E. minor germplasm resources under climate change issues in Gansu China.
Our study focuses on the variability of soil properties across key distribution areas of E. minor in Gansu Province. Specifically, this research was carried out to (1) determine the influence of different E. minor distribution areas of Gansu Province such as Lanzhou Anning, Dingxi Anding, Lanzhou Yuzhong, Baiyin Huining, Tianshui Maiji, Longnan Wudu, Longnan Xihe and Pingliang Kongtong and soil depth on soil pH and nutrients; (2) to evaluate stoichiometric ratios among different E. minor distribution areas in Gansu at different depths; and (3) to identify the relationship between soil pH, nutrients, stoichiometric ratios and environmental factors. We hypothesized that (1) the soil pH will show an increase whilst soil nutrients and stoichiometric ratios will display a decrease with soil depth in the dry temperate ecosystem of the northwestern China; (2) within different E. minor distribution areas in Gansu Province, we anticipate that the Baiyin Huining and Dingxi Anding E. minor distribution areas will reveal higher nutrients and stoichiometric ratios due to high altitude than other E. minor distribution areas.

2. Materials and Methods

2.1. Study Area Description

The study was conducted in Gansu Province, located in the northwestern temperate region of China. The Gansu belt experiences a dry temperate climate, with prolonged summers from June to September and brief winters from November to February. Geographical area of the Gansu Province is 42.58 × 10⁴ km2, which is 4.72 percent of the total area of China. Almost 70% of the total land area of Gansu Province is covered by mountains and plateaus [26]. At higher altitudes in the Gansu Province, the Qinghai–Tibet Plateau comprises alpine shrub, meadow, shrubland–grassland ecotone, and herb-dominated grasslands.

2.2. Research Setup

We selected areas with a high concentration of E. minor in central, southern and eastern parts of Gansu Province at eight different sampling sites including Lanzhou Anning (AN), Dingxi Anding (AD), Lanzhou Yuzhong (YZ), Baiyin Huining (HN), Tianshui Maiji (MJ), Longnan Wudu (WD), Longnan Xihe (XH) and Pingliang Kongtong (KT). Three sampling points were randomly selected in each site with a minimum separation distance of >10 m, using a 2 m × 2 m quadrat for each point. Sampling sites lies between the coordinates of 33°24′ N to 36°08′ N and 103°41′ E to 106°43′ E and 1008.2 m to 1750. 1 m mean above sea level (masl). In the study sites, the average annual precipitation was ranged from 119.8 to 669.9 mm whilst mean annual temperatures was ranged from 16.17 to 26.92 °C. Geographic addresses of the eight study sites with respect to their altitude displayed in Figure 1.
The experimental basic information, comprising the sampling location, longitude, latitude, altitude, mean annual precipitation, mean annual arial temperature and habitat classification in the research region listed in Table 1.

2.3. Soil Sampling and Sample Preparation

Soil samples were collected from 24 sampling plots (3 plots × 8 sites) during August in 2024 with an auger (diameter: 8 cm; length: 5 cm), in order to assess the differences in soil properties under eight sites of E. minor distribution. The soil sampling was performed at surface, 0–10 cm, and sub-surface, 10–20 cm, and 20–30 cm soil depths from each sampling plot. Soil samples were collected from the central point and the four corners of each plot. The sampled soil samples from these five locations from each sampling plot then underwent meticulous mixing to form a 1 kg composite sample. The soil samples from eight sampling sites of E. minor distribution, including three sampling points, were placed in plastic bags and transported to the laboratory of Gansu Agricultural University for further analysis. The moist E. minor distribution area-augured soil samples were softly broken up with naturally weak planes, and surface impurities such as ground vegetation and detritus were manually removed by using tweezers. The augured soil samples were air-dried for 10 days and sieved with 2 mm sieve to distinct the coarse fraction (stones and gravel having diameter of >2 mm) and the fine soil fraction (fine soil material having <2 mm diameter). The coarse soil fraction was discarded at this stage. Then, air-dried soil of the fine soil fraction sieved were stored at 4 °C for chemical analysis.

2.4. Analysis of Soil pH, OM, Nutrients and Stoichiometric Ratios

Soil pH was determined using a pH meter (PB-10, Sartorius, Göttingen, Germany) with a soil:water ratio of 1:2.5 (v/v) [27]. Soil OM content was determined by the K2Cr2O7 external heating method (LY/T1237-1999 [28]). The concentration of soil total N (TN) was measured by the semi-micro Kjeldahl method (LY/T1228-2015 [29]); available N (AN) was measured by the NaOH fusion molybdenum antimony colorimetric method (LY/T 1228-2015 [29]); soil total P (TP) was measured with fusion-molybdenum antimony colorimetric method (NY/T88-1988 [30]); soil available P (AP) was measured by the NaHCO3 extraction-colorimetric method (LY/T 1232-2015 [31]); soil total K (TK) was measured by the NaOH fusion-flame photometry method (NY/T87-1988 [32]); available K (AK) was measured by the NH4OAc extraction-flame photometry method (LY/T1234-2015 [33]). The C:N ratio is calculated as the ratio of soil organic C (SOC) to TN concentrations, the C:P ratio is calculated as the ratio of SOC to TP concentrations, and the N:P ratio is calculated as the ratio of TN to TP concentrations.

2.5. Statistical Analysis

Mean annual precipitation (mm) and mean annual temperature (°C) datasets for the study area in 2023 were obtained from the National Meteorological Science Data Center (http://data.cma.cn/, accessed on 17 December 2024). Geographic coordinates (latitude, longitude, and altitude) were recorded using GPS. All research data were statistically organized and processed in Excel 2019 (Microsoft Corp., Redmond, WA, USA). Data were first assessed for normality with the Shapiro–Wilk test and, when necessary, log-transformed to produce a normal distribution. The procedure used to analyze the obtained data of study was one-way factor interaction analysis of variance (ANOVA), appropriate for randomized complete block design (RCBD). The linear model procedure of the suitable computer software program Statistical Package for Social Science (SPSS) window version 26.0 (IBM Corp., Chicago, IL, USA) was used for all statistical analysis. Duncan’s test at 5% significance level was used for separation of significant differences between different sampling sites in the same soil depth and significance level (p < 0.05) amongst different soil strata in the sampling sites. All data obtained from different sampling sites are exhibited as the means of three replications with standard deviation and computer software Origin 2021 (OriginLab Corp., Northampton, MA, USA) was used for drawing graphs. The Pearson heatmap correlation analysis was used to describe the relationship between soil nutrients, stoichiometric ratios and environmental factors.

3. Results

3.1. Variability in Soil Nutrients and Stoichiometry Ratios Across E. minor Distribution Sites

The descriptive statistics analysis of soil nutrients and stoichiometric characteristics across different distribution of E. minor areas shown in Table 2. The mean values of soil pH, OM, TN, AN, TP, AP, TK, and AK at the eight sampling sites were 8.73, 14.93 g kg−1, 1.39 g kg−1, 111.97 mg kg−1, 0.76 g kg−1, 5.05 mg kg−1, 13.34 g kg−1, and 204.94 mg kg−1, respectively. The mean soil stoichiometric ratios (C:N, C:P, and N:P ratios) were 6.90, 12.20, and 1.92. Based on the coefficients of variation (CV, standard deviation/mean), which reflect the degree of dispersion, they are classified as follows: weak (CV ≤ 10%), moderate (10% < CV ≤ 100%), and strong (CV > 100%) [34]. Results indicated that all measured indicators, except pH, exhibited moderate variability. The AP showed the highest variability (63.33%), which was followed by AK (59.38%). The CVs of other investigated indicators ranged from 18.40% to 49.01%, whilst pH displayed the lowest variability (4.32%), falling into the category of weak variability category.

3.2. Vertical Distribution of Soil pH and OM Under E. minor Sites

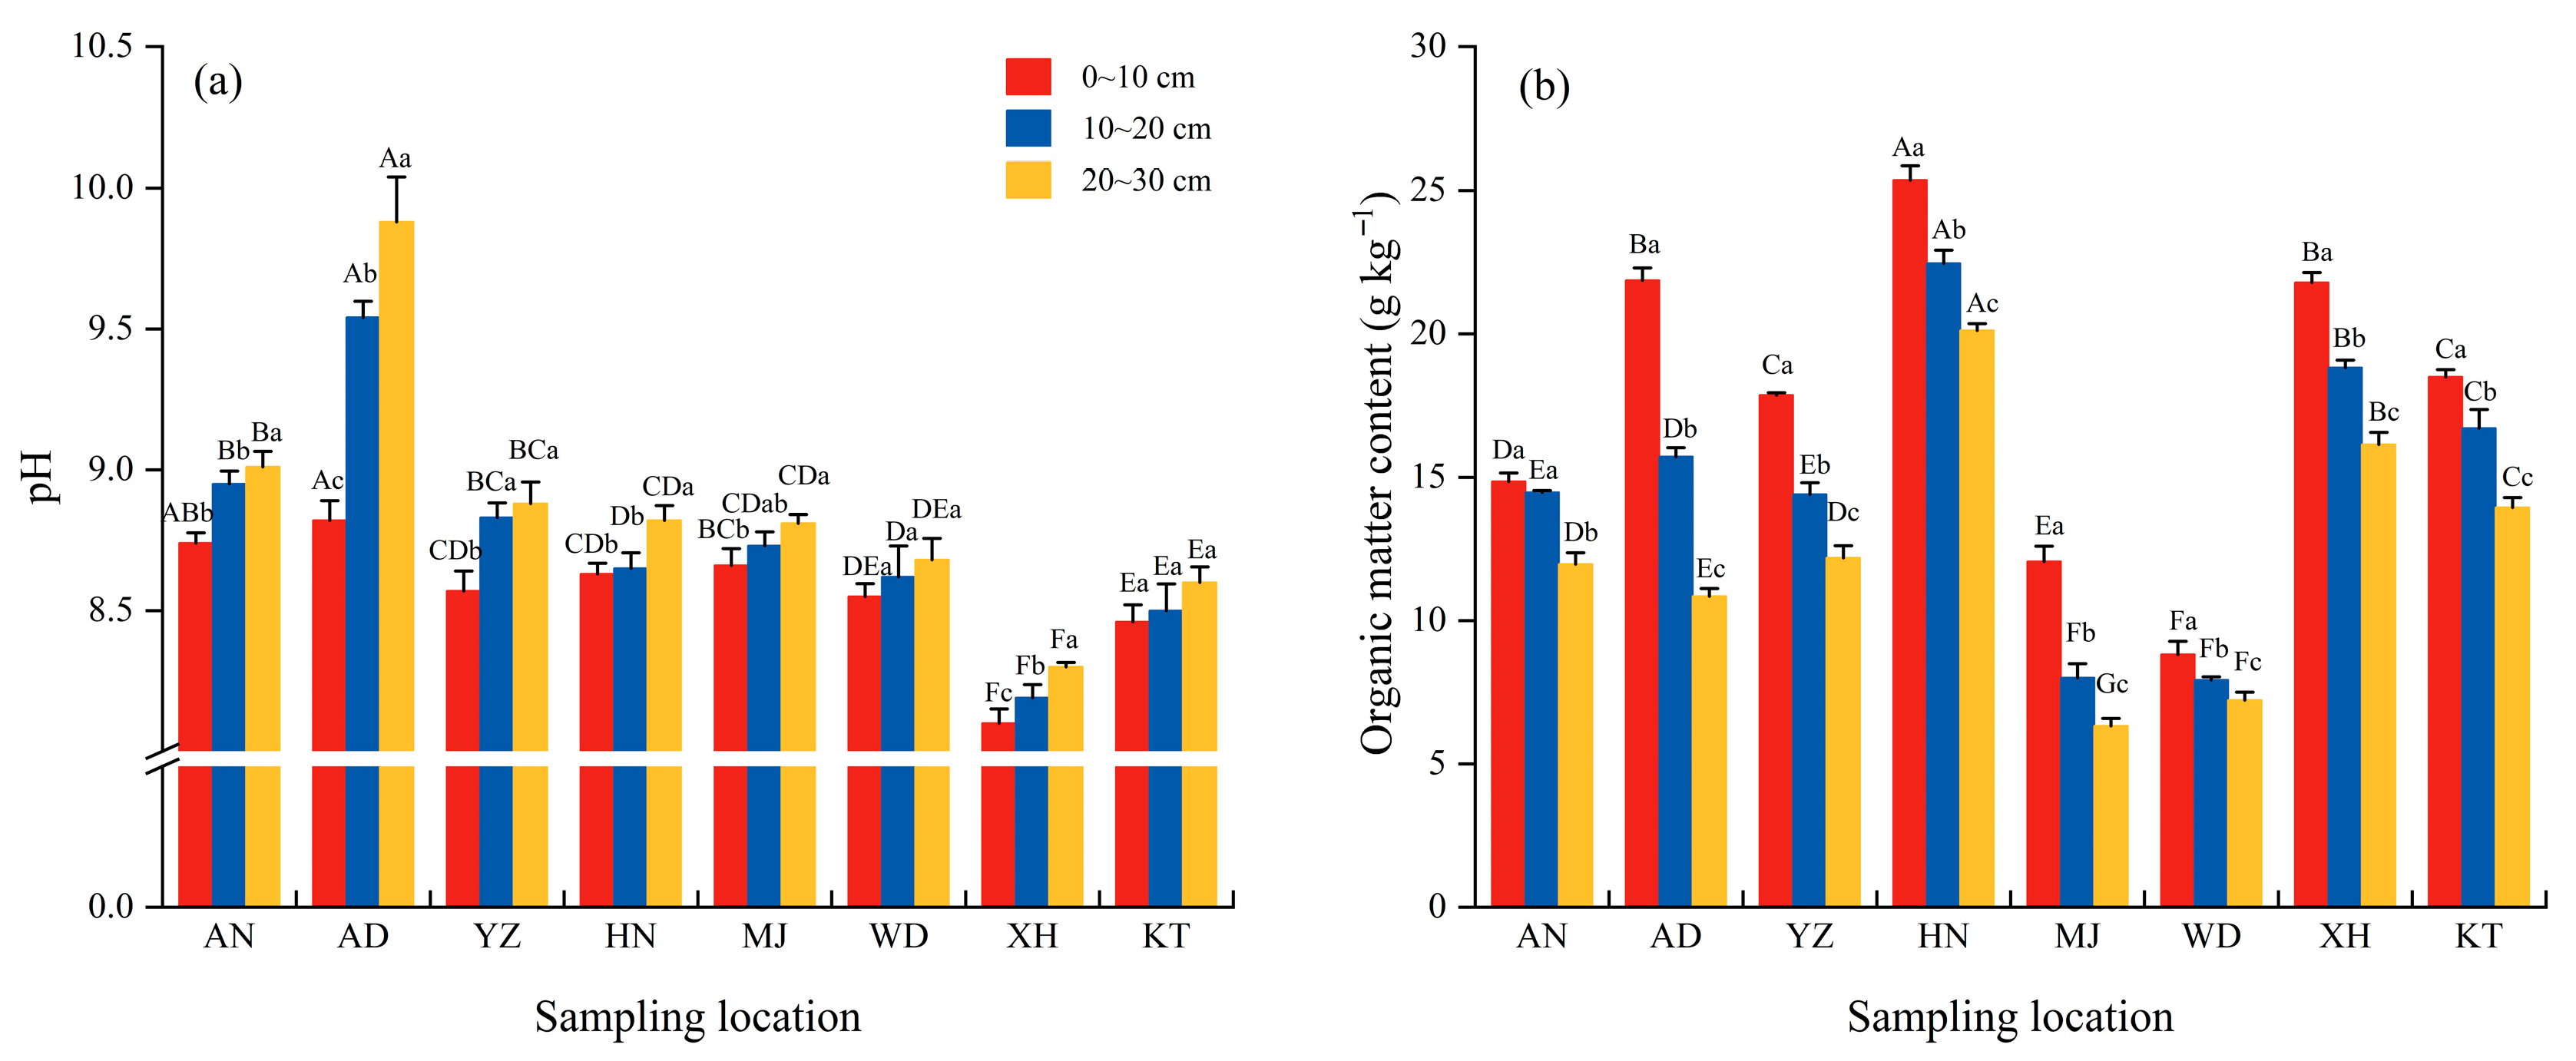
Our study depicted that different distribution areas of E. minor had noteworthy effect on soil pH and OM at various soil depths (Figure 2a,b). In all investigated (0–10, 10–20 and 20–30 cm) soil depths, the AD had a significantly higher soil pH ranged from 8.82 to 9.88 whilst lowest soil pH was recorded under XH. Our data showed strongly alkaline conditions under AD com-pared with other sampling sites irrespective of soil depths (Figure 2a). The pH increased with soil depth, the most significant change occurred in AD, whereas pH levels in WD and KT remained stable across layers. Regarding soil OM, the highest OM was observed under HN, which was followed by XH whereas WD had minimum OM including various soil layers. On average across different tested soil depths, HN increased OM by 183.48% than WD (Figure 2b). Soil OM decreased with the increase in soil depth, being highest at the topmost soil layer.

3.3. Vertical Distribution of Soil Nutrients Under E. minor Sites

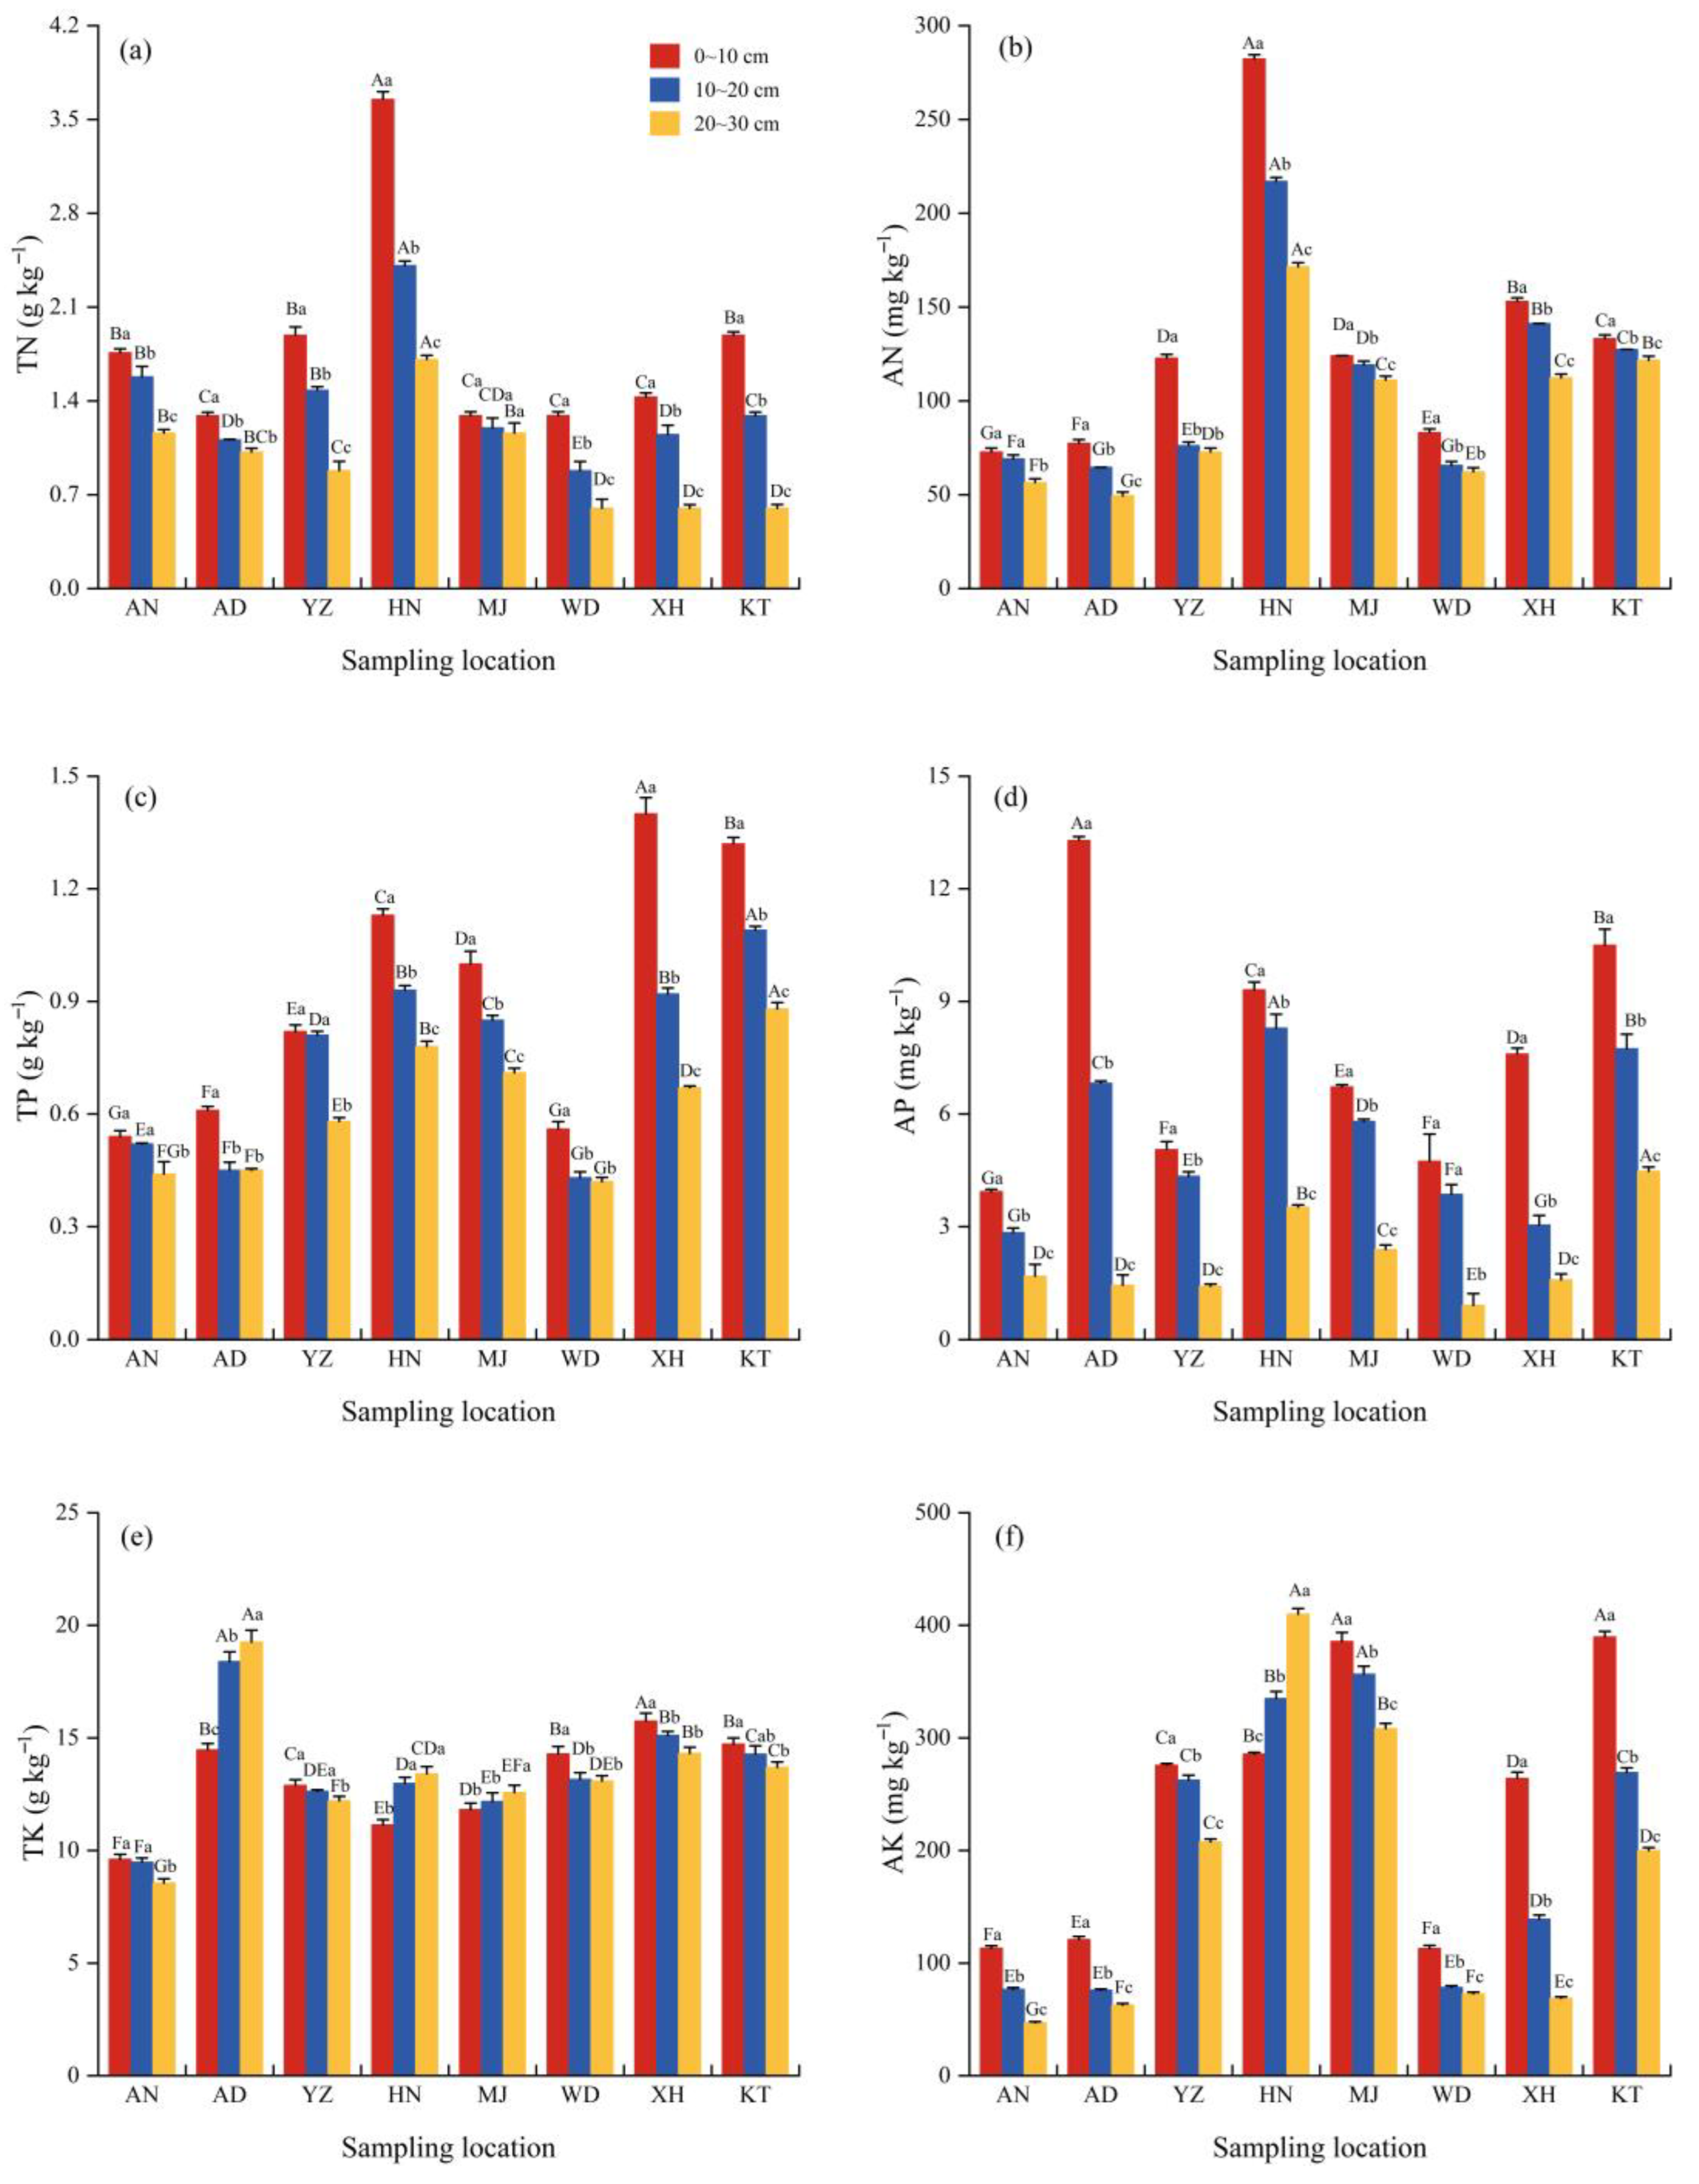
To quantify the influences of different distribution areas of E. minor on soil nutrients, we quantified TN, AN, TP, AP, TK, and AK. In all tested soil layers (0–10, 10–20 and 20–30 cm), the maximum TN and AN contents were noted under HN whilst WD had lowest TN values. Compared with WD, the HN increased TN and AN by 181.52% and 217.77%, respectively, across different tested soil layers (Figure 3a,b).
At 0–10 cm soil layer, the XH had highest TP (1.40 g kg−1), which was followed by KT whilst minimum TP was associated with WD, which was statistically at par with AN. The XH increased TP by 134.04% compared with WD. However, AD had significantly higher (13.29 mg kg−1) AP content than that of the other sampling sites. AD increased AP by 238.51% over AN, which had lowest AP. At 10–20 and 20–30 cm soil depths, the maximum TP (1.09 and 0.88 g kg−1, respectively) were associated with KT, which were significantly higher than those of the other sampling sites. However, WD had minimum concentration of TP at both soil layers. KT increased TP by 155.66% and 112.66%, respectively, than WD. The HN had maximum and AN had lowest AP at 10–20 cm soil depth whereas KT had maximum and WD had minimum AP at 20–30 cm soil depth (Figure 3c,d).
Almost parallel with TP, the XH had maximum TK (15.75 g kg−1) and AN had minimum TK concentration at 0–10 cm soil layer. XH increased TK by 63.89% over AN. However, the TK in the 10–20 cm and 20–30 cm soil layers of AD were significantly higher than those of the other sampling sites (p < 0.05). In these soil depths AN had lowest TK. Regarding soil AK, there was no significant difference in AK content in the 0–10 cm soil layer between KT (389.67 mg kg−1) and MJ (385.67 mg kg−1), but it was significantly higher than those of the other sampling sites (p < 0.05). The lowest AK was observed under WD, and KT as well as MJ increased AK by 244.84% and 2411.30% over WD. The maximum AK at 10–20 cm soil layer was noted under MJ and minimum AK was under AD whilst HN had highest AK and AN had minimum AK at 20–30 cm soil depth (Figure 3e,f).
Significant variations in soil nutrient contents were observed across different soil depths. Soil TN, AN, TP, and AP contents all decreased with the increase in soil depth. Except for MJ, where TN content showed no significant variation among soil layers (p > 0.05), these nutrients differed significantly across depths at all other sampling sites. In contrast, soil TK and AK contents did not have the same change trend with the deepening of soil depth. The soil TK contents decreased with depth in AN, YZ, WD, XH, and KT but increased in AD, HN, and MJ. Soil AK content varied significantly across depths (p < 0.05), decreasing in all sampling sites except HN, where it increased with depth (Figure 3).

3.4. Vertical Distribution of Soil Stoichiometric Ratios Under E. minor Sites

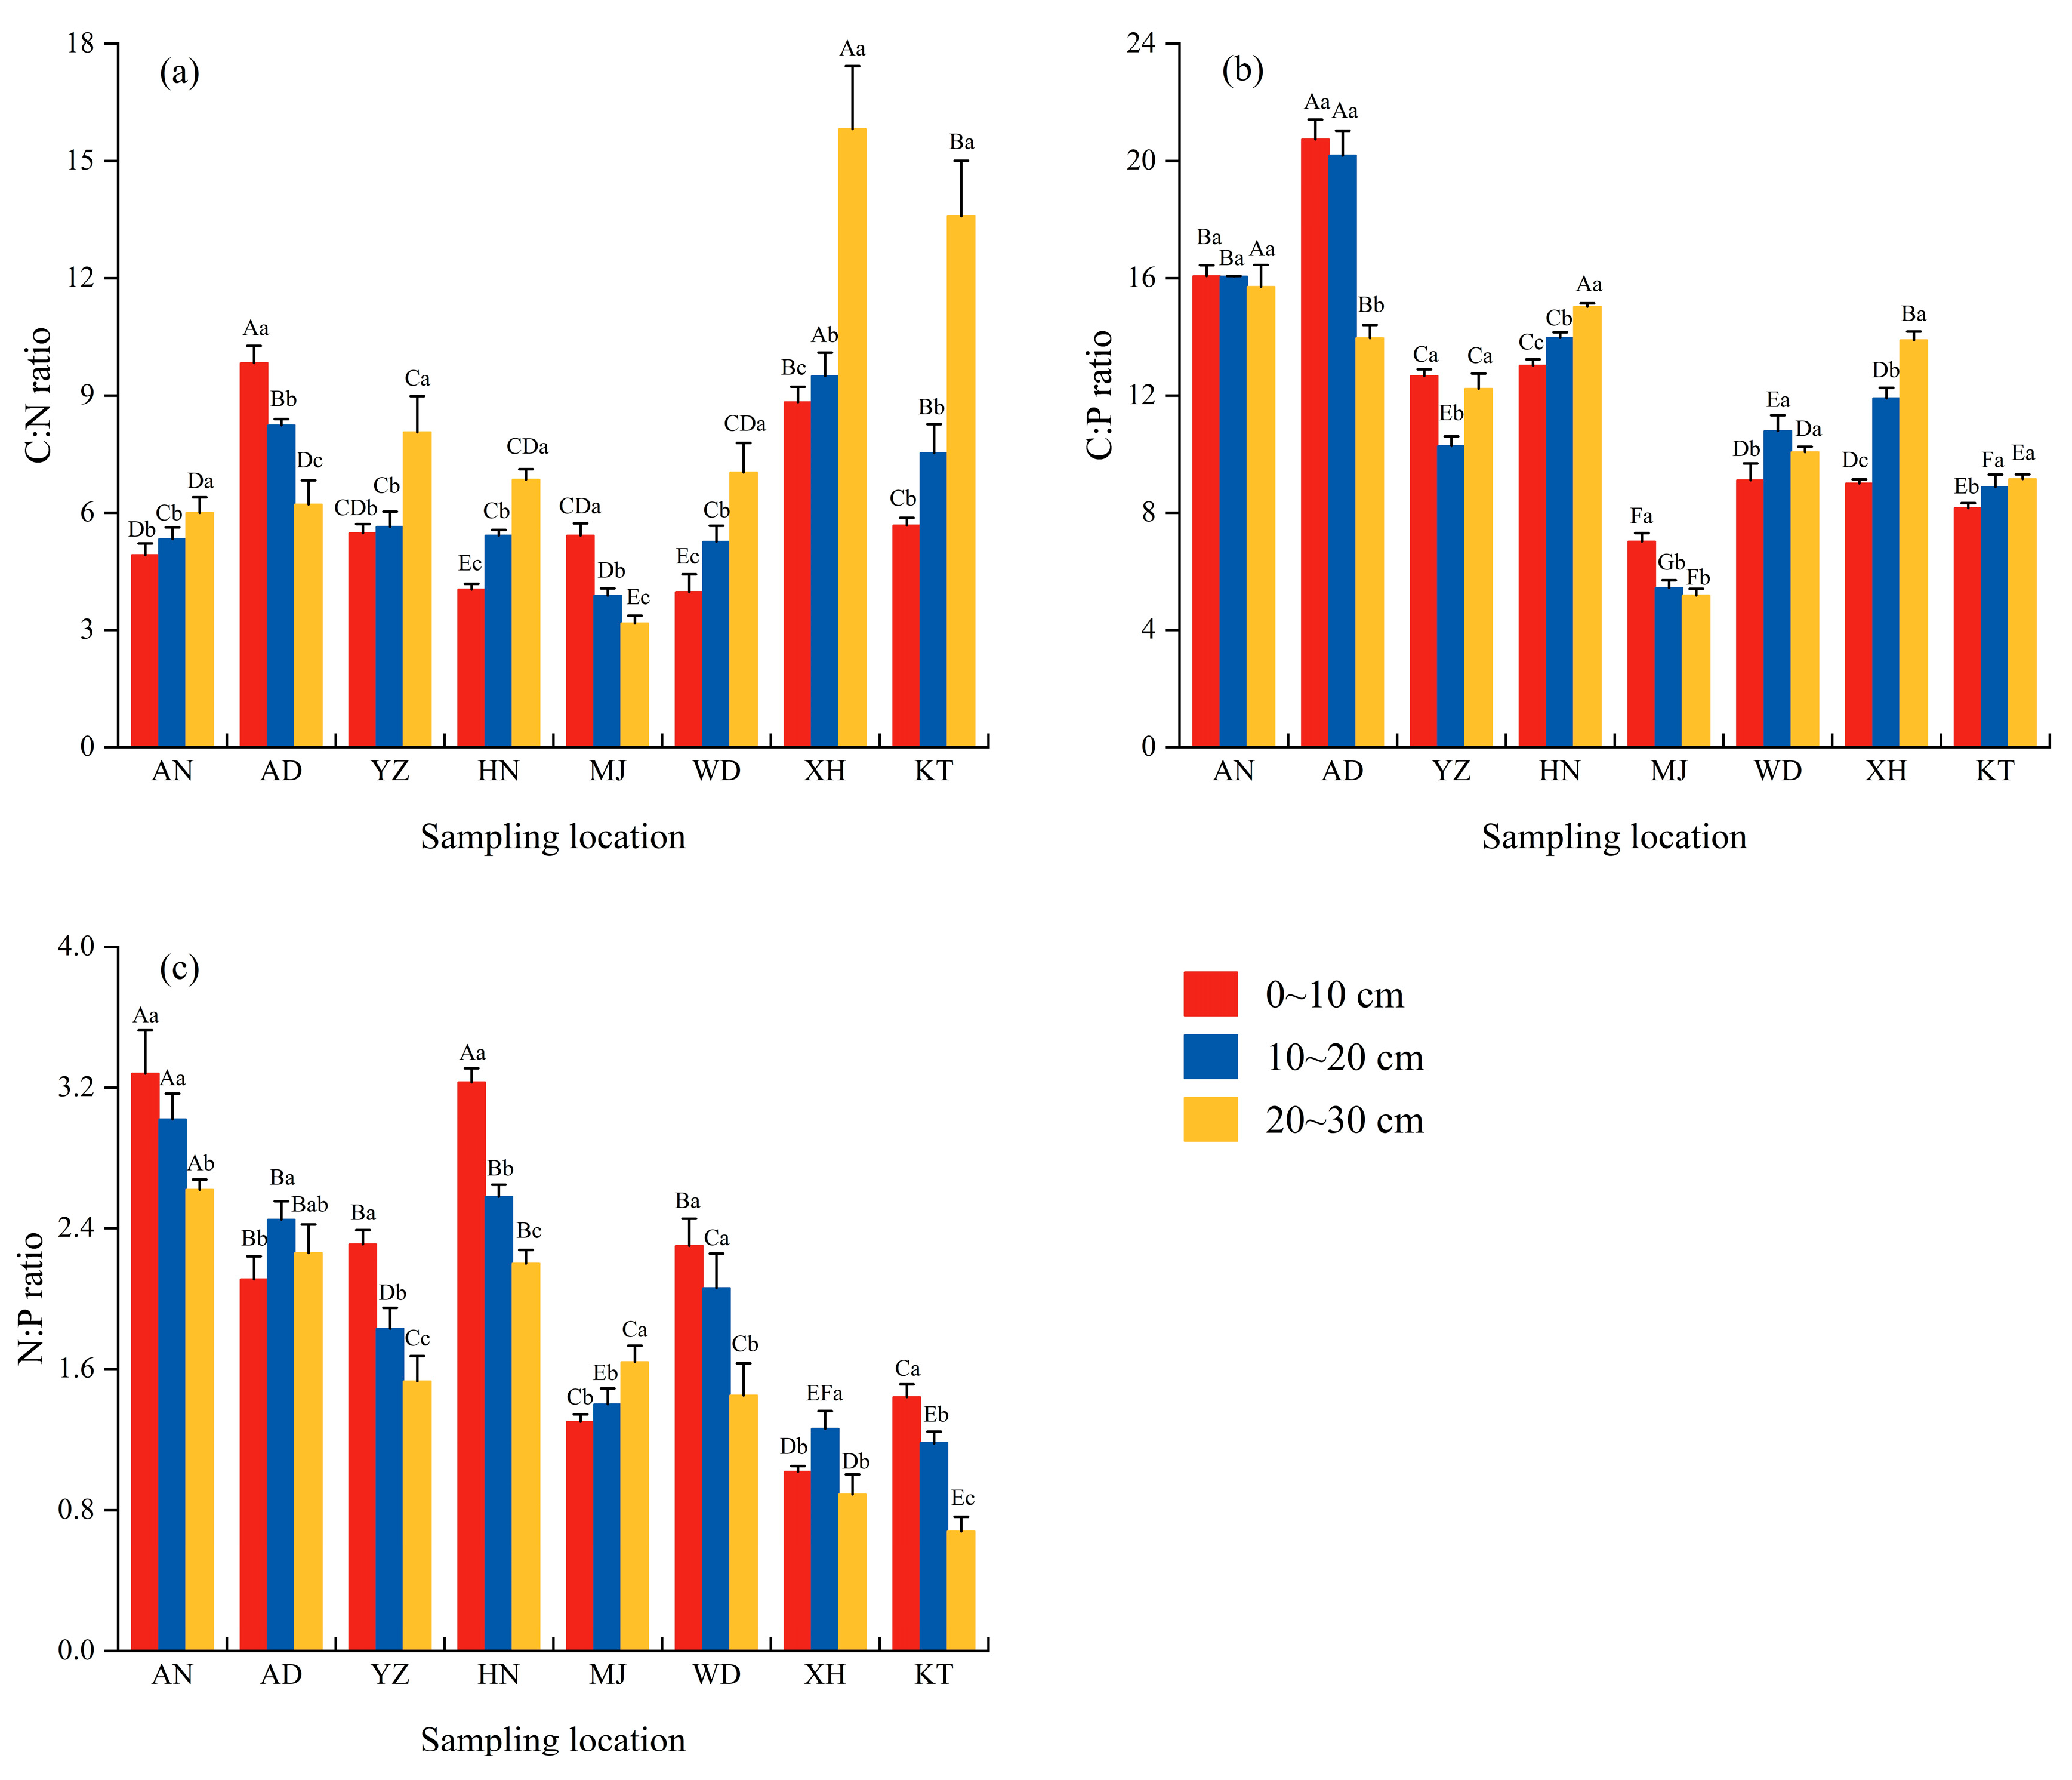
Analysis of variance test indicated significant differences in case of soil stoichiometric ratios between different distribution areas of E. minor (p < 0.05) (Figure 4). Overall, the soil C:N, C:P, and N:P ratios ranged from 3.17 to 15.82, 5.18 to 20.74, and 0.68 to 3.28, respectively, at 0–30 cm soil layer. In the 0–10 cm soil layer, AD had a significantly higher soil C:N ratio than those of the other sampling sites (p < 0.05). While HN and WD showed non-significant difference (p > 0.05), they were significantly lower than other sampling sites (p < 0.05). In the 10–20 cm and 20–30 cm soil layers, XH had a significantly higher soil C:N ratio than other sites (p < 0.05). MJ consistently exhibited the lowest values of C:N ratio. In these two soil depths, XH increased C:N ratio by 145.05% and 398.26%, respectively. The highest 20.74 soil C:P ratio in 0–10 cm soil layer and 20.19 soil C:P ratio in 10–20 cm soil layer were observed under AD than other sampling sites. At 20–30 cm soil layer, no significant difference was observed between AN and HN (p > 0.05), though both were significantly higher than other sites (p < 0.05). The lowest soil C:P ratio recorded under MJ at all tested soil layers. For the soil N:P ratio, AN displayed the highest values (2.62–3.28) while XH had the lowest N:P ratio across all investigated soil layer. AN increased N:P ratio by 182.86% than XH.
Soil nutrient stoichiometric ratios varied across different soil depths within the same distribution area (Figure 4a–c). The soil C:N ratio increased with increasing soil depth in AN, YZ, HN, WD, XH, and KT, but decreased in AD and MJ. Conversely, the soil C:P ratio decreased with increasing soil depth in AN, AD, YZ, and MJ, while it increased in HN, WD, XH, and KT. No significant difference was recorded in the soil C:P ratio between different soil layers in AN (p > 0.05). The soil N:P ratio increased with increasing soil depth in AD and MJ but generally decreased in the remaining six sampling sites (Figure 4c).

3.5. Correlation Analysis

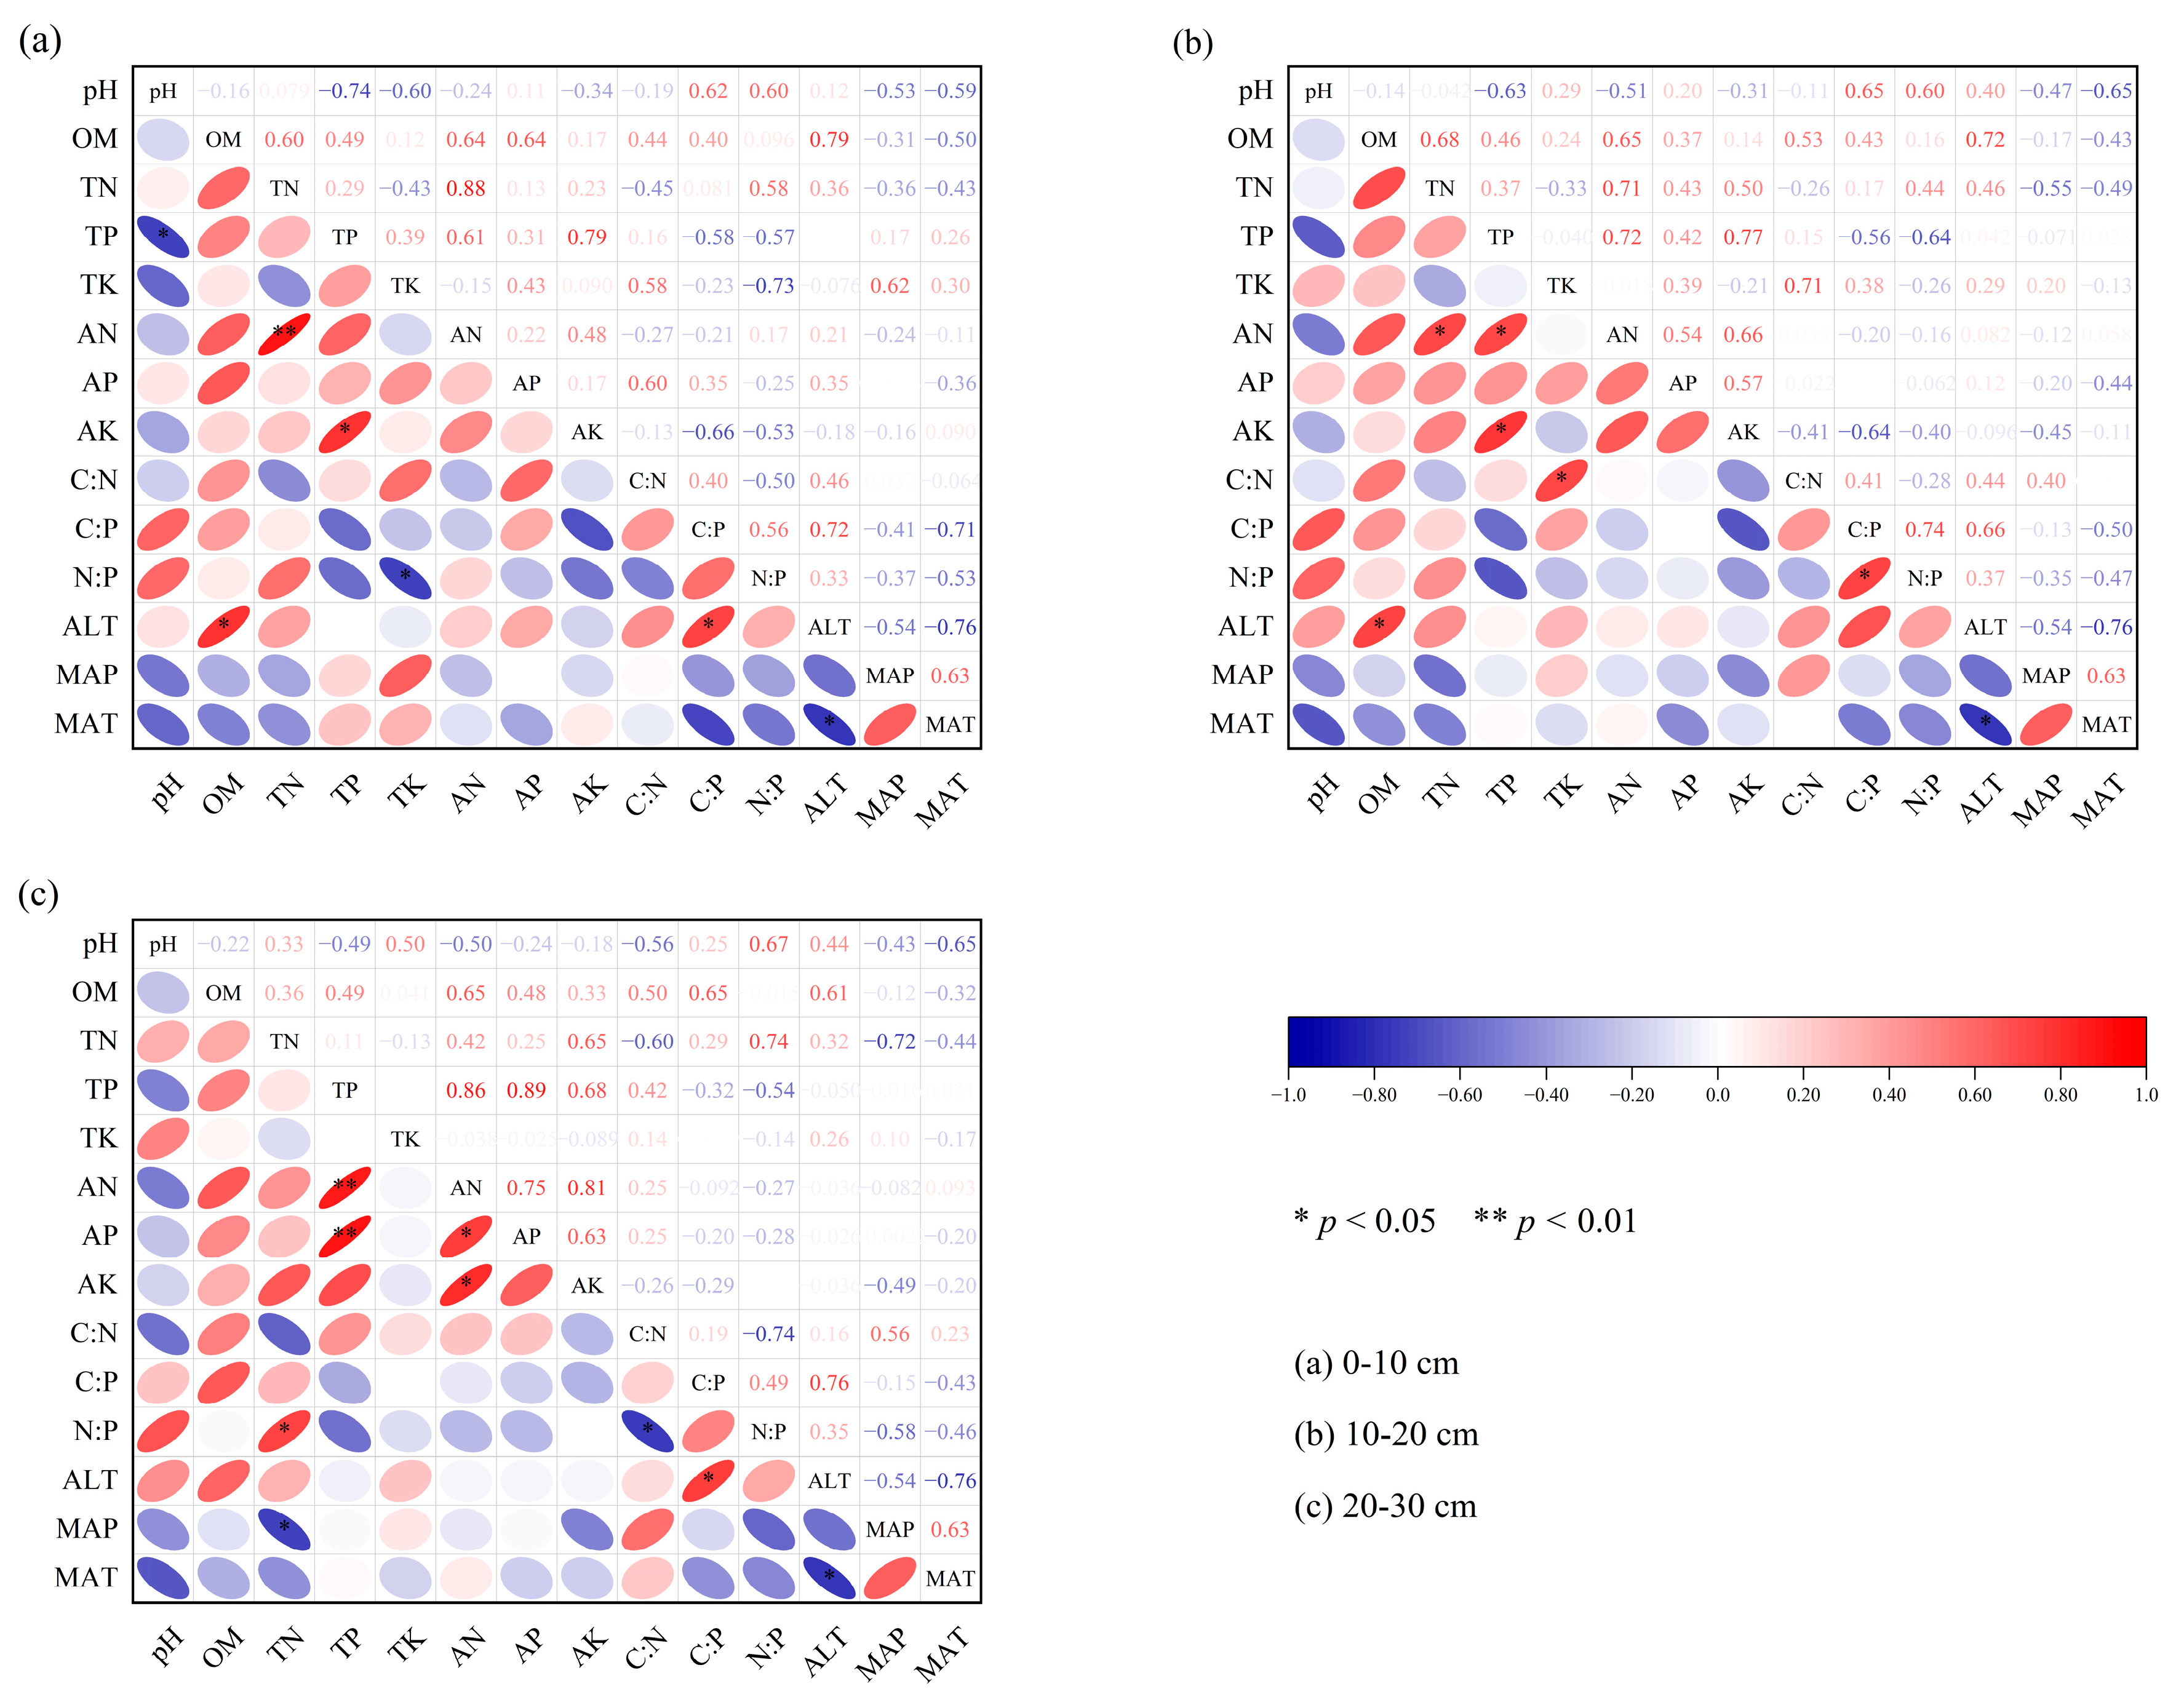
Pearson correlation analysis was conducted to explore the relationships between soil indicators, stoichiometric ratios, and environmental factors (altitude, precipitation, and arial temperature) at various soil layers (Figure 5a–c). In the 0–10 cm and 10–20 cm soil layers, soil OM content showed significant positive correlation with altitude (p < 0.05), and soil TP content was significantly positively correlated with soil AK content. The positive correlation between soil TN content and AN content weakened with soil depth, being extremely significant in the 0–10 cm layer at p < 0.01) but only significant in the 10–20 cm layer at (p < 0.05). Soil pH and soil TP content showed a significant negative correlation in the 0–10 cm soil layer (p < 0.05) but were not significantly correlated in the 10–20 cm and 20–30 cm soil layers (p > 0.05). The soil C:P ratio was significantly positively correlated with altitude in the 0–10 cm and 20–30 cm soil layers (p < 0.05). The soil N:P ratio showed a significant positive correlation with TN content in the 20–30 cm soil layer (p < 0.05). In the 20–30 cm soil layer, the soil N:P ratio was significantly positively correlated with TN content and negatively correlated with soil C:N ratio (p < 0.05) (Figure 5c).

4. Discussion

4.1. Effects of Spatial Distribution and Soil Depth on Soil pH and Nutrient Content

Soil pH is a critical indicator of soil quality, regulates microbial activity, and root development, reflecting nutrient availability and weathering processes [35]. A well-documented relationship exists between soil pH and climate: alkaline soils typically dominate arid regions, whereas acidic soils prevail in humid and semi-humid areas [36]. Gansu Province is characterized by arid and semi-arid conditions. Soil pH values ranged from 8 to 9 at most studied sites, except in AD, where pH levels reached 8–10. These findings are consistent with the pH range reported for the western Loess Plateau by Liu et al. [37]. Factors such as parent rock, time, topography, climate, and biology contribute to elevated soil pH [38]. The AD soil, a sandy soil collected from a highway roadside, exhibited a higher pH compared to the other sampling sites, likely due to the influence of alkaline materials from the highway.
Soil nutrients are essential for plant growth and development, as their content and availability directly influence vegetation productivity, species composition and ecosystem stability. This study revealed that the soil OM, TN, AN, TP, AP, TK, and AK contents varied greatly under different investigated distribution areas of E. minor. Maximum nutrients accumulation was observed under HN and AD distribution sites. Our results are in the range of national average values of soil parameters [39]. The substantial variation in soil properties across the species’ distribution range suggests that E. minor can thrive in a wide range of soil environments. Moreover, this study showed that soil nutrient contents varied significantly with depth, indicating a strong influence of soil depth on nutrient distribution. This variation arises due to soil nutrients are affected by soil matrices, organic residue decomposition, atmospheric deposition, and plant uptake, leading to substantial spatial heterogeneity [40].
Additionally, our data showed that most of soil nutrient contents decreased with increasing soil depth, except TK and AK. These results are consistent with previous research [41,42]. This trend primarily occurs because of plant residue decomposition, animal manure and fertilization; enrich the nutrient pool in surface soils [43]. While nutrients are transported downward through infiltration and percolation, resulting in a relative increase in nutrients in deeper soil layers [44]. However, organic matter input becomes restricted by soil permeability, microbial decomposition activity and root uptake, resultant in reducing availability of nutrients in deeper layers [45]. Consequently, nutrient availability generally decreases with increasing soil depth [46]. Soil pH increased with soil depth, aligning with the results of Zhang et al. [47]. The pH variations influence organic matter stability and availability [48], which is one of the main reasons for soil OM content varies with soil depth. The soil surface interacts directly with the external environment, where apoplastic material, animal remains, plant roots, and microbial activity significantly contribute to OM and N accumulation [49]. Consequently, the coefficients of variation for soil OM and TN were high. The P and K dynamics were primarily governed by soil matrices and fertilizer application [50], resulting in low TK variability. In contrast, TP exhibited high variability, likely because some soils in the study area were farmland subjected to P-rich fertilization.

4.2. Effects of Spatial Distribution and Soil Depth on Soil Stoichiometric Ratios

Ecological stoichiometry provides insights into soil–plant interactions. Plants influence soil nutrient contents through nutrient uptake, apoplastic inputs, and root secretions, modifying ecological stoichiometric ratios [51]. The soil C:N ratio reflects the decomposition rate of soil OM, as biomineralization and stabilization of soil C and N occur simultaneously [52]. Lower C:N ratio indicates faster OM decomposition rates. The soil C:P ratio responds to P mineralization, determining whether OM is mineralized by microorganisms, thereby releasing or immobilizing P [53]. A lower soil C:P ratio facilitates microbial decomposition of OM, thereby enhancing nutrient release and increasing soil available P. Conversely, a higher C:P ratio inhibits microbial decomposition, resulting in P deficiency that restricts plant growth [54]. The soil N:P ratio reflects N saturation and identifies nutrient limitation thresholds [55]. In this study, maximum values of stoichiometric ratios were observed under AD and AN under E. minor distribution sites. The mean soil C:N, C:P, and N:P ratios varied under distribution area of E. minor in Gansu and ranged from 4.16 to 11.38, 5.88 to 18.29, and 1.05 to 2.97, respectively. These values were significantly lower than China’s depth-averaged soil ratios (11.9, 61, and 5.2) [39], and global averages (14.3, 186, and 13.1) [56]. The results indicate that soil OM decomposition and mineralization rates are elevated in E. minor habitats, while soil P demonstrates high availability, and N availability remains limited.
The results of this study revealed significant differences in soil C:N, C:P, and N:P ratios across different soil layers. These variations likely stem from substantial differences in OM and N content, driven by diverse sources and influencing factors. This finding contradicts previous conclusions where soil C:N ratio spatial distribution remains relatively stable [57]. Moreover, in this study, soil stoichiometry exhibited inconsistent trends with depth across different sampling areas. In HN, WD, XH, and KT, soil C:N and C:P ratios increased with increasing soil depth, while the N:P ratio decreased. This aligns with Long et al. [58], who reported lower surface soil C:N and C:P ratios but higher N:P ratio compared to deeper soil layers, suggesting N limitation in surface soils at these sites. Conversely, in AN and YZ, the C:N ratio increased while the C:P and N:P ratios decreased with increasing soil depth, consistent with Shen et al. [59]. Contrary to the findings of Yang et al. [60], who reported increase C:P ratio and N:P ratio and a decreasing in C:N ratio with soil depth in Caragana shrub soils. This discrepancy may be differences in vegetation type, the shallow root system of E. minor, its limited N fixation capacity, and the lower OM content in deeper soil layers [61]. In AD and MJ, soil C:N and C:P ratios decreased with increasing soil depth, whereas the N:P ratio increased. These findings align with Wang et al. [62], who observed a significant decline in C:N and C:P ratios and an increase in N:P ratio with increasing in soil depth. The results suggest that the topsoil in these regions exhibits high carbon storage capacity, which enhances soil quality and promotes carbon sequestration.

4.3. Factors Influencing Soil Nutrients and Stoichiometric Ratios

The results of this study demonstrated that soil OM in the 0–10 cm and 10–20 cm layers was positively correlated with altitude, with lower altitudes generally exhibiting lower OM content. This pattern may be attributed to higher soil water content and elevated temperatures at lower altitudes [63], which promote plant growth and microbial activity, thereby accelerating OM decomposition. The weak correlation between the remaining nutrient, stoichiometric ratios, and altitude could be explained by the confounding influence of slope, which may diminish the effect of altitude [64]. This is further supported by studies demonstrating that soil nutrients accumulate in the lowest slopes due to runoff and erosion [65]. Soil TP was positively correlated with AK, likely because element P enhances the input of apoplastic nutrients and microbial biomass into the soil, thereby improving elemental K availability to plants [66]. Soil pH influences nutrient formation and transformation by modifying the geochemical environment and microbial abundance, community structure, and activity [57]. In the 0–10 cm soil layer, soil pH was negatively correlated with TP. As pH increased, the soil became more alkaline, reducing the availability of P. These findings align with prior research demonstrating that soil pH influences nutrient accessibility [67], and significantly affects AP. In the 20–30 cm layer, the soil N:P ratio was positively correlated with TN but negatively correlated with the C:N ratio, suggesting that deep soil P remains more stable, while stoichiometric ratios are primarily N-dependent. These nutrients and stoichiometric ratios may be influenced not only by altitude, vegetation, microbial communities, topography, and soil texture but also by anthropogenic disturbances.

4.4. Ecological Adaptation Strategies of E. minor Driven by Soil Nutrient Heterogeneity

In this study, the soil in the distribution area of E. minor was alkaline, and the TP content in the surface soil exhibited a significant negative correlation with pH (p < 0.05). High pH conditions reduced P availability, suggesting that the E. minor may adapt by secreting organic acids to decrease pH and enhance P uptake locally [68]. Additionally, in deeper high-pH soils, the plant may facilitate slow colonization by concentrating mycelium around its roots [69], further improving P acquisition. Soil conditions varied significantly across distribution areas, with soil nutrient content displaying considerable variability. Such heterogeneity likely imposes strong adaptive demands on E. minor, where phenotypic plasticity is a key strategy for coping with environmental variation. The root strategy is highly effective for nutrient acquisition in plants [70], often involving modifications such as increasing the number of root tips, specific root length, specific root area, and root biomass [71]. E. minor exhibits a shallow, fibrous root system, enabling rapid uptake of nutrients in topsoil under favorable conditions, while expanding root biomass and distribution enhances nutrient capture in nutrient-poor soils. The mycorrhizal strategy involves a symbiotic association between plants and fungi, where plants obtain N, P, and other nutrients provided by symbiotic fungi by providing a carbon source for fungi [72]. However, nutrient acquisition using the mycorrhizal strategy requires high energy consumption. Wu et al. demonstrated that the root strategy is the main one when an individual is subject to limitations in N or P, whereas the mycorrhizal strategy is the main nutrient acquisition strategy in karst ecosystems under N and P co-limitation. Given the short stature, low biomass, and modest nutrient demands of E. minor, along with the N-limited conditions of its habitat, the species likely relies primarily on root strategy adaptations to optimize nutrient uptake.

5. Conclusions

In our research, we estimated the nutrient contents and stoichiometric ratios in varied distribution areas of E. minor in Gansu Province [73]. This experiment concludes that environmental differences across various distribution areas of E. minor resulted in significant variations in soil nutrient contents and stoichiometric ratios. The HN and AD sites showed the highest nutrient accumulation, indicating their soils are more potent to preserve and conserve nutrients for the long term and is more op-posed to deterioration than other investigated E. minor distribution sites. Moreover, soil nutrient contents varied considerably with depth—irrespective of E. minor distribution areas—as OM, N, and P contents decreased progressively toward deeper soil layers, being highest concentrations were in the topsoil. The soil in the distribution area of E. minor was N-limited. Changes in soil stoichiometric ratios with depth varied inconsistent among different distribution areas. While soil nutrient levels were primarily influenced by altitude, deeper soil stoichiometry was mainly governed by N availability. Future research should integrate plant physiological indicators (e.g., leaf C:N:P ratios, enzymatic activity) and microbial community analyses to comprehensively elucidate its adaptive mechanisms. Consequently, this study highlights the need for sustainable E. minor management that can facilitate a higher soil organic matter, which ultimately increases the soil health and ecological balance, and, eventually, serve the worldwide sustainability purpose. Our findings contribute to understanding the relationship between environmental factors, soil nutrients and stoichiometry under various distribution areas of E. minor offering insights for mitigating climate change and managing soil under E. minor ecosystems.

Author Contributions

Conceptualization, S.H., X.B. and F.R.; formal analysis, S.H. and X.B.; investigation, S.H., H.W. and S.D.; data curation, S.H.; writing—original draft preparation, S.H.; writing—review and editing, F.R., Q.R. and M.S.; supervision, X.B.; project administration, X.B.; funding acquisition, X.B. All authors have read and agreed to the published version of the manuscript.

Funding

This work was supported by Gansu Province Science and Technology Plan Project (20JR10RA564); Gansu Province University Industry Support Program (2025CYZC-040); Gansu Forestry and Grassland Bureau Grassland Ecological Restoration and Management Science and Technology Support Project (GSLC-2020-3, GSLC-20210021, GSLC-2022-0722133); Gansu Forestry and Grassland Bureau Grassland Health and Degradation Assessment Science and Technology Support Project (LCJ20240177); Gansu Province Human Resources and Social Security Department Postdoctoral Initiation Funding Project (03824035); Major Cultivation Program for Research Innovation Platforms in Universities of Gansu Province (2024CXPT-07).

Data Availability Statement

The data are included in the article.

Acknowledgments

We are grateful to the reviewers and the handling editor for providing insightful comments and suggestions. We are thankful to the Editor-in-Chief and anonymous reviewers for their insightful and constructive comments, which increased the article’s quality.

Conflicts of Interest

The authors declare that the research was conducted in the absence of any commercial or financial relationships that could be construed as a potential conflict of interest.

References

  1. Fan, H.B.; Wu, J.; Liu, W.F.; Yuan, Y.H.; Hu, L.; Cai, Q.K. Linkages of Plant and Soil C:N:P Stoichiometry and Their Relationships to Forest Growth in Subtropical Plantations. Plant Soil 2015, 392, 127–138. [Google Scholar] [CrossRef]
  2. Wasaya, A.; Tahir, M.; Ali, H.; Hussain, M.; Yasir, T.A.; Sher, A.; Ijaz, M.; Sattar, A. Influence of Varying Tillage Systems and Nitrogen Application on Crop Allometry, Chlorophyll Contents, Biomass Production and Net Returns of Maize (Zea mays L.). Soil Tillage Res. 2017, 170, 18–26. [Google Scholar] [CrossRef]
  3. Wang, M.M.; Chen, H.S.; Zhang, W.; Wang, K.L. Soil Nutrients and Stoichiometric Ratios as Affected by Land Use and Lithology at County Scale in a Karst Area, Southwest China. Sci. Total Environ. 2018, 619–620, 1299–1307. [Google Scholar] [CrossRef]
  4. Joshi, R.K.; Garkoti, S.C. Influence of Vegetation Types on Soil Physical and Chemical Properties, Microbial Biomass and Stoichiometry in the Central Himalaya. Catena 2023, 222, 106835. [Google Scholar] [CrossRef]
  5. Zhao, F.Z.; Sun, J.; Ren, C.J.; Kang, D.; Deng, J.; Han, X.H.; Yang, G.H.; Feng, Y.Z.; Ren, G.X. Land Use Change Influences Soil C, N and P Stoichiometry under ‘Grain-to-Green Program’ in China. Sci. Rep. 2015, 5, 10195. [Google Scholar] [CrossRef]
  6. Yang, Z.P.; Baoyin, T.; Li, F.Y. Long-Term Effects of Restoration Measures on Soil C and C: Nutrient Ratios in a Semiarid Steppe. Ecol. Eng. 2020, 153, 105913. [Google Scholar] [CrossRef]
  7. Tao, Y.; Zhou, X.B.; Zhang, S.H.; Lu, H.Y.; Shao, H.B. Soil Nutrient Stoichiometry on Linear Sand Dunes from a Temperate Desert in Central Asia. Catena 2020, 195, 104847. [Google Scholar] [CrossRef]
  8. Zhang, Q.F.; Xie, J.S.; Lyu, M.K.; Xiong, D.C.; Wang, J.; Chen, Y.M.; Li, Y.; Wang, M.K.; Yang, Y.S. Short-Term Effects of Soil Warming and Nitrogen Addition on the N:P Stoichiometry of Cunninghamia lanceolata in Subtropical Regions. Plant Soil 2017, 411, 395–407. [Google Scholar] [CrossRef]
  9. Chen, Z.X.; Xu, X.; Wen, Y.L.; Cheng, M.; Wang, X. The Critical Role of Soil Ecological Stoichiometric Ratios: How Does Reforestation Improve Soil Nitrogen and Phosphorus Availability? Plants 2024, 13, 2320. [Google Scholar] [CrossRef]
  10. Kousar, R.; Lone, A.H.; Shah, Z.A.; Dar, E.A.; Mir, M.S.; Alkeridis, L.A.; Al-Shuraym, L.A.; Ganie, M.A.; Bhat, J.A.; Alshehri, M.A.; et al. Farm-Scale Soil Spatial Variability at a Mountain Research Centre in Northwestern Himalayas. Sci. Rep. 2025, 15, 19705. [Google Scholar] [CrossRef]
  11. Zhang, Y.; Li, C.; Wang, M.L. Linkages of C: N: P Stoichiometry between Soil and Leaf and Their Response to Climatic Factors along Altitudinal Gradients. J. Soils Sediments 2019, 19, 1820–1829. [Google Scholar] [CrossRef]
  12. Xu, X.; Cheng, Y.W.; Jiang, H.L.; Li, X.; Liu, Y.H. Research Progress of the Effects of Wind Speed Change on Grassland Ecosystem. Acta Ecol. Sin. 2017, 37, 4289–4298. [Google Scholar] [CrossRef]
  13. Huang, Y.P.; Wang, Q.Q.; Zhang, W.J.; Zhu, P.; Xiao, Q.; Wang, C.J.; Wu, L.; Tian, Y.F.; Xu, M.G.; Gunina, A. Stoichiometric Imbalance of Soil Carbon and Nutrients Drives Microbial Community Structure under Long-Term Fertilization. Appl. Soil Ecol. 2021, 168, 104119. [Google Scholar] [CrossRef]
  14. Committee of Flora of China, Chinese Academy of Sciences. Flora of China; Science Press: Beijing, China, 1990. [Google Scholar]
  15. Wróbel, A.; Nobis, M.; Nowak, A. Patterns of the Lemma Micromorphology: A Useful Tool in Taxonomy of the Middle Asian Eragrostis Species (Poaceae). Bot. Lett. 2017, 164, 253–262. [Google Scholar] [CrossRef]
  16. Li, X.R.; Zhou, H.Y.; Wang, X.P.; Liu, L.C.; Zhang, J.; Chen, G.X.; Zhang, Z.S.; Liu, Y.B.; Tan, H.J.; Guo, Y.H. Ecological Restoration and Recovery in Arid Desert Regions of China: A Review for 60-Year Research Progresses of Shapotou Desert Research and Experiment Station, Chinese Academy of Sciences. J. Desert. Res. 2016, 36, 247–264. [Google Scholar]
  17. Hutang, G.R.; Tong, Y.; Zhu, X.; Gao, L.Z. Genome Size Variation and Polyploidy Prevalence in the Genus Eragrostis Are Associated with the Global Dispersal in Arid Area. Front. Plant Sci. 2023, 14, 1066925. [Google Scholar] [CrossRef]
  18. Zhu, F. Chemical Composition and Food Uses of Teff (Eragrostis tef). Food Chem. 2018, 239, 402–415. [Google Scholar] [CrossRef]
  19. Carloto, B.W.; Buriol, G.A.; Dornelles, S.H.B.; Trivisiol, V.S.; Peripolli, M.; Escobar, O.S. Morphological and Phenological Responses of Eragrostis plana Nees and Eragrostis pilosa (L.) P. Beauv. Plants Subjected to Different Soil Moisture Conditions. Planta Daninha 2019, 37, e019217246. [Google Scholar] [CrossRef]
  20. Barretto, R.; Buenavista, R.M.; Rivera, J.L.; Wang, S.; Prasad, P.V.; Siliveru, K. Teff (Eragrostis tef) Processing, Utilization and Future Opportunities: A Review. Int. J. Food Sci. Technol. 2021, 56, 3125–3137. [Google Scholar] [CrossRef]
  21. Habtegebrial, K.; Singh, B.R.; Haile, M. Impact of Tillage and Nitrogen Fertilization on Yield, Nitrogen Use Efficiency of Tef (Eragrostis tef (Zucc.) Trotter) and Soil Properties. Soil Tillage Res. 2007, 94, 55–63. [Google Scholar] [CrossRef]
  22. Fiorenza, M.; Dotto, D.B.; Boligon, A.A.; Boligon, A.A.; Athayde, M.L.; Vestena, S. Phytochemical analysis and allelopathic activity of Eragrostis plana nees (capim-annoni). Iheringia Ser. Bot. 2016, 71, 193–200. [Google Scholar]
  23. Favaretto, A.; Cantrell, C.L.; Fronczek, F.R.; Duke, S.O.; Wedge, D.E.; Ali, A.; Scheffer-Basso, S.M. New Phytotoxic Cassane-like Diterpenoids from Eragrostis plana. J. Agric. Food Chem. 2019, 67, 1973–1981. [Google Scholar] [CrossRef] [PubMed]
  24. Klein Hendges, A.P.P.; dos Santos, E.F.; Teixeira, S.D.; Santana, F.S.; Trezzi, M.M.; Batista, A.N.L.; Batista, J.M., Jr.; de Lima, V.A.; Marques, F.D.A.; Sales Maia, B.H.L.N. Phytotoxic Neocassane Diterpenes from Eragrostis plana. J. Nat. Prod. 2020, 83, 3511–3518. [Google Scholar] [CrossRef]
  25. Haddadi, B.S.; Fang, R.; Girija, A.; Kattupalli, D.; Widdowson, E.; Beckmann, M.; Yadav, R.; Mur, L.A.J. Metabolomics Targets Tissue-Specific Responses in Alleviating the Negative Effects of Salinity in Tef (Eragrostis tef) during Germination. Planta 2023, 258, 67. [Google Scholar] [CrossRef]
  26. Xie, B.; Wang, Q.; Huang, B.; Chen, Y.; Yang, J.; Qi, P. Coordinated State Analysis and Differential Regulation of Territorial Spatial Functions in Underdeveloped Regions: A Case Study of Gansu Province, China. Sustainability 2022, 14, 950. [Google Scholar] [CrossRef]
  27. Bao, S.D. Soil Agrochemical Analysis, 3rd ed.; China Agricultural Publishing House: Beijing, China, 2000. [Google Scholar]
  28. LY/T 1237-1999; Determination of Organic Matter in Forest Soil and Calculation of Carbon-Nitrogen Ratio. State Forestry Administration: Beijing, China, 1999.
  29. LY/T 1228-2015; Nitrogen Determination Methods of Forest Soils. State Forestry Administration: Beijing, China, 2015.
  30. NY/T 88-1988; Method for Determination of Soil Total Phosphorus. Ministry of Agriculture: Beijing, China, 1988.
  31. LY/T 1232-2015; Phosphorus Determination Methods of Forest Soils. State Forestry Administration: Beijing, China, 2015.
  32. NY/T 87-1988; Method for Determination of Total Potassium in Soils. Ministry of Agriculture: Beijing, China, 1988.
  33. LY/T 1234-2015; Potassium Determination Methods of Forest Soils. State Forestry Administration: Beijing, China, 2015.
  34. Song, S.M.; Zhou, H.Y.; Li, P.X.; Zhang, L.; Su, D.W.; Zheng, D.; Zhang, Z.X.; Luo, Z.Z.; Yu, S.K.; Liu, B.; et al. Carbon, Nitrogen, and Phosphorus Ecological Stoichiometry in Cenchrus fungigraminus and Soil under Waterlogging Stress. Plant Soil 2025. [Google Scholar] [CrossRef]
  35. Wu, W.; Liu, H.B. Estimation of Soil pH with Geochemical Indices in Forest Soils. PLoS ONE 2019, 14, e0223764. [Google Scholar] [CrossRef]
  36. Hartemink, A.E.; Barrow, N.J. Soil pH—Nutrient Relationships: The Diagram. Plant Soil 2023, 486, 209–215. [Google Scholar] [CrossRef]
  37. Liu, R.S.; Wang, D.M. Soil C, N, P and K Stoichiometry Affected by Vegetation Restoration Patterns in the Al-pine Region of the Loess Plateau, Northwest China. PLoS ONE 2020, 15, e0241859. [Google Scholar] [CrossRef]
  38. Zewd, I.; Siban, M. The Effects of Alkalinity on Physical and Chemical Properties of Soil. J. Plant Biol. Agric. Sci. 2021, 3, 1–5. [Google Scholar]
  39. Tian, H.Q.; Chen, G.S.; Zhang, C.; Melillo, J.M.; Hall, C.A.S. Pattern and Variation of C:N:P Ratios in China’s Soils: A Synthesis of Observational Data. Biogeochemistry 2010, 98, 139–151. [Google Scholar] [CrossRef]
  40. Zhu, Q.L.; Xing, X.; Zhang, H.; An, S.S. Soil Ecological Stoichiometry under Different Vegetation Area on Loess Hilly-Gully Region. Acta Ecol. Sin. 2013, 33, 4674–4682. [Google Scholar] [CrossRef]
  41. Ma, J.; Li, L.H.; Guo, L.P.; Bai, L.; Zhang, J.R.; Chen, Z.H.; Ahmad, S. Variation in Soil Nutrients in Grasslands along the Kunes River in Xinjiang, China. Chem. Ecol. 2015, 31, 111–122. [Google Scholar] [CrossRef]
  42. Liu, X.; Ma, J.; Ma, Z.W.; Li, L.H. Soil Nutrient Contents and Stoichiometry as Affected by Land-Use in an Agro-Pastoral Region of Northwest China. Catena 2017, 150, 146–153. [Google Scholar] [CrossRef]
  43. McLauchlan, K. The Nature and Longevity of Agricultural Impacts on Soil Carbon and Nutrients: A Review. Ecosystems 2006, 9, 1364–1382. [Google Scholar] [CrossRef]
  44. Wang, H.F.; Zhu, X.A.; Zakari, S.; Chen, C.F.; Liu, W.J.; Jiang, X.J. Assessing the Effects of Plant Roots on Soil Water Infiltration Using Dyes and Hydrus-1D. Forests 2022, 13, 1095. [Google Scholar] [CrossRef]
  45. Clemmensen, K.E.; Bahr, A.; Ovaskainen, O.; Dahlberg, A.; Ekblad, A.; Wallander, H.; Stenlid, J.; Finlay, R.D.; Wardle, D.A.; Lindahl, B.D. Roots and Associated Fungi Drive Long-Term Carbon Sequestration in Bore-al Forest. Science 2013, 339, 1615–1618. [Google Scholar] [CrossRef]
  46. Fadeyibi, M.; Sawyerr, H.O.; Opasola, O.A. Enhancing Soil-Derived Bioactive Metabolites for Controlling Staphylococcal Nosocomial Infections through Environmental Interactions. Discov. Appl. Sci. 2025, 7, 615. [Google Scholar] [CrossRef]
  47. Zhang, Y.L.; Chen, L.J.; Chen, X.H.; Tan, M.L.; Duan, Z.H.; Wu, Z.J.; Li, X.J.; Fan, X.H. Response of Soil Enzyme Activity to Long-Term Restoration of Desertified Land. Catena 2015, 133, 64–70. [Google Scholar] [CrossRef]
  48. Wang, C.Q.; Kuzyakov, Y. Soil Organic Matter Priming: The PH Effects. Glob. Change Biol. 2024, 30, e17349. [Google Scholar] [CrossRef]
  49. Yu, Y.H.; Chi, Y.K. Ecological Stoichiometric Characteristics of Soilat Different Depths in a Karst Plateau Mountain Area of China. Pol. J. Environ. Stud. 2019, 29, 969–978. [Google Scholar] [CrossRef]
  50. Zhang, X.Y.; Sui, Y.Y.; Zhang, X.D.; Meng, K.; Herbert, S.J. Spatial Variability of Nutrient Properties in Black Soil of Northeast China. Pedosphere 2007, 17, 19–29. [Google Scholar] [CrossRef]
  51. Tian, L.M.; Zhao, L.; Wu, X.D.; Fang, H.B.; Zhao, Y.H.; Hu, G.J.; Yue, G.; Sheng, Y.; Wu, J.C.; Chen, J.; et al. Soil Moisture and Texture Primarily Control the Soil Nutrient Stoichiometry across the Tibetan Grassland. Sci. Total Environ. 2018, 622–623, 192–202. [Google Scholar] [CrossRef] [PubMed]
  52. Xie, J.; Chang, S.L.; Zhang, Y.T.; Wang, H.J.; Song, C.C.; He, P.; Sun, X.J. Plant and Soil Ecological Stoichiometry with Vertical Zonality on the Northern Slope of the Middle Tianshan Mountains. Acta Ecol. Sin. 2016, 36, 4363–4372. [Google Scholar]
  53. Exbrayat, J.-F.; Pitman, A.J.; Zhang, Q.; Abramowitz, G.; Wang, Y.-P. Examining Soil Carbon Uncertainty in a Global Model: Response of Microbial Decomposition to Temperature, Moisture and Nutrient Limitation. Biogeosciences 2013, 10, 7095–7108. [Google Scholar] [CrossRef]
  54. Yang, Y.; Liu, H.; Yang, X.; Yao, H.J.; Deng, X.Q.; Wang, Y.Q.; An, S.S.; Kuzyakov, Y.; Chang, S.X. Plant and Soil Elemental C:N:P Ratios Are Linked to Soil Microbial Diversity during Grassland Restoration on the Loess Plateau, China. Sci. Total Environ. 2022, 806, 150557. [Google Scholar] [CrossRef]
  55. Zhao, F.Z.; Kang, D.; Han, X.H.; Yang, G.H.; Yang, G.H.; Feng, Y.Z.; Ren, G.X. Soil Stoichiometry and Carbon Storage in Long-Term Afforestation Soil Affected by Understory Vegetation Diversity. Ecol. Eng. 2015, 74, 415–422. [Google Scholar] [CrossRef]
  56. Cleveland, C.C.; Liptzin, D. C:N:P Stoichiometry in Soil: Is There a “Redfield Ratio” for the Microbial Biomass? Biogeochemistry 2007, 85, 235–252. [Google Scholar] [CrossRef]
  57. Yang, H.; Zhang, P.; Zhu, T.B.; Li, Q.; Cao, J.H. The Characteristics of Soil C, N, and P Stoichiometric Ratios as Affected by Geological Background in a Karst Graben Area, Southwest China. Forests 2019, 10, 601. [Google Scholar] [CrossRef]
  58. Long, Y.Y.; Zhang, D.D.; Wu, H.M.; Li, J.S.; Xiong, P.F.; Zhao, G.H.; Liu, H.; Wu, B.R.; Zhang, Z. Patterns and Driving Mechanisms of Soil Organic Carbon, Nitrogen, and Phosphorus, and Their Stoichiometry in Lime-stone Mines of Anhui Province, China. Forests 2024, 15, 1969. [Google Scholar] [CrossRef]
  59. Shen, A.H.; Zhao, N.; Shi, Y.; Mi, W.; She, J.; Zhang, F.H.; Guo, R.; Wu, T.; Li, Z.G.; Li, J.; et al. Soil Ecological Stoichiometry in Varied Micro-Topographies of an Alluvial Fan at Eastern Helan Mountains, Northwest China. J. Arid Land 2024, 16, 1648–1663. [Google Scholar] [CrossRef]
  60. Yang, Y.; Liu, B.R. Effects of Planting Caragana Shrubs on Soil Nutrients and Stoichiometries in Desert Steppe of Northwest China. Catena 2019, 183, 104213. [Google Scholar] [CrossRef]
  61. Yang, H.Y.; Zhang, G.; Zhang, B.J. Growth Characteristics of Typical Plant Communities on Gully Slopes in the Loess Hilly-Gully Region. Res. Soil. Water Conserv. 2019, 26, 62–67. [Google Scholar] [CrossRef]
  62. Wang, X.Y.; Xue, X.; Zhang, Y.; Qin, S.G.; You, Q.G.; Duan, Y.L.; Wang, L.L.; Chen, J.; Liu, J.; Yao, B.; et al. Divergent Mechanisms Driving Nutrient Stoichiometry in Surface and Deep Soils of Desert Ecosystems on the Qinghai–Tibetan Plateau. Catena 2024, 246, 108417. [Google Scholar] [CrossRef]
  63. Liao, K.H.; Lai, X.; Zhou, Z.W.; Zhu, Q. Applying Fractal Analysis to Detect Spatio-Temporal Variability of Soil Moisture Content on Two Contrasting Land Use Hillslopes. Catena 2017, 157, 163–172. [Google Scholar] [CrossRef]
  64. Zhu, Q.; Liao, K.H.; Lai, X.; Lv, L.G. Scale-dependent Effects of Environmental Factors on Soil Organic Carbon, Soil Nutrients and Stoichiometry under Two Contrasting Land-use Types. Soil Use Manag. 2021, 37, 243–256. [Google Scholar] [CrossRef]
  65. Arunrat, N.; Sereenonchai, S.; Kongsurakan, P.; Hatano, R. Assessing Soil Organic Carbon, Soil Nutrients and Soil Erodibility under Terraced Paddy Fields and Upland Rice in Northern Thailand. Agronomy 2022, 12, 537. [Google Scholar] [CrossRef]
  66. Zhu, F.F.; Lu, X.K.; Liu, L.; Mo, J.M. Phosphate Addition Enhanced Soil Inorganic Nutrients to a Large Extent in Three Tropical Forests. Sci. Rep. 2015, 5, 7923. [Google Scholar] [CrossRef]
  67. Chen, Y.P.; Li, S.K.; Zeng, L.; An, B.; Xiao, T.Q.; Mao, R.; Zhang, Y. Effects of Mycorrhizal and Extraradical Hyphae of Subtropical Native Tree Species on Soil Enzyme Activities and Their Stoichiometric Ratios. Forests 2023, 14, 2112. [Google Scholar] [CrossRef]
  68. Wang, Z.C.; Zhao, J.; Xiao, D.; Chen, M.F.; He, X.Y. Higher Colonization but Lower Diversity of Root-Associated Arbuscular Mycorrhizal Fungi in the Topsoil than in Deep Soil. Appl. Soil Ecol. 2024, 194, 105195. [Google Scholar] [CrossRef]
  69. Maherali, H.; Klironomos, J.N. Influence of Phylogeny on Fungal Community Assembly and Ecosystem Functioning. Science 2007, 316, 1746–1748. [Google Scholar] [CrossRef] [PubMed]
  70. Eissenstat, D.M.; Kucharski, J.M.; Zadworny, M.; Adams, T.S.; Koide, R.T. Linking Root Traits to Nutrient Foraging in Arbuscular Mycorrhizal Trees in a Temperate Forest. New Phytol. 2015, 208, 114–124. [Google Scholar] [CrossRef] [PubMed]
  71. Pan, F.J.; Qian, Q.; Liang, Y.M.; Wang, K.L.; Zhang, W. Spatial Variations in Fine Root Turnover, Biomass, and Necromass of Two Vegetation Types in a Karst Ecosystem, Southwestern China. Forests 2022, 13, 611. [Google Scholar] [CrossRef]
  72. Serrano, K.; Bezrutczyk, M.; Goudeau, D.; Dao, T.; O’Malley, R.; Malmstrom, R.R.; Visel, A.; Scheller, H.V.; Cole, B. Spatial Co-Transcriptomics Reveals Discrete Stages of the Arbuscular Mycorrhizal Symbiosis. Nat. Plants 2024, 10, 673–688. [Google Scholar] [CrossRef]
  73. Wu, X.; Liang, Y.M.; Zhao, W.; Pan, F.J. Root and Mycorrhizal Nutrient Acquisition Strategies in the Succession of Subtropical Forests under N and P Limitation. BMC Plant Biol. 2025, 25, 8. [Google Scholar] [CrossRef] [PubMed]
Figure 1. Location map of the study area and sampling sites in Gansu Province of China (Image procured from ArcGIS 10.8 software).
Agronomy 15 01996 g001
Figure 2. Soil properties at different soil layers under distribution area of E. minor in Gansu Province. (a) The soil pH under various E. minor sites; and (b) soil OM under different E. minor sites. AN: Lanzhou Anning; AD: Dingxi Anding; YZ: Lanzhou Yuzhong; HN: Baiyin Huining; MJ: Tianshui Maiji; WD: Longnan Wudu; XH: Longnan Xihe; KT: Pingliang Kongtong. Vertical error bars signify the corresponding standard error of mean values; n = 3. Capital letters indicate significant differences between E. minor sampling sites in the same soil layer (p < 0.05) whilst lowercase letters display significant differences between different soil strata in the sampling sites (p < 0.05). Significant differences were determined by Duncan’s test.
Agronomy 15 01996 g002
Figure 3. Soil nutrients under E. minor distribution sites in Gansu Province at various soil depths. (af) are the soil total nitrogen, available nitrogen, total phosphorous, available phosphorous, total potassium, and available potassium under various E. minor sites. AN: Lanzhou Anning; AD: Dingxi Anding; YZ: Lanzhou Yuzhong; HN: Baiyin Huining; MJ: Tianshui Maiji; WD: Longnan Wudu; XH: Longnan Xihe; KT: Pingliang Kongtong. Vertical error bars show the corresponding standard error of mean values; n = 3. Capital letters indicate significant differences between E. minor sampling sites in the similar soil depth (p < 0.05) whilst lowercase letters display significant differences between different soil strata in the sampling sites (p < 0.05). Significant differences were determined by Duncan’s test.
Agronomy 15 01996 g003
Figure 4. Soil stoichiometric ratios under E. minor distribution sites in Gansu Province at different soil layers. (ac) are the C:N ratio, C:P ratio and N:P ratio under various E. minor sites. AN: Lanzhou Anning; AD: Dingxi Anding; YZ: Lanzhou Yuzhong; HN: Baiyin Huining; MJ: Tianshui Maiji; WD: Longnan Wudu; XH: Longnan Xihe; KT: Pingliang Kongtong. Vertical error bars show the corresponding standard error of mean values; n = 3. Capital letters indicate significant differences between E. minor sampling sites in the same soil layer (p < 0.05) whilst lowercase letters display significant differences between different soil strata in the sampling sites (p < 0.05). Significant differences were determined by Duncan’s test.
Agronomy 15 01996 g004
Figure 5. Heatmap correlation analysis of soil nutrients, stoichiometric ratios and environmental factors. Indicates significance at: * p < 0.05 and ** p < 0.01. Note: the abbreviated words stand for OM: organic matter; TN: total nitrogen; TP: total phosphorous; TK: total potassium; AN: available nitrogen; AP: available phosphorous; AK: available potassium; ALT: Altitude; MAP: mean annual precipitation; MAT: mean annual temperature.
Agronomy 15 01996 g005
Table 1. Basic information for each sampling location at different places in Gansu Province.
Sampling LocationCodeLongitudeLatitudeALT (m)MAP (mm)MAT (°C)Habitat
Lanzhou AnningAN103°41′ E36°08′ N1535.5294.119.92Edge of a farmland
Dingxi AndingAD104°38′ E35°56′ N1750.1288.316.50Side of the highway
Lanzhou YuzhongYZ103°58′ E36°00′ N1733.3119.816.17Under the Shrubs
Baiyin HuiningHN104°46′ E36°04′ N1623.1207.018.25The apple orchard
Tianshui MaijiMJ105°51′ E34°34′ N1084.5212.125.08Roadside
Longnan WuduWD104°54′ E33°24′ N1008.2669.926.25Edge of a farmland
Longnan XiheXH105°19′ E34°02′ N1528.9531.026.92The cherry orchard
Pingliang KongtongKT106°43′ E35°33′ N1339.8561.620.17Roadside
Note ALT, Altitude; MAP, mean annual precipitation; MAT, mean annual temperature.
Table 2. Descriptive statistics of soil quality indicators in different distribution areas of Eragrostis minor Host.
ParametersMinimumMaximumMeanStandard DeviationCoefficient of Variation (%)
pH8.109.888.730.384.32
OM (g kg−1)6.3225.3714.935.2835.33
TN (g kg−1)0.603.651.390.6546.90
AN (mg kg−1)49.47282.25111.9754.8849.01
TP (g kg−1)0.421.400.760.2837.10
AP (mg kg−1)0.9013.295.053.2063.33
TK (g kg−1)8.5619.2613.342.4518.40
AK (mg kg−1)47.00410.00204.94121.6959.38
C:N ratio3.1715.826.903.0043.40
C:P ratio5.1820.7412.024.0934.02
N:P ratio0.683.281.920.7338.11
Disclaimer/Publisher’s Note: The statements, opinions and data contained in all publications are solely those of the individual author(s) and contributor(s) and not of MDPI and/or the editor(s). MDPI and/or the editor(s) disclaim responsibility for any injury to people or property resulting from any ideas, methods, instructions or products referred to in the content.