Article

Stage-Specific Light Intensity Optimization for Yield and Energy Efficiency in Plant Factory Potato Pre-Basic Seed Production

1
College of Agriculture, Nanjing Agricultural University, Nanjing 210095, China
2
Guangdong Jieyang Agricultural Reclamation Group Co., Ltd., Jieyang 522000, China
*
Author to whom correspondence should be addressed.
Agronomy 2025, 15(8), 1976; https://doi.org/10.3390/agronomy15081976
Submission received: 30 June 2025 / Revised: 13 August 2025 / Accepted: 14 August 2025 / Published: 15 August 2025

Abstract

This study investigated the effects of light intensity regulation on yield and energy efficiency during potato pre-basic seed propagation in plant factories. Using virus-free ‘Favorita’ potato seedlings as experimental material, gradient light intensities (200, 300, and 400 μmol·m2·s−1) were applied at four developmental stages: the seedling stage (SS), tuber formation stage (TFS), tuber growth stage (TGS), and harvest stage (HS), to explore the physiological mechanisms of stage-specific light intensity regulation and energy utilization efficiency. The results revealed that: (1) The per-plant tuber yield of the high yield group reached 72.91 g (T59 treatment), representing a 25% increase compared to the medium yield group and a 168% increase compared to the low yield group. Additionally, the high yield group exhibited superior leaf area, photosynthetic rate, and accumulation of sucrose and starch. (2) The impact of light intensity on tuber development exhibited stage specificity: low light intensity (200 μmol·m−2·s−1) during TFS promoted early tuber initiation, while a high light intensity (400 μmol·m−2·s−1) enhanced tuber formation efficiency. Increasing the light intensity during TGS facilitated the accumulation of sucrose and starch in tubers. (3) Energy use efficiency (EUE) increased significantly with yield, with the high yield group reaching 3.2 g MJ−1, representing 52% and 88% improvements over the medium yield (2.1 g MJ−1) and low yield (1.7 g MJ−1) groups, respectively. A “stage-specific precision light supplementation” strategy was proposed, involving moderate light reduction (200 μmol·m−2·s−1) during TFS and light enhancement (300 μmol·m−2·s−1) during TGS to coordinate source-sink relationships and optimize carbohydrate metabolism. This study provides a theoretical basis for efficient potato production in plant factories.

1. Introduction

The potato (Solanum tuberosum L.), owing to its advantages in water use efficiency and per-unit yield, has emerged as a crucial crop for enhancing global food production [1]. Although China ranks first in terms of potato cultivation area, its per-unit yield lags behind countries like the Netherlands due to the low utilization rate of high-quality seed tubers (known as “pre-elite seeds”). Plant factories, leveraging their controllable environmental conditions and year-round production capabilities, offer effective solutions to the challenges in pre-elite seed propagation—such as continuous cropping obstacles, seasonal constraints, and viral infections—thereby improving propagation efficiency and increasing the utilization rate of these seeds [1].
The key to large-scale production of pre-elite seeds in plant factories lies in establishing appropriate light strategies. There has been relatively clear research on photoperiod and light quality regulation strategies for pre-elite seed propagation in plant factories. The photoperiod regulates tuber formation by modulating the expression of SP5G and SP6A. Under short-day conditions, SP5G is suppressed and SP6A is activated to promote tuber formation, while the opposite occurs under long-day conditions [2,3]. At the initiation stage, the expression levels of tuberization-related signals (StBEL5) in leaves under red-blue (RB) light conditions were significantly elevated [4]. However, research on light intensity for potato pre-elite seed propagation in plant factories is currently scarce. Chen et al. [1] explored the impact of light intensity on pre-elite seed propagation under the same daily radiation accumulation. Nevertheless, this study could not accurately reveal the relationship between light intensity and the development and yield of pre-elite seeds because photoperiod was also a variable factor.
Light intensity significantly influences crop growth and development. In plant factories, low light intensity reduces plant leaf area and stem elongation, while high light intensity can easily induce leaf photooxidation [5,6]. Under low light intensity conditions, the content of indole-3-acetic acid (IAA) [7], the activity of phenylalanine ammonia-lyase (PAL) [8], and the photosynthetic rate [9] in plants are all suppressed. Light serves as the fundamental energy source for photosynthesis—the core process governing crop growth and yield—while simultaneously regulating the structural organization and functional efficiency of the photosynthetic apparatus [10]. GO enrichment and KEGG pathway enrichment analyses indicate that genes related to cellular components, biological processes, and molecular functions in rice plants under low light exhibit varying degrees of upregulation or downregulation, with significant downregulation of genes involved in leaf carbon metabolism, plant hormone signal transduction, and photosynthetic carbon fixation [11]. Light intensity markedly regulates leaf stomatal conductance, affecting gas exchange between leaf stomata and the atmosphere [12], which is crucial for the synthesis of leaf photosynthates. Increasing light intensity is beneficial for enhancing crop biomass [13] and secondary metabolite content [14]. Under low light conditions, PN (net photosynthetic rate) is primarily restricted by the supply of photochemically derived ATP and NADPH via the electron transport rate (ETR) [15]. As the light intensity increases, the dominant limitation shifts from ETR-dependent processes to RuBP carboxylation/regeneration capacity [16]. A large-scale meta-analysis (including 760 plant species) revealed that under high light intensity, the xanthophyll cycle is enhanced in plants, promoting the accumulation of violaxanthin, antheraxanthin, and zeaxanthin. The accumulation of these photoprotective pigments may enhance plant adaptability to high light environments through non-photochemical quenching mechanisms [17]. The synthesis and accumulation of photosynthates such as soluble sugars are highly dependent on light intensity [18]. However, some studies have shown that a high light intensity reduces the soluble sugar and free amino acid contents in lettuce leaves [19]. When light intensity exceeds 500 μmol·m−2·s−1, the PN max of lettuce decreases by more than 20% during the late growth stage [20] and the levels of soluble proteins, free amino acids, and DPPH radical scavenging rate in ryegrass plants significantly decrease [21].
Although research has been conducted on the impact of light intensity on crop growth and development in plant factories, covering crops such as lettuce, tomatoes, and cotton, different species and cultivated varieties respond differently to the same light intensity [22]. Given the shift in growth priorities across potato developmental stages, we hypothesize that: (1) critical tuber development phases (TFS, TGS) exhibit differential responses to light intensity; (2) leveraging these phase-specific light intensity responses will enable the development of a lighting strategy that optimizes the tuber yield–energy consumption trade-off. In this study, we investigated the effects of different light intensities under the same photoperiod on the growth, tuber development, yield formation, and energy consumption of potato plants in a plant factory. Our aim is to establish a light intensity regulation method that can promote the large-scale production of pre-elite seeds in plant factories. Therefore, it is essential to clarify the effects of light intensity on the growth and development, physiological metabolism, and yield formation of potato pre-elite seeds. This will help elucidate the mechanisms by which light intensity regulates the formation of pre-elite seeds, facilitate the establishment of precise light intensity setting protocols, optimize plant lighting strategies, and reduce electricity consumption.

2. Materials and Methods

2.1. Plant Materials and Growth Conditions

This study was conducted from March to July 2024 at the Plant Factory of the College of Agriculture, Nanjing Agricultural University, Nanjing, China. The initial phase (March–April 2024, totaling 30 days) involved cultivating potato tissue-cultured seedlings for experimental use. Subsequently, light intensity experiments were performed to evaluate the morphological, physiological, and photosynthetic parameters of potato plants (totaling 90 days).
This experiment used the potato variety ‘Favorita’ as the test material. Tissue-cultured seedlings were prepared in advance. From inoculation to transplantation, they were cultured for a total of 30 days. During the culture period, the photoperiod was set at 16 h and the light intensity was 100 μmol·m−2·s−1 of white light. The tissue-cultured seedlings were transplanted into cultivation frames (with dimensions of 60 × 40 × 18 cm) in a plant factory. A full-factorial experiment was conducted, and different light intensities of 200 μmol·m−2·s−1, 300 μmol·m−2·s−1, and 400 μmol·m−2·s−1 (representing low light intensities, medium light intensities, and high light intensities, respectively) were set for the seedling stage, tuber formation stage, tuber growth stage, and harvest stage, respectively. The specific light treatment schemes are shown in Table 1. LED lamps (Hangzhou Zhuangcheng Lighting Technology Co., Ltd., Hangzhou, China) that emit a composite light consisting of red light (wavelength 620 nm), blue light (wavelength 460 nm), and white light (wavelength 400–700 nm) were used as the artificial light sources. The light intensities ratio of red to blue-white lights was 2:1. To ensure consistent lighting conditions, the distance between the plant canopy and the lamps was maintained at 30 cm for all treatments. Fifteen potato plants were cultivated under each light intensity treatment, with three replicates. During the experiment, the temperature under the light conditions was controlled at 22 ± 1 °C and the temperature under dark conditions was 16 ± 1 °C. The relative humidity was maintained at 70 ± 5%. The CO2 level inside the plant factory was the same as that of the external atmosphere. Hoagland nutrient solution was used for irrigation to provide the necessary nutrients for plant growth and development, and the pH of the nutrient solution was controlled within the range of 5.5–5.8.

2.2. Growth Parameters and Energy Efficiency

After 90 days of light treatment, three plants were randomly selected from each treatment group. Standard methods were employed to measure plant height (a ruler was used to measure the distance from the base of the plant stem to the stem tip), stem diameter (a vernier caliper was employed to measure the diameter at the base of the plant stem), number of leaves (all compound leaves on the same petiole of a potato plant were counted as one leaf, and the total number of leaves on the plant was then tallied), and leaf area. Leaf area was measured by a disc method at the harvest stage. In briefly, thirty 1-cm2 leaves were punched from the leaves with a puncher to measure dry weight as DW1, and the dry weight of the total leaves were measured as DW2. Leaf area was calculated according to the formulas:
Leaf   area = DW 1   ×   30 / DW 2
The plants were then divided into four parts: tubers, leaves, stems, and roots. These parts were placed in an oven at 80 °C and dried to a constant weight. After weighing, the biomass of each plant organ was determined. The electricity consumption for the plant lighting under each treatment was recorded using a DDS863 model electricity meter (Shanghai SII Co., Ltd., Shanghai, China). The effective tuber ratio is the ratio of the number of tubers weighing more than 2 g to the total number of tubers. The energy use efficiency (EUE, g·MJ−1) refers to the tuber biomass (dry weight of tubers, DWtuber) of potato plants produced per megajoule of electrical energy (E, MJ) consumed by the LED plant growth lights [23]. The calculation formula is as follows:
EUE = DW tuber / E

2.3. Photosynthetic Parameters

During the seedling stage (light treatment 0–25 d), tuber formation stage (light treatment 26–40 d), tuber growth stage (light treatment 41–65 d), and harvest stage (light treatment 66–90 d) of potato plants, functional leaves from three randomly selected plants in each treatment group were immersed in a chlorophyll extraction solution (acetone: absolute ethanol = 1:1, v/v) to extract chlorophyll (Chl). The contents of Chl and carotenoids (Car) were measured using the following protocol: Fresh leaf samples (0.1 g, denoted as W) were weighed into test tubes and extracted with 10 mL (V) of an acetone: ethanol (1:1, v/v) solution. The tubes were stored in darkness overnight until the leaves became fully bleached. The extracts were then homogenized and their absorbance (OD) at wavelengths of 470 nm, 663 nm, and 645 nm was measured using a UV-vis spectrophotometer (JinPeng Inc., Shanghai, China), with an acetone:ethanol (1:1, v/v) mixture serving as the reference blank. Chlorophyll a (Chl a), chlorophyll b (Chl b), total chlorophyll (Chl a + b), and carotenoid (Car) contents were calculated according to the following equations [24]:
Chl   a   ( mg   g 1 ) = ( 12.72 × OD 663 2.59 × OD 645 ) × V / 1000   W
Chl   b   ( mg   g 1 ) = ( 22.88 × OD 645 4.67 × OD 663 ) × V / 1000   W
Car   ( mg   g 1 ) = ( 1000 × OD 470 3.27 × Chl   a 104 Chl   b ) × V / 229,000   W
Chl   ( a + b )   ( mg   g 1 ) = ( Chl   a + Chl   b )
During the same four growth stages, three potato plants with similar growth vigor were randomly selected from each treatment group. Between 9:00 a.m. and 11:30 a.m., a photosynthesis system LI-6400XT (LI-COR, Lincoln, NE, USA) equipped with a fluorescence leaf chamber was used to measure the photosynthetic parameters (net photosynthetic rate, PN; intercellular CO2 concentration, Ci), fluorescence parameters (maximal photochemistry efficiency, Fv/Fm; practical photochemical efficiency, PhiPSII; electron transport rate, ETR), and light response curves of the functional leaves of the plants. The measured data were fitted for light response curves using Ye’s methods [25], through which the dark respiration rate (Rd) was determined. When measuring the photosynthetic parameters, the light intensity setting of the instrument was consistent with that of the plant growth environment. The leaf temperature was set at 22 °C, the CO2 concentration was set at 390 ± 10 μmol mol−1, and the relative humidity was set at 60–70%. For measuring the light response curves, the light intensity gradients were set as 1200 μmol m−2 s−1, 1000 μmol m−2 s−1, 800 μmol m−2 s−1, 600 μmol m−2 s−1, 400 μmol m−2 s−1, 200 μmol m−2 s−1, 150 μmol m−2 s−1, 100 μmol m−2 s−1, 75 μmol m−2 s−1, 50 μmol m−2 s−1, 25 μmol m−2 s−1, and 0 μmol m−2 s−1. The light use efficiency (LUE), carboxylation efficiency (CE), the photorespiratory electron transport flux (Jo) and the non-cyclic electron flow for photosynthetic carbon fixation (Jc) were calculated using the following formulas:
LUE = P N / Photosynthetic   Photon   Flux   Density
CE = P N / Ci
J c = [ ETR + 8 ( P N + R d ) ] / 3
J o = 2 [ ETR 4 ( P N + R d ) ] / 3

2.4. Measurement of Photosynthates

During the seedling stage, tuber formation stage, tuber growth stage, and harvest stage of potato plants, three potato plants with similar growth vigor were randomly selected from each treatment group. The plants were dug out, washed, and then placed in an oven at 80 °C until a constant weight was achieved. The contents of photosynthates (sucrose and starch, mg g−1) in each organ of the dried plants were determined using the method proposed by Chen et al. [1].
On the 30th day of treatment (during the tuber formation stage), at 10:30 a.m., three potato plants with similar growth vigor were selected from each treatment group. The potato plants were labeled with 13CO2 according to the method of He et al. [26]. Samples were taken from the plants before the lights were turned on the next day. The samples were then dried in an oven at 80 °C until a constant weight was reached and ground into powder. Four milligrams of the sample to be tested were taken, and the isotope abundance of the sample was measured using a stable isotope ratio mass spectrometer (Isoprime100, Elementar, Oberursel, Germany). The tubers at the time of sampling were arranged in descending order of volume and divided into two equal parts, labeled as large tubers and small tubers, respectively, to investigate the distribution of 13C-photosynthates between tubers of different sizes. Proportions of large tubers and proportion of small tubers were calculated using the following formulas:
Proportion   of   large   tubers = The   number   of   large   tubers / the   total   number   of   tubers
Proportion   of   small   tubers = The   number   of   small   tubers / the   total   number   of   tubers

2.5. Carbon Metabolism Enzymes and Relative Expression Level of StSP6A

During the tuber formation stage, leaves and tubers were collected from potato plants under the T1, T81, and T59 treatments. The activities of SPS (sucrose phosphate synthase) and AGPase (ADP-glucose pyrophosphorylase) in the leaves and tubers, as well as the relative expression level of StSP6A in the leaves were determined following the method of He et al. [26]. The Rubisco content in the plant leaves was measured according to the method of Cai et al. [27]. Appendix A presents the determination methods for SPS, AGPase, StSP6A, and Rubisco.

2.6. Statistical Analyses

The impacts of light intensity were evaluated through analysis of variance, with the statistical analysis conducted using Statistical Product and Service Solutions (SPSS) software, version 20.0 (IBM, New York, NY, USA), followed by Tukey’s test at p < 0.05 level. The correlations between different parameters were determined using Pearson’s correlation analysis based on the measured data from the light treatments. Differences were considered to be statistically significant at p-values below 0.05. The graphs were generated using Microsoft Excel 2016 software (Microsoft, Redmond, WA, USA).
Based on the tuber yield data of potato plants under different treatments, cluster analysis was conducted using SPSS 20.0 software to classify the experimental treatments into three categories: high yield group, medium yield group, and low yield group. Additionally, typical treatment groups at each yield level were screened out by the software.

3. Results

3.1. Potato Among Different Yield Groups

3.1.1. Yield Traits

Significant differences were observed in potato yield components across yield groups. Tuber yield per plant in the high yield group 75 ± 5 g exceeded the medium yield group 60 ± 5 g by 25.0% and surpassed the low yield group 38 ± 5 g by 97.4%, while medium yield plants produced 57.9% more than low yield plants (Figure 1A). Although tuber number interquartile ranges (IQR) overlapped (low: 3.00–4.00; medium: 2.50–4.23; high: 3.17–4.75), the high yield group’s median tuber count was 13.5% higher than the low yield group (Figure 1B). Crucially, average tuber weight in the low yield group was >50% lower than both the medium and high yield groups (shared IQR: 12.98–23.78 g), while the medium and high groups showed a <2% difference (Figure 1C). The effective tuber rate reached 100% in the high yield group (Figure 1D). The coefficient of variation for tuber weight across yield levels (~42%) was 3.2 times as large as tuber number (~13%), confirming weight as the primary yield determinant.

3.1.2. Pearson Correlation Analysis Between Yield Traits and Light Intensity

Pearson correlation analysis (Table 2) revealed a significant negative correlation between tuber number per plant and average tuber weight. Yield-limiting factors differed across yield levels: In medium yield groups, both average tuber weight and tuber number per plant positively correlated with yield per plant. In high yield groups, tuber number per plant positively correlated with yield, while average tuber weight negatively correlated with yield per plant.
Light intensity impacts on potato yield traits exhibit dual specificity (developmental stage and yield level). In the low yield groups, tuber weight correlated with TFS light intensity, while tuber number correlated with TGS PPFD. The medium yield groups showed a tuber weight–TGS light intensity correlation. The high yield groups displayed a tuber number–TFS light intensity correlation. These correlations validate a dynamic light intensity strategy (200 μmol·m−2·s−1 at TFS for tuber initiation and 300–400 μmol·m−2·s−1 at TGS for sink allocation) to synergistically maximize yield.

3.1.3. Growth Parameters

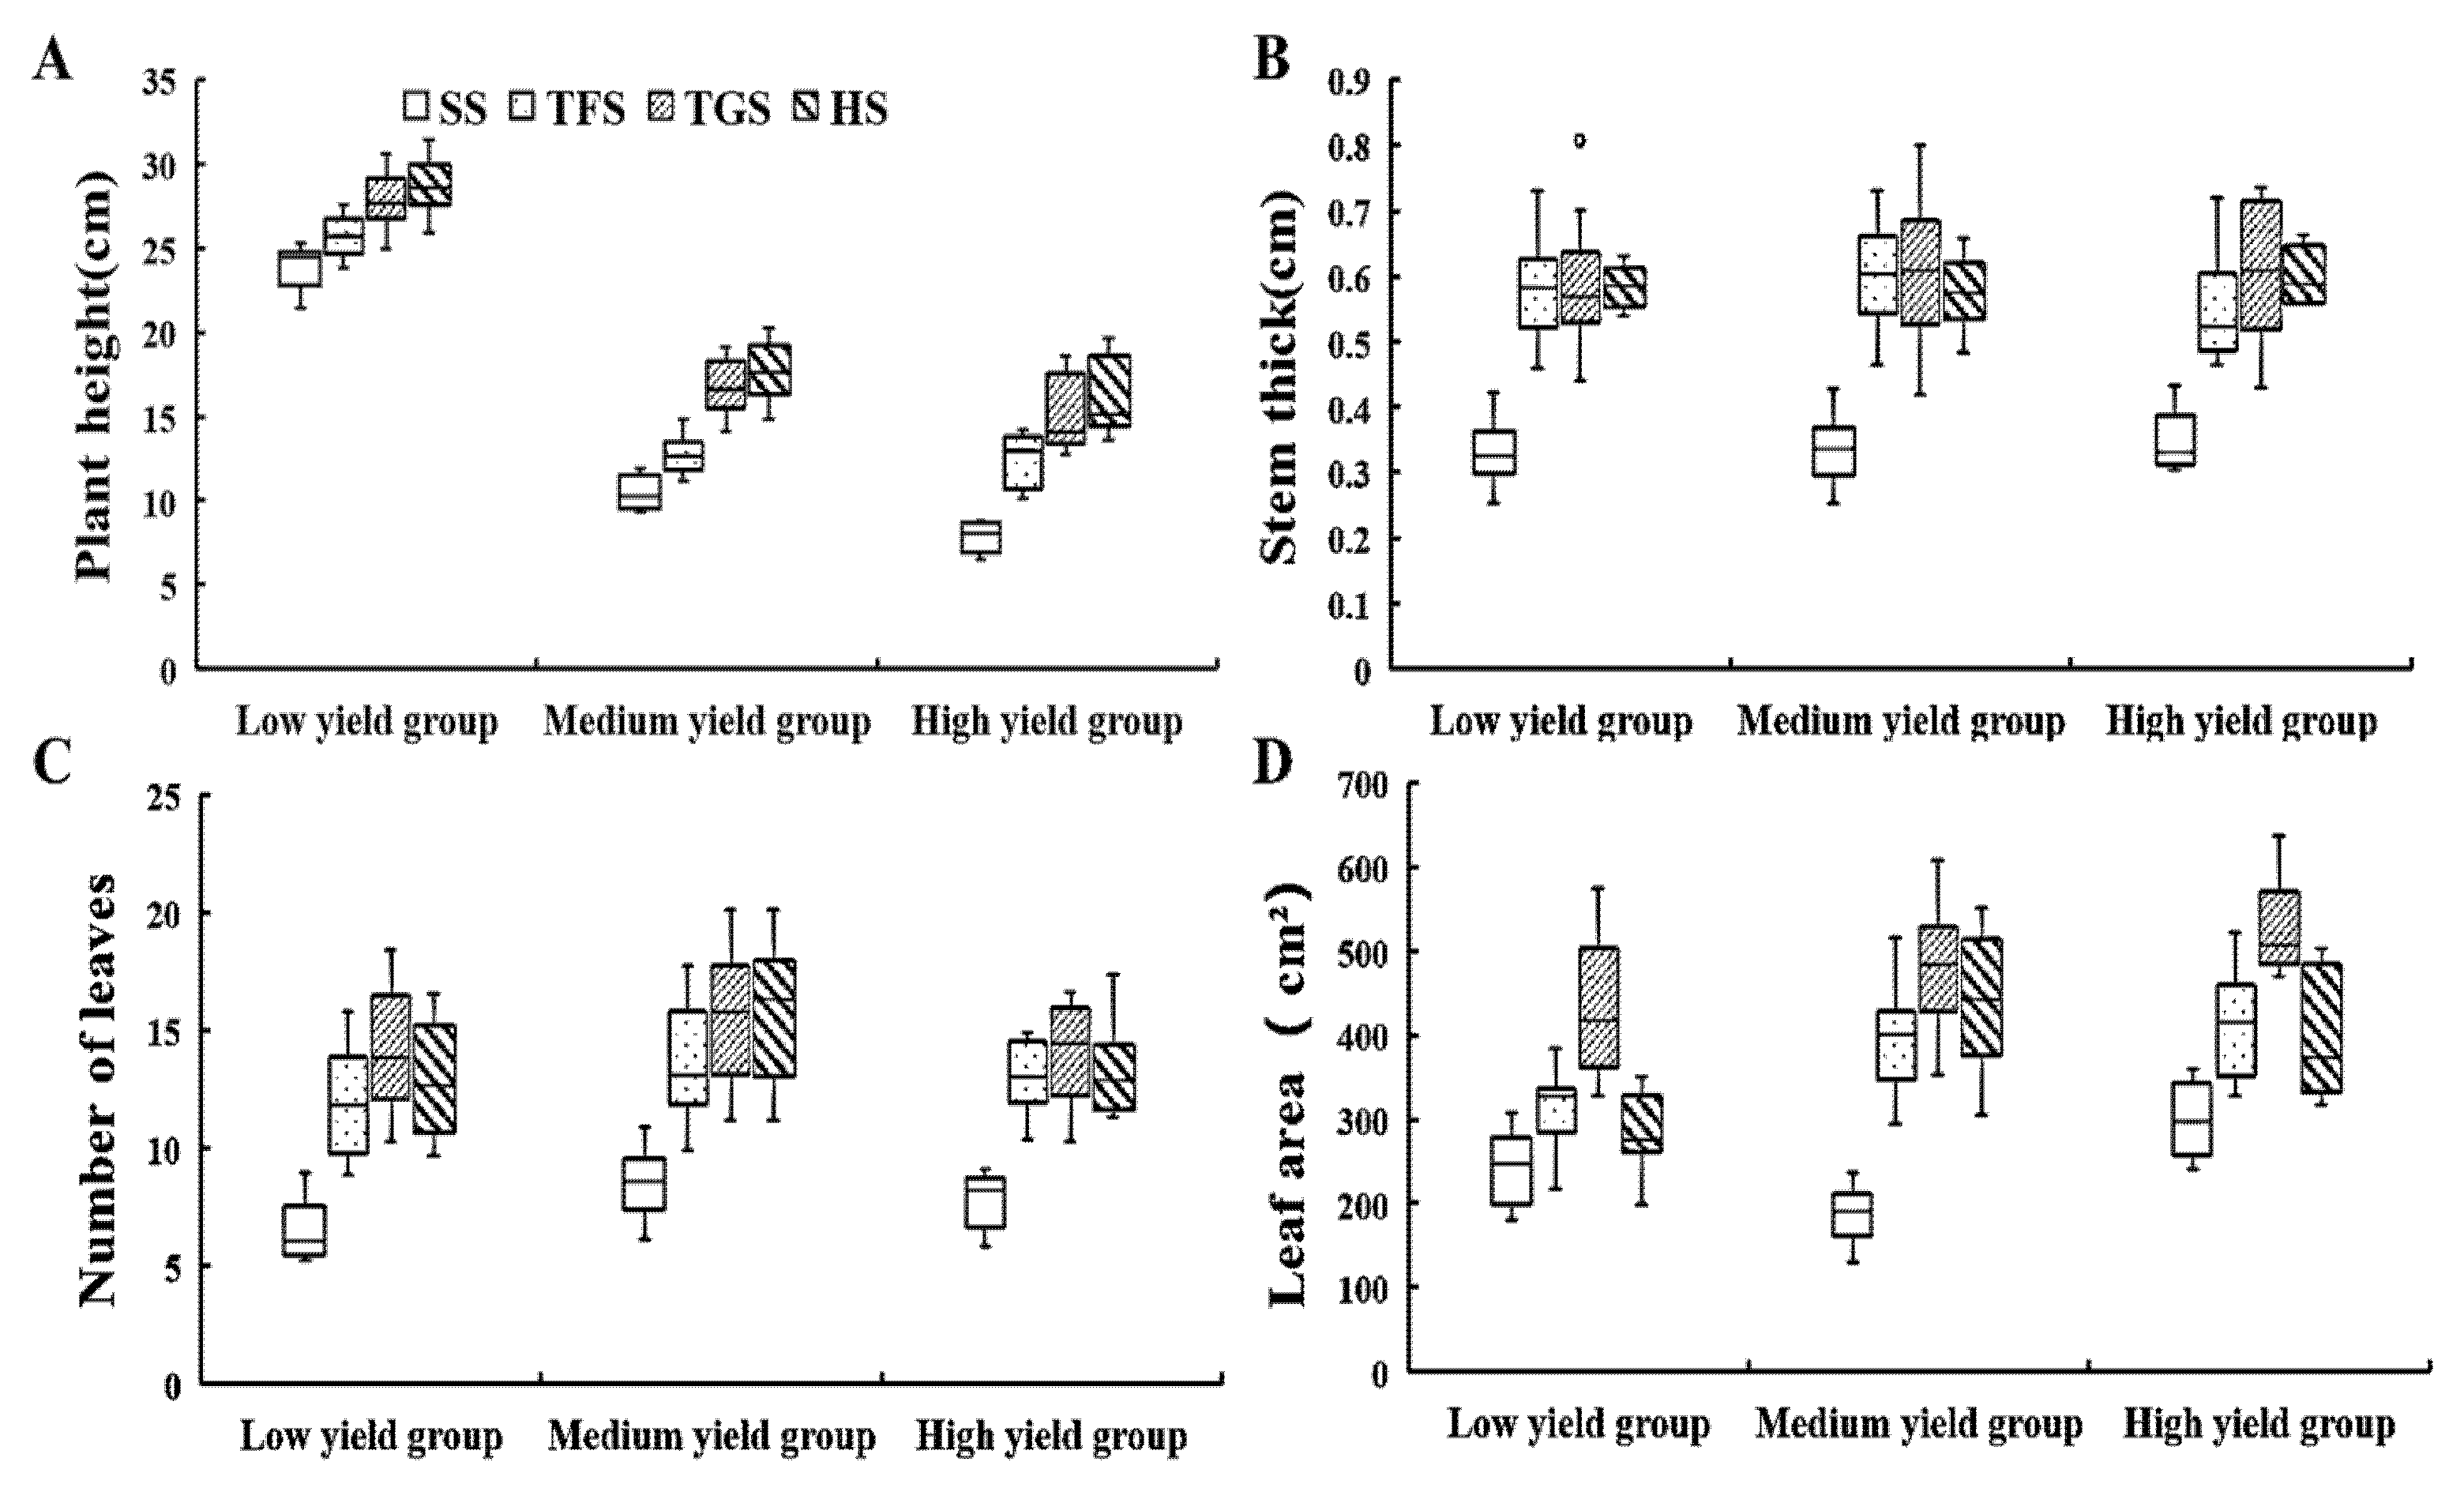
Potato morphology showed yield group specificity: Low yield plants had greater height across stages (Figure 2A), while high yield plants were significantly shorter at the seedling stage. Stem diameter and leaf number were reduced at the seedling stage without intergroup differences (Figure 2B,C). Leaf area peaked at the tuber growth stage, with the leaf areas of high yield groups 50% larger than those of the low yield groups (Figure 2D). The medium and high yield groups maintained greater leaf areas from TFS to harvest. Minimal leaf number variation indicated that yield divergence was driven by organ size.

3.1.4. Photosynthetic Characteristics

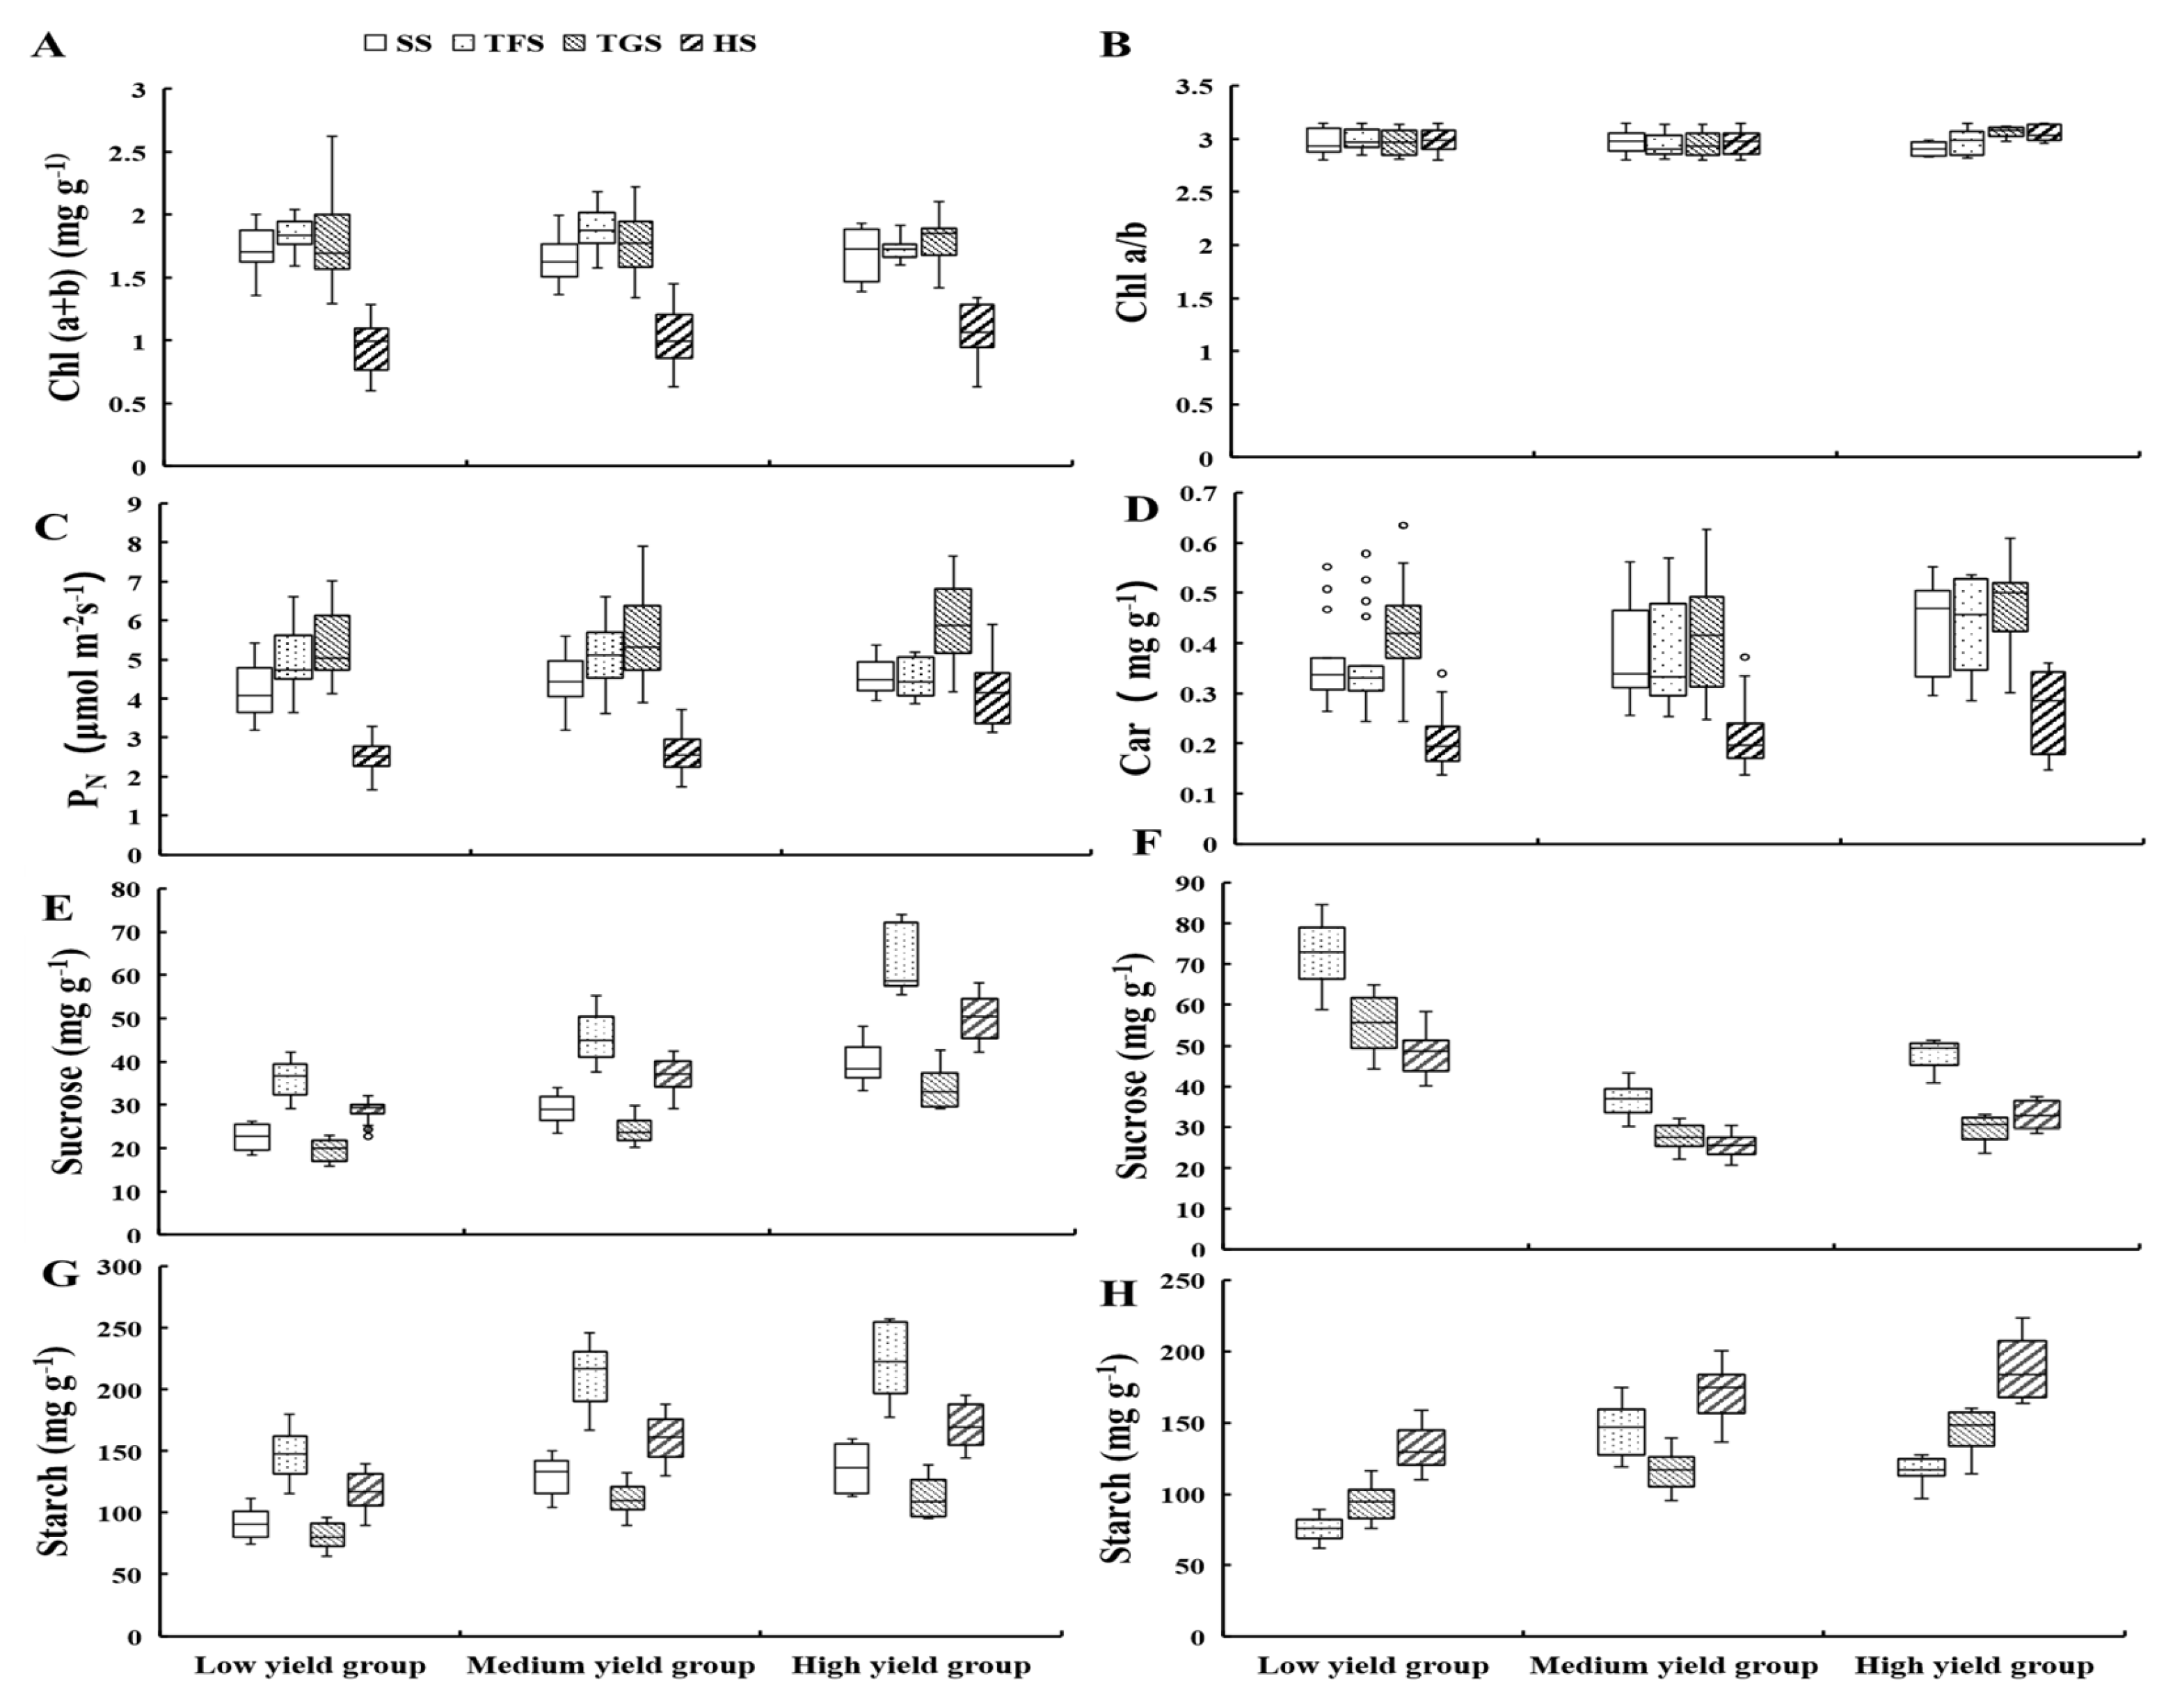
Chl (a + b) content showed no significant differences among the low, medium, and high yield potato groups during the seedling, tuber growth, and harvest stages (Figure 3A). At the tuber formation stage, high yield plants exhibited lower Chl (a + b) than the low and medium yield groups. During the tuber growth stage, Chl (a + b) in high yield plants displayed a pronounced positive skewness (indicating higher-value concentration), while low yield plants showed a distinct negative skewness. The Chl a/b ratio was lower in high yield plants versus other groups at the seedling stage but higher during the tuber growth and harvest stages (Figure 3B). At the tuber formation stage, Chl (a + b) in the low yield plants demonstrated a marked negative skewness, with no significant intergroup differences.
Leaf PN showed no significant differences between the low and medium yield groups from the seedling to harvest stages (Figure 3C). At the tuber formation stage, the high yield plants exhibited slightly lower PN than the low and medium yield groups, but exceeded both during the tuber growth and harvest stages.
Car content peaked during the tuber growth stage and declined sharply at harvest across all yield groups (a significant decrease of more than 50%, Figure 3D). During the seedling and tuber formation stages, the low yield groups showed lower Car content than the medium and high yield groups. At the tuber growth stage, the high yield plants exhibited a pronounced positive skewness in Car content. During harvest, both the mean and median Car contents were higher in the high yield versus the low and medium yield groups.
From the seedling to harvest stages, leaf sucrose content in the low, medium, and high yield potato groups exhibited an initial rise, subsequent decline, and ultimate rebound (Figure 3E). During each growth period, leaf sucrose content increased with the population yield level. From tuber formation to harvest, the tuber sucrose content in high yield groups progressively decreased (Figure 3F). Across all periods, tuber sucrose content was higher in the low yield than in the medium and high yield groups, peaking during tuber formation in the low and medium yield groups. Leaf starch content mirrored the sucrose fluctuation pattern (rise- decline-rebound) in all groups, while tuber starch content showed progressive accumulation (Figure 3G). Leaf starch content increased with yield level during each period. Unlike the low and high yield groups, the medium yield plants exhibited lower tuber starch content during tuber growth versus the formation stage (Figure 3H).

3.2. Typical Treatment

3.2.1. Biomass and Yield Traits

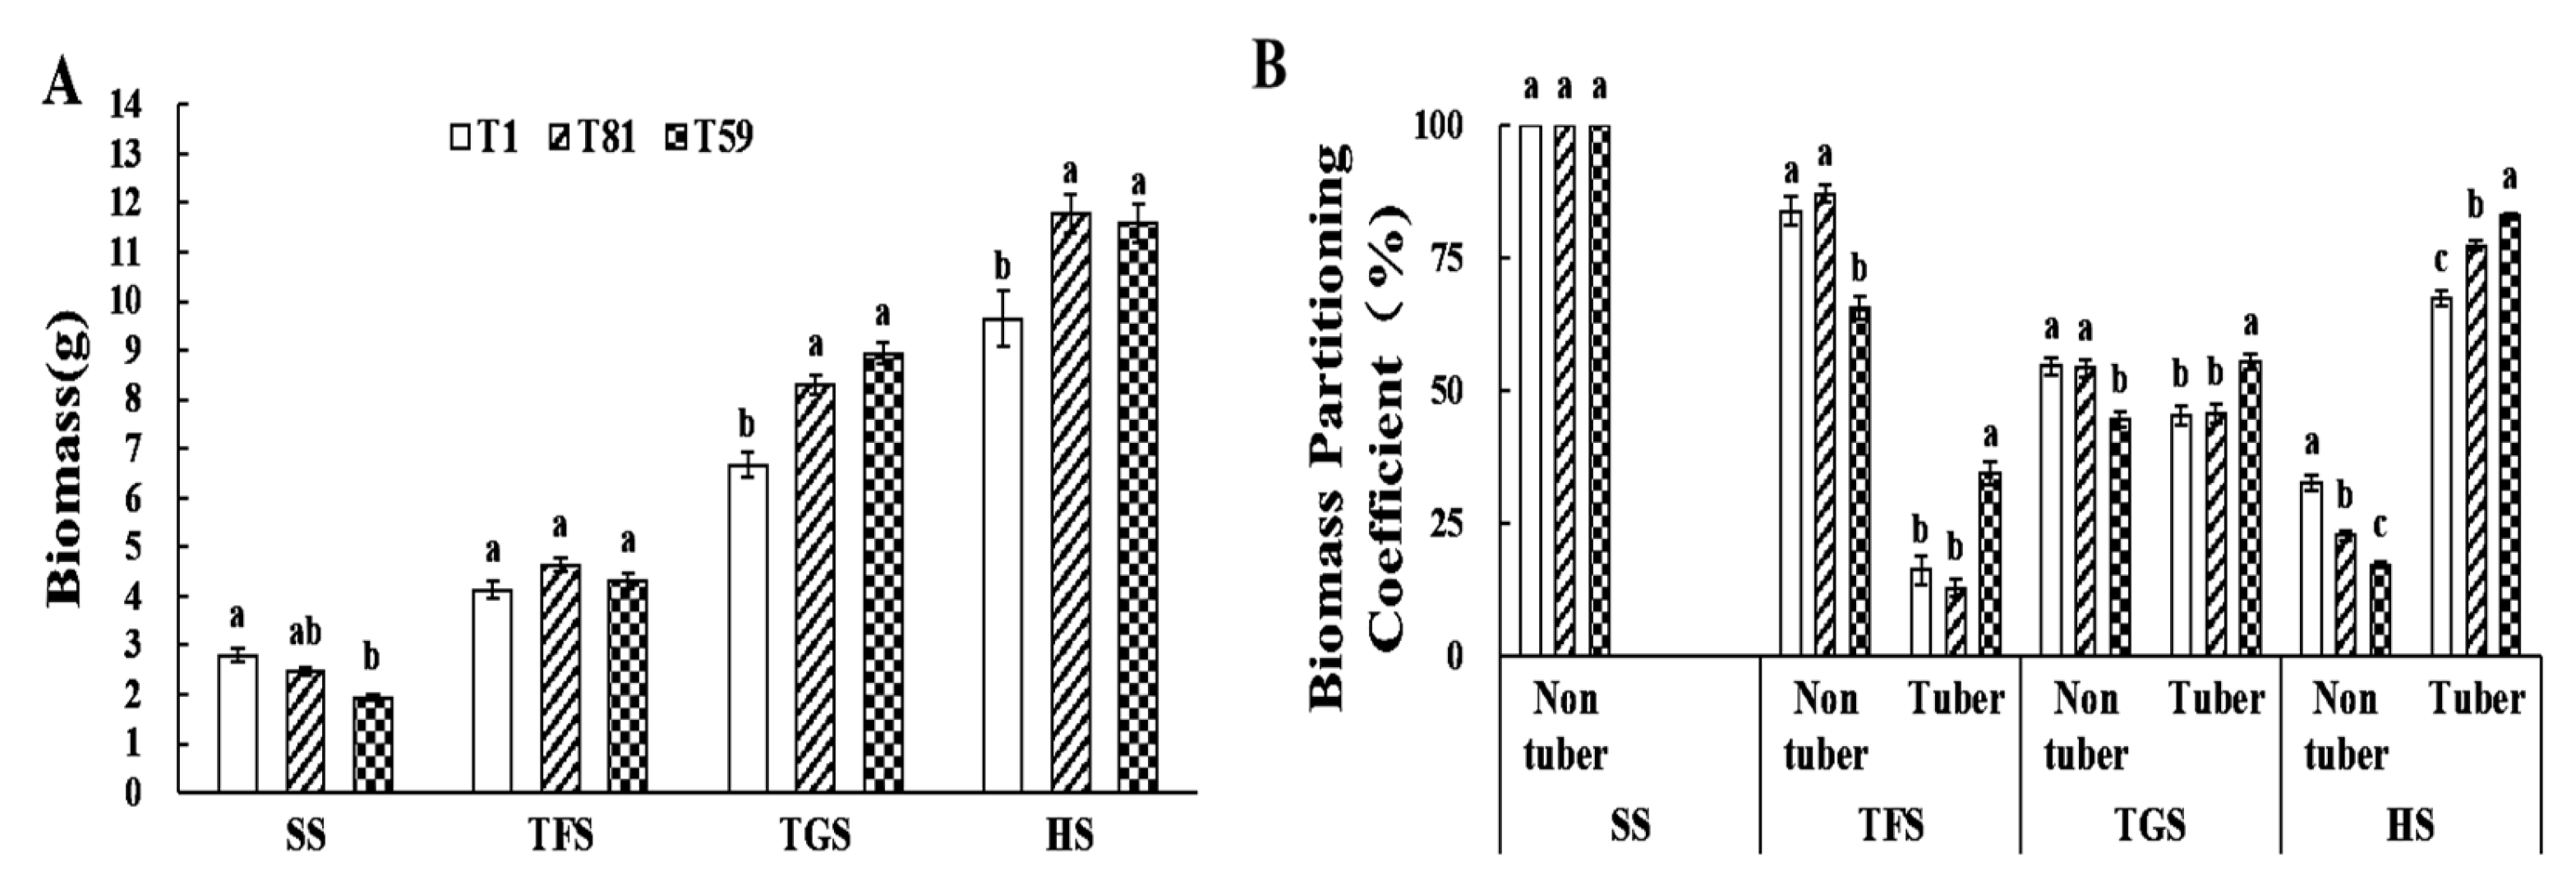
Using SPSS 20.0 software for cluster analysis, the system identified the T59 treatment as the representative of the high yield group, the T81 treatment as the representative of the medium yield group, and the T1 treatment as the representative of the low yield group. At the seedling stage, plant biomass under T59 was significantly lower than under the T1 and T81 treatments (Figure 4A). From tuber formation to harvest, T1’s biomass remained lower than those of the other treatments. Crucially, the T59 treatment exhibited significantly reduced biomass allocation to non-tuber parts but elevated allocation to tubers during the tuber formation–harvest stages (Figure 4B). The T59 treatment achieved higher yields per plant, tuber number, and small tuber proportion. T1 showed the lowest average tuber weight. T81 had lower a effective tuber ratio but higher large tuber proportion (Table 3).

3.2.2. Typical Treatment Photosynthetic Characteristics

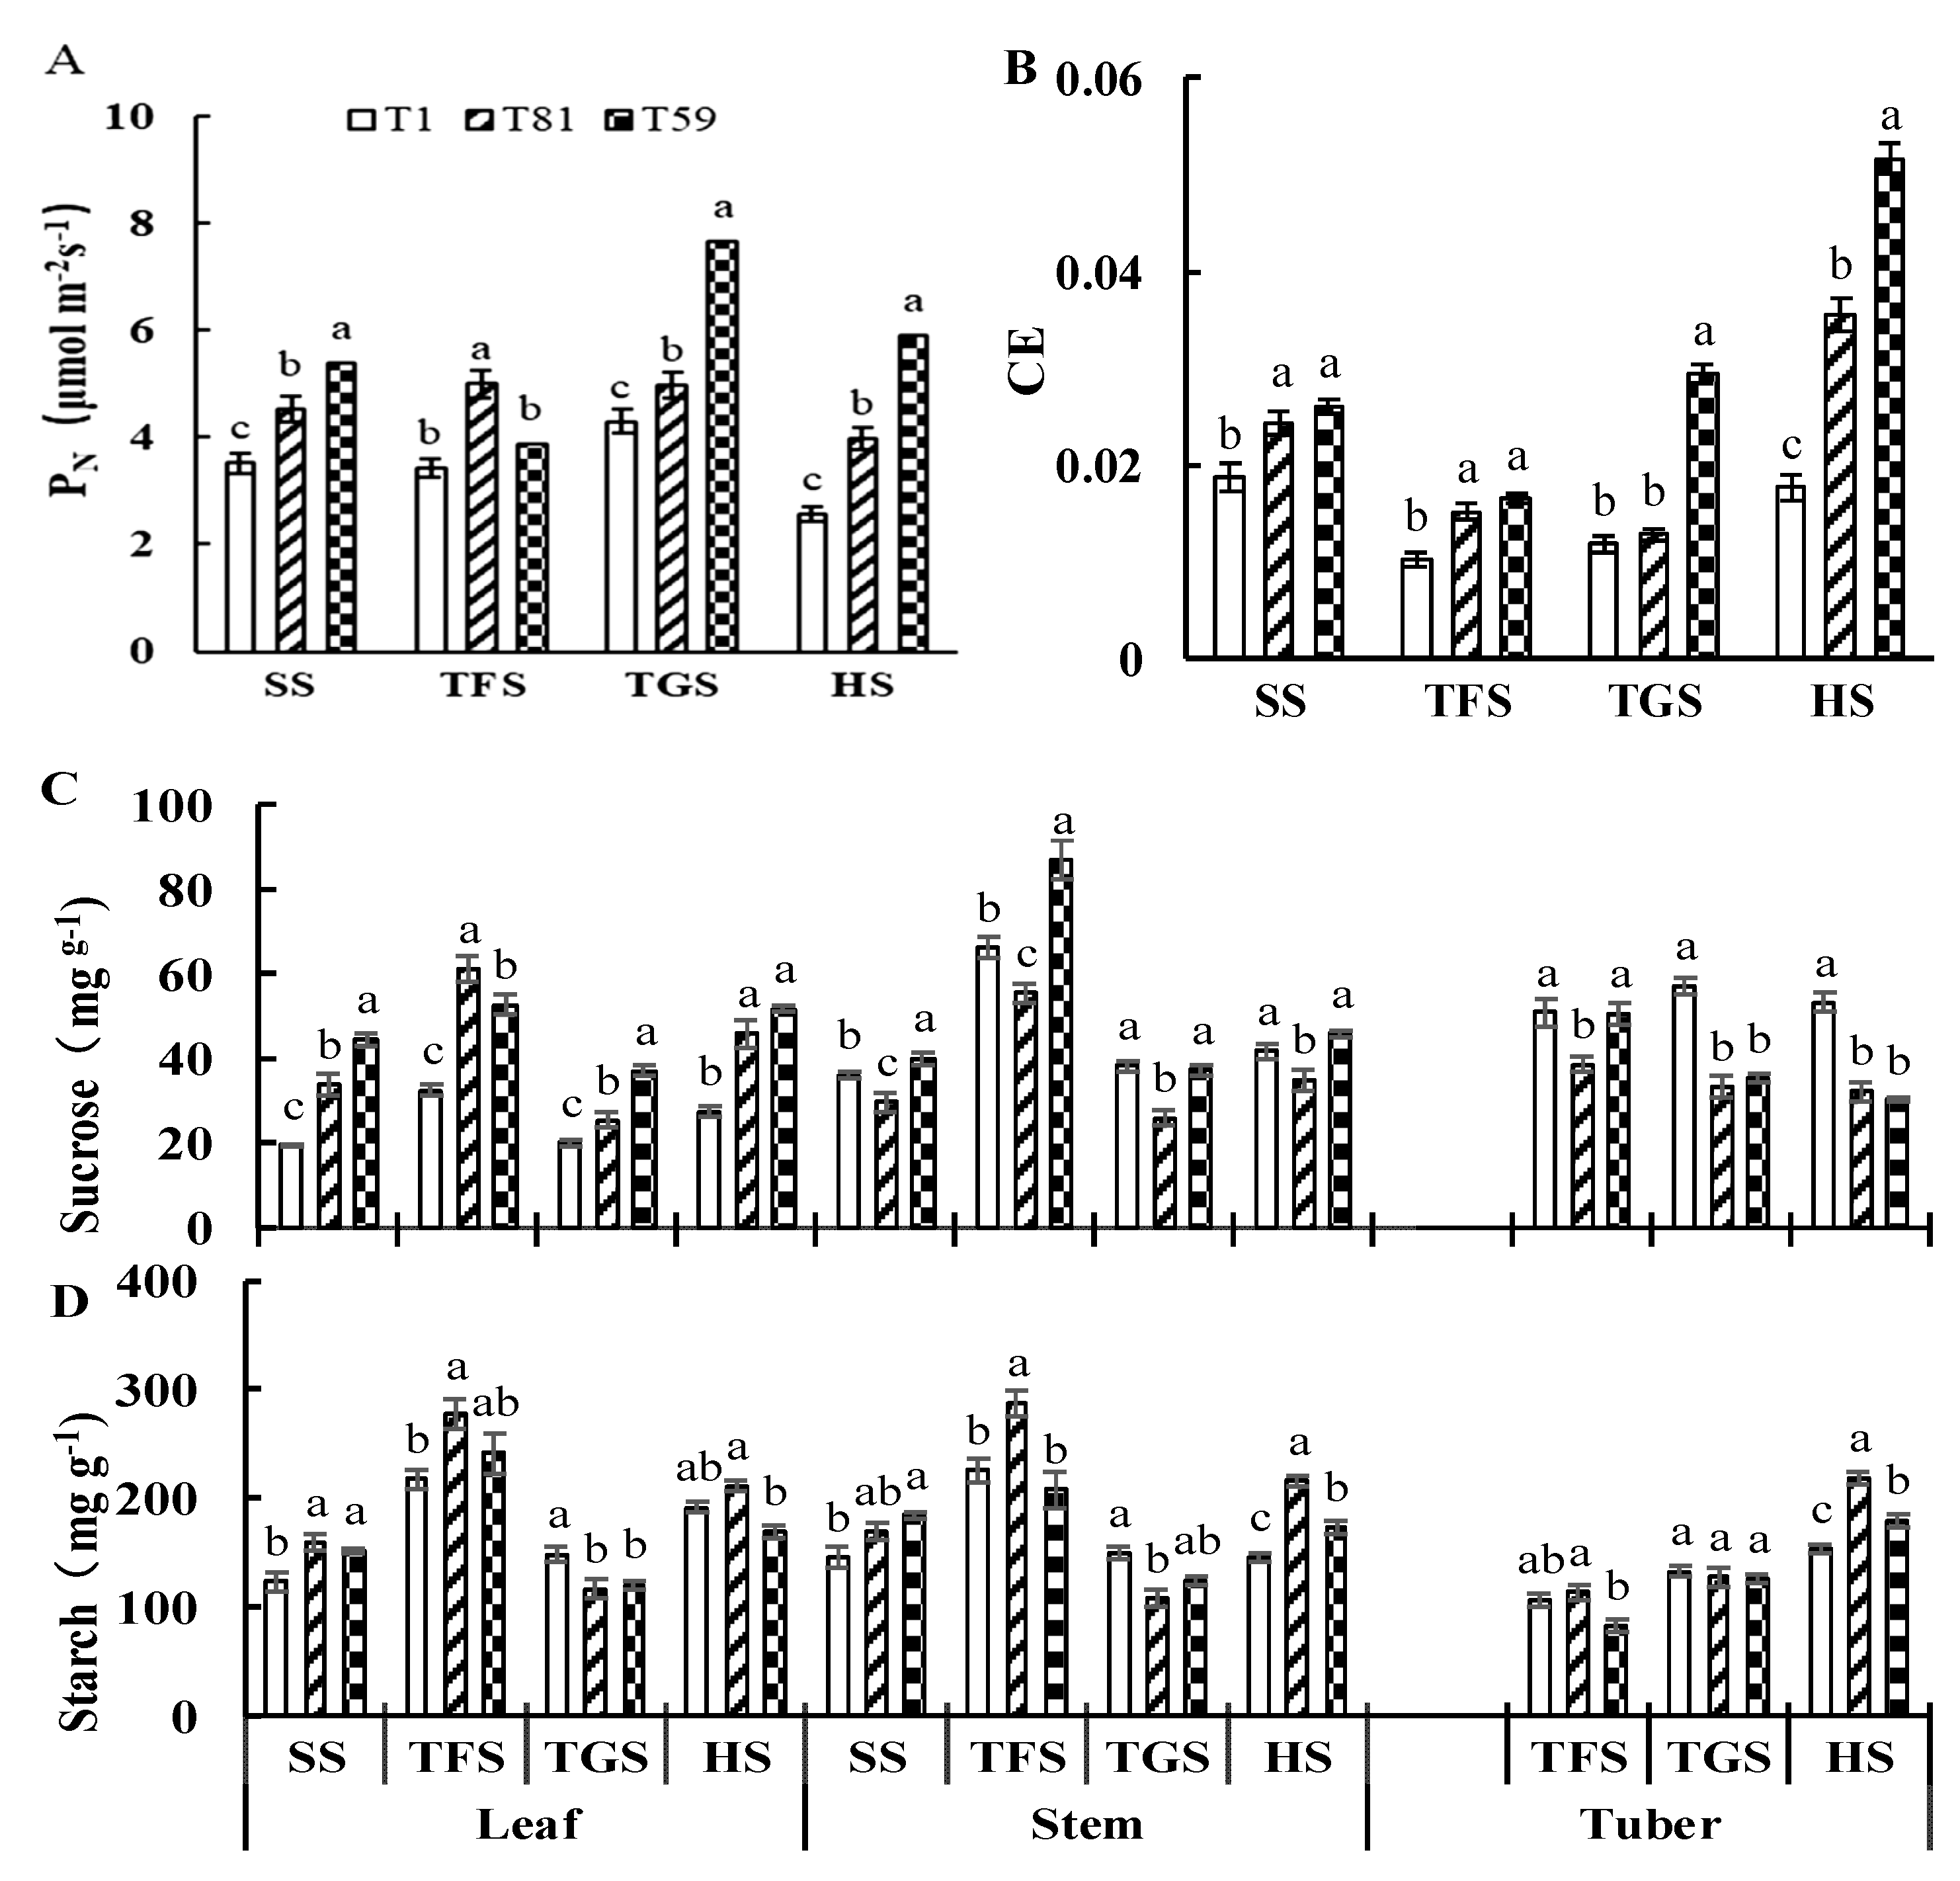
From the seedling stage to the harvest stage, the PN of potato plant leaves under the T1 treatment was significantly lower than those found under other treatments (Figure 5A). During the tuber formation stage, the PN of potato plant leaves under the T81 treatment was notably higher than those found under other treatments. During the tuber growth and harvest stages, the PN of plants under the T59 treatment was significantly greater than those found under other treatments. From the seedling stage to the harvest stage, the CE of potato plant leaves under the T59 treatment remained at a high level, while the CE of potato plant leaves under the T1 treatment was lower than those found under other treatments (Figure 5B).
During the seedling, tuber growth, and harvest stages, the sucrose content in the leaves of potato plants increased significantly with the rise in yield levels among typical treatment groups, with the T81 treatment showing notably higher leaf sucrose content than the T59 treatment (Figure 5C). The sucrose content in the stems of potato plants under the T81 treatment was significantly lower than those found under the T1 and T59 treatments. From the tuber formation stage to the harvest stage, the sucrose content in the tubers of potato plants under the T1 treatment was significantly higher than those found under the T81 and T59 treatments.
Starch content exhibited organ- and stage-specific patterns: In leaves, T1 was significantly lower than T81 and T59 at the seedling and tuber formation stages but higher during the tuber growth stage. T59 was lower than T81 at the harvest stage (Figure 5D). In stems, T59 exceeded T1 and T81 at the seedling stage, T81 was lower than the others during the tuber growth stage, and T81 was significantly higher at the formation and harvest stages. In tubers, T81 surpassed the others at the formation and harvest stages, with no intergroup differences during the tuber growth stage.

3.2.3. 13C Metabolism of Potato Plants at the Tuber Formation Stage

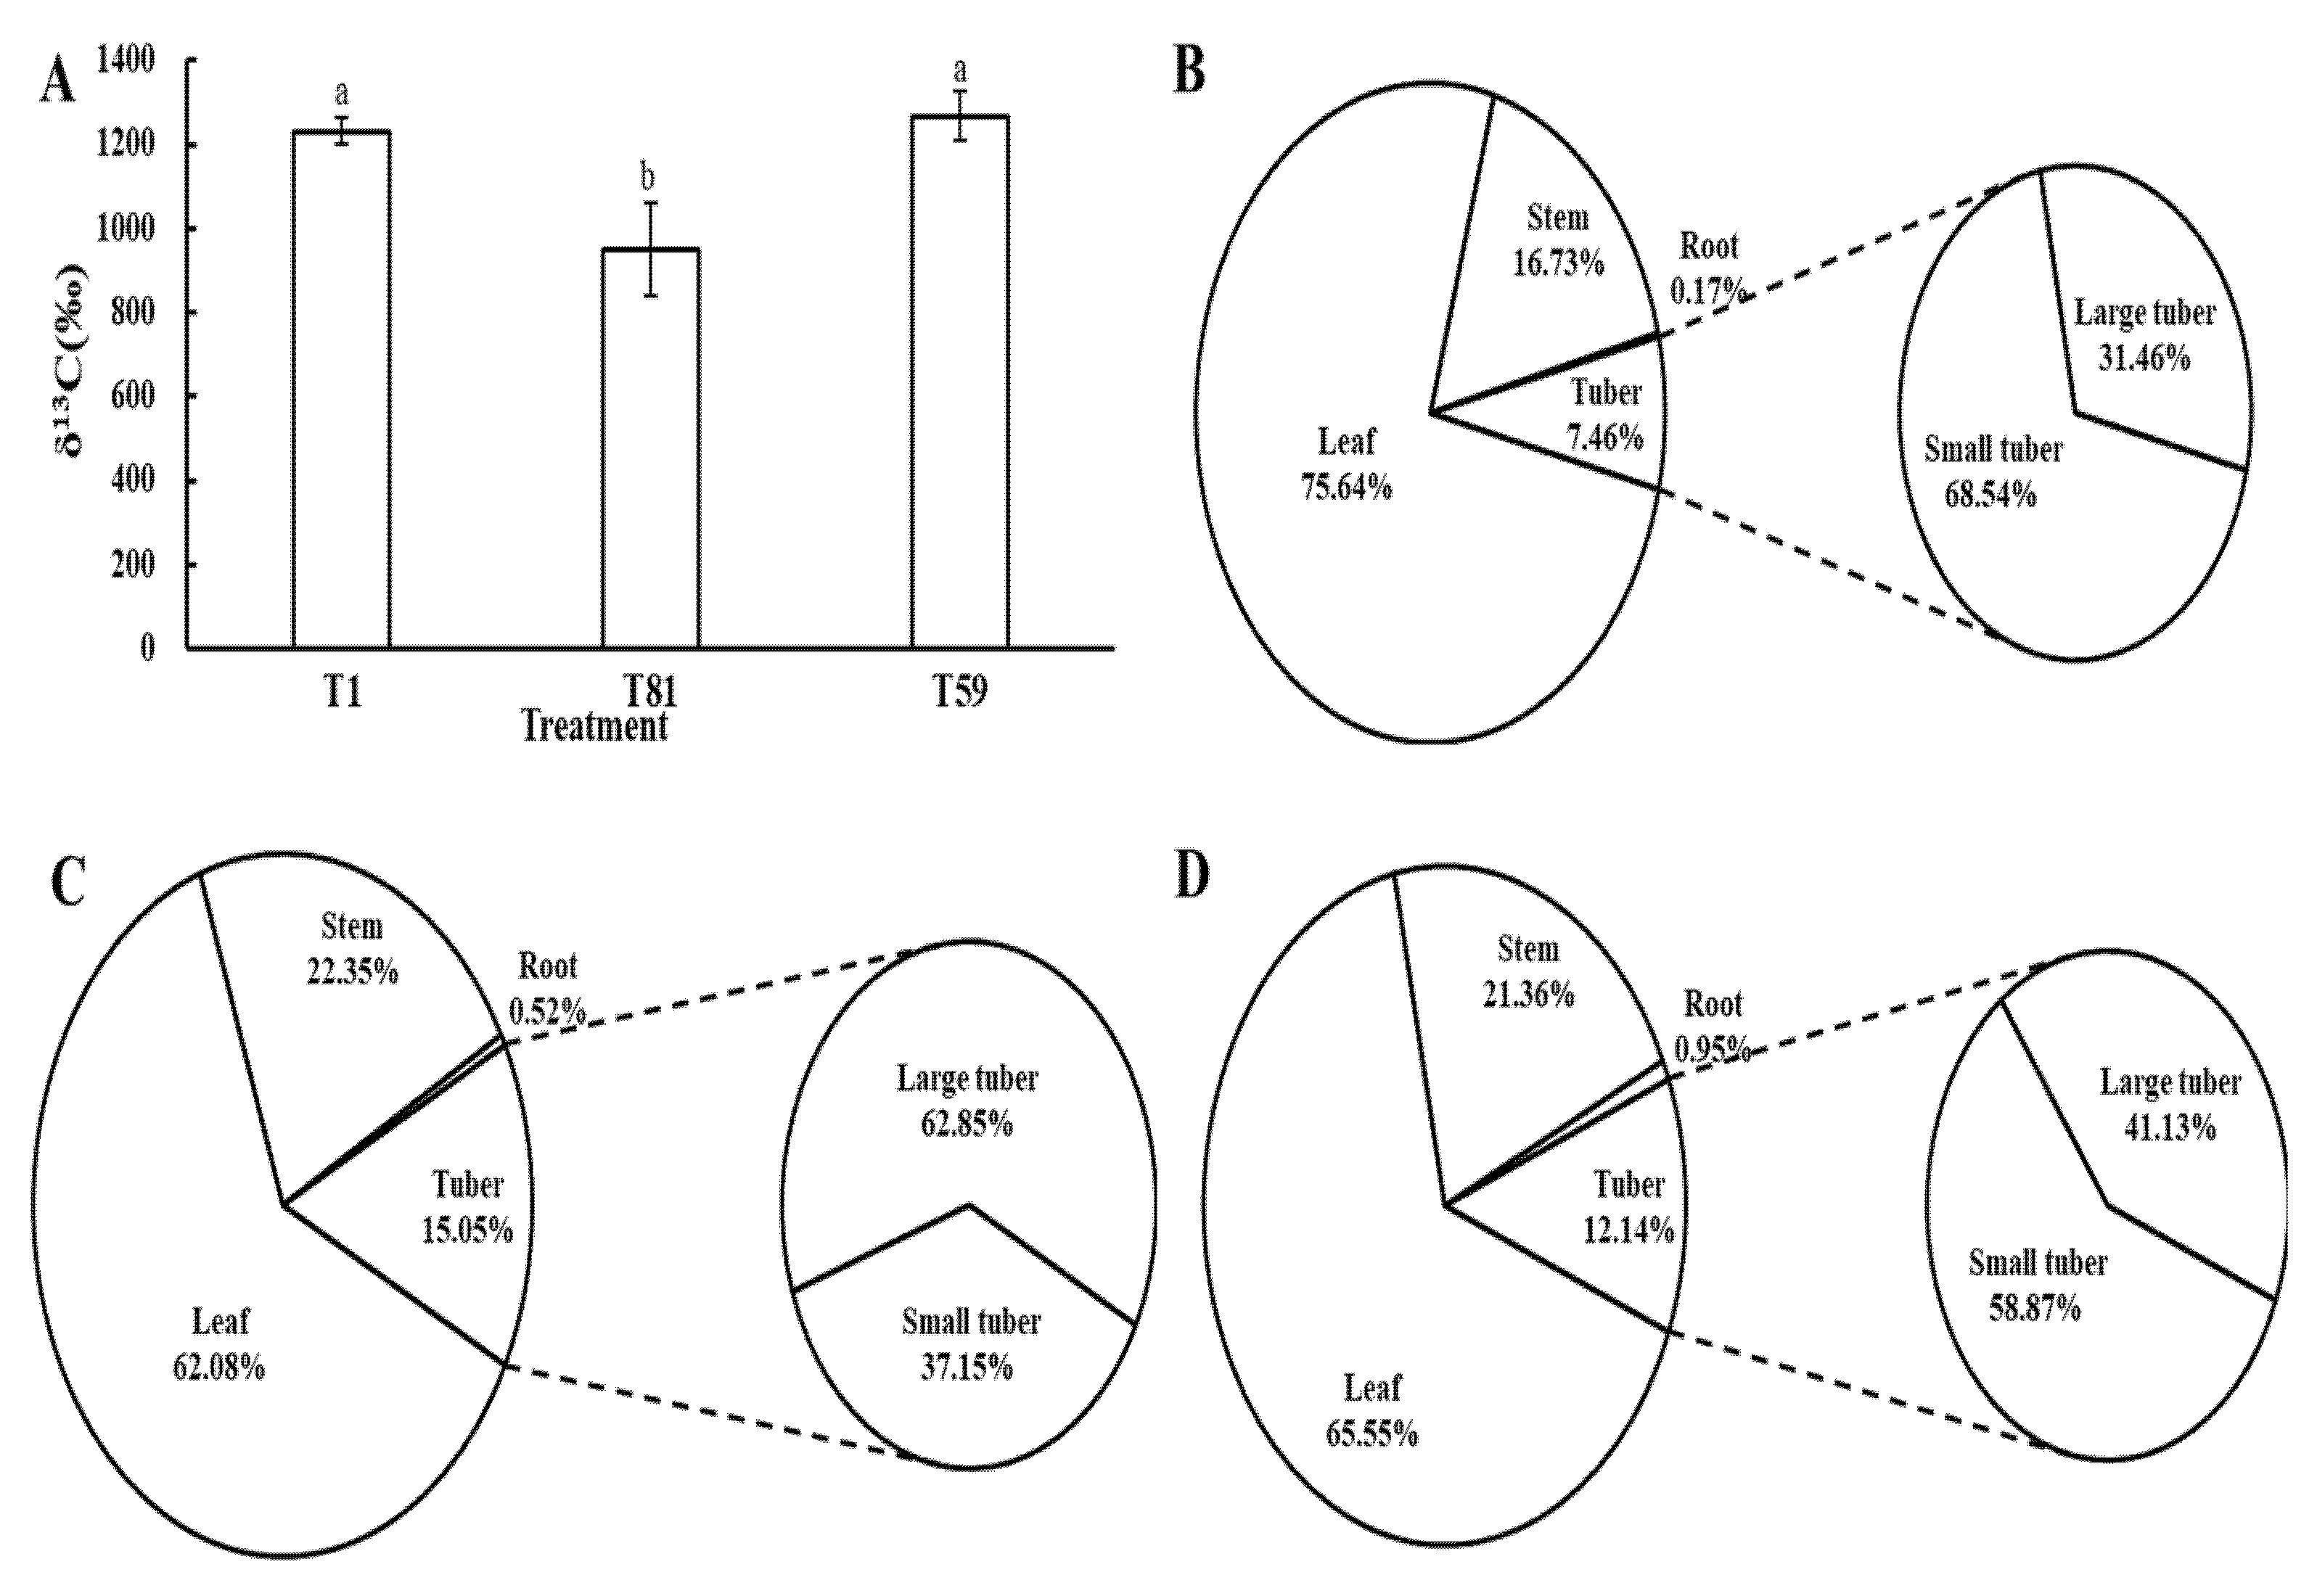
Under the same experimental conditions, the δ13C value in potato plants under the T81 treatment was significantly lower than those found under other treatments (Figure 6A), indicating that the photosynthetic carbon fixation capacity of potato plants under the T81 treatment was inferior to those found under other treatments. The distribution proportion of δ13C in the leaves of potato plants under the T1 treatment was higher than those found under other treatments (Figure 6B–D), while the distribution of δ13C in the tubers was lower than those found under other treatments. Within the T1 treatment, the distribution proportion of δ13C in small tubers was higher than that found in large tubers, whereas the opposite phenomenon was observed under the T81 and T59 treatments (Figure 6B–D).

3.2.4. Carbon Metabolism Enzymes and Related Genes at the Tuber Formation Stage

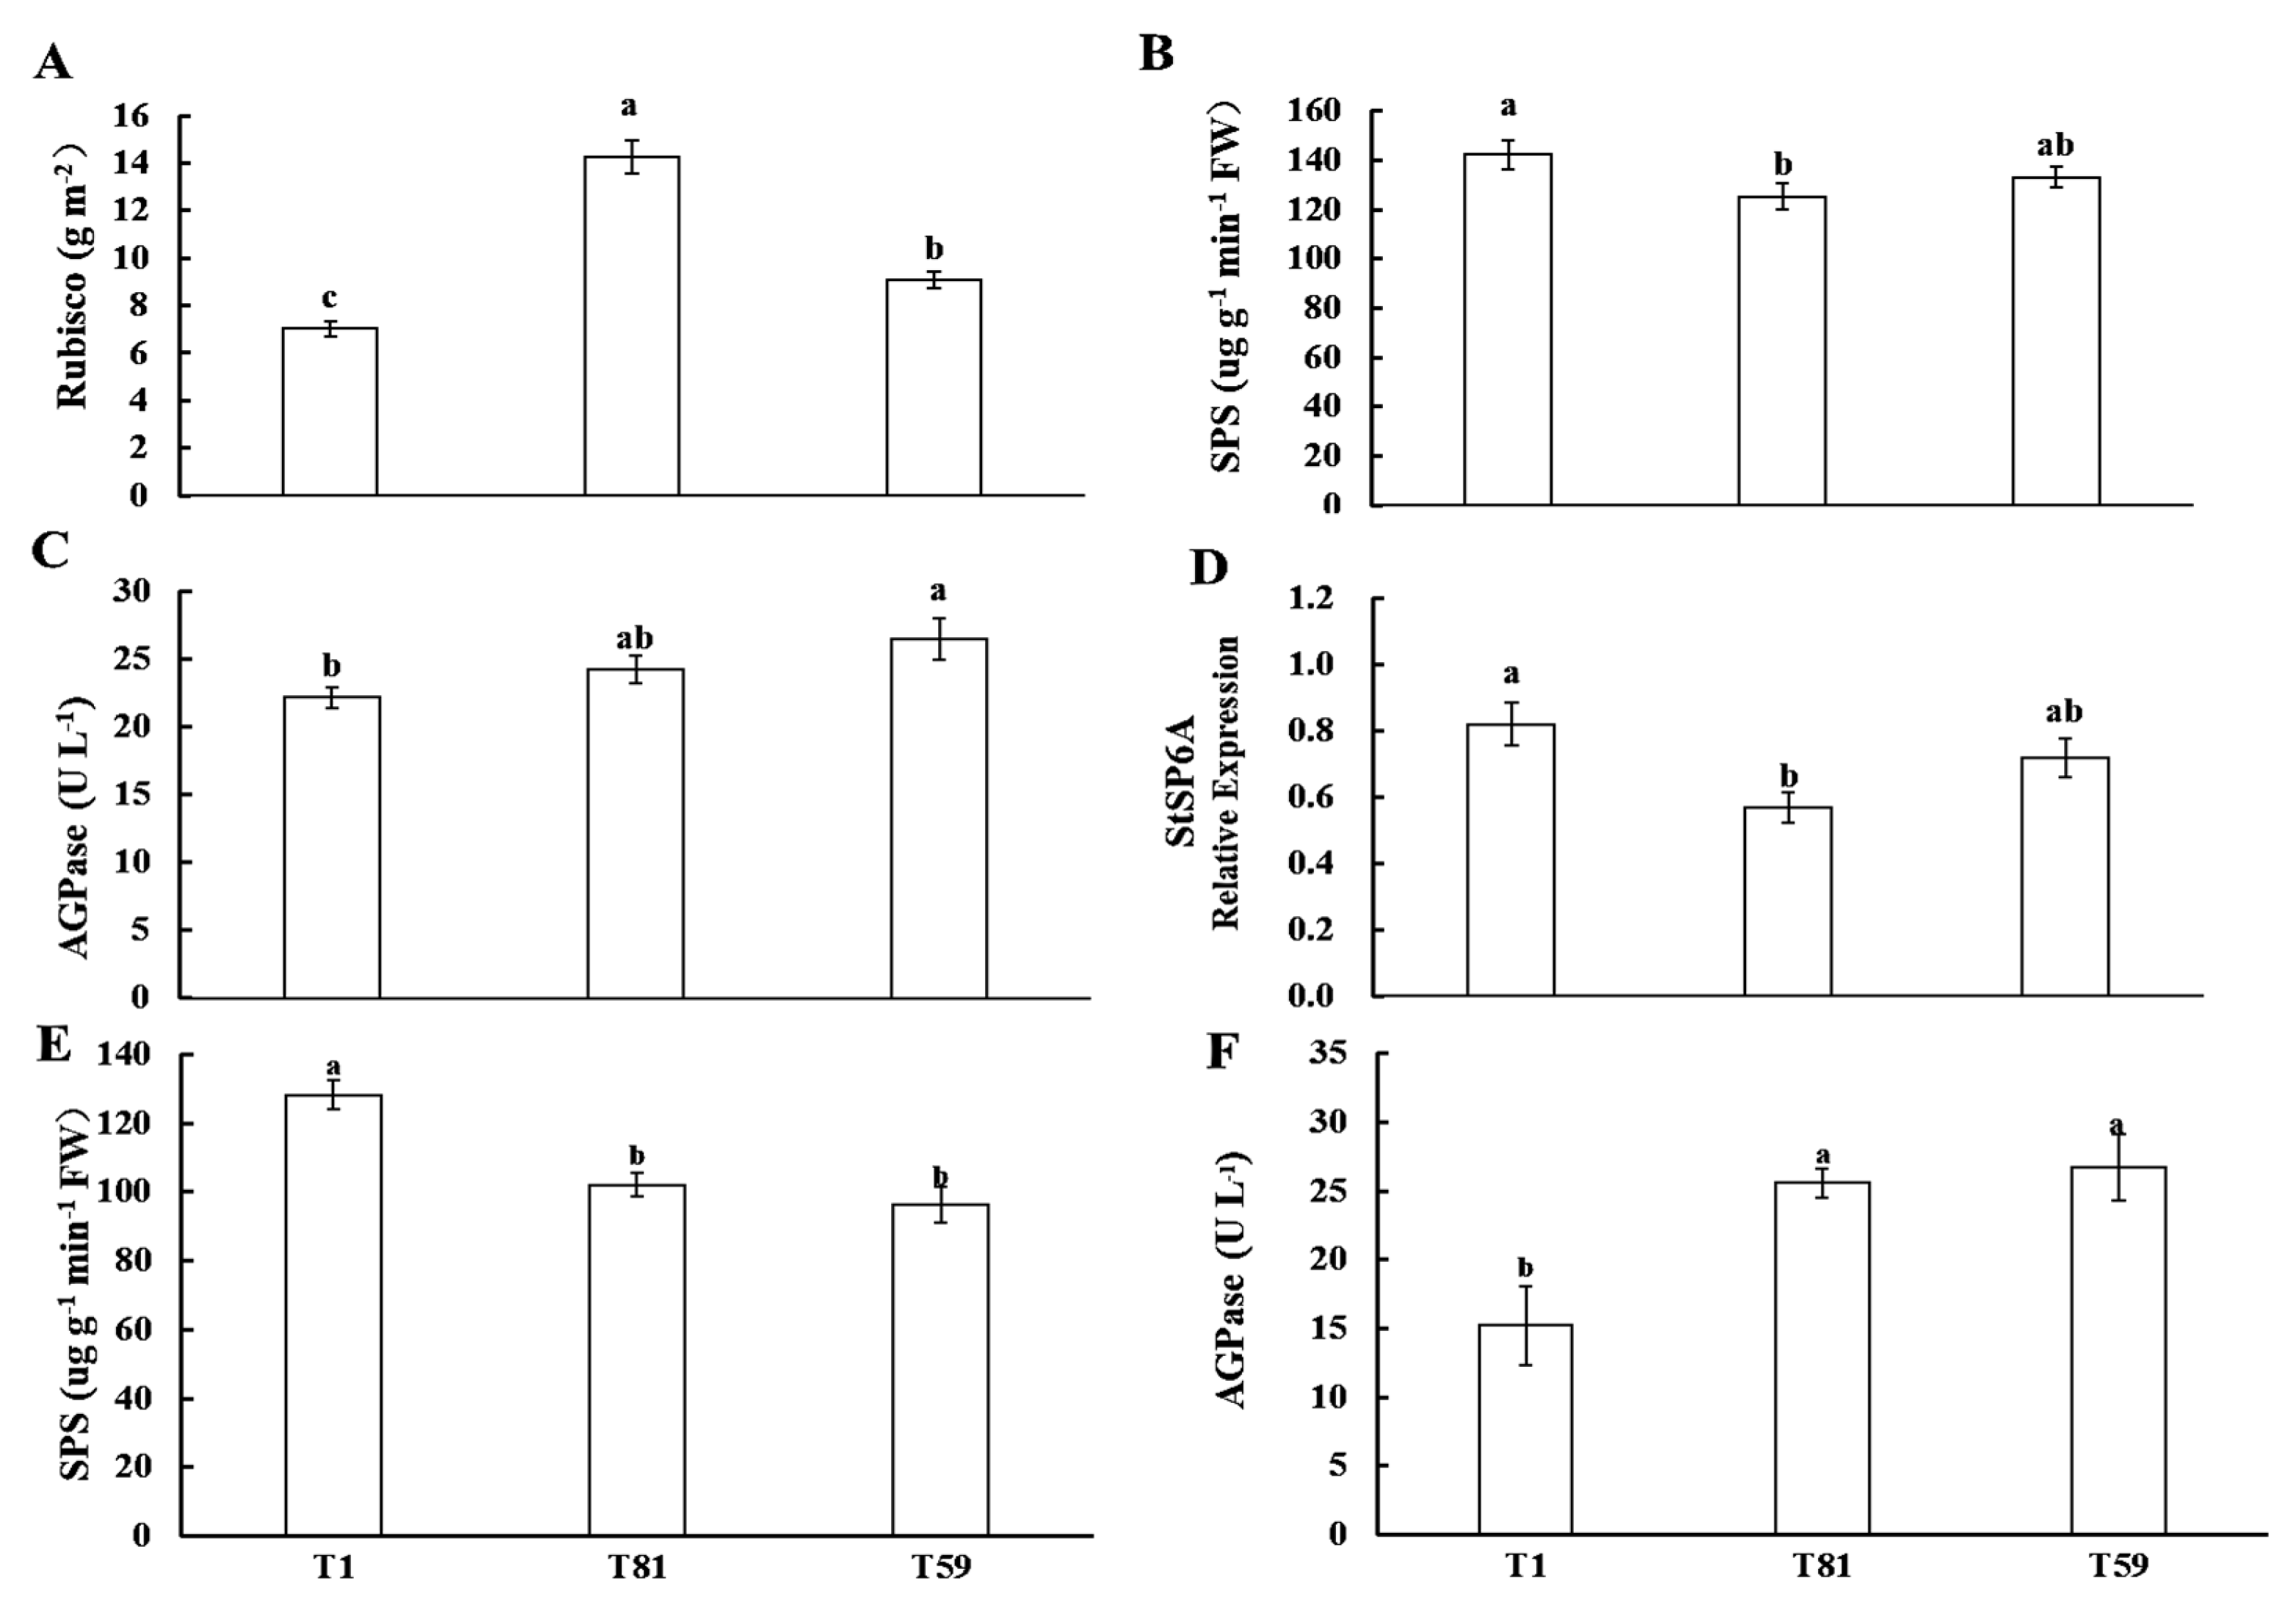
Under the T81 treatment, the Rubisco content in the leaves of the potato plants (Figure 7A) was significantly higher than that under other treatments, while the SPS activity in the leaves (Figure 7B) and the relative expression level of StSP6A (Figure 7D) were lower than those found under other treatments. The AGPase activity in the leaves under the T59 treatment (Figure 7C) was significantly higher than that found under the T1 treatment. Under the T1 treatment, the SPS activity in the tubers of potato plants (Figure 7E) was significantly higher than that found under other treatments, but the AGPase activity (Figure 7F) was significantly lower than that found under other treatments.

3.2.5. Fluorescence Parameters at the Tuber Formation Stage and Tuber Growth Stage

During the tuber formation stage, the Fv/Fm value under the T81 treatment was significantly lower than that found under other treatments, while no significant difference was observed between the T1 and T59 treatments (Table 4). The ETR, Jo, and Jc values found under the T81 treatment were significantly higher than those under other treatments. The Jc value found under the T1 treatment was significantly lower than that found under the T59 treatment, whereas the Jo value exhibited an opposite trend. No significant differences in the PhiPSII values were observed among the leaves of potato plants under different treatments.
During the tuber growth stage, leaf Fv/Fm and PhiPSII showed no significant differences among treatments. However, ETR under the T81 treatment was significantly higher than others. Concurrently, Jc and Jo values under the T1 treatment were significantly lower than other treatments, with no significant difference in Jc between T59 and T81 (Table 4).

3.2.6. Light Response Curve at Tuber Formation Stage

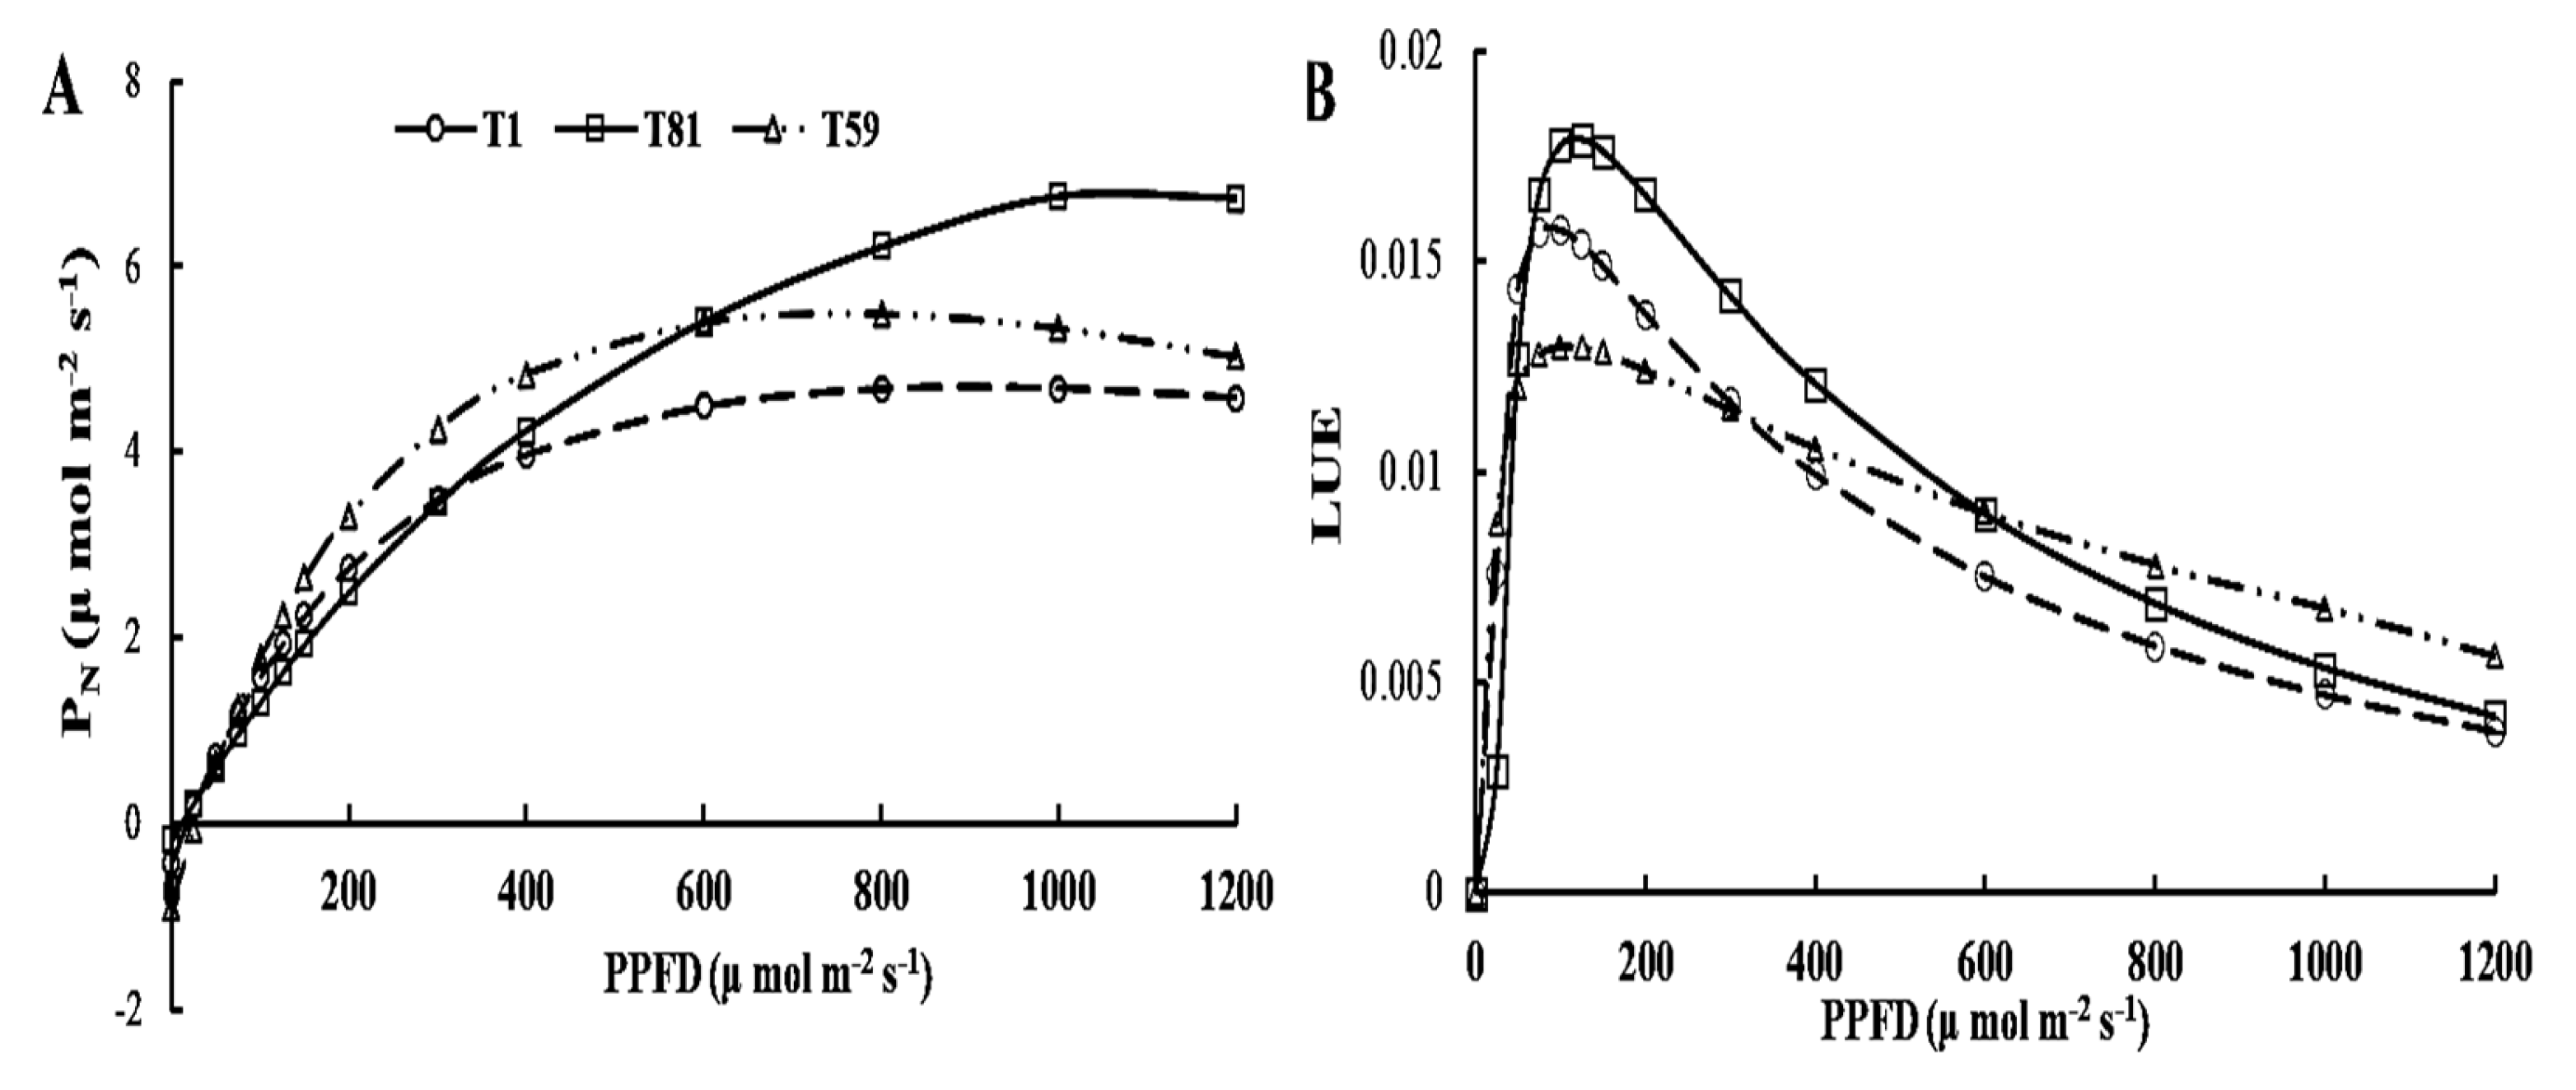
Under the T1 and T59 treatments, the light response curves of the plants exhibited an inflection point at a light intensity of 800 μmol m−2 s−1, whereas under the T81 treatment, the PN of the plant leaves still showed an increasing trend (Figure 8A). Within the light intensity range of 0–125 μmol m−2 s−1, the LUE of potato plant leaves was similar across all treatments. When the light intensity exceeded 125 μmol m−2 s−1, the LUE of potato plant leaves gradually decreased under all treatments. Under the T81 treatment, the LUE of potato plant leaves declined more significantly but followed a similar trend to that under the T1 treatment, while the decline under the T59 treatment was relatively gradual (Figure 8B).

3.2.7. Tuber Development at Tuber Formation Stage

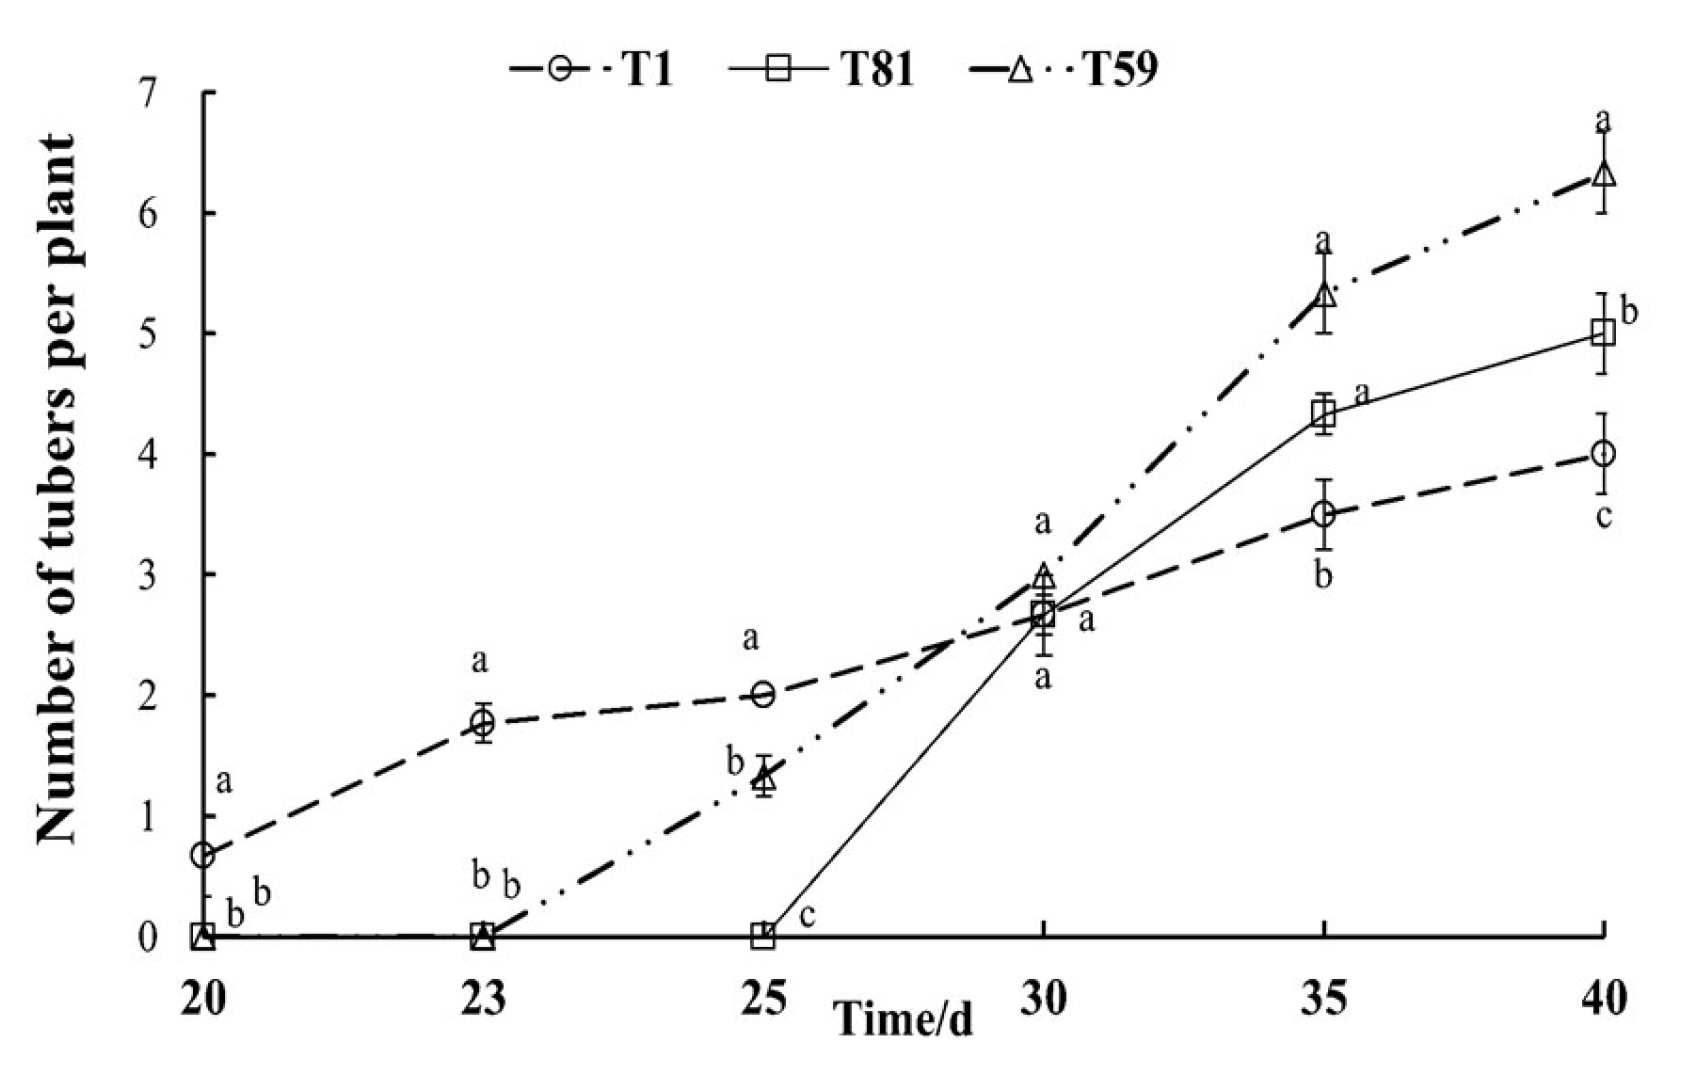
Tuber formation primarily occurred during the tuber formation stage (25–40 days) across treatments, stabilizing thereafter. T1 initiated earliest but produced fewer tubers. T81 initiated latest yet exceeded T1 in final tuber count. Crucially, T59 exhibited prolonged continuous tuber formation (from initiation to peak) during this stage, yielding significantly more tubers than the others (Figure 9).

3.3. EUE

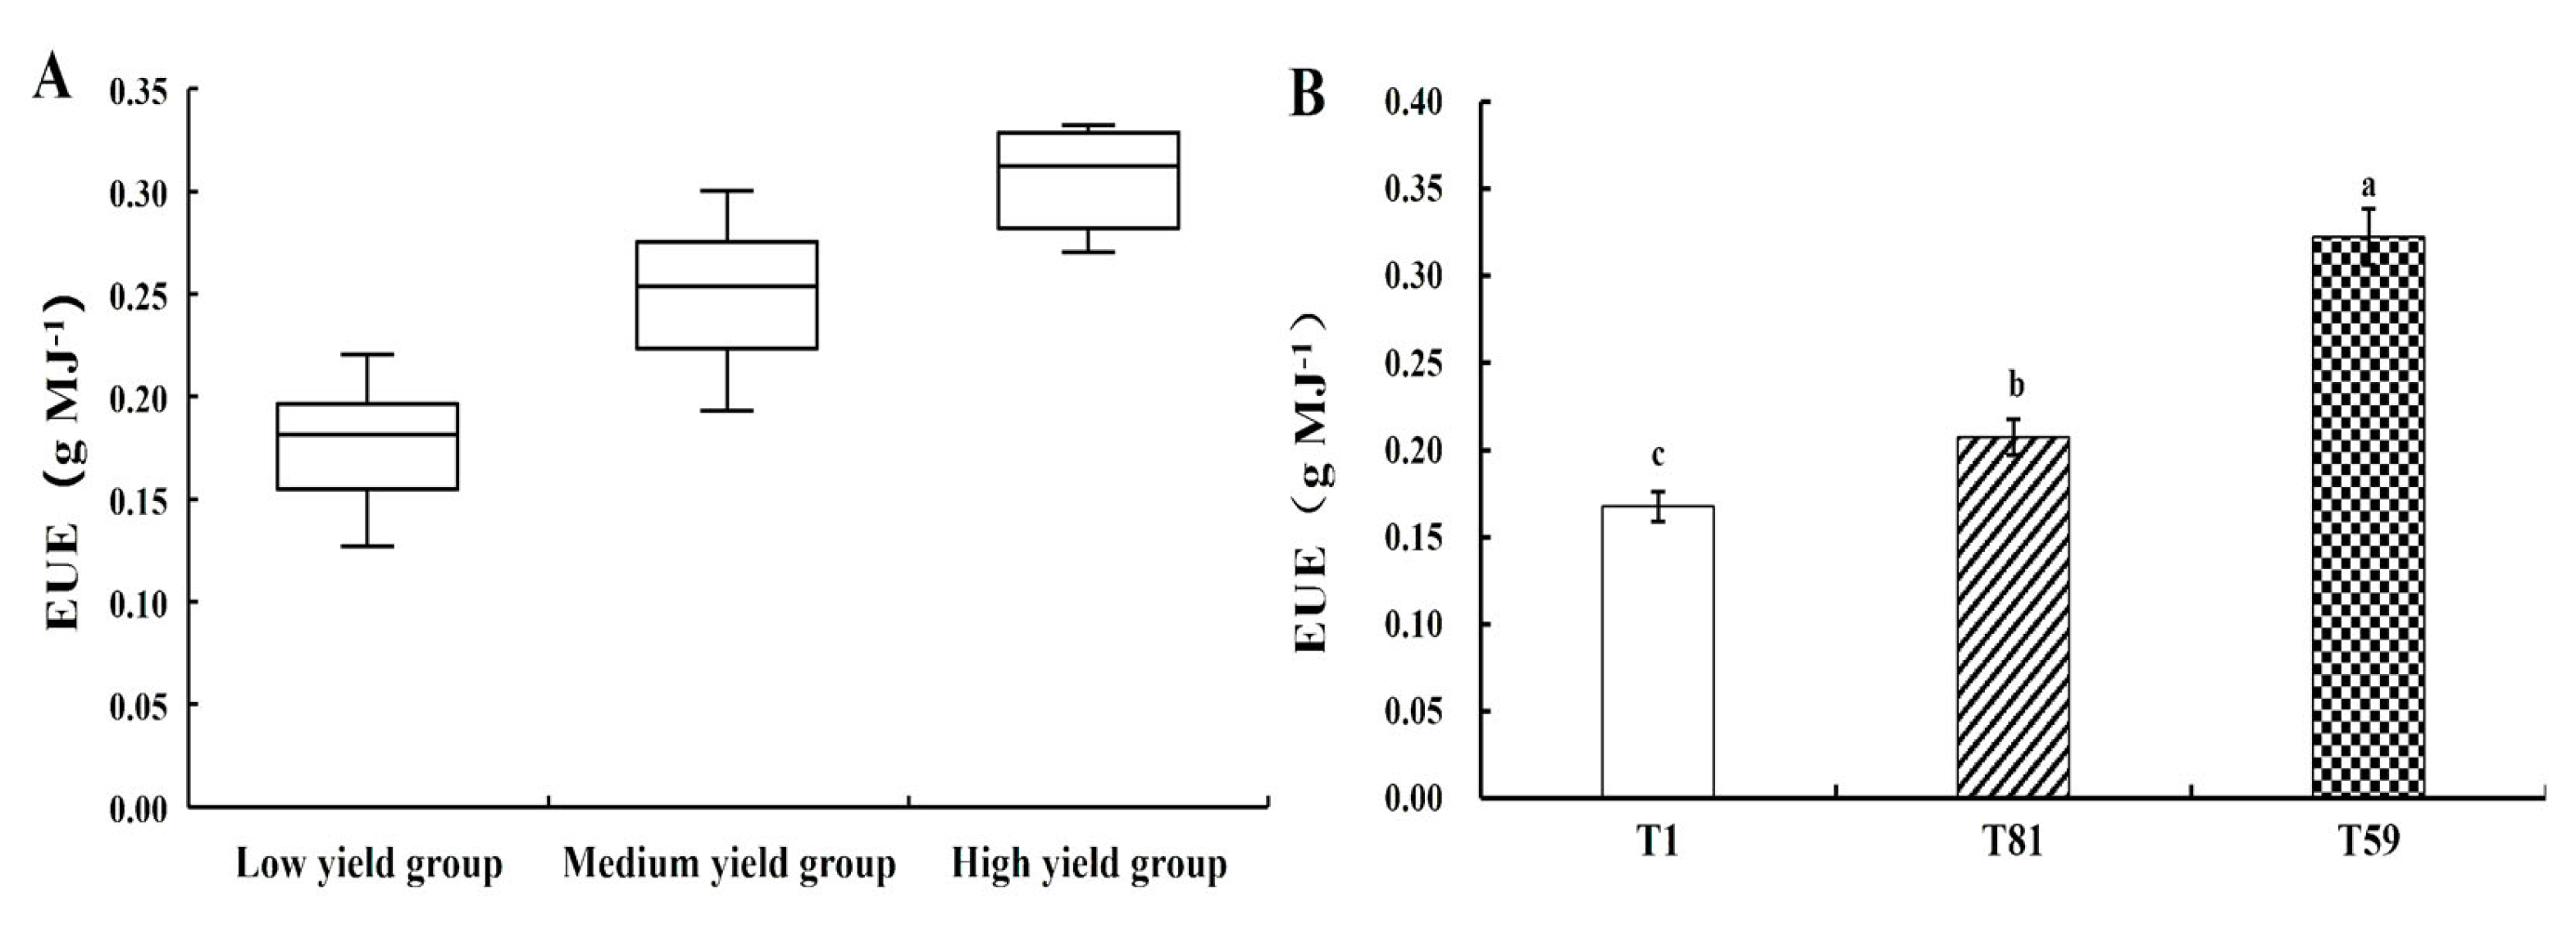
As the yield level increases, the median of EUE shows an upward trend, and the EUE value of the high yield group is higher than those of the other treatments (Figure 10A). The median EUE value of the high yield group reached 3.2 ± 0.2 g MJ−1, representing a 52% increase compared to the medium yield group (2.1 ± 0.2 g MJ−1) and an 88% increase over the low yield group (1.7 ± 0.2 g MJ−1). The T59 treatment had the highest EUE, while the T1 treatment had the lowest, with significant differences observed among the treatments (Figure 10B). Notably, the medium yield group consistently showed transitional EUE values across treatments. These findings confirm that optimizing light capture and conversion is pivotal for improving energy efficiency in plant factory potato production.

4. Discussion

4.1. Stage-Specific Light Intensity Modulation Enhances Potato Yield by Coordinating Photosynthetic Efficiency and Source-Sink Dynamics

Crop light requirements vary developmentally [28]. Matching light conditions to stage-specific growth traits maximizes potato productivity and energy efficiency. High yield groups showed significantly greater tuber weight and number (Figure 1), demonstrating profound light modulation effects on yield [29,30]. Yield formation involves agronomic traits, photosynthesis, and light environment [31,32]. Larger leaf areas in the medium and high yield groups (Figure 2) enhanced photosynthetic capacity (Figure 3), boosting photoassimilates. Consistently taller plants in the low yield groups (Figure 1) suggested elevated gibberellin (GA) [33]. While GA induced StSUT4 expression to promote sucrose transport to tubers [34] (aligning with higher tuber sucrose in low yield, Figure 3), it activated vacuolar acid invertase, accelerating sucrose degradation while restricting tuber expansion [35]. This impaired expansion reduced starch accumulation (Figure 3) and yield [36]. Thus, the “high-sugar sink status” favored tuber initiation but disrupted starch metabolism, ultimately reducing average tuber weight (Table 2) and per-plant yield in the low yield groups (Figure 1).
Car and Chl a + b content followed similar trends across all yield groups from the seedling to harvest stages (Figure 3), indicating that photosynthetic pigment dynamics are primarily governed by developmental progression [37]. During the tuber growth and harvest stages, the high yield group exhibited elevated Chl a/b ratios (Figure 3), reflecting a higher proportion of PSII core complexes (Chl a-enriched) in light-harvesting chlorophyll-protein complexes (LHCP). This enhances light energy absorption and conversion [38], consistent with the higher PN observed in high yield populations (Figure 3).
The high yield group demonstrated superior net photosynthetic rate, sucrose, and starch accumulation [39,40,41], indicating robust photosynthetic and assimilate production capacity. Medium yield groups showed intermediate parameter values, while low yield groups underperformed across metrics, suggesting optimized photosynthesis and carbohydrate metabolism are pivotal for yield enhancement. Pearson analysis revealed a significant negative correlation between tuber number and average tuber weight (Table 2), implying increased tuber numbers in high yield conditions may come at the cost of individual tuber size [42]. Notably, light intensity during tuber initiation negatively correlated with tuber number in high yield groups (Table 2), indicating moderate light (e.g., 200 μmol·m−2·s−1) at this stage prevents premature sink competition to promote tuber formation. These findings provide direct evidence for a “stage-specific precision lighting” strategy, addressing previous confounding of light intensity and photoperiod effects [1].

4.2. Precision Regulation of Light Intensity on the Mechanism of Potato Tuber Formation

This study provides comprehensive insights into how light intensity affects potato plant growth, yield formation, and photosynthetic performance across developmental stages through analysis of typical yield groups. We elucidate key physiological mechanisms, particularly carbon metabolism, to advance theoretical frameworks for light-regulated potato pre-basic seed production in plant factories.
Pearson analysis confirms that light intensity significantly impacts tuber development and yield during the initiation and growth stages (Table 2) [43]. The T1 treatment showed reduced plant and tuber biomass allocation from growth to harvest (Figure 4), limiting the carbon supply for tuber expansion and reducing the tuber number, average weight, and yield per plant (Table 3) [44,45]. The higher small tuber ratio and lower average weight under T1 and T59 versus T81 support our hypothesis that an increased tuber count may reduce individual tuber size [46,47].
During tuber initiation, identical light intensity the in T1/T59 treatments (lower than T81) resulted in higher PN for T81 (Figure 5). However, its lower δ13C (Figure 6) suggests photorespiration suppression under high light [1]. Elevated Rubisco in T81 (Figure 7) with reduced carboxylation efficiency, coupled with restricted stomatal conductance (GS, T1, T81, T59 were 0.063, 0.059, 0.070 mol m−2 s−1, respectively) may explain the PN13C paradox. High light increased the PN, ETR, and electron fluxes (Figure 5, Table 4), but only 41.63% of electrons fixed carbon, while 58.36% fueled photorespiration (Table 4), reducing net assimilation (Figure 4) and aligning with reduced LUE under T81 (Figure 8).
Tuber formation timing, duration, and efficiency collectively determine yield [1]. Higher StSP6A in T1 (Figure 7) enabled earlier initiation (Figure 9), yet limited carbon allocation to sinks (7.47%, Figure 6) restricted sustained growth. Though T81 initiated later with a shorter duration, its higher efficiency (the tuber formation efficiencies were 0.2, 0.5, and 0.35 tubers per day, respectively) suggests that light intensity drives strategic divergence—low light (T1 and T59) favors early initiation, while high light (T81) enhances efficiency. Reduced sucrose in T81 tubers (Figure 5) implies impaired translocation, inhibiting the transport of floral integrators (CONSTANS/FLOWERING LOCUS T) [48] and tuber expansion. T59’s 50% light reduction (non-stress per Fv/Fm) boosted sucrose accumulation and LFY expression [48], accelerating tuber formation. Low sucrose inhibits initiation [49]; T81’s deficient photosynthate and sucrose translocation (Figure 5) delayed sink sucrose accumulation, postponing formation (Figure 9). T59 matched T1’s StSP6A levels (Figure 7) but excelled in carbon fixation and allocation (Figure 6), explaining its superior tuber count and duration [50]. Higher tuber AGPase activity in T59 (Figure 7) indicates enhanced starch metabolism, whereas T1’s high sucrose but low starch metabolism (Figure 7) favored early yet unsustainable formation, consistent with developmental patterns (Figure 9) [51].
In the growth stage, sucrose declined in all treatments, steeply in T1/T81 (Figure 5), indicating reduced photosynthetic capacity [52]. The T81 treatment’s high Jo/Jc ratio was 1.40 (T1 and T59 were 0.94 and 0.78, respectively) shows excessive photorespiration, impairing light use. These findings validate “stage-specific precision light supplementation” strategies.

4.3. Energy Efficiency Analysis

High energy consumption constitutes a critical bottleneck restricting plant factory development [53]. For potato pre-basic seed production, balancing the tuber yield–energy consumption trade-off is essential to enhance energy efficiency and foster sustainable industry growth [54]. We demonstrated that static lighting regimes exhibit inherent limitations: prolonged low intensity compromises yield potential despite reduced energy use, whereas sustained high intensity diminishes LUE (Figure 8) and overall EUE (Figure 10), while accelerating fixture degradation and elevating operational costs [55].
Leveraging phase-specific responses to light intensity, our T59 lighting protocol delivers a breakthrough solution—simultaneously achieving triple objectives: 167% higher tuber yield versus controls, 36–71% energy savings, and peak breeding efficiency (3.2 g MJ−1 EUE). This strategy establishes a high yield, low-carbon paradigm for industrial-scale pre-basic seed production in plant factories.

5. Conclusions

This study underscores the critical role of stage-specific light intensity modulation in optimizing potato yield and EUE within plant factories. By analyzing yield groups and physiological responses across developmental stages, we demonstrated that dynamic light adjustment—particularly during the tuber initiation and growth phases—enhances photosynthetic efficiency, coordinates source-sink dynamics, and improves carbohydrate metabolism. High yield groups exhibited superior leaf area development, chlorophyll a/b ratios, and net photosynthetic rates, which collectively boosted sucrose and starch accumulation. However, excessive light intensity during tuber formation increased photorespiration, reduced carboxylation efficiency, and impaired LUE, highlighting the need for balanced light management. Notably, the T59 (the light intensity was set to 400, 200, 300, and 300 μmol m−2·s−1 for the seedling stage, tuber formation stage, tuber growth stage, and harvest stage, respectively) light protocol emerged as optimal, achieving high yield while minimizing energy consumption by avoiding the pitfalls of sustained low or high light regimes.
Our findings validate a “stage-specific precision lighting” strategy, which provides a theoretical and practical framework for advancing sustainable, energy-efficient potato pre-basic seed production in controlled environments.

Author Contributions

Conceptualization, Investigation, Methodology, Data curation, Writing—original draft, Formal analysis, S.C.; Conceptualization, Investigation, Methodology, Writing—review, editing, Visualization, J.L.; Conceptualization, Writing—review and editing, Supervision, Funding acquisition, Project administration, Resources, Z.X. All authors have read and agreed to the published version of the manuscript.

Funding

This research was supported by the National Natural Science Foundation of China (NSFC), grant number 11674174.

Data Availability Statement

The original contributions presented in this study are included in the article, further inquiries can be directed to the corresponding author.

Conflicts of Interest

Author Jiating Lin was employed by the company Guangdong Jieyang Agricultural Reclamation Group Co., Ltd. The remaining authors declare that the research was conducted in the absence of any commercial or financial relationships that could be construed as a potential conflict of interest.

Appendix A

The measurement details regarding SPS, AGPase, StSP6A, and Rubisco
  • Enzyme Extraction.
Fresh tuber (~1 g) and leaf (~0.5 g) tissues were homogenized in an ice-cold extraction buffer at a 1:8 (w/v) ratio. The buffer consisted of 50 mM HEPES-NaOH (pH 7.5), 10 mM MgCl2, 2.5 mM DTT, 1.0 mM EDTA, 0.05% (v/v) Triton X-100, 0.1% (w/v) BSA, 0.1% β-mercaptoethanol, and 2% (w/v) soluble PVPP. The homogenate was centrifuged at 12,000× g for 15 min at 4 °C. The crude supernatant was dialyzed against 25 mM HEPES-NaOH (pH 7.5) containing 0.25 mM EDTA-Na2 for 16 h. The insoluble pellet was re-homogenized twice with 10 mL extraction buffer and resuspended in 3 mL of 50 mM HEPES-NaOH (pH 7.5) supplemented with 0.5 mM EDTA-Na2. All procedures were conducted at 0–4 °C.
  • Sucrose Phosphate Synthase (SPS) Activity Assay.
A 55 μL reaction mixture containing 0.5 M HEPES-NaOH (pH 7.5), 140 mM MgCl2, 28 mM EDTA-Na2, 112 mM fructose-6-phosphate (F-6-P), and 42 mM UDP-glucose was incubated with 85 μL crude enzyme extract at 37 °C for 40 min. Reactions were terminated by adding 70 μL of 1.0 M NaOH. To degrade unreacted F-6-P, samples were heated at 100 °C for 10 min. After cooling, 0.25 mL of 0.1% (w/v) resorcinol (in 95% ethanol) and 0.75 mL of 35% (v/v) HCl were added, followed by incubation at 80 °C for 8 min. Absorbance was measured at 520 nm. Enzyme activity was expressed as μg sucrose produced per minute per gram fresh weight (μg g−1 min−1 FW).
  • ADP-glucose pyrophosphorylase (AGPase) Activity Assay.
AGPase (ADP-glucose pyrophosphorylase, EC 2.7.7.27) activity was assessed utilizing an AGPase assay kit (F7895-B, ELISA, Jiangsu Feiya Technology Co., Ltd. Nantong, Jiangsu, China), and the experimental procedures were strictly carried out in compliance with the manufacturer’s guidelines.
  • Rubisco Activity Assay.
The ratio of Rubisco content per unit leaf area (g·m−2) to the photosynthetic electron transport rate per unit leaf area (ETR) in leaves grown under low light intensity, denoted as Rubisco/ETR, is 0.011. In contrast, the average Rubisco/ETR ratio for leaves grown under high light intensity is 0.014. Based on the measured ETR values of the leaves, the Rubisco content can be calculated.
  • StSP6A relative expression Assay.
StSP6A relative expression was quantified using a Plant Florigen ELISA Kit (Agrisera AS16 4618, Agrisera, Vännäs, Sweden) with modifications. Fresh potato leaves (100 mg) were homogenized in ice-cold buffer (50 mM Tris-HCl pH 7.5, 150 mM NaCl, 1% PVPP, protease inhibitors), centrifuged (12,000× g, 15 min, 4 °C), and supernatants filtered (0.22-μm PVDF). After Bradford quantification, samples diluted 1:5 in PBS and standards (0–50 ng/mL recombinant StSP6A) were analyzed in triplicate: coating (50 μL/well, 4 °C, 16 h)→blocking (3% BSA-PBS, 37 °C, 2 h)→primary antibody (1:1500 anti-StSP6A, 1.5 h)→HRP-secondary antibody (1:5000, 1 h)→TMB substrate (15 min dark)→2M H2SO4 stop. OD450 was measured (SpectraMax i3x), the value of relative expression was ratio StSP6A sample and StSP6A control.

References

  1. Chen, S.; Wang, D.; Lin, J.; Xu, Z. The Comprehensive Regulation of Light Intensity and Photoperiod on Growth and Yield of Virus-Free Potato Under the Same Daily Light Integral. Agronomy 2025, 15, 898. [Google Scholar] [CrossRef]
  2. Abelenda, J.A.; Cruz-Oró, E.; Franco-Zorrilla, J.M.; Prat, S. Potato StCONSTANS-like1 suppresses storage organ formation by directly activating the FT-like StSP5G repressor. Curr. Biol. 2016, 26, 872–881. [Google Scholar] [CrossRef] [PubMed]
  3. Navarro, C.; Abelenda, J.A.; Cruz-Oró, E.; Cuéllar, C.A.; Tamaki, S.; Silva, J.; Shimamoto, K.; Prat, S. Control of flowering and storage organ formation in potato by FLOWERING LOCUS T. Nature 2011, 478, 119–122. [Google Scholar] [CrossRef] [PubMed]
  4. He, W.; Pu, M.; Li, J.; Xu, Z.G.; Gan, L. Potato Tuber Growth and Yield Under Red and Blue LEDs in Plant Factories. J. Plant Growth Regul. 2021, 41, 40–51. [Google Scholar] [CrossRef]
  5. Xie, X.; Cheng, H.; Hou, C.; Ren, M. Integration of Light and Auxin Signaling in Shade Plants: From Mechanisms to Opportunities in Urban Agriculture. Int. J. Mol. Sci. 2022, 23, 3422. [Google Scholar] [CrossRef]
  6. Ma, L.; Li, G. Auxin-Dependent Cell Elongation During the Shade Avoidance Response. Front. Plant Sci. 2019, 10, 914. [Google Scholar] [CrossRef]
  7. Guo, X.; Wang, D.; Shakeel, M. Transcriptome analysis reveals light-induced anthocyanin synthesis candidate genes in rabbiteye blueberry (Vaccinium ashei: Reade). Biotechnol. Biotechnol. Equip. 2021, 35, 746–757. [Google Scholar] [CrossRef]
  8. Miki, S.; Wada, K.C.; Takeno, K. A possible role of an anthocyanin filter in low-intensity light stress-induced flowering in Perilla frutescens var. crispa. J. Plant Physiol. 2015, 175, 157–162. [Google Scholar] [CrossRef]
  9. Kaiser, E.; Morales, A.; Harbinson, J.; Heuvelink, E.; Prinzenberg, A.E.; Marcelis, L.F. Metabolic and diffusional limitations of photosynthesis in fluctuating irradiance in Arabidopsis thaliana. Sci. Rep. 2016, 6, 31252. [Google Scholar] [CrossRef]
  10. Yang, F.; Feng, L.; Liu, Q.; Wu, X.; Fan, Y.; Raza, M.A.; Cheng, Y.; Chen, J.; Wang, X.; Yong, T.; et al. Effect of Interactions between Light Intensity and Red-to- Far-Red Ratio on the Photosynthesis of Soybean Leaves under Shade Condition. Environ. Exp. Bot. 2018, 150, 79–87. [Google Scholar] [CrossRef]
  11. Sekhar, S.; Panda, D.; Kumar, J.; Mohanty, N.; Biswal, M.; Baig, M.J.; Kumar, A.; Umakanta, N.; Samantaray, S.; Pradhan, S.K.; et al. Comparative Transcriptome Profiling of Low Light Tolerant and Sensitive Rice Varieties Induced by Low Light Stress at Active Tillering Stage. Sci. Rep. 2019, 9, 5753. [Google Scholar] [CrossRef]
  12. Ouzounis, T.; Rosenqvist, E.; Ottosen, C. Spectral effects of artiffcial light on plant physiology and secondary metabolism: A review. HortScience 2015, 50, 1128–1135. [Google Scholar] [CrossRef]
  13. d’aquino, L.; Cozzolino, R.; Malorni, L.; Bodhuin, T.; Gambale, E.; Sighicelli, M.; Della Mura, B.; Matarazzo, C.; Piacente, S.; Montoro, P.; et al. Light Flux Density and Photoperiod Affect Growth and Secondary Metabolism in Fully Expanded Basil Plants. Foods 2024, 13, 2273. [Google Scholar] [CrossRef] [PubMed]
  14. An, X.; Tan, T.; Zhang, X.; Guo, X.; Zhu, Y.; Song, Z.; Wang, D. Effects of Light Intensity on Endogenous Hormones and Key Enzyme Activities of Anthocyanin Synthesis in Blueberry Leaves. Horticulturae 2023, 9, 618. [Google Scholar] [CrossRef]
  15. Yamori, W.; Sakata, N.; Suzuki, Y.; Shikanai, T.; Makino, A. Cyclic Electron Flow around Photosystem I via Chloroplast NAD(P)H Dehydrogenase (NDH) Complex Performs a Significant Physiological Role during Photosynthesis and Plant Growth at Low Temperature in Rice. Plant J. 2011, 68, 966–976. [Google Scholar] [CrossRef]
  16. Yamori, W.; Nagai, T.; Makino, A. The Rate-Limiting Step for CO2 Assimilation at Different Temperatures Is Influenced by the Leaf Nitrogen Content in Several C3 Crop Species. Plant Cell Environ. 2011, 34, 764–777. [Google Scholar] [CrossRef]
  17. Poorter, H.; Niinemets, Ü.; Ntagkas, N.; Siebenkäs, A.; Mäenpää, M.; Matsubara, S.; Pons, T.L. A Meta-Analysis of Plant Responses to Light Intensity for 70 Traits Ranging from Molecules to Whole Plant Performance. New Phytol. 2019, 223, 1073–1105. [Google Scholar] [CrossRef]
  18. Ntagkas, N.; Woltering, E.J.; Marcelis, L.F.M. Light Regulates Ascorbate in Plants: An Integrated View on Physiology and Biochemistry. Environ. Exp. Bot. 2018, 147, 271–280. [Google Scholar] [CrossRef]
  19. Song, J.; Huang, H.; Hao, Y.; Song, S.; Zhang, Y.; Su, W.; Liu, H. Nutritional Quality, Mineral and Antioxidant Content in Lettuce Affected by Interaction of Light Intensity and Nutrient Solution Concentration. Sci. Rep. 2020, 10, 2796. [Google Scholar] [CrossRef]
  20. Zhou, J.; Li, P.; Wang, J. Effects of Light Intensity and Temperature on the Photosynthesis Characteristics and Yield of Lettuce. Horticulturae 2022, 8, 178. [Google Scholar] [CrossRef]
  21. Chen, Y.; Liu, J.; Liu, W. LED Red and Blue Light Intensity Affected Productivity and Nitrogen Metabolisms of Ryegrass. J. Plant Nutr. 2023, 47, 705–717. [Google Scholar] [CrossRef]
  22. Lee, R.J.; Bhandari, S.R.; Lee, G.; Lee, J.G. Optimization of Temperature and Light, and Cultivar Selection for the Production of High-Quality Head Lettuce in a Closed-Type Plant Factory. Hortic. Environ. Biotechnol. 2019, 60, 207–216. [Google Scholar] [CrossRef]
  23. Rahman, M.; Vasiliev, M.; Alameh, K. LED Illumination Spectrum Manipulation for Increasing the Yield of Sweet Basil (Ocimum basilicum L.). Plants 2021, 10, 344. [Google Scholar] [CrossRef]
  24. Fan, X.; Zang, J.; Xu, Z.; Guo, S.; Jiao, X.; Liu, X.; Gao, Y. Effects of different light quality on growth, chlorophyll concentration and chlorophyll biosynthesis precursors of non-heading Chinese cabbage (Brassica campestris L.). Acta Physiol. Plant. 2013, 35, 2721–2726. [Google Scholar] [CrossRef]
  25. Ye, Z.; Suggett, D.J.; Robakowski, P.; Kang, H. A mechanistic model for the photosynthesis–light response based on the photosynthetic electron transport of photosystem II in C3 and C4 species. New Phytol. 2013, 199, 110–120. [Google Scholar] [CrossRef]
  26. He, W.; Miao, C.; You, J.; Gan, L.; Xu, Z.-G. Effects of Red and Blue Light with Supplemental White Light on Growth, Carbohydrate Metabolism, and Yield of Virus-Free Potato in Plant Factories. Am. J. Potato Res. 2020, 97, 554–564. [Google Scholar] [CrossRef]
  27. Cai, X.A.; Sun, G.C.; Zhao, P. High nitrogen and low light intensity limit photosynthetic energy utilization in successional tree species of south subtropical forests. Sci. China Ser. C Life Sci. 2008, 51, 464–474. [Google Scholar] [CrossRef]
  28. Alan, M.J. Using light to improve commercial value. Hortic. Res. 2018, 5, 47. [Google Scholar] [CrossRef]
  29. Zhang, H.; Xiong, X.; Guo, K.; Zheng, M.; Cao, T.; Yang, Y.; Song, J.; Cen, J.; Zhang, J.; Jiang, Y.; et al. A rapid aureochrome opto-switch enables diatom acclimation to dynamic light. Nat. Commun. 2024, 15, 5578. [Google Scholar] [CrossRef] [PubMed]
  30. Nestby, R.; Trandem, N. LED light in primocane raspberries grown in polytunnel at high latitudes. Acta Hortic. 2016, 1117, 149–156. [Google Scholar] [CrossRef]
  31. Ma, B.; Zhang, L.; He, Z. Understanding the regulation of cereal grain filling: The way forward. J. Integr. Plant Biol. 2023, 65, 526–547. [Google Scholar] [CrossRef] [PubMed]
  32. Wu, A.; Hammer, G.L.; Doherty, A.; von Caemmerer, S.; Farquhar, G.D. Quantifying impacts of enhancing photosynthesis on crop yield. Nat. Plants 2019, 5, 380–388. [Google Scholar] [CrossRef] [PubMed]
  33. Wang, X.; Zheng, K.; Na, T.; Ye, G.; Han, S.; Wang, J. Transcriptomic profiles reveal hormonal regulation of sugar-induced stolon initiation in potato. Sci. Rep. 2025, 15, 19122. [Google Scholar] [CrossRef] [PubMed]
  34. Chincinska, I.A.; Liesche, J.; Krügel, U.; Michalska, J.; Geigenberger, P.; Grimm, B.; Kühn, C. Sucrose transporter StSUT4from potato affects flowering, tuberization, and shade avoidance response. Plant Physiol. 2008, 146, 515–528. [Google Scholar] [CrossRef]
  35. Ou, Y.; Song, B.; Liu, X.; Xie, C.; Li, M.; Lin, Y. Promoter regions of potato vacuolar invertase gene in response to sugars and hormones. Plant Physiol. Biochem. 2013, 69, 9–16. [Google Scholar] [CrossRef]
  36. Kim, Y.U.; Seo, B.S.; Choi, D.H.; Ban, H.Y.; Lee, B.W. Impact of high temperatures on the marketable tuber yield and related traits of potato. Eur. J. Agron. 2017, 89, 46–52. [Google Scholar] [CrossRef]
  37. Yang, F.; Li, J.; Gan, X.; Qian, Y.; Wu, X.; Yang, Q. Assessing nutritional status of Festuca arundinacea by monitoring photosynthetic pigments from hyperspectral data. Comput. Electron. Agric. 2009, 70, 52–59. [Google Scholar] [CrossRef]
  38. Rong, L.; An, J.; Chen, X.; Wang, C.; Wu, J.; Wang, P.; Zheng, Y.; Wang, X.; Chai, X.; Li, W.; et al. LTD Coordinates Chlorophyll Biosynthesis and Light-Harvesting Chlorophyll A/B-Binding Protein Transport. Plant Cell 2025, 37, 068. [Google Scholar] [CrossRef]
  39. Xiao, X.; Duan, B.; Huang, F.; Zhi, X.; Jiang, Z.; Ma, N. Analysis of canopy light utilization efficiency in high-yielding rapeseed varieties. Sci. Rep. 2024, 14, 31243. [Google Scholar] [CrossRef]
  40. Wang, W.; Cui, W.; Xu, K.; Gao, H.; Wei, H.; Zhang, H. Effects of Early- and Late-Sowing on Starch Accumulation and Associated Enzyme Activities During Grain Filling Stage in Rice. Rice Sci. 2021, 28, 191–199. [Google Scholar] [CrossRef]
  41. Paponov, M.; Kechasov, D.; Lacek, J.; Verheul, M.J.; Paponov, I.A. Supplemental Light-Emitting Diode Inter-Lighting Increases Tomato Fruit Growth Through Enhanced Photosynthetic Light Use Efficiency and Modulated Root Activity. Front. Plant Sci. 2019, 10, 1656. [Google Scholar] [CrossRef]
  42. Stockem, J.E.; Bus, M.D.; de Vries, M.E.; Struik, P.C. Opening Eyes on Seedling Tuber Quality in Potato: Size Matters. Potato Res. 2024, 67, 1691–1715. [Google Scholar] [CrossRef]
  43. Guo, R.; Jin, Y.; Liu, J.; Yang, H.; Cheng, L.; Yu, B. Harnessing Light Quality for Potato Production: Red and Blue Light as Key Regulators of Growth and Yield. Plants 2025, 14, 1039. [Google Scholar] [CrossRef] [PubMed]
  44. Agbodjato, A.N.; Babalola, O.O. Promoting sustainable agriculture by exploiting plant growth-promoting rhizobacteria (PGPR) to improve maize and cowpea crops. PeerJ 2024, 12, e16836. [Google Scholar] [CrossRef]
  45. Edlinger, A.; Garland, G.; Hartman, K.; Banerjee, S.; Degrune, F.; García-Palacios, P.; Hallin, S.; Valzano-Held, A.; Herzog, C.; Jansa, J.; et al. Agricultural management and pesticide use reduce the functioning of beneficial plant symbionts. Nat. Ecol. Evol. 2022, 6, 1145. [Google Scholar] [CrossRef]
  46. van Dijk, L.C.; de Vries, M.E.; Lommen, W.J.; Struik, P.C. Transplanting Hybrid Potato Seedlings at Increased Densities Enhances Tuber Yield and Shifts Tuber-Size Distributions. Potato Res. 2021, 65, 307–331. [Google Scholar] [CrossRef]
  47. Aliche, E.B.; Oortwijn, M.; Theeuwen, T.P.J.M.; Bachem, C.W.B.; van Eck, H.J.; Visser, R.G.F.; van der Linden, C.G. Genetic mapping of tuber size distribution and marketable tuber yield under drought stress in potatoes. Euphytica 2019, 215, 186. [Google Scholar] [CrossRef]
  48. Lincoin, T.; Eduardo, Z. Plant Physiology; Science Press: Beijing, China, 2015; 163p. [Google Scholar]
  49. Abelenda, J.A.; Bergonzi, S.; Oortwijn, M.; Sonnewald, S.; Du, M.; Visser, R.G.; Sonnewald, U.; Bachem, C.W. Source-sink regulation is mediated by interaction of an FT homolog with a SWEET protein in potato. Curr. Biol. 2019, 29, 1178–1186. [Google Scholar] [CrossRef]
  50. Bao, X.; Zhu, Y.; Li, G.; Liu, L. Regulation of storage organ formation by long-distance tuberigen signals in potato. Hortic. Res. 2025, 12, uhae360. [Google Scholar] [CrossRef]
  51. Wang, J.Y.; Wu, S.Q. Influence of sugar metabolism on the dialogue between arbuscular mycorrhizal fungi and plants. Hortic. Adv. 2023, 1, 2. [Google Scholar] [CrossRef]
  52. Daiva, J.; Grazina, K. Influence of Different Intensities of Tillage on Physiological Characteristics and Productivity of Crop-Rotation Plants. Plants 2022, 11, 3107. [Google Scholar] [CrossRef]
  53. Taki, M.; Rohani, A.; Rahmati-Joneidabad, M. Solar thermal simulation and applications in greenhouse. Inf. Process. Agric. 2018, 5, 83–113. [Google Scholar] [CrossRef]
  54. Pannico, A.; Arouna, N.; Fusco, G.M.; Santoro, P.; Caporale, A.G.; Nicastro, R.; Pagliaro, L.; De Pascale, S.; Paradiso, R. Enhancing tuber yield and nutraceutical quality of potato by supplementing sunlight with LED red-blue light. Front. Plant Sci. 2025, 16, 1517074. [Google Scholar] [CrossRef]
  55. Kozai, T.; Niu, G. Role of the plant factory with artiffcial lighting (PFAL) in Urban Areas. In Plant Factory; Academic Press: Cambridge, MA, USA, 2016; Chapter 2; pp. 7–34. [Google Scholar]
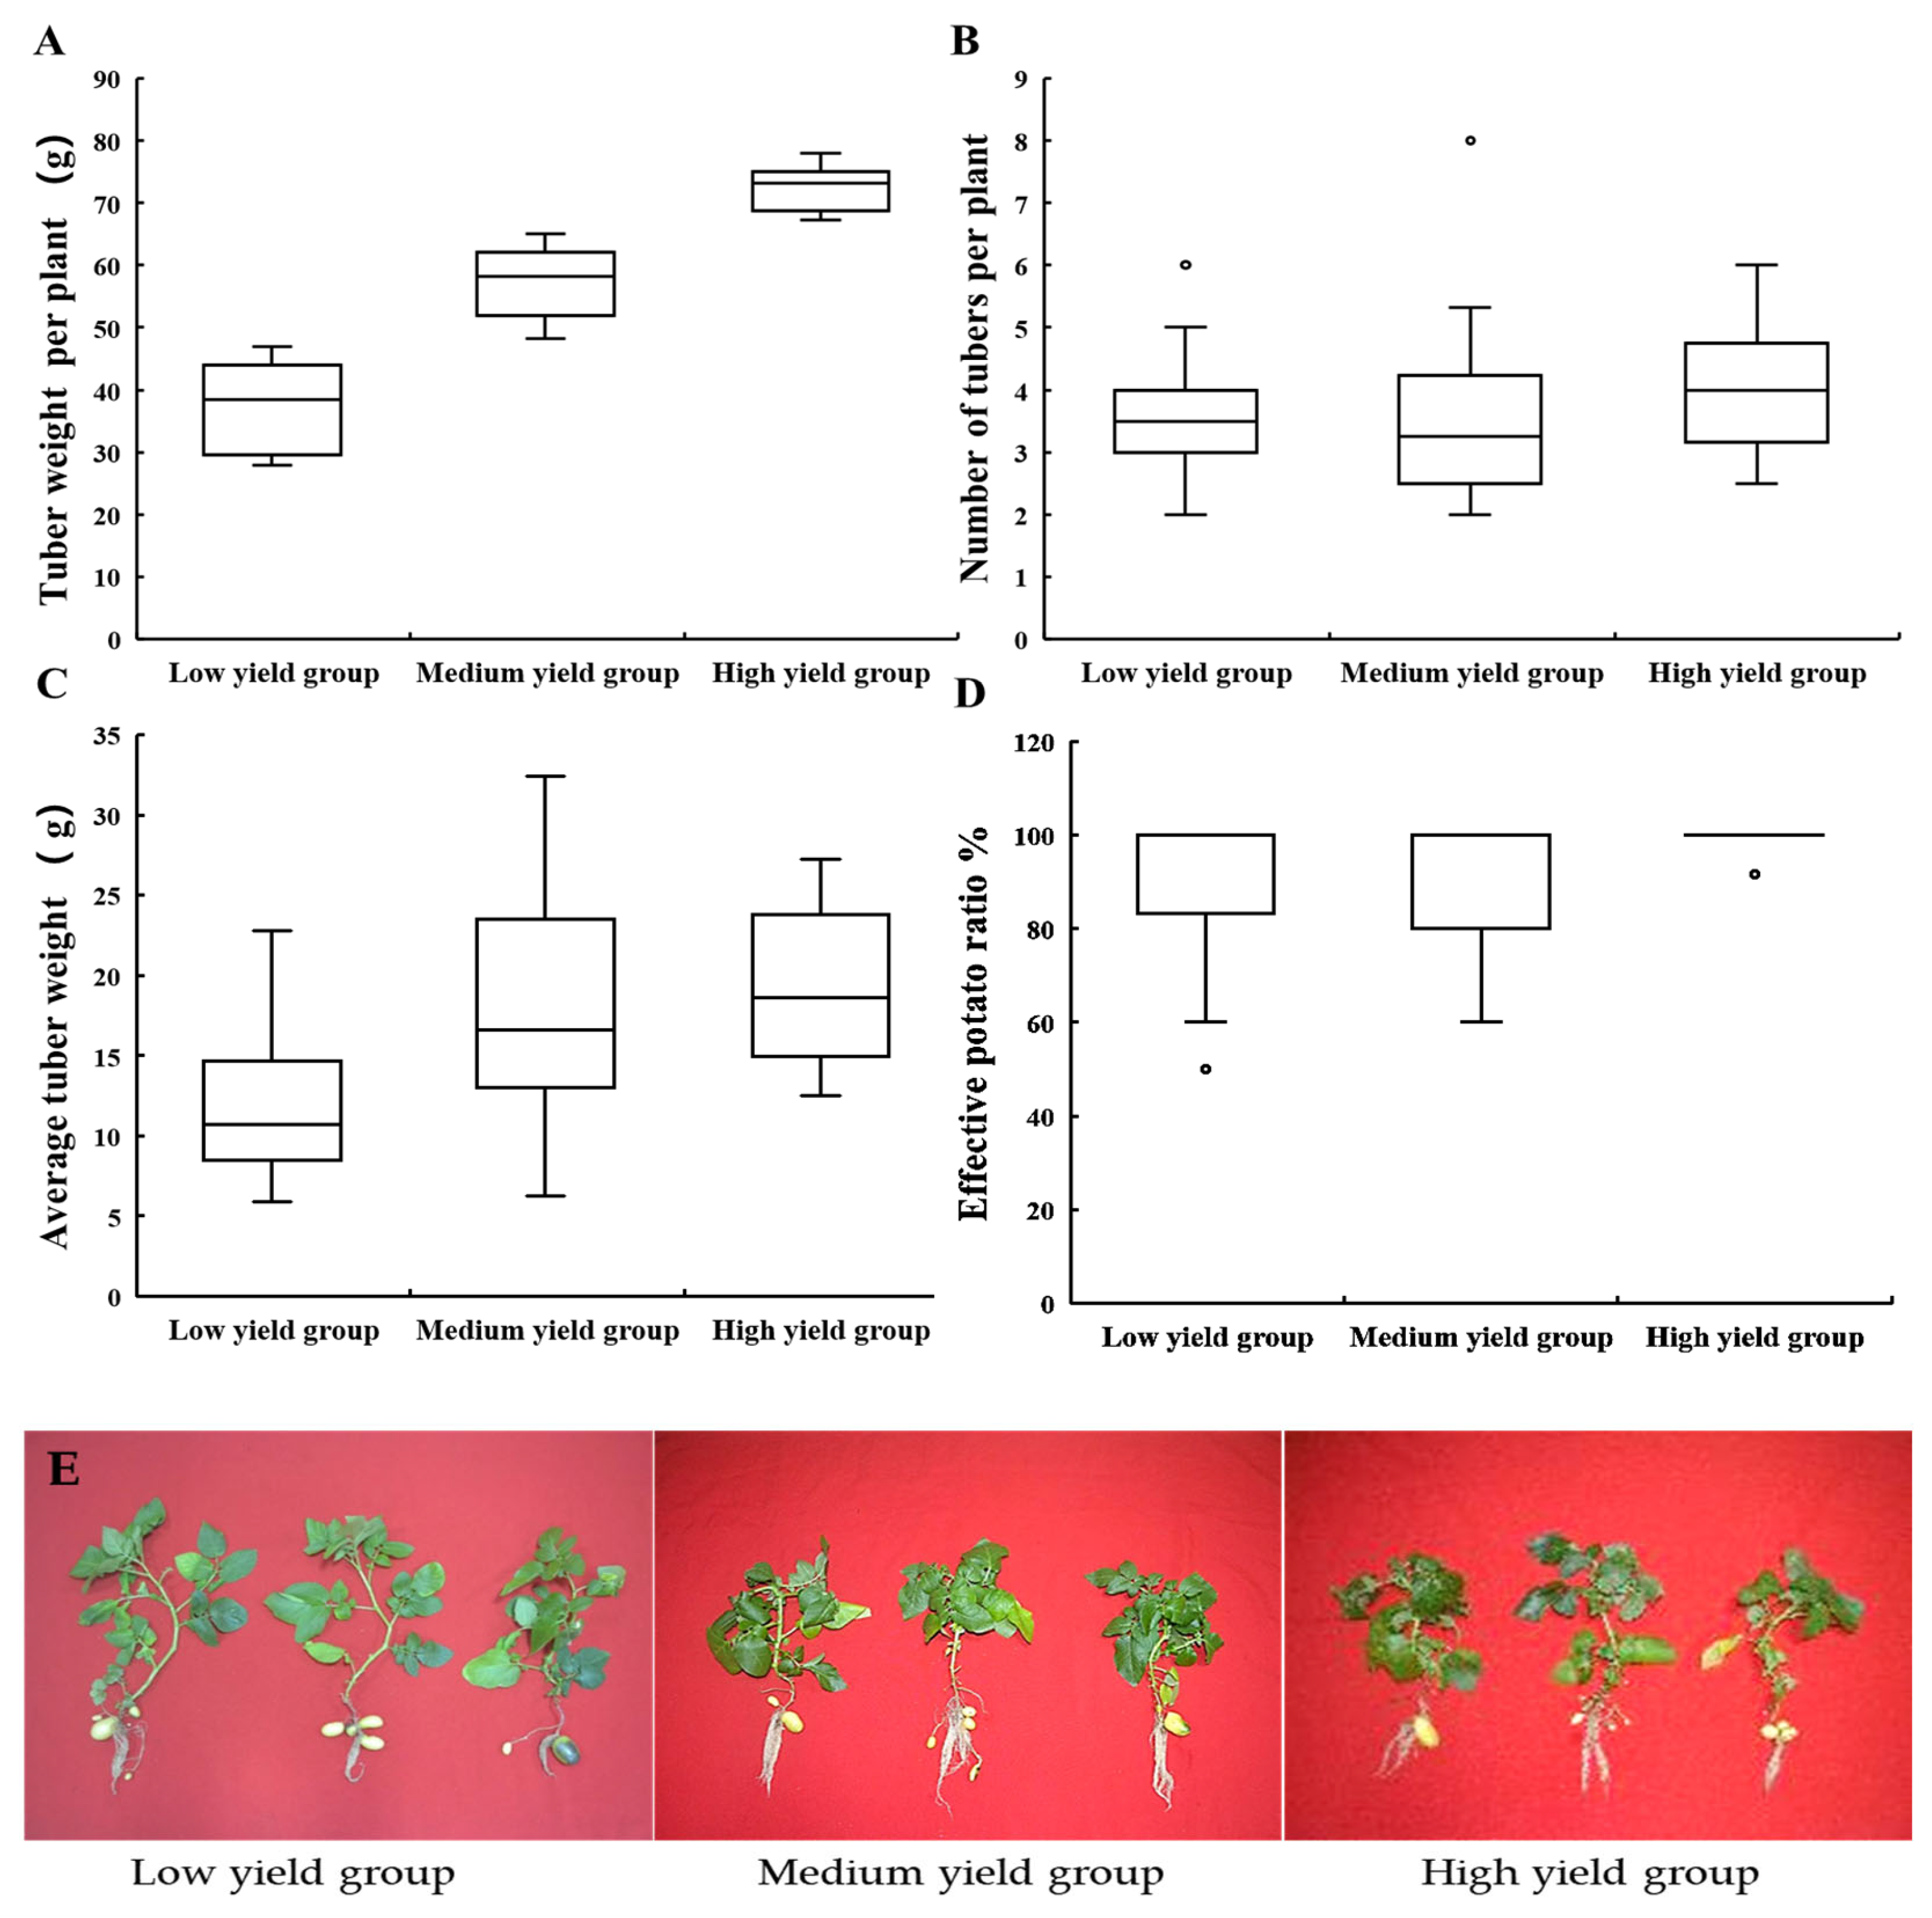
Figure 1. Box plots of tuber yield parameters across different yield levels. (A) Tuber weight per plant; (B) Number of tubers per plant; (C) Average tuber weight; (D) Effective tuber ratio. (E) Images of part potato plants at harvest stage under different yield levels. n = 3. Box plots depict median (center line), interquartile range (IQR, box boundaries), and outliers (points beyond 1.5 × IQR) as ○.
Agronomy 15 01976 g001
Figure 2. Box plots of potato growth parameters across yield groups. (A) Plant height; (B) Stem diameter; (C) Leaf number; (D) Leaf area. n = 3. Box plots depict median (center line), interquartile range (IQR, box boundaries), and outliers (points beyond 1.5 × IQR) as ○.
Agronomy 15 01976 g002
Figure 3. Box plots of photosynthetic characteristics in potato plants under different yield levels. (A) Total chlorophyll content (Chl a + b); (B) Ratio of chlorophyll a to chlorophyll b (chl a/b); (C) Net photosynthetic rate (PN); (D) Carotenoid content (Car); (E) Sucrose content in leaves; (F) Sucrose content in tubers; (G) Starch content in leaves; (H) Starch content in tubers. The lack of tuber-related data during the seedling stage was because tubers have not yet formed. n = 3. Box plots depict median (center line), interquartile range (IQR, box boundaries), and outliers (points beyond 1.5 × IQR) as ○.
Agronomy 15 01976 g003
Figure 4. Biomass (A) and biomass allocation ratio (B) of potato plants in typical treatment groups. SS, TFS, TGS, and HS represent the seedling stage, tuber formation stage, tuber growth stage, and harvest stage, respectively. Different lowercase letters indicate significant differences among groups (p < 0.05, n = 3).
Agronomy 15 01976 g004
Figure 5. Dynamics in photosynthetic characteristics of potato plants in typical treatment groups. (A) Net photosynthetic rate (PN); (B) Carboxylation efffciency (CE); (C) Sucrose content in plant; (D) Starch content in plant. SS, TFS, TGS, and HS represent the seedling stage, tuber formation stage, tuber growth stage, and harvest stage, respectively. Different lowercase letters indicate significant differences among groups (p < 0.05, n = 3).
Agronomy 15 01976 g005
Figure 6. 13C metabolism and distribution of potato plants in typical treatment groups. (A) The accumulation amount of 13C in potato plants. (BD) represent the distribution proportions of 13C within the plants under the treatments of T1, T81, and T59, respectively. Different lowercase letters indicate significant differences among groups (p < 0.05, n = 3).
Agronomy 15 01976 g006
Figure 7. Response of carbon metabolism-related enzymes and genes in the leaves (AD) and tubers (E,F) of potato plants from typical treatment groups during the tuber formation stage to light intensity. Different lowercase letters indicate significant differences among groups (p < 0.05, n = 3).
Agronomy 15 01976 g007
Figure 8. Leaf light response curve (A) and LUE (B) of potato plants in tuber formation stage in potato plants from typical treatment.
Agronomy 15 01976 g008
Figure 9. Dynamics in tuber development of potato plants in typical treatment groups. Different lowercase letters indicate significant differences among groups (p < 0.05, n = 3).
Agronomy 15 01976 g009
Figure 10. EUE at different yield levels (A) and in typical treatment groups (B). Different lowercase letters indicate significant differences among groups (p < 0.05, n = 3). Box plots depict median (center line), interquartile range (IQR, box boundaries).
Agronomy 15 01976 g010
Table 1. A full-factorial experiment on light intensity treatments.
Light Intensity
(μmol m−2 s−1)
Cluster Light Intensity
(μmol m−2 s−1)
Cluster Light Intensity
(μmol m−2 s−1)
Cluster
TreatmentSSTFSTGSHS TreatmentSSTFSTGSHS TreatmentSSTFSTGSHS
T12002002002001T283002002002002T554002002002001
T22002002003001T293002002003002T564002002003001
T32002002004001T303002002004002T574002002004001
T42002003002001T313002003002002T584002003002001
T52002003003001T323002003003002T594002003003003
T62002003004001T333002003004003T604002003004002
T72002004002001T343002004002002T614002004002002
T82002004003002T353002004003002T624002004003002
T92002004004001T363002004004002T634002004004002
T102003002002002T373003002002001T644003002002002
T112003002003002T383003002003001T654003002003001
T122003002004001T393003002004001T664003002004001
T132003003002002T403003003002001T674003003002002
T142003003003002T413003003003003T684003003003002
T152003003004002T423003003004002T694003003004002
T162003004002001T433003004002002T704003004002002
T172003004003002T443003004003001T714003004003002
T182003004004002T453003004004002T724003004004002
T192004002002002T463004002002002T734004002002002
T202004002003002T473004002003001T744004002003001
T212004002004002T483004002004003T754004002004002
T222004003002002T493004003002002T764004003002002
T232004003003001T503004003003003T774004003003001
T242004003004002T513004003004003T784004003004002
T252004004002001T523004004002003T794004004002002
T262004004003001T533004004003002T804004004003002
T272004004004003T543004004004002T814004004004002
Note: Clusters 1, 2, and 3 represent the low yield group, medium yield group, and high yield group, respectively. Treatment T59 was the typical treatment group of the high yield group; treatment T81 was the typical treatment group of the medium yield group; treatment T1 was the typical treatment group of the low yield group.
Table 2. Pearson correlation analysis between the light intensity and tuber yield related traits of potato plants. * indicates significant correlations at p < 0.05 level.
Tuber Weight of per PlantNumber of Tubers per PlantAverage Tuber Weight
Low Yield GroupMedium Yield GroupHigh Yield GroupLow Yield GroupMedium Yield GroupHigh Yield GroupLow Yield GroupMedium Yield GroupHigh Yield Group
Number of tubers per plant0.160.300.27
Average tuber weight0.38 *0.27−0.12−0.80 *−0.88 *−0.95 *
Light intensitySS0.330.120.29−0.230.200.490.42−0.11−0.28
TFS0.53 *−0.04−0.230.27−0.03−0.79 *0.040.140.68
TGS0.340.39 *−0.540.49 *0.200.20−0.27−0.19−0.42
HS−0.200.100.020.250.15−0.27−0.30−0.130.38
Table 3. Response of yield-related traits in potato plants from typical treatment groups to dynamic light intensity. Different lowercase letters indicate significant differences among groups (p < 0.05, n = 3).
Number of Tubers per PlantAverage Tuber Weight (g)Tuber Weight per Plant (g)Effective Tuber Ratio (%)Proportion of Large Tubers (%)Proportion of Small Tubers (%)
T12.83 b9.74 b27.31 c95.68 a35.34 ab64.66 ab
T814.00 b14.70 a58.15 b81.71 b50.00 a50.00 b
T596.50 a11.31 ab72.91 a98.335 a23.08 b76.92 a
Table 4. The fluorescence parameters in typical treatment groups during tuber formation stage and tuber growth stage. Different lowercase letters indicate significant differences among groups (p < 0.05, n = 3).
T1T81T59
TFSFv/Fm0.86 a0.75 b0.85 a
PhiPSII0.76 a0.77 a0.77 a
ETR64.07 b129.73 a64.52 b
Jc31.62 c54.01 a34.65 b
Jo32.44 b75.72 a29.87 c
TGSFv/Fm0.79 a0.78 a0.78 a
PhiPSII0.77 a0.78 a0.78 a
ETR64.9 c130.62 a97.99 b
Jc33.87 b56.06 a54.52 a
Jo31.03 c74.56 a43.47 b
Disclaimer/Publisher’s Note: The statements, opinions and data contained in all publications are solely those of the individual author(s) and contributor(s) and not of MDPI and/or the editor(s). MDPI and/or the editor(s) disclaim responsibility for any injury to people or property resulting from any ideas, methods, instructions or products referred to in the content.